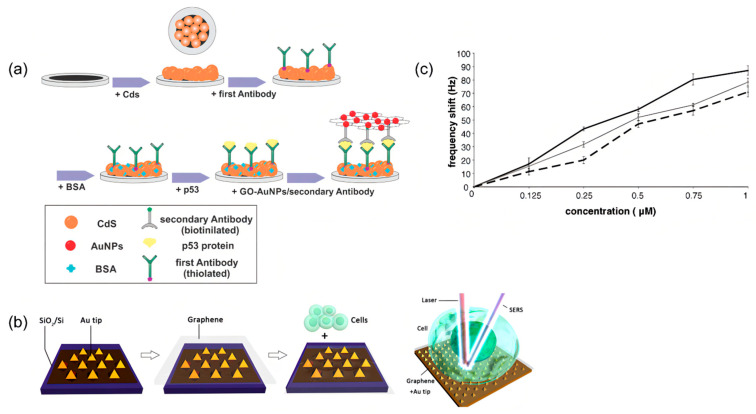
Figure 10.
(a) Schematic diagram of the ECL immunosensor based on CdS NCs and tGO-AuNPs. Reprinted with permission from [76]. (b) Schematic diagram of the Gr-Au tip platform for SERS detection, and a pattern diagram of cancer cells deposited on the Gr-Au tip platform. Reprinted with permission from [77]. (c) The relative calibration curves of different concentrations of fully complementary and mismatched oligonucleotides. Reprinted with permission from [81].

