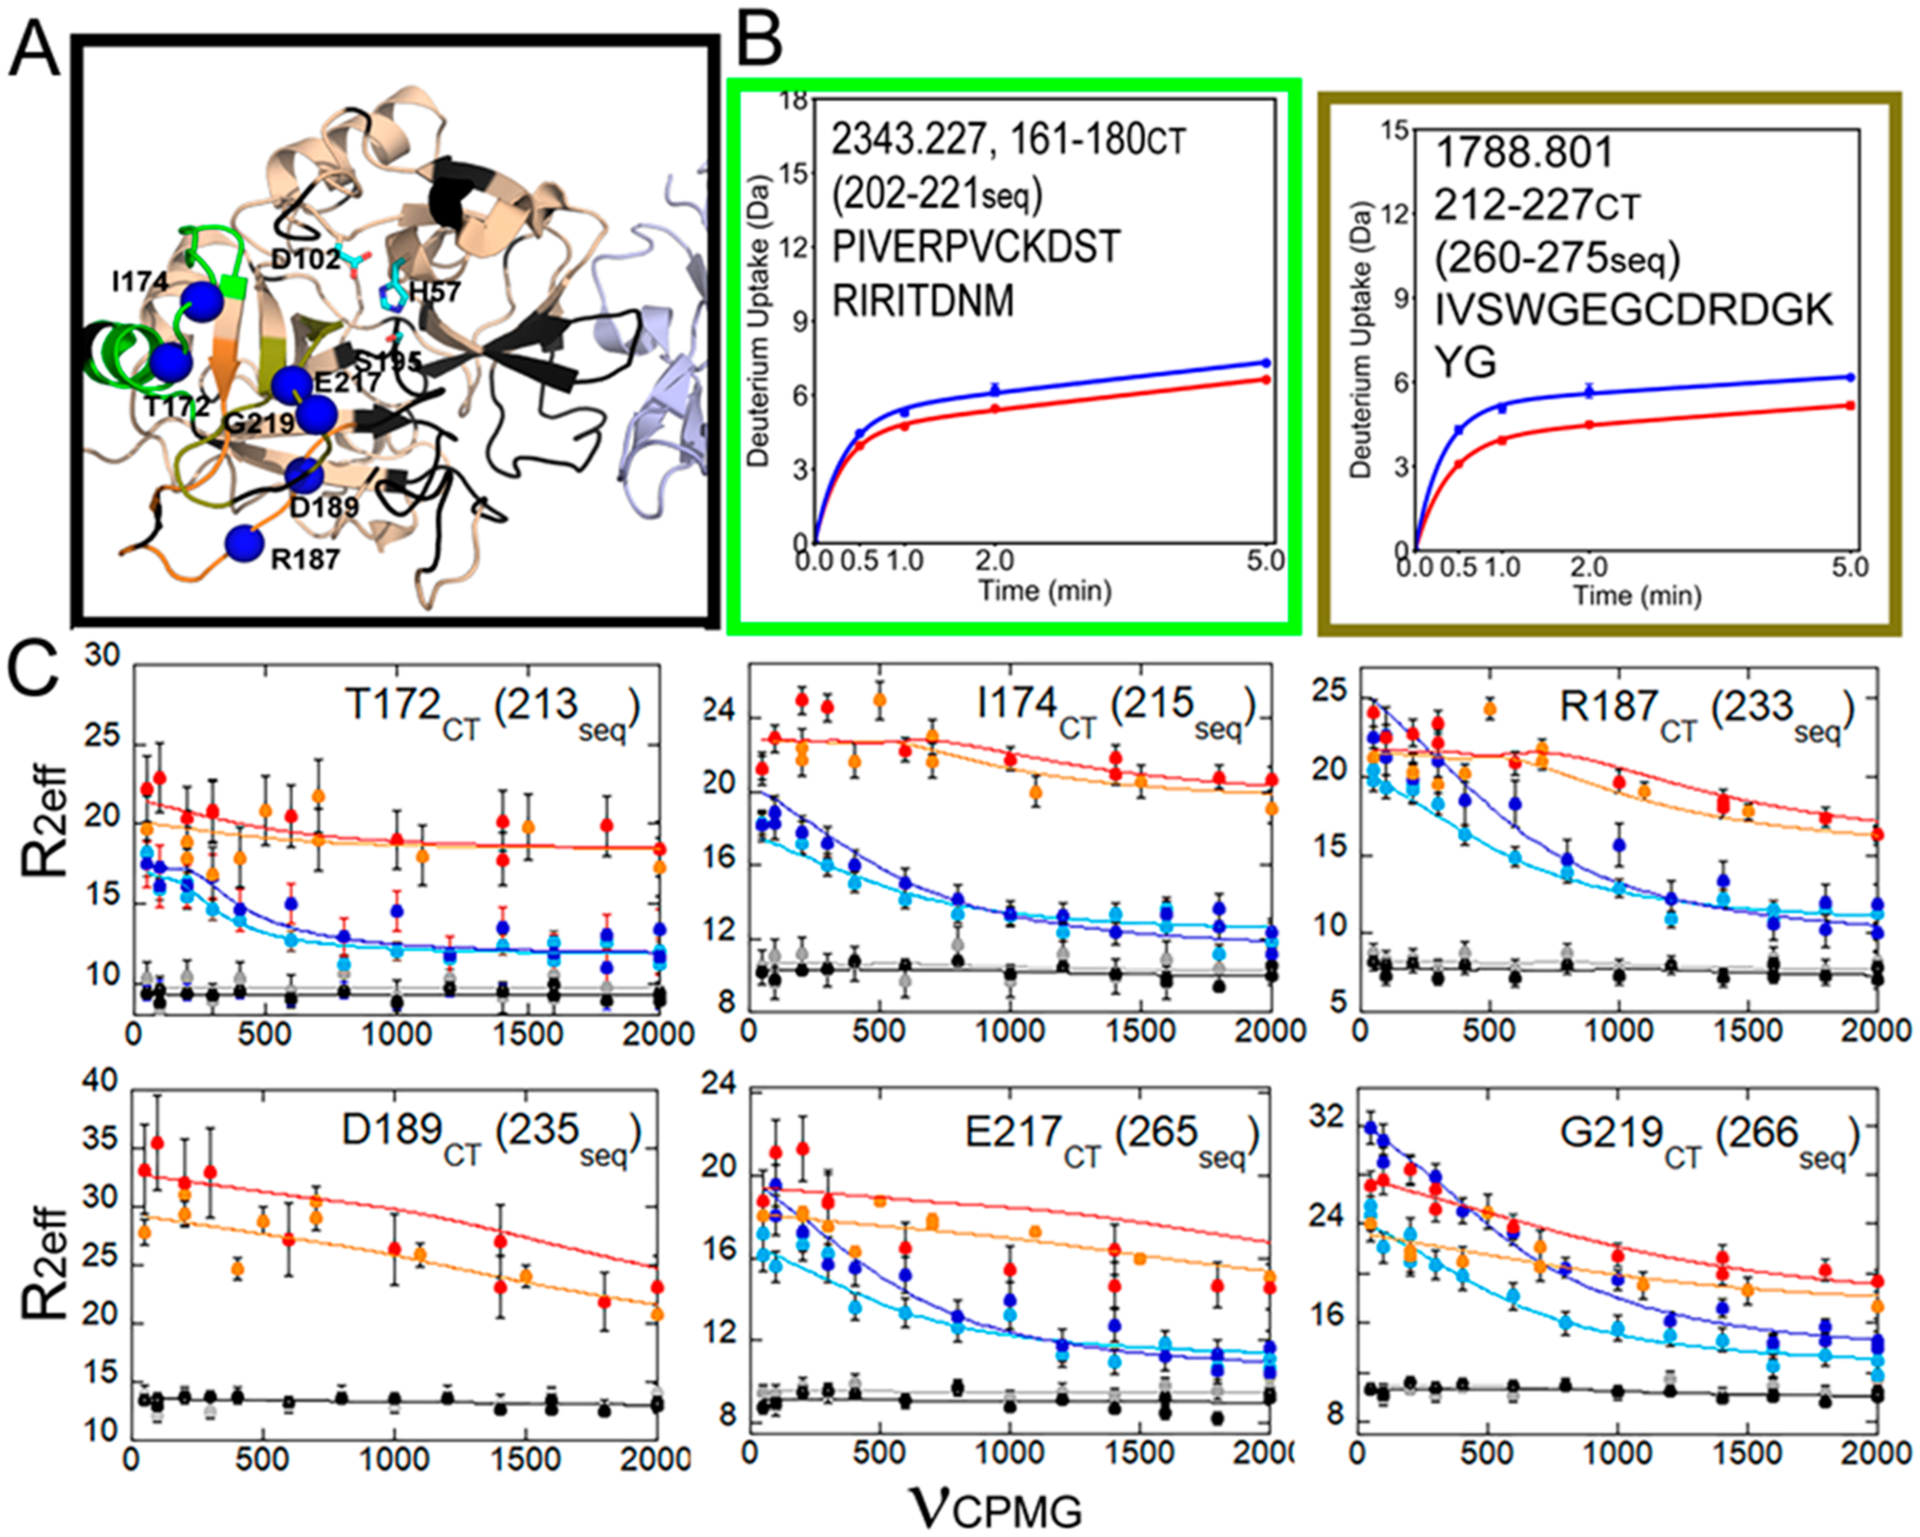
Figure 5.

Data from ref 27 for the C-terminal region of thrombin, which is allosterically altered by TM binding. (A) Structure of the thrombin (wheat)–TM (light blue) complex showing the catalytic triad (cyan sticks) and the loops as in Figure 2. Missing resonances resulted in a lack of assignments for some loops (black). (B) Deuterium uptake curves for the 180s loop were not different between thrombin (blue) and thrombin bound to TM (red), whereas the level of deuterium uptake was lower into the 220s loop when TM was bound. (C) Relaxation dispersion curves for the NH groups of residues marked by blue spheres in panel A. All of these groups showed microsecond to millisecond motions in apo-thrombin (light blue, 600 MHz data; dark blue, 800 MHz data) that were quenched upon binding of the active site inhibitor, PPACK (gray, 600 MHz data; black, 800 MHz data) or TM (orange, 600 MHz data; red, 800 MHz data). We note that R0 is non-uniform in the thrombin–TM complex likely due to the fact that the TM was made in Pichia pastoris and is glycosylated at two sites and probably tumbles non-uniformly.
