Abstract
Objectives
Previous studies have found a pattern of flatter COVID-19 age-mortality curves among low-income and middle-income countries (LMICs) using only official COVID-19 death counts. This study examines this question by comparing the age gradient of COVID-19 mortality in a broad set of countries using both official COVID-19 death counts and excess mortality estimates for 2020.
Design
This observational study uses official COVID-19 death counts for 76 countries and excess death estimates for 42 countries. A standardised population analysis was conducted to assess the extent to which variation across countries in the age distribution of COVID-19 deaths was driven by variation in the population age distribution.
Setting and primary outcomes
Officially reported COVID-19 deaths and excess deaths for 2020 for all countries where such data were available in the COVerAGE database and the short-term mortality fluctuations harmonised data series, respectively.
Results
A higher share of pandemic-related deaths in 2020 occurred at younger ages in middle-income countries compared with high-income countries. People under age 65 years constituted on average (1) 10% of official deaths and 11 % of excess deaths in high-income countries, (2) 34% of official deaths and 33% of excess deaths in upper-middle-income countries, and (3) 54% of official deaths in LMICs. These contrasting profiles are due only in part to differences in population age structure.
Conclusions
These findings are driven by some combination of variation in age patterns of infection rates and infection fatality rates. They indicate that COVID-19 is not just a danger to older people in developing countries, where a large share of victims are people of working age, who are caregivers and breadwinners for their families.
Keywords: COVID-19, EPIDEMIOLOGY, PUBLIC HEALTH
Strengths and limitations of this study.
This study compares the age gradient of COVID-19 mortality in a broad set of countries using both official COVID-19 death counts and excess mortality estimates for 2020.
This represents a methodological contribution because nearly all studies of the pandemic’s age mortality patterns have used only official COVID-19 death data. However, excess deaths at the aggregate population level during the pandemic exceed officially recognised COVID-19 deaths in most countries.
Using a standardised population analysis, this study assesses the extent to which variation across countries in the age distribution of COVID-19 deaths was driven by variation in the population age distribution.
The available data for this study does not allow ascertaining to what extent the reported differences in the age-specific mortality rates are driven by differences in age-specific cumulative infection rates or in the age-specific cumulative infection fatality rate or both.
Because of limitations in available mortality data, the analysis includes a large set of high-income and-middle income countries but does not include many low-income countries.
Introduction
An important question for understanding the global impact of the COVID-19 pandemic is the disease’s age pattern of mortality across countries. Early in the pandemic, case data from patients with COVID-19 in mainland China showed that COVID-19 mortality risk increases rapidly with age.1 This risk profile would tend to limit the death toll in developing countries, which generally have younger populations. But this prediction only holds if the age profile of COVID-19 mortality remains similar across countries.
Our study examines this question by comparing the age gradient of COVID-19 mortality in a broad set of countries using both official COVID-19 death counts and excess mortality estimates for 2020. Vaccine availability was very limited before 2021 and therefore is unlikely to affect the mortality patterns identified in this analysis.
Nearly all studies of the pandemic’s age-mortality patterns have used only official COVID-19 death data.2–7 Some of these studies have found a pattern of flatter COVID-19 age-mortality curves among low-income and middle-income countries (LMICs) using only official COVID-19 death counts.4 7 However, excess deaths at the aggregate population level during the pandemic exceed officially recognised COVID-19 deaths in most countries.8–10 Other studies have used excess mortality estimates but have mainly focused on estimating changes to life expectancy without examining the age profile of the COVID-19 impacts on mortality.11–13 This is to our knowledge the first study that estimates COVID-19 excess mortality by age for a wide swath of countries.
Several studies have highlighted possible contributing factors to variation across countries in overall COVID-19 mortality, including age structure of the population and pre-existing health conditions and those same factors could generate different patterns in mortality by age.14–19 When using only official death counts, it is unclear to what extent the finding of flatter COVID-19 age-mortality curves among LMICs may have been driven by data reporting issues. In particular, it is possible that deaths among older people in developing countries have been more likely to be underattributed to the disease in official COVID-19 death counts. This paper addresses that concern and examines this question by comparing the age gradient of COVID-19 mortality in a broad set of countries using both official COVID-19 death counts and excess mortality estimates for 2020.
Methods
Data sources
The analysis employs two main sources of data:
Officially reported COVID-19 deaths drawn from the COVerAGE database, with death counts aggregated to 5-year age groups, downloaded 16 May 2022.20 Seventy-six countries have a record of cumulative deaths that satisfies the inclusion criteria of covering at least 6 months since the first case was detected in the country (per case data derived from Our World in Data21).
All-cause deaths by age drawn from national vital statistics records, aggregated in the short-term mortality fluctuations harmonised data series assembled as part of the Human Mortality Database, downloaded 18 February 2022 (38 countries).22 23
Additional all-cause death data from Colombia, Mexico, Brazil, Peru and the USA were obtained from national statistical offices.24–27 Contrary to other COVID-19 mortality estimates such as those released by the WHO, this study does not use modelled data.9 10 Population by age figures for each country from 2020 were taken from United Nations estimates.28 A more detailed description of data sources is provided in an annex.
Standardised population
A standardised population analysis was conducted to assess the extent to which variation across countries in the age distribution of COVID-19 deaths was driven by variation in the population age distribution. First age-specific mortality rates were calculated by dividing the number of deaths attributed to COVID-19 for each age group by the population in each age group. These calculations were conducted for the following age groups: under 45 years, 45–54 years, 55–64 years, 65–74 years, 75–84 years, 85 years and above. A hypothetical age distribution of deaths for each country was calculated by multiplying the age-specific COVID-19 mortality rates by corresponding population shares from the USA. A parallel calculation was carried out using estimates of excess mortality by age.
Excess mortality calculations
Excess mortality methods compare the number of deaths to the number of expected deaths during a period of interest. Excess mortality is often treated as the ‘gold standard’ in analysis of COVID-19 mortality.29 However, there are two issues that are often overlooked in the analysis of excess mortality.
The first issue is that estimates are sensitive to the choice of method. Many COVID-19 excess mortality calculations have estimated expected deaths as the mean number of deaths over a corresponding period in previous years. If the number of deaths was trending upwards in previous years, this common approach will overestimate excess mortality.30 31
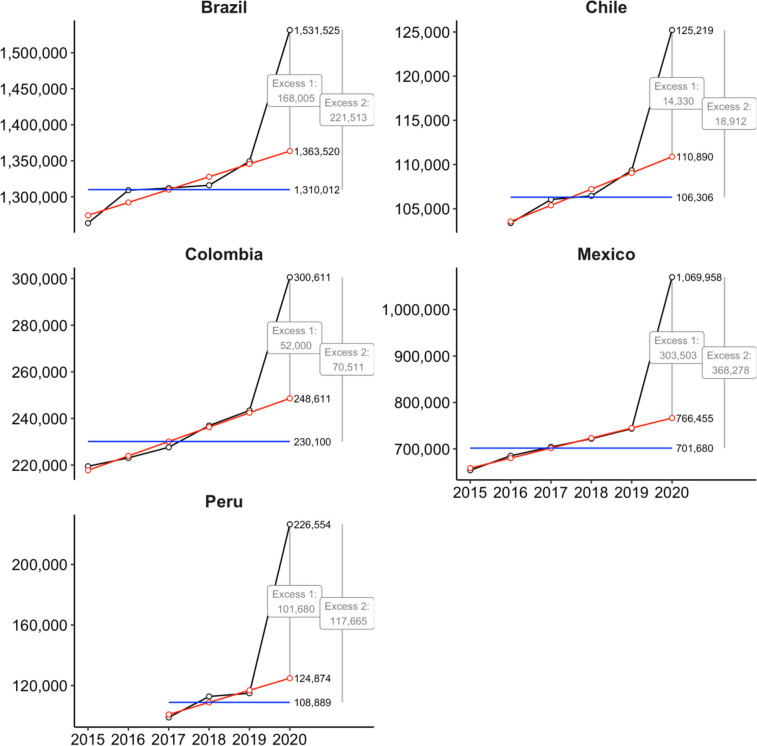
This issue is illustrated in figure 1 for five Latin-American countries. All five countries show an increase in the number of annual deaths over 2015–2019. Excess death estimates based on predicting expected 2020 deaths using estimated 2015–2019 linear trends (red lines) are shown as ‘Excess 1’. Alternative excess death estimates using a prediction based on the 2015–2019 mean death count (blue lines) are shown as ‘Excess 2’. In all cases, ignoring the increase over time and using the historical mean to calculate expected deaths would result in substantial overestimation of excess deaths.
Figure 1.
Actual and predicted total deaths (all causes) by year, select countries in Latin America. Notes: Actual deaths are shown in black. Predicted deaths based on a linear projection using annual mortality totals 2015–2019 are shown in red. Mean deaths 2015–2019 are shown in blue.
For the analysis in this paper, expected deaths are estimated using a simple regression using 2015–2019 historical data, run separately by country and age group, where observed deaths are modelled as a linear function of year and an error term.
The second issue often neglected in COVID-19 excess mortality discussions is that excess mortality represents a combination of effects. Specifically,
Net excess deaths =
(Direct COVID-19 deaths) + (Indirect COVID-19 deaths) − (Averted deaths)
Direct COVID-19 deaths are those due to infection with the virus. Indirect COVID-19 deaths are those due in part to factors such as congestion in the health system, delays in care-seeking or mental health issues caused by the pandemic. Averted deaths are those that would have taken place in the absence of the pandemic but did not occur as a result of pandemic-induced measures. These could include deaths due to other infectious diseases, violence, or traffic injuries that were avoided due to voluntary or mandated social distancing. The possibility of non-zero indirect deaths and averted deaths makes the interpretation of excess deaths more complex than is often recognised.
Slope calculation
The shape of an age-mortality curve can be summarised in terms of the per cent rate of increase in the mortality rate per year of additional age after age 45 years, calculated by running a Poisson regression using deaths as the response variable and exposures as an offset, fitting a Gompertz (1825) model to the data.32 33
where the age-specific number of deaths is for the 10-year age group age x to age x+9, (x=45, 55, 65, 75, 85) in country i The x=85 points correspond to the group consisting of all ages 85 years and above. To interpret death counts relative to person-years, an exposure term is introduced as an offset in the model as .
The coefficients, , are the rates of increase per year of age in the mortality rate. This calculation was performed first defining in terms of official COVID-19 counts by age for each country for which data were available. The calculation was also performed for each country defining using excess mortality estimates by age as described in the previous section (when estimated excess deaths were zero or less, a weight of zero was assigned to such cases). These results provide (1) The slope of the COVID-19 age-mortality curve according to official counts, and (2) The slope of the age-mortality curve for excess deaths.
Patient and public involvement
The study presents analysis of secondary data. There was no patient and public involvement.
Results
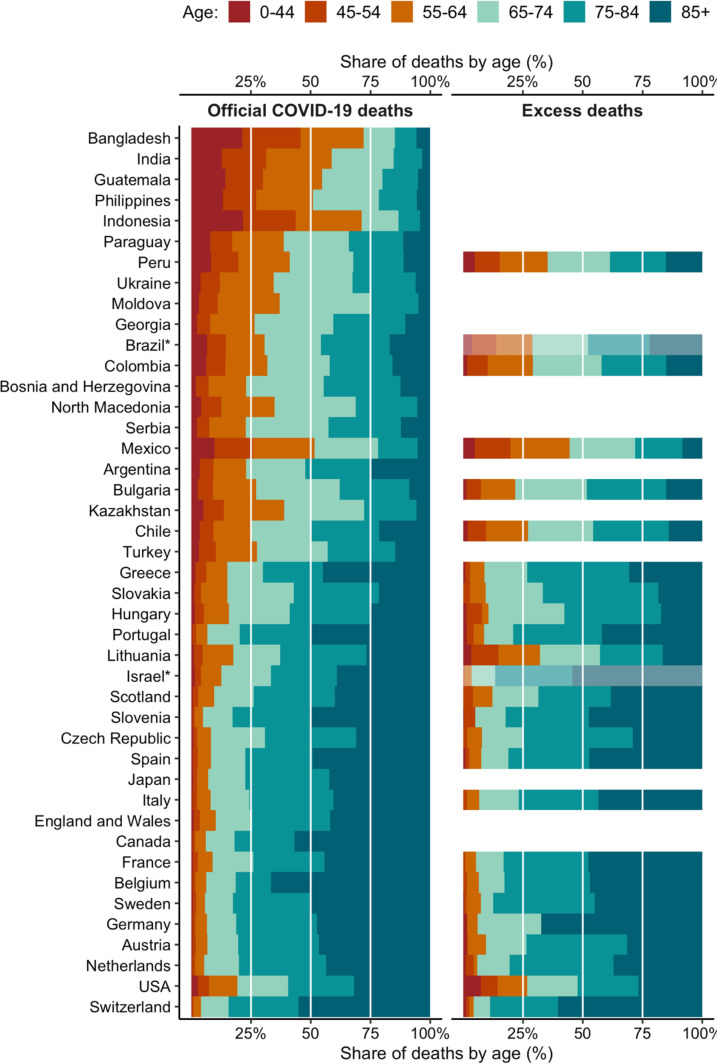
The left side of figure 2 shows the age distribution of officially recorded COVID-19 deaths in 2020 by country. According to official reports, on average across high-income countries, just 10% of deaths were among those under age 65 years. (Note that all countries in figure 2 from Chile downward with the exception of Turkey on the figure are classified as high-income countries. Turkey is classified as an upper-middle-income country. Bangladesh, India, the Philippines, Jordan and Indonesia are lower-middle-income countries. World Bank classifications are based on Gross National Income (GNI) calculated by the Atlas method while the figure uses GNI calculated with purchasing power parity (PPP) exchange rates). In contrast, people under 65 years constituted on average 34% of official COVID-19 deaths in upper-middle-income countries and 54% of deaths in lower-middle-income countries. The same pattern is observed using the distribution of excess deaths by age, shown on the right side of figure 2. In high-income countries, those under 65 years are 11% of excess deaths. For the upper-middle-income countries for which data are available (Peru, Colombia and Mexico), the age profiles of excess deaths are similar to those of official COVID-19 deaths, and those under age 65 years account for on average 33% of excess deaths. (Data are also available to produce excess death estimates by age for Brazil, but not with our preferred age group breakdown).
Figure 2.
Age distribution of official COVID-19 deaths and excess deaths in 2020. Notes: Countries with fewer than 2000 official COVID-19 deaths are excluded. The age groups available to compute excess deaths for Brazil and Israel differ from those available in other countries. For Brazil and Israel, the age groups are: 0–39 years, 40–49 years, 50–59 years, 60–69 years, 70–79 years, 80+ years. Negative excess deaths estimated in the Philippines (age groups 0–44 years, 75–84 years and 85+ years), Slovenia (55–64 years) and Scotland (0–44 years) are recoded to zero. Countries are sorted by 2019 GNI per capita (PPP).
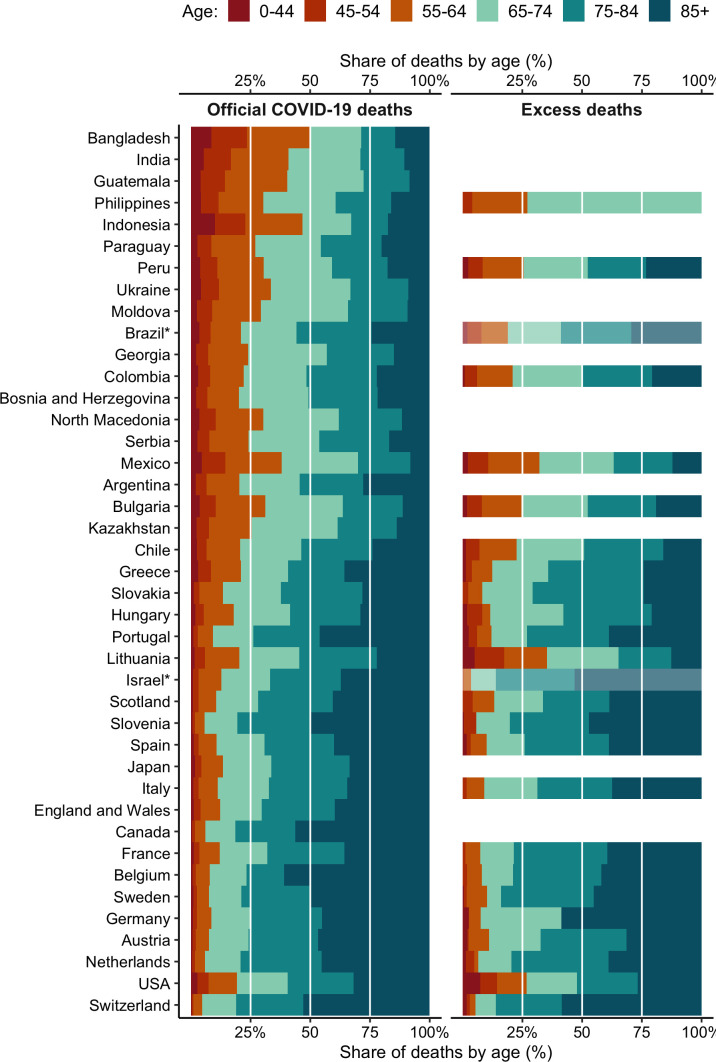
Figure 3 shows the hypothetical age distribution of COVID-19 deaths according to official reports, as well as excess deaths, applying the US standardised age distribution. This controls for the differing population age distributions across countries. Unsurprisingly in LMICs, which have younger populations than the USA, the hypothetical distribution shows an older profile of deaths as compared with the actual distribution. However, the pattern of a younger profile of deaths in less wealthy countries remains, both with official data and with excess mortality data. The numbers shown in figures 2 and 3 can also be found in online supplemental tables A1 and A2.
Figure 3.
Hypothetical age distribution of official COVID-19 and excess deaths in 2020, using country age-specific mortality rates and the US population age distribution. Notes: Countries with fewer than 2000 official COVID-19 deaths are excluded. The age groups available to compute excess deaths for Brazil and Israel differ from those available in other countries. For Brazil and Israel, the age groups are: 0–39 years, 40–49 years, 50–59 years, 60–69 years, 70–79 years, 80+ years; Negative excess deaths estimated in the Philippines (age groups 0–44 years, 75–84 years and 85+ years), Slovenia (55–64 years) and Scotland (0–44 years) are recoded to zero. Countries are sorted by 2019 GNI per capita (PPP).
bmjopen-2022-061589supp001.pdf (142KB, pdf)
Notably the USA has a much younger profile of death—using both official COVID-19 death counts and excess mortality—than countries with similar income levels. This is the case even after controlling for differences in population age distribution. The age distribution of deaths in the USA is roughly similar to that of Chile. In both countries, 27% of excess deaths were among those under age 65 years.
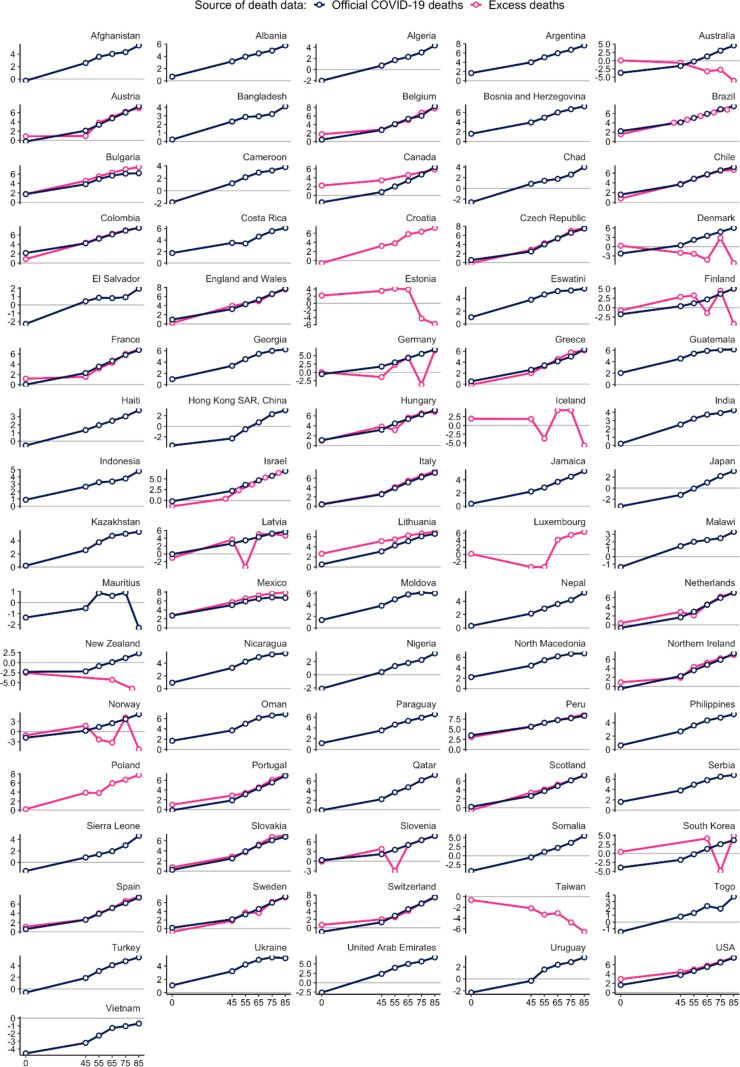
Figure 4 presents a visual representation of all the mortality rates by age group across all countries and economies with available data. The vertical axis represents mortality rates per 100 000 on a log scale, and it is important to note that the scale varies across countries, reflecting the different levels of exposure to the pandemic and to its related mortality across the globe. Overall, mortality rates increase with age, although with different gradients. With the excess mortality data, a few deviations from this gradient are likely due to the relatively low mortality as well as the overall small number of deaths (eg, Iceland). Australia, New Zealand and Taiwan, China have close to zero official COVID-19 deaths and show negative estimates of excess mortality rates, especially for the older age groups, likely reflecting averted deaths due to isolation policies.
Figure 4.
Official COVID-19 versus excess deaths by age group (per 100 000 population) (log scale). Note: Points are plotted at the start of each age group: 0–44 years, 45–54 years, 55–64 years, 65–74 years, 75–84 years, 85+ years. Vertical axis labels are expressed as log (deaths/100,000 population).
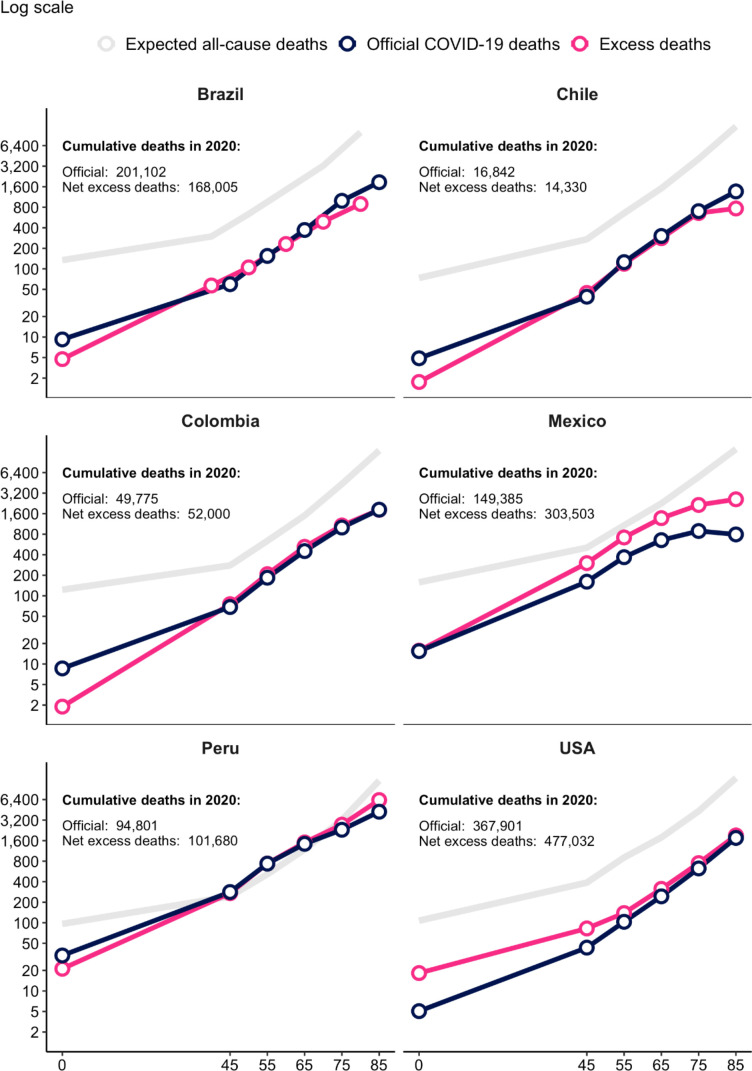
Figure 5 shows a more detailed comparison of results for five Latin-American countries and the USA, using the same log scale for all countries. To add perspective on the extent of COVID-19-related mortality compared with what might have been the mortality experience in the absence of the COVID-19 pandemic, each figure adds in grey the expected all-cause mortality for 2020, based on levels and trends in the five preceding years. For each country, the figure also reports the total cumulative deaths for 2020 using both official COVID-19 deaths and excess mortality.
Figure 5.
Official COVID-19 versus excess deaths by age group, select Latin-American countries and the USA (per 100 000 population). Note: Points are plotted at the start of each age group: 0–44 years, 45–54 years, 55–64 years, 65–74 years, 75–84 years, 85+ years. Brazil has different age group categories. The excess mortality calculation for Chile is based on the first 52 weeks of the International Organization for Standardization (ISO) calendar year and thus excludes the last 4 days of the calendar year.
Official COVID-19 death counts are higher than excess mortality estimates in some cases. These patterns indicate that for these country-age group combinations, the number of deaths averted due to the pandemic exceeds indirect COVID-19 deaths. This could have occurred, for example, because of a decline in driving and exposure to violence during lockdowns and a reduction in transmission of other infectious diseases as a result of pandemic precautions. Similar to our estimates, Santo et al34 find for Brazil that total estimated excess mortality in 2020 was below the official COVID-19 death count, reflecting drops in deaths due to violence as well as cardiovascular and infectious diseases.
In Mexico, the mortality estimates using excess deaths is consistently higher than using the official COVID-19 death count, and the gap between both measures increases with age. In the USA, mortality estimates using excess deaths are also higher than using official COVID-19 deaths, but that difference decreases with age and becomes minimal for older age groups. The especially extreme impact of the pandemic in Peru is evident in figure 5. Among those aged 45–74 years, both deaths attributed to COVID-19 and excess deaths exceeded total expected all-cause mortality for 2020.
Another notable pattern evident in figure 5 is the large gap between the two measures for the USA at younger age groups. For the 15–44 years age group, the excess death estimate is four times the official COVID-19 death count. Given that testing of patients with COVID-19 symptoms has been widespread in the USA in all but the early stages of the pandemic, the jump in excess mortality among young people most likely reflects indirect COVID-19 deaths.
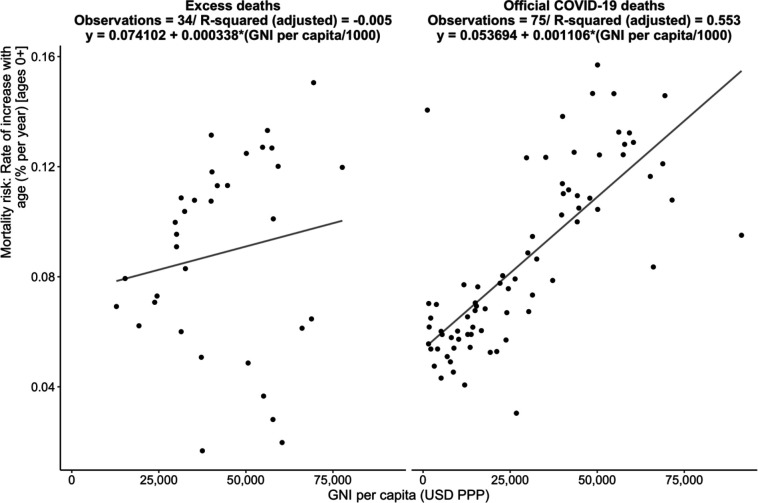
Figure 6 explores how the slope of the age-mortality gradient for each country varies with its level of income. More precisely, it shows the exponential rate of increase in mortality by age in per cent per year against 2019 GNI per capita (the numbers for the estimated rates of increase are available in online supplemental table A3). The left panel presents this plot for the 76 countries with official COVID-19 deaths data and the right panel displays the corresponding plot for the 34 countries with excess deaths estimates available for a consistent set of age groups as follows: 45–54 years, 55–64 years, 65–74 years, 75–84 years, 85+ years. Using all available data, we find that the increase in mortality risk with each additional year of age typically ranges (IQR) from 6.3% to 11.7% (median=9.8) using excess deaths and 5.9% to 11.1% (median=7.6) using official deaths.
Figure 6.
displays the slope of the relationship between the rate of increase of mortality risk with age (% per year) and GNI per capita, for official COVID-19 deaths (left panel) and excess deaths (right panel), all data. Poisson model (estimates use all age groups and deaths recoded to 0 where they are negative).
Both plots show a positive association between income per capita and the age-mortality gradient, indicating that COVID-19 mortality increases more steeply for older age groups in richer countries. Using official death rate data, across countries the rate of increase of mortality risk per year of age rises by 0.11% for each US$1000 of GNI. Using excess mortality data, it rises by 0.03% for each US$1000 of GNI.
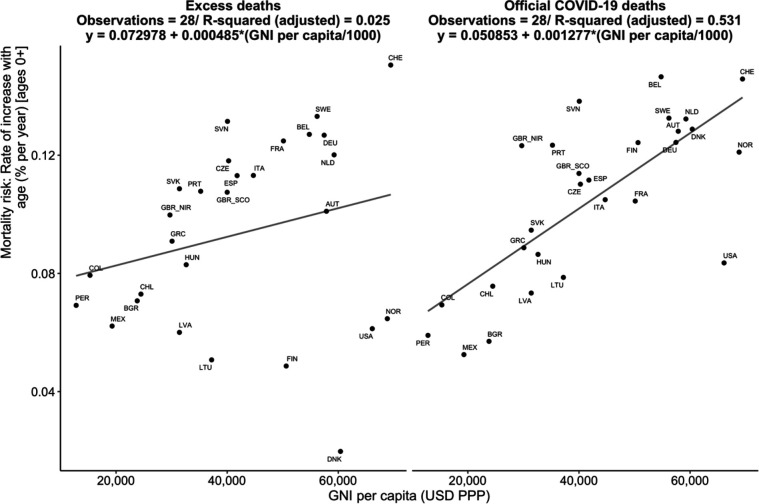
To verify that this observed association is not driven by the composition of both sets of countries/economies, figure 7 repeats the same exercise with the common set of 28 countries/economies. The conclusions taken from figures 6 and 7 are similar: COVID-19 mortality is more concentrated among older individuals in richer countries. Using official death rate data, across countries the rate of increase of mortality risk per year of age rises by 0.13% for each US$1000 of GNI. Using excess mortality data, it rises by 0.05% for each US$1000 of GNI.
Figure 7.
displays the slope of the relationship between the rate of increase of mortality risk with age (% per year) and GNI per capita, for official COVID-19 deaths (left panel) and excess deaths (right panel) for a common set of countries/economies. Poisson model (estimates use all age groups and deaths recoded to 0 where they are negative).
Discussion
The age profile of COVID-19 mortality risk in 2020 was flatter (with relatively higher mortality at younger ages) in countries with lower incomes. This pattern is found using official COVID-19 death data from a large set of countries as well as excess mortality from a smaller set of countries which include high-income countries plus Colombia, Mexico and Peru. Our analysis concerns the year 2020 and is therefore unaffected by the arrival of COVID-19 vaccines and their unequal distribution across countries.
One limitation of this study is that the available data do not allow ascertaining to what extent the reported differences in the age-specific mortality rates are driven by differences in age-specific cumulative infection rates (IRs) or in the age-specific cumulative infection fatality rates (IFRs) or both. Further, because of limitations in available mortality data, the analysis includes a large set of high-income and-middle income countries but does not include many low-income countries. Finally, we acknowledge that, even as we used excess mortality measures to address the concern of under-reporting of official COVID-19 deaths, all cause mortality itself could also be under-reported in some countries and that the extent of under-reporting might vary across countries. This would however affect our analysis only to the extent that the under-reporting of all cause mortality was affected by the COVID-19 pandemic.
The findings in this paper can provide the basis for a more comprehensive accounting of the impact of COVID-19. For example, the younger mortality profile in developing countries means that in those countries the pandemic has killed large numbers of people who were of working age, many of whom were their families’ breadwinners. Earlier global estimates suggest that more than 1.5 million children have experienced the death of at least one caregiver as a consequence of the pandemic.35 This raises the concern that long-term impacts via lower investments in human capital of orphaned children will be particularly deep in developing countries. This is highly worrisome given the already massive declines in school enrolment and learning losses generated by the pandemic in developing countries.36–38
A full understanding of age-specific patterns of excess mortality will require country-by-country analysis using cause-of-death data, where available, to pull apart estimates of direct COVID-19 deaths, indirect COVID-19 deaths and averted deaths. A brief comparison of Colombia and USA highlights how components of excess mortality can vary widely by country. In Colombia, both vehicular and homicide deaths fell during the country’s lockdown, reducing its excess mortality count. For 2020, vehicular deaths dropped 18.2%, and the number of homicides fell 5.4%, causing Colombia’s murder rate to reach its lowest level since 1979.39 40 In contrast, the US excess mortality estimate for 2020 reflects in part a 7.2% increase in motor vehicle deaths, a 29.4% increase in homicide, and a 30% spike in drug overdose deaths.41–43
Official COVID-19 death reports and excess mortality estimates show broadly similar age patterns country-by-country. This finding, along with the fact that direct COVID-19 deaths account for the large share of excess mortality, suggests that the flatter profile of excess mortality in lower-income countries is driven principally by direct COVID-19 deaths. To consider drivers of the direct COVID-19 age pattern it is useful to note that the age-specific mortality rate is the product of the age-specific cumulative IRs and the age-specific cumulative IFR. Using a notation where is the population of the age group in country i, is the number of deaths in the age group, and designates the cumulative number of infections of age group x in country i, this can be expressed as follows:
=
The greater flatness of direct COVID-19 age-specific mortality rates in lower-income countries could result from differing patterns across countries by age of IR, IFR or both. A number of studies have documented possible contributing factors to variation across countries in overall COVID-19 mortality and those same factors could generate different patterns in mortality by age.14–18
The relative IR of younger versus older people may vary across countries for many reasons. First, in lower-income countries, a large share of the population cannot work remotely.44 Second, in developing countries, a lower share of older people are long-term care facility residents, who are at high risk for infection and death. A quarter of recognised COVID-19 deaths during the first few months of the pandemic in the UK were residents of care facilities, and 31% of recognised COVID-19 deaths in the USA as of 1 June 2021 were care facility residents or staff.45 46 Both of these characteristics of developing countries would tend to increase the relative risk of infection for younger people. On the other hand, in LMICs, intergenerational households are more common. This means older people are more exposed to infection risk, particularly because in those countries people are more likely to live in crowded conditions. Roughly 20% of households in LMICs have at least one household member under age 20 years and one over age 60 years, as compared with just 5% in high-income countries.47 In 54 LMICs with recent Demographic and Health Surveys, just half of the households have no more than two people per sleeping room.17
Among those infected, age-specific IFRs may vary by age due to many different factors. One systematic review found that age-specific IFRs in developing countries were roughly two times higher than in high-income countries.48 Country-level factors like the profile of comorbidities, differences in health system capacity, quality of care, infection prevention and control practices, and availability of personal protective equipment could have age-specific effects on the IFR.18 49 A form of survivor bias may be a factor as well. High-quality medical care in wealthier countries keeps many older people alive despite weak health conditions that make them vulnerable to COVID-19. It may be that older people in developing countries are on average healthier than those in wealthier countries because those with ailments would have been at high risk for death at younger ages. If this is the case, older people in developing countries might be more resilient to the disease.
Distinguishing various explanations for the observed age patterns of mortality identified in this paper should be a topic for further research. The analysis in this paper is also a reminder of the value of demographic data and in particular vital statistics as a tool amid the COVID-19 crisis. Excess mortality analysis by age presented here is only possible for countries that have well-functioning vital statistics systems and that have made their data widely available. Investments in vital statistics systems and greater data transparency should be encouraged as a global public good.
Supplementary Material
Acknowledgments
The authors thank Joshua Goldstein, Young Eun Kim, Ronald D Lee, Norman Loayza, Andrew Noymer, Robert Oelrichs, Sharon Piza and Philip Schellekens for helpful suggestions. The findings, interpretations and conclusions in this paper are entirely those of the authors. They do not necessarily represent the views of the International Bank for Reconstruction and Development/World Bank and its affiliated organisations, or those of the Executive Directors of the World Bank or the governments they represent and are not intended to make any judgement on the legal or other status of geographical areas, or to prejudice the determination of any claims with respect to such area.
Footnotes
Contributors: The study and the methodology were conceived by GD, DdW, PG, PU and JV. GD and PG conducted the formal analysis and validated the results. GD, DdW, PG, PU and JV collaborated on writing the paper. GD is the guarantor of the study.
Funding: The authors have not declared a specific grant for this research from any funding agency in the public, commercial or not-for-profit sectors.
Competing interests: None declared.
Patient and public involvement: Patients and/or the public were not involved in the design, or conduct, or reporting, or dissemination plans of this research.
Provenance and peer review: Not commissioned; externally peer reviewed.
Supplemental material: This content has been supplied by the author(s). It has not been vetted by BMJ Publishing Group Limited (BMJ) and may not have been peer-reviewed. Any opinions or recommendations discussed are solely those of the author(s) and are not endorsed by BMJ. BMJ disclaims all liability and responsibility arising from any reliance placed on the content. Where the content includes any translated material, BMJ does not warrant the accuracy and reliability of the translations (including but not limited to local regulations, clinical guidelines, terminology, drug names and drug dosages), and is not responsible for any error and/or omissions arising from translation and adaptation or otherwise.
Data availability statement
Data are available in a public, open access repository. The data availability section in the online appendix describes the data sources used for this study. Upon acceptance a link to a Github repository will be made available to facilitate replication.
Ethics statements
Patient consent for publication
Not applicable.
Ethics approval
Not applicable.
References
- 1.Verity R, Okell LC, Dorigatti I, et al. Estimates of the severity of coronavirus disease 2019: a model-based analysis. Lancet Infect Dis 2020;20:669–77. 10.1016/S1473-3099(20)30243-7 [DOI] [PMC free article] [PubMed] [Google Scholar]
- 2.Sasson I. Age and COVID-19 mortality: a comparison of Gompertz doubling time across countries and causes of death. Demogr Res 2021;44:379–96. 10.4054/DemRes.2021.44.16 [DOI] [Google Scholar]
- 3.Demombynes G. COVID-19 age-mortality curves are Flatter in developing countries. World Bank Policy Research Working Paper, 2020: 9313. [Google Scholar]
- 4.Shapiro V. COVID-19 outbreaks and age mortality patterns, 2020. [Google Scholar]
- 5.Goldstein JR, Lee RD. Demographic perspectives on the mortality of COVID-19 and other epidemics. Proc Natl Acad Sci U S A 2020;117:22035–41. 10.1073/pnas.2006392117 [DOI] [PMC free article] [PubMed] [Google Scholar]
- 6.Sudharsanan N, Didzun O, Bärnighausen T, et al. The Contribution of the Age Distribution of Cases to COVID-19 Case Fatality Across Countries : A Nine-Country Demographic Study. Ann Intern Med 2020;173:714–20. 10.7326/M20-2973 [DOI] [PMC free article] [PubMed] [Google Scholar]
- 7.Chauvin JP, Folwer A, Herrera LN. The younger age profile of Covid-19 deaths in developing countries. Washington DC, 2020. [Google Scholar]
- 8.Karlinsky A, Kobak D. Tracking excess mortality across countries during the COVID-19 pandemic with the world mortality dataset. Elife 2021;10:e69336. 10.7554/eLife.69336 [DOI] [PMC free article] [PubMed] [Google Scholar]
- 9.World Health Organization . Global excess deaths associated with COVID-19 (modelled estimates), 2022. Available: https://www.who.int/data/sets/global-excess-deaths-associated-with-covid-19-modelled-estimates
- 10.Knutson V, Aleshin-Guendel S, Karlinsky A. Estimating global and Country-Specific excess mortality during the COVID-19 pandemic. arXiv 2022:2205.09081. [Google Scholar]
- 11.Aburto JM, Schöley J, Kashnitsky I. Quantifying impacts of the COVID-19 pandemic through life-expectancy losses: a population-level study of 29 countries. Int J Epidemiol 2021;51. 10.1093/ije/dyab207 [DOI] [PMC free article] [PubMed] [Google Scholar]
- 12.Islam N, Jdanov DA, Shkolnikov VM, et al. Effects of covid-19 pandemic on life expectancy and premature mortality in 2020: time series analysis in 37 countries. BMJ 2021;375:e066768. 10.1136/bmj-2021-066768 [DOI] [PMC free article] [PubMed] [Google Scholar]
- 13.Castro MC, Gurzenda S, Turra CM, et al. Reduction in life expectancy in Brazil after COVID-19. Nat Med 2021;27:1629–35. 10.1038/s41591-021-01437-z [DOI] [PMC free article] [PubMed] [Google Scholar]
- 14.Schellekens IG. COVID-19 is a developing country pandemic. Brookings, 2021. Available: https://www.brookings.edu/blog/future-development/2021/05/27/covid-19-is-a-developing-country-pandemic/
- 15.Schellekens P, Sourrouille DM. COVID-19 mortality in rich and poor countries: a tale of two pandemics? World Bank Policy Research Working Paper 2020;9260. [Google Scholar]
- 16.Walker PGT, Whittaker C, Watson OJ, et al. The impact of COVID-19 and strategies for mitigation and suppression in low- and middle-income countries. Science 2020;369:2020. 10.1126/science.abc0035 [DOI] [PMC free article] [PubMed] [Google Scholar]
- 17.Brown CS, Ravallion M, van de Walle D. Can the World’s Poor Protect Themselves from the New Coronavirus? 2020. [Google Scholar]
- 18.Ghisolfi S, Almås I, Sandefur JC, et al. Predicted COVID-19 fatality rates based on age, sex, comorbidities and health system capacity. BMJ Glob Health 2020;5:e003094. 10.1136/bmjgh-2020-003094 [DOI] [PMC free article] [PubMed] [Google Scholar]
- 19.Verdery AM, Newmyer L, Wagner B, et al. National profiles of coronavirus disease 2019 mortality risks by age structure and preexisting health conditions. Gerontologist 2021;61:71–7. 10.1093/geront/gnaa152 [DOI] [PMC free article] [PubMed] [Google Scholar]
- 20.Riffe T, Acosta E, Acosta EJ, et al. Data resource profile: COVerAGE-DB: a global demographic database of COVID-19 cases and deaths. Int J Epidemiol 2021;50:390–390f. 10.1093/ije/dyab027 [DOI] [Google Scholar]
- 21.et alRitchie H, Mathieu E, Rodés-Guirao L. "Coronavirus Pandemic (COVID-19)". Published online at OurWorldInData.org, 2020. Available: https://ourworldindata.org/coronavirus
- 22.Jdanov DA, Galarza AA, Shkolnikov VM, et al. The short-term mortality fluctuation data series, monitoring mortality shocks across time and space. Sci Data 2021;8:235. 10.1038/s41597-021-01019-1 [DOI] [PMC free article] [PubMed] [Google Scholar]
- 23.Human Mortality Database . University of California, Berkeley (USA), and max Planck Institute for demographic research (Germany). Available: www.mortality.orgwww.humanmortality.de [Accessed 18 Feb 2022].
- 24.DANE . Defunciones no Fetales. Dirreción Nacional de Estadistidica, Bogota, Colombia, 2022. Available: https://www.dane.gov.co/index.php/estadisticas-por-tema/salud/nacimientos-y-defunciones/defunciones-no-fetales [Accessed 18 Feb 2022].
- 25.INEGI . Defunciones Registrada mortalidad General. Instituto Nacional de Estadística, Geografía E Informática (INEGI), Aguascalientes, Mexico, 2022. Available: https://www.inegi.org.mx/programas/mortalidad/#Microdatos [Accessed 18 Feb 2022].
- 26.SINADEF . Certificado Defunciones. Sistema Informato de Defunciones. lima, Peru, 2022. Available: https://www.datosabiertos.gob.pe/dataset/sinadef-certificado-defunciones/resource/fef60d30-c135-4b51-82e1-a642ef29fe79 [Accessed 18 Feb 2022].
- 27.Ministério da Saúde . Mortalidada – Brasil. Ministério dA Saúde, Brazilia, Brazil, 2022. Available: http://tabnet.datasus.gov.br/cgi/deftohtm.exe?sim/cnv/obt10uf.def [Accessed 18 Feb 2022].
- 28.DESA, U . World population prospects 2019. United nations. Department of economic and social affairs. 2019. world Popul. prospects, 2019. [Google Scholar]
- 29.Beaney T, Clarke JM, Jain V, et al. Excess mortality: the gold standard in measuring the impact of COVID-19 worldwide? J R Soc Med 2020;113:329–34. 10.1177/0141076820956802 [DOI] [PMC free article] [PubMed] [Google Scholar]
- 30.Nepomuceno MR, Klimkin I, Jdanov DA. Sensitivity analysis of excess mortality due to the COVID-19 pandemic. population and development review, 2022. 10.1111/padr.12475 [DOI] [PMC free article] [PubMed] [Google Scholar]
- 31.Schöley J. Robustness and bias of European excess death estimates in 2020 under varying model specifications. MedRxiv 2021. [Google Scholar]
- 32.Brillinger DR. A biometrics invited paper with discussion: the natural variability of vital rates and associated statistics. Biometrics 1986;42:693–734. [PubMed] [Google Scholar]
- 33.Gompertz B. On the nature of the function expressive of the law of human mortality, and on a new mode of determining the value of life contingencies. Philosophical Transactions of the Royal Society of London 1825;115:513–83. [DOI] [PMC free article] [PubMed] [Google Scholar]
- 34.Santos AMdos, Souza BFde, Carvalho CAde, et al. Excess deaths from all causes and by COVID-19 in Brazil in 2020. Revista De Saúde Pública 2021;55:71. [DOI] [PMC free article] [PubMed] [Google Scholar]
- 35.Hillis SD, et al. Global minimum estimates of children affected by COVID-19-associated orphanhood and deaths of caregivers: a modelling study. The Lancet 2021;398:391–402. [DOI] [PMC free article] [PubMed] [Google Scholar]
- 36.Bundervoet T, Dávalos ME, Garcia N. The short-term impacts of COVID-19 on households in developing countries: an overview based on a harmonized data set of high-frequency surveys. The World Bank 2021. [DOI] [PMC free article] [PubMed] [Google Scholar]
- 37.Miguel E, Mobarak AM. The economics of the COVID-19 pandemic in poor countries. Ann Rev Econ 2021. [Google Scholar]
- 38.Azevedo JP, Hasan A, Goldemberg D, et al. Simulating the potential impacts of COVID-19 school closures on schooling and learning outcomes: a set of global estimates. World Bank Res. Obs 2021;36:1–40. [Google Scholar]
- 39.Departamento Administrativo Nacional de Estadística . Cuadros unificados: Defunciones no fetales cifras definitivas 2019, 2020. [Google Scholar]
- 40.Departamento Administrativo Nacional de Estadística . Cuadros unificados: Defunciones no fetales acumulado año 2020pr, 2021. [Google Scholar]
- 41.National Center for Statistics and Analysis . Early estimate of motor vehicle traffic fatalities in 2020, 2021. [Google Scholar]
- 42.Krishnakumar P. Murders rose sharply in 2020 but data is lacking across much of the country, 2021. [Google Scholar]
- 43.National Center for Health Statistics . Provisional drug overdose death counts, 2021. [Google Scholar]
- 44.Garrote Sanchez D, et al. Who on earth can work from home? 2020. [Google Scholar]
- 45.Public Health England . Disparities in the risk and outcomes of COVID-19, 2020. [Google Scholar]
- 46.The New York Times . Nearly one-third of U.S. coronavirus deaths are linked to nursing homes. The New York Times, 2020. [Google Scholar]
- 47.Winskill P, et al. Report 22: equity in response to the COVID-19 pandemic: an assessment of the direct and indirect impacts on disadvantaged and vulnerable populations in low-and lower middle-income countries who collaborating centre for infectious disease modelling MRC centre for global infectious disease analysis, 2020. [Google Scholar]
- 48.Levin AT, Owusu-Boaitey N, Pugh S, et al. Assessing the burden of COVID-19 in developing countries: systematic review, meta-analysis and public policy implications. BMJ Glob Health 2022;7:e008477. 10.1136/bmjgh-2022-008477 [DOI] [PMC free article] [PubMed] [Google Scholar]
- 49.Nepomuceno MR, Acosta E, Alburez-Gutierrez D, et al. Besides population age structure, health and other demographic factors can contribute to understanding the COVID-19 burden. Proc Natl Acad Sci U S A 2020;117:13881–3. 10.1073/pnas.2008760117 [DOI] [PMC free article] [PubMed] [Google Scholar]
Associated Data
This section collects any data citations, data availability statements, or supplementary materials included in this article.
Supplementary Materials
bmjopen-2022-061589supp001.pdf (142KB, pdf)
Data Availability Statement
Data are available in a public, open access repository. The data availability section in the online appendix describes the data sources used for this study. Upon acceptance a link to a Github repository will be made available to facilitate replication.


