

Abstract
In patients with hypertension, left ventricular hypertrophy (LVH) represents a risk factor for cardiovascular disease and asymptomatic organ damage. Currently, electrocardiography (ECG) and two‐dimensional echocardiography (Echo) are the most widely used methods for LVH evaluation. This study aimed to compare the long‐term outcomes of LVH, as evaluated by ECG and Echo, in patients with hypertension. Patients diagnosed with hypertension as a primary disease between 2006 and 2011 were enrolled in the Korean Hypertension Cohort study. The study finally included 1743 patients who underwent both ECG and Echo. The primary endpoint was defined as the composite of major adverse cardiovascular events (MACEs) or death. Overall, LVH was identified in 747 patients. The patients were categorized into four groups according to the detection of LVH by ECG or Echo: No LVH (n = 996), LVH diagnosed by ECG alone (n = 181), LVH diagnosed by Echo alone (n = 415), LVH diagnosed by both ECG and Echo (n = 151). After adjusting for variables, the incidence of MACEs or death was significantly greater in patients with LVH diagnosed by ECG alone (hazards ratio [HR]: 1.69; 95% confidence interval [CI]: 1.22–2.35; P = .001), LVH diagnosed by Echo alone (HR: 1.54; 95% CI: 1.16–2.05; P = .002), and LVH diagnosed by both ECG and Echo (HR: 1.87; 95% CI: 1.18–2.94; P = .002) than in those with no LVH. Both ECG and Echo are efficient diagnostic tools for LVH and useful for long‐term risk stratification. Additional Echo evaluation for LVH is helpful for predicting long‐term outcomes only in patients without LVH diagnosis by ECG.
Keywords: echocardiography, electrocardiography, hypertension, left ventricular hypertrophy
1. INTRODUCTION
Left ventricular hypertrophy (LVH) is a well‐known risk factor for cardiovascular disease and asymptomatic organ damage in patients with hypertension. Therefore, it is necessary to evaluate the presence of LVH in these patients. Currently, electrocardiography (ECG) and two‐dimensional echocardiography (Echo) are the most widely used methods for LVH diagnosis. Although Echo is more expensive and time consuming, it is considered a more accurate test for diagnosing LVH than ECG. However, few studies have compared the effectiveness of these two methods. 1 , 2 , 3 , 4 , 5 , 6 Additionally, it remains unclear whether the diagnosis of LVH by Echo reflects its prognosis better than diagnosis of LVH by ECG alone. 7 If ECG is as diagnostically and prognostically effective as Echo for LVH in patients with hypertension, it might be able to reduce unnecessary examinations and save time and cost.
Therefore, this study aimed to compare the long‐term outcomes of LVH, as evaluated by ECG and Echo, in patients with hypertension.
2. METHODS
2.1. Study population
The Korean Hypertension Cohort (KHC) study integrated the detailed clinical and long‐term follow‐up data from six national university hospitals and the National Health Insurance System (NHIS) claims database, respectively. We collected information on patients treated for or newly diagnosed with hypertension in each hospital between 2006 and 2011. Details of the KHC have been published. 8 Hypertension was defined as systolic blood pressure (SBP)/diastolic blood pressure (DBP) at or above 140/90 mmHg without antihypertensive medications or SBP/DBP at or below 130/80 mmHg with antihypertensive medications. The cardiovascular disease, organ damage, and cardiovascular risk factors were defined based on the 2018 Korean Society of Hypertension Guidelines for the Management of Hypertension (Supplementary Table 1). 8 , 9 Exclusion criteria were patients under 30 years of age at the first visit and patients receiving antihypertensive treatment for the primary diagnosis of cardiovascular diseases other than hypertension (eg, beta‐blockers after myocardial infarction). The clinical data were collected through the electronic medical records of each hospital. We collected clinical and biochemical data, including repeated SBP, DBP, and heart rate measurements. Specialized laboratory data, such as ECG and Echo data, were also collected. In this study, 1743 patients who underwent both ECG and Echo were included in the final analysis. A flow diagram of the study participants is shown in Figure 1. The study protocols were approved by the Institutional Review Board of each participating hospital (No. KNUH 2019‐01‐036). The requirement for informed consent was waived by the board.
FIGURE 1.
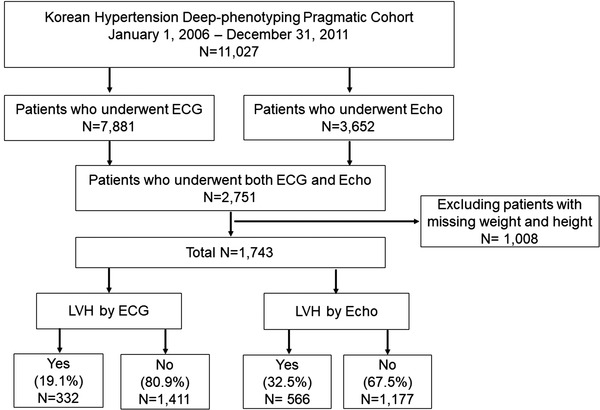
Flow chart of the selection of study participants. Abbreviations: ECG, electrocardiogram; Echo, echocardiography; LVH, left ventricular hypertrophy
2.2. LVH definition by ECG
A 12‐lead ECG was recorded at 25 mm/s and 1 mV/cm standardization using equipment with frequency response characteristics conforming to the recommendations of the American Heart Association. 10 ECG parameters included the voltages of the S waves of the leads V1 (SV1) and V3 (SV3), R waves of the leads V5 (RV5) and aVL (RaVL), and duration of the QRS wave. Several ECG indices, including the Sokolow–Lyon index, Cornell criterion, and Cornell QRS duration product criterion, were applied to assess high voltage in the left ventricle for LVH diagnosis. LVH was diagnosed as SV1 + RV5 ≥ 3.5 mV for the Sokolow–Lyon index, 7 SV3 + RaVL ≥ 2.8 mV in males, and ≥2.0 mV in females for the Cornell criterion, 11 or (SV3 + RaVL) × QRS duration ≥ 244 mV/ms in males and (SV3 + RaVL + 0.6) × QRS duration ≥ 244 mV/ms in females for the Cornell QRS duration product criterion. 12
2.3. LVH definition by Echo
For quality control, Echo measurement was performed by two independent sonographers who were blinded to the clinical information and ECG findings under the supervision of the attending physician according to the protocol of each institution's Echo laboratory. Left ventricular end‐diastolic diameter (LVEDd), diastolic posterior wall thickness (PWTd), and diastolic interventricular septum thickness (IVSTd) were imaged from a parasternal long‐axis window at the level of the mitral chordae using M‐mode echocardiography. Left ventricular (LV) mass was calculated using the American Society of Echocardiography‐cube formula: LV mass (g) = 0.8 × [1.04 × {(LVEDd + PWTd + IVSTd)3 − (LVEDd)3}] + 0.6. 13 LV mass was indexed for body surface area to obtain LV mass index. LVH was defined as an LV mass index > 115 g/m2 in men and > 95 g/m2 in women.
2.4. Primary outcome
The primary outcome was the composite of major adverse cardiovascular events (MACEs) or death. MACEs included heart failure requiring hospitalization, myocardial infarction, peripheral artery disease, ischemic stroke, hemorrhagic stroke, or end stage renal disease. The incidence of MACEs or death was compared according to the presence or absence of LVH diagnosed by ECG and/or Echo. Long‐term survival data over a period of approximately 10 years were obtained from the National Health Insurance Claim and National Health Examination databases.
2.5. Statistical analysis
Data were expressed as means ± standard deviations and percentages for continuous and categorical variables, respectively. Comparisons between baseline variables were performed using Student's t‐tests and Chi‐squared tests for continuous and categorical variables, respectively. If cells with an expected frequency of 5 or less exceeded 20%, Fisher's exact tests were performed instead of Chi‐squared tests. If normality tests were not significant, Wilcoxon's rank‐sum tests were performed instead of Student's t‐tests. Comparisons of numeric variables among four groups that were categorized based on the presence of LVH by ECG or Echo were performed using ANOVA test. All P‐values were two‐sided. A P‐value < .05 was considered statistically significant. Hazard ratios [HR] and corresponding 95% confidence intervals [CI] were calculated from the Cox proportional‐hazards analysis for risk of the primary outcome in the LVH group and compared to those in the non‐LVH group. Kaplan–Meier survival curves were used to analyze survival in the LVH and non‐LVH groups. When the proportional risk assumption was not met, HR for the risk of occurrence in the LVH group compared to the non‐LVH group, was performed using other statistical models, such as the Poisson model. The likelihood ratio test was performed to examine the incremental predictive value of the parameters in the Cox proportional‐hazards model. The factors added to the model at each step were considered significant when the test statistic, calculated as twice the difference in the log‐likelihood of each model, corresponded to P < .05. All statistical analyses were performed using SAS version 7.1 (SAS Institute, Cary, NC, USA) and R version 4.0.3 (R Core Team, 2021).
3. RESULTS
Baseline characteristics of the study participants (n = 1743) are shown in Table 1. The mean age was 61.0 ± 10.9 years, and 912 (52.3%) participants were male. The mean LV mass index, measured by Echo, was 97.7 ± 24.2 g/m2. Baseline SBP and DBP were 148.4 ± 17.7 mmHg and 87.1 ± 12.2 mmHg, respectively. Overall, LVH was identified in 747 (42.9%) participants. The participants were categorized into four groups according to the presence of LVH by ECG or Echo; No LVH (n = 996; 57.1%), LVH diagnosed by ECG alone (n = 181; 10.4%), LVH diagnosed by Echo alone (n = 415; 23.8%), LVH diagnosed by both ECG and Echo (n = 151; 8.7%). There was a significant minimal level of categorical agreement of LVH diagnosed by ECG or Echo (kappa = .13; accuracy = 65.8%; P < .001; Supplementary Figure 1).
TABLE 1.
Baseline characteristics of the study participants
| Variable | Total (no. = 1743) |
|---|---|
| Age (years) | 61.0 ± 10.9 |
| Male | 912 (52.3%) |
| Body mass index (kg/m2) | 25.5 ± 3.3 |
| Left ventricular mass by Echo (g/m2) | 97.7 ± 24.2 |
| Systolic blood pressure (mmHg) | 148.4 ± 17.7 |
| Diastolic blood pressure (mmHg) | 87.1 ± 12.2 |
| Heart rate (/min) | 76.5 ± 13.1 |
| Prior treatment of hypertension | 1073 (70.1%) |
| Family history of hypertension | 498 (39.5%) |
| Current smoking | 141 (11.4%) |
| Previous disease history | |
| Heart failure | 38 (2.1%) |
| Myocardial infarction | 225 (12.9%) |
| Peripheral artery disease | 51 (2.9%) |
| Hemorrhagic stroke | 1 (0.06%) |
| Ischemic stroke | 81 (4.6%) |
| End‐stage renal disease | 9 (0.5%) |
Data are expressed as mean ± standard deviation or number (percentage).
The baseline characteristics, laboratory findings, and medication use of patients with LVH diagnosed by ECG or Echo are shown in Supplementary Table 2. Patients with LVH diagnosed by ECG were more likely to be male (P < .001). In patients with LVH diagnosed by ECG, the LV mass index (P < .001) and SBP (P < .001) were significantly higher than the corresponding measurements in the other groups. Past history of prior treatment of hypertension (P = .004) and myocardial infarction (P = .048) were significantly lower than the corresponding measurements in the other groups. Patients with LVH diagnosed by Echo were older (P < .001) and more likely to be female (P < .001). In patients with LVH diagnosed by Echo, the LV mass index (P < .001), SBP (P < .001), and past history of end‐stage renal disease (P = .006) were significantly higher, whereas past history of myocardial infarction (P = .031) was significantly lower than the corresponding measurements in the other groups.
Baseline characteristics, laboratory findings, and medication use among the four groups are shown in Table 2. There were significant differences in age (P = .004) and sex (P < .0001) among the four groups. In patients with LVH diagnosed by both ECG and Echo, the LV mass index (P < .001), SBP (P < .0001), and past history of end‐stage renal disease (P = .009) were significantly higher compared with which patients with LVH diagnosis by Echo or ECG, whereas past history of myocardial infarction (P = .046) was significantly lower than the corresponding measurements in the other groups.
TABLE 2.
Baseline characteristics of the study participants according to LVH diagnosis by Echo or ECG
| Variable | LVH by both ECG and Echo (no. = 151) | LVH by ECG (no. = 181) | LVH by Echo (no. = 415) | No LVH (no. = 996) | P |
|---|---|---|---|---|---|
| Age (years) | 61.3 ± 11.9 | 60.4 ± 10.9 | 62.6 ± 11.1 | 60.3 ± 10.7 | .004 |
| Male | 78 (51.6%) | 130 (71.8%) | 129 (31.0%) | 575 (57.7%) | < .0001 |
| Body mass index (kg/m2) | 25.5 ± 3.3 | 24.7 ± 3.0 | 25.9 ± 3.5 | 25.5 ± 3.2 | .001 |
| Left ventricular mass index (g/m2) | 131.3 ± 25.7 | 90.0 ± 13.4 | 119.6 ± 18.6 | 84.9 ± 14.4 | < .001 |
| Systolic blood pressure (mmHg) | 153.3 ± 21.1 | 152.5 ± 19.5 | 150.6 ± 18.9 | 145.9 ± 15.7 | < .0001 |
| Diastolic blood pressure (mmHg) | 88.1 ± 14.4 | 88.4 ± 13.2 | 87.2 ± 12.9 | 86.7 ± 11.1 | .212 |
| Heart rate (/min) | 74.9 ± 12.9 | 75.7 ± 10.9 | 73.9 ± 12.9 | 78.1 ± 13.5 | .040 |
| Prior treatment of hypertension | 86 (66.1%) | 92 (60.5%) | 272 (72.7%) | 623 (71.3%) | .023 |
| Family history of hypertension | 42 (37.1%) | 52 (41.6%) | 103 (35.5%) | 301 (41.1%) | .351 |
| Current smoking | 13 (12.5%) | 18 (14.2%) | 19 (6.8%) | 91 (12.4%) | .012 |
| Previous disease history | |||||
| Heart failure | 5 (3.3%) | 6 (3.3%) | 9 (2.1%) | 18 (1.8%) | .449 |
| Myocardial infarction | 10 (6.6%) | 22 (12.1%) | 49 (11.8%) | 144 (14.4%) | .046 |
| Peripheral artery disease | 7 (4.6%) | 3 (1.6%) | 10 (2.4%) | 31 (3.1%) | .397 |
| Hemorrhagic stroke | 0 (0.0%) | 0 (0.0%) | 0 (0.0%) | 1 (0.1%) | > .999 |
| Ischemic stroke | 10 (6.6%) | 6 (3.3%) | 23 (5.7%) | 41 (4.1%) | .272 |
| End‐stage renal disease | 2 (1.3%) | 1 (0.5%) | 5 (1.2%) | 1 (0.1%) | .009 |
| Blood chemistry | |||||
| WBC (10 6 /L) | 6.8 ± 1.6 | 6.8 ± 1.7 | 6.5 ± 2.1 | 6.8 ± 2.1 | .122 |
| Hemoglobin (g/dL) | 14.0 ± 1.8 | 14.4 ± 1.4 | 13.3 ± 1.6 | 14.1 ± 1.6 | < .0001 |
| BUN (mg/dL) | 17.9 ± 7.2 | 15.5 ± 5.6 | 16.9 ± 7.3 | 16.1 ± 5.2 | .0007 |
| Creatinine (mg/dL) | 1.1 ± 0.6 | 1.0 ± 0.5 | 1.0 ± 0.6 | 1.0 ± 0.2 | .078 |
| Estimated GFR (mL/min) | 73.2 ± 21.0 | 79.5 ± 19.8 | 70.4 ± 19.9 | 74.8 ± 17.1 | < .0001 |
| Glucose (mg/dL) | 106.6 ± 28.6 | 107.8 ± 29.4 | 105.9 ± 26.8 | 109.5 ± 29.3 | .162 |
| Sodium (mEq/L) | 140.7 ± 3.8 | 141.1 ± 2.1 | 141.2 ± 2.2 | 140.9 ± 2.2 | .072 |
| Potassium (mEq/L) | 4.2 ± 0.4 | 4.2 ± 0.3 | 4.2 ± 0.4 | 4.2 ± 0.4 | .229 |
| AST (U/L) | 24.3 ± 9.4 | 25.9 ± 12.3 | 25.6 ± 17.4 | 25.3 ± 13.0 | .751 |
| ALT (U/L) | 25.2 ± 16.4 | 28.5 ± 19.8 | 26.2 ± 23.8 | 27.9 ± 20.6 | .271 |
| Total cholesterol (mg/dL) | 183.9 ± 39.9 | 189.2 ± 35.0 | 187.9 ± 38.3 | 189.6 ± 40.6 | .413 |
| Triglyceride (mg/dL) | 153.3 ± 107.4 | 162.8 ± 106.4 | 144.3 ± 88.4 | 155.0 ± 96.0 | .169 |
| HDL cholesterol (mg/dL) | 50.9 ± 13.8 | 49.8 ± 13.8 | 51.2 ± 13.7 | 50.6 ± 14.1 | .74 |
| LDL cholesterol (mg/dL) | 108.0 ± 29.7 | 114.2 ± 34.0 | 110.6 ± 34.1 | 114.9 ± 35.8 | .106 |
| Antihypertensive drugs | |||||
| Thiazide/thiazide‐like diuretic | 42 (27.8%) | 42 (23.2%) | 121 (29.1%) | 210 (21.0%) | .007 |
| CCB | 90 (59.6%) | 106 (58.5%) | 254 (61.2%) | 542 (54.4%) | .098 |
| ACE‐I | 16 (10.6%) | 8 (4.4%) | 28 (6.7%) | 45 (4.5%) | .012 |
| ARB | 91 (60.2%) | 100 (55.2%) | 261 (62.8%) | 579 (57.1%) | .256 |
| Beta‐blocker | 66 (43.7%) | 70 (38.6%) | 147 (35.4%) | 341 (34.2%) | .119 |
| Aldosterone antagonist | 1 (0.6%) | 5 (2.7%) | 11 (2.6%) | 18 (1.8%) | .393 |
| Alpha‐blocker | 3 (1.9%) | 3 (1.6%) | 7 (1.6%) | 9 (0.9%) | .476 |
| Single‐pill combination | .090 | ||||
| ACE‐I/ARB with CCB | 27 (17.8%) | 29 (16.0%) | 50 (12.0%) | 152 (15.2%) | |
| ARB with diuretic | 26 (17.2%) | 22 (12.1%) | 81 (19.5%) | 145 (14.5%) | |
| Other | 3 (1.9%) | 3 (1.6%) | 5 (1.2%) | 30 (3.0%) |
Abbreviations: ACE‐I, angiotensin‐converting enzyme inhibitor; ALT, alanine transferase; ARB, angiotensin receptor blocker; AST, aspartate aminotransferase; BMI, body mass index; BUN, blood urea nitrogen; CCB, calcium channel blocker; DBP, diastolic blood pressure; ECG, electrocardiogram; Echo, echocardiography; GFR, glomerular filtration rate; HDL, high‐density lipoprotein; HTN, hypertension;If cells with an expected frequency of 5 or less exceeded 20%. Fisher's exact test was performed instead of Chi‐squared test ;If the normality test was not significant, Wilcoxon's rank‐sum test was performed instead of Student's t‐test.; LDL, low‐density lipoprotein; LVH, left ventricular hypertrophy; SBP, systolic blood pressure; WBC, white blood cell.
MACEs or death occurred in 573 (32.8%) patients. Age (P < .001), LV mass index (P = .0002), and past history of myocardial infarction (P < .001), ischemic stroke (P = .001), and end‐stage renal disease (P = .007) were significantly higher in patients with MACEs or death than in those without these outcomes (Table 3). In the Kaplan–Meier survival curve analysis, there was a significant difference in MACEs or death among the groups based on the presence of LVH diagnosed by ECG or Echo (log‐rank P = .02) (Figure 2). Compared with patients without LVH diagnosis, MACEs or death were significantly higher in patients with LVH diagnosed by ECG or Echo (36.8% vs. 29.6%, log‐rank P= .001), LVH diagnosed by ECG alone (34.9% vs. 29.6%, log‐rank P = .02), LVH diagnosed by Echo alone (37.8% vs. 29.6%, log‐rank P= .003), and LVH diagnosed by ECG and Echo (37.1% vs. 29.6%, log‐rank P= .05) (Supplementary Figure 2). In the Cox proportional‐hazards model, LVH diagnosed by ECG or Echo (adjusted HR:1.52; 95% CI:1.18 – 1.97; P= .001), LVH diagnosed by ECG alone (adjusted HR: 1.69; 95% CI: 1.22 – 2.35; P= .001), LVH diagnosed by Echo alone (adjusted HR: 1.54; 95% CI: 1.16 – 2.05; P= .002), and LVH diagnosed by both ECG and Echo (adjusted HR: 1.87; 95% CI: 1.18 – 2.94; P= .007) were independent predictors of MACEs or death after adjusting for confounding variables (Table 4; Supplementary Tables 3 to 6).
TABLE 3.
Baseline characteristics of the study participants according to the occurrence of MACEs or death
| MACEs or death | |||
|---|---|---|---|
| Variable | Yes (no. = 573) | No (no. = 1170) | P |
| Age (years) | 64.7 ± 10.3 | 59.1 ± 10.8 | < .001 |
| Male | 314 (54.8%) | 598 (51.1%) | .147 |
| Body mass index (kg/m2) | 25.3 ± 3.1 | 25.6 ± 3.379 | .107 |
| Left ventricular mass index | 101.0 ± 25.6 | 96.1 ± 23.4 | .0002 |
| Systolic blood pressure (mmHg) | 147.9 ± 16.8 | 148.5 ± 18.1 | .593 |
| Diastolic blood pressure (mmHg) | 84.7 ± 10.8 | 88.3 ± 12.7 | < .001 |
| Heart rate (/min) | 74.3 ± 14.0 | 77.5 ± 12.6 | .06 |
| Prior treatment of hypertension | 369 (71.5%) | 704 (69.5%) | .415 |
| Family history of hypertension | 162 (37.4%) | 336 (40.6%) | .260 |
| Current smoking | 53 (12.6%) | 88 (10.8%) | .623 |
| Left ventricular hypertrophy | .009 | ||
| Both ECG and Echo | 56 (9.7%) | 95 (8.1%) | |
| ECG alone | 62 (10.8%) | 119 (10.1%) | |
| Echo alone | 159 (27.7%) | 256 (21.8%) | |
| None | 296 (51.6%) | 700 (59.8%) | |
| Previous disease history | |||
| Heart failure | 16 (2.7%) | 22 (1.8%) | .220 |
| Myocardial infarction | 121 (21.1%) | 104 (8.8%) | < .001 |
| Peripheral artery disease | 21 (3.6%) | 30 (2.5%) | .200 |
| Hemorrhagic stroke | 0 (0.0%) | 1 (0.08%) | > .999 |
| Ischemic stroke | 40 (6.9%) | 41 (3.5%) | .001 |
| End‐stage renal disease | 7 (1.2%) | 2 (0.1%) | .007 |
| Blood chemistry | |||
| WBC (10 6 /L) | 6.9 ± 2.0 | 6.7 ± 2.1 | .014 |
| Hemoglobin (g/dl) | 13.6 ± 1.8 | 14.1 ± 1.5 | < .001 |
| BUN (mg/dL) | 18.0 ± 7.9 | 15.6 ± 4.7 | < .001 |
| Creatinine (mg/dL) | 1.1 ± 0.7 | 0.9 ± 0.2 | < .001 |
| Estimated GFR (mL/min) | 69.3 ± 19.8 | 76.5 ± 17.5 | < .001 |
| Glucose (mg/dL) | 112.8 ± 32.1 | 106.0 ± 26.6 | < .001 |
| Sodium (mEq/L) | 140.7 ± 2.7 | 141.2 ± 2.2 | .0008 |
| Potassium (mEq/L) | 4.3 ± 0.4 | 4.2 ± 0.3 | .014 |
| AST (U/L) | 25.5 ± 16.7 | 25.3 ± 12.2 | .158 |
| ALT (U/L) | 26.3 ± 21.4 | 27.9 ± 20.9 | .005 |
| Total cholesterol (mg/dL) | 182.4 ± 38.6 | 191.8 ± 39.5 | < .001 |
| Triglyceride (mg/dL) | 158.0 ± 103.0 | 150.9 ± 93.1 | .399 |
| HDL cholesterol (mg/dL) | 48.8 ± 12.9 | 51.5 ± 14.4 | < .001 |
| LDL cholesterol (mg/dL) | 107.5 ± 34.1 | 116.0 ± 34.9 | < .001 |
| Antihypertensive drugs | |||
| Thiazide/thiazide‐like diuretic | 144 (25.1%) | 271 (23.1%) | .364 |
| CCB | 337 (58.8%) | 655 (55.9%) | .262 |
| ACE‐I | 45 (7.8%) | 52 (4.4%) | .003 |
| ARB | 333 (58.1%) | 698 (59.6%) | .538 |
| Beta‐blocker | 256 (44.6%) | 368 (31.4%) | < .001 |
| Aldosterone antagonist | 12 (2.0%) | 23 (1.9%) | .857 |
| Alpha‐blocker | 14 (2.4%) | 8 (0.6%) | .002 |
| Single pill combination | .109 | ||
| ACE‐I/ARB with CCB | 72 (12.5%) | 186 (15.9%) | |
| ARB with diuretic | 93 (16.2%) | 181 (15.4%) | |
| Other | 9 (1.5%) | 32 (2.7%) | |
If cells with an expected frequency of 5 or less exceed 20%, Fisher's exact test will be performed instead of Chi‐squared test.
If normality test is not significant, Wilcoxon's rank sum test will be performed instead of Student's t‐test.
Abbreviations: ACE‐I, angiotensin‐converting enzyme inhibitor; ALT, alanine transferase; ARB, angiotensin receptor blocker; AST, aspartate aminotransferase; BMI, body mass index; BUN, blood urea nitrogen; CCB, calcium channel blocker; DBP, diastolic blood pressure; ECG, electrocardiogram; Echo, echocardiography; GFR, glomerular filtration rate; HDL, high‐density lipoprotein; HTN, hypertension; LDL, low‐density lipoprotein; LVH, left ventricular hypertrophy; MACEs, major adverse cardiovascular events; SBP, systolic blood pressure; WBC, white blood cell.
FIGURE 2.

Kaplan–Meier survival curve for MACEs or death among the four groups based on the presence of LVH diagnosed by Echo or ECG. Abbreviations: ECG, electrocardiogram; Echo, echocardiography; LVH, left ventricular hypertrophy; MACEs, major adverse cardiovascular events
TABLE 4.
Cox proportional hazard model for major adverse cardiovascular event by LVH category
| Variable | Univariable | Multivariable | ||
|---|---|---|---|---|
| Crude HR (95% CI) | P | *Adjusted HR (95% CI) | P | |
| LVH category | ||||
| No LVH | 1 (ref) | 1 (ref) | ||
| LVH by ECG alone | 1.29 (1.04 ‐ 1.59) | .02 | 1.69 (1.22 ‐ 2.35) | .001 |
| LVH by Echo alone | 1.31 (1.10 ‐ 1.56) | .002 | 1.54 (1.16 ‐ 2.05) | .002 |
| LVH by ECG or Echo | 1.30 (1.10 ‐ 1.53) | .002 | 1.52 (1.18 ‐ 1.97) | .001 |
| LVH by ECG and Echo | 1.31 (0.99 ‐ 1.75) | .058 | 1.87 (1.18 ‐ 2.94) | .007 |
Abbreviations: ECG, electrocardiogram; Echo, echocardiography; HR, hazard ratio; LVH, left ventricular hypertrophy.
*Variables used in this multivariate analysis are shown in supplementary Table 3–6.
The incremental predictive values of the conventional risk factors, LVH diagnosed by ECG and LVH diagnosed by Echo, in the Cox proportional‐hazards model are shown in the Figure 3. There was no significant difference in the predictive value for MACEs or death between LVH diagnosed by ECG and LVH diagnosed by Echo when added to the conventional risk factors (P= .07). LVH diagnosed by Echo added incremental value to the combination of LVH diagnosed by ECG and conventional risk factors in predicting long‐term MACEs or death (P= .016). However, additional diagnosis of LVH by Echo was significantly associated with MACEs or death only in patients without LVH diagnosed by ECG (29.6% vs. 38.1%, log‐rank P= .005), but not in patients with LVH diagnosed by ECG (37.2% vs. 33.2%, log‐rank P= .80) (Figure 4).
FIGURE 3.

Incremental predictive value of conventional risk factors, ECG, and Echo by the Cox proportional‐hazards model. Abbreviations: ECG, electrocardiogram; Echo, echocardiography; LVH, left ventricular hypertrophy
FIGURE 4.

Kaplan–Meier survival curve for MACEs or death between patients with and without LVH diagnosed by ECG according to the absence (A) or presence (B) of LVH diagnosed by Echo. Abbreviations: ECG, electrocardiogram; Echo, echocardiography; LVH, left ventricular hypertrophy. MACEs, major adverse cardiovascular events
4. DISCUSSION
In the present study, approximately 40% of patients with hypertension had LVH diagnosed by ECG or Echo. LVH diagnosis by ECG and that by Echo also showed significant minimal level of agreement. Furthermore, LVH diagnosis by ECG and/or Echo were both independent prognostic factors for long‐term outcomes. Finally, the additional use of Echo with ECG to diagnose LVH had an incremental predictive value only in patients without LVH diagnosed by ECG.
LVH in patients with hypertension is well‐known to be associated with cardiovascular mortality and morbidities. 14 , 15 , 16 Therefore, the current guidelines for the management of hypertension recommend 12‐lead ECG and two‐dimensional Echo to detect the presence of LVH. 17 , 18 A novel finding of our study is that we investigated whether additional Echo in patients with hypertension who underwent ECG could improve the accuracy of the LVH diagnosis or better reflect the long‐term prognosis of LVH.
First, we compared the diagnostic accuracy of ECG and Echo for LVH. To detect the presence of LVH, ECG is recommended for routine workup of patients with hypertension based on simple criteria, such as the Sokolow–Lyon index, Cornell index, and Cornell voltage duration product criteria. However, the sensitivity of ECG for LVH diagnosis is limited. Therefore, the current guidelines recommend Echo as an additional diagnostic test to improve the diagnostic accuracy for LVH. Furthermore, Echo could provide additional information, such as the LV geometry, left atrial volume, LV systolic and diastolic function, and others relevant parameters. Moreover, in previous studies, the degree of agreement between LVH diagnosis by ECG and Echo was relatively low. 19 , 20 In contrast, the present study showed that LVH diagnosed by ECG showed minimal but significant level of agreement with LVH diagnosed by Echo. Therefore, it remains unclear whether Echo, which requires additional time and cost, should be performed in all patients with simple hypertension to diagnose LVH. We need to consider the patient population which may require additional Echo examination to improve prognosis.
Second, we compared LVH diagnosed by ECG and Echo for their predictive values for MACEs or death. Early LVH diagnosis helps to reduce the incidence of cardiovascular events. 21 , 22 , 23 LVH diagnoses by ECG and Echo are both significantly associated with the occurrence of sudden cardiac arrest and congestive heart failure. 2 , 20 Although some studies have shown that LVH diagnosis by Echo is a better predictor of cardiovascular events compared to LVH diagnosis by ECG, 19 , 24 few studies have investigated whether additional Echo is necessary to stratify the cardiovascular risk in patients with hypertension who have undergone ECG. 24 , 25 , 26 Similar to previous studies, LVH diagnosed by ECG and/or LVH diagnosed by Echo were both significantly associated with MACEs or death in the present study. Furthermore, since additional Echo evaluation for LVH, in combination with conventional risk factors and ECG, was helpful for long‐term outcome prediction, 19 , 20 , 21 , 22 , 23 , 24 , 25 , 26 clinicians may wonder whether additional Echo examination will be required to predict long‐term prognosis in all patients with hypertension, including those with LVH diagnosed by ECG. Additional LVH diagnosis by Echo was helpful to predict long‐term MACEs or death in patients without LVH diagnosed by ECG, but not in those with LVH diagnosed by ECG. Therefore, the results of our study provide evidence that patients who were previously diagnosed with LVH by ECG through routine screening do not require an additional diagnostic test for identifying LVH by Echo.
This study has certain limitations. First, due to the observational nature of the KHC study, we cannot exclude the possibility of residual confounding factors. Therefore, our results require further validation. Second, the study population only included patients with hypertension from six national university hospitals of the Korean healthcare system. Therefore, it is difficult to generalize these findings. Third, ethnic differences should be considered in LVH studies. In this regard, most studies on LVH prognosis have been conducted involving Caucasian participants. As the body mass index and body surface area of Caucasians differ from those of Koreans, the Western diagnostic criteria for LVH may not be applicable to Koreans. Fourth, since this analysis was performed based on chart review without external prospective ascertainment, the results need to be interpreted with caution. Despite these limitations, this study provides important long‐term outcome data over a period of approximately 10 years obtained from the National Health Insurance Claim and National Health Examination of patients from multiple national university hospitals.
In conclusion, ECG and Echo are both efficient diagnostic tools for LVH. These methods are useful for long‐term risk prediction in patients with hypertension. Additional Echo evaluation for LVH can be helpful for predicting long‐term outcomes only in patients without LVH diagnosed by ECG.
CONFLICT OF INTEREST
All authors have nothing to disclose.
Supporting information
Supporting infromation
Supporting infromation
Supporting infromation
ACKNOWLEDGMENTS
This research was supported by the National Evidence‐based Healthcare Collaborating Agency (NECA) and the Ministry of Health and Welfare (grant number NA20‐001).
Park BE, Lee JH, Jang SY, et al. Comparison of the efficiency between electrocardiogram and echocardiogram for left ventricular hypertrophy evaluation in patients with hypertension: Insight from the Korean Hypertension Cohort Study. J Clin Hypertens. 2022;24:1451–1460. 10.1111/jch.14583
REFERENCES
- 1. Bluemke DA, Kronmal RA, Lima JA, et al. The relationship of left ventricular mass and geometry to incident cardiovascular events: the MESA (Multi‐Ethnic Study of Atherosclerosis) study. J Am Coll Cardiol. 2008;52:2148‐2155. [DOI] [PMC free article] [PubMed] [Google Scholar]
- 2. Narayanan K, Reinier K, Teodorescu C, et al. Electrocardiographic versus echocardiographic left ventricular hypertrophy and sudden cardiac arrest in the community. Heart Rhythm. 2014;11:1040‐1046. [DOI] [PMC free article] [PubMed] [Google Scholar]
- 3. Hsieh BP, Pham MX, Froelicher VF. Prognostic value of electrocardiographic criteria for left ventricular hypertrophy. Am Heart J. 2005;150:161‐167. [DOI] [PubMed] [Google Scholar]
- 4. Verdecchia P, Schillaci G, Borgioni C, et al. Prognostic significance of serial changes in left ventricular mass in essential hypertension. Circulation. 1998;97:48‐54. [DOI] [PubMed] [Google Scholar]
- 5. Jiang X, Quan X, Yang J, Zhou X, Hu A, Zhang Y. Electrocardiographic criteria for the diagnosis of abnormal hypertensive cardiac phenotypes. J Clin Hypertens (Greenwich). 2019;21:372‐378. [DOI] [PMC free article] [PubMed] [Google Scholar]
- 6. Bang CN, Soliman EZ, Simpson LM, et al. Electrocardiographic left ventricular hypertrophy predicts cardiovascular morbidity and mortality in hypertensive patients: the ALLHAT study. Am J Hypertens. 2017;30:914‐922. [DOI] [PMC free article] [PubMed] [Google Scholar]
- 7. Marwick TH, Gillebert TC, Aurigemma G, et al. Recommendations on the use of echocardiography in adult hypertension: a report from the European Association of Cardiovascular Imaging (EACVI) and the American Society of Echocardiography (ASE). J Am Soc Echocardiogr. 2015;28:727‐754. [DOI] [PubMed] [Google Scholar]
- 8. Lee HY, Lee JY, Shin HG, et al. The Korean hypertension cohort study: design and baseline characteristics. Korean J Intern Med. 2021;36:1115‐1125. [DOI] [PMC free article] [PubMed] [Google Scholar]
- 9. Lee HY, Shin J, Kim GH, et al. Korean society of hypertension guidelines for the management of hypertension: part II‐diagnosis and treatment of hypertension. Clin Hypertens. 2019;25:20. [DOI] [PMC free article] [PubMed] [Google Scholar]
- 10.Report of committee on electrocardiography, American Heart Association . Recommendations for standardization of leads and of specifications for instruments in electrocardiography and vectorcardiography. Circulation. 1967;35:583‐602. [DOI] [PubMed] [Google Scholar]
- 11. Casale PN, Devereux RB, Kligfield P, et al. Electrocardiographic detection of left ventricular hypertrophy: development and prospective validation of improved criteria. J Am Coll Cardiol. 1985;6:572‐580. [DOI] [PubMed] [Google Scholar]
- 12. Molloy TJ, Okin PM, Devereux RB, Kligfield P. Electrocardiographic detection of left ventricular hypertrophy by the simple QRS voltage‐duration product. J Am Coll Cardiol. 1992;20:1180‐1186. [DOI] [PubMed] [Google Scholar]
- 13. Lang RM, Badano LP, Mor‐Avi V, et al. Recommendations for cardiac chamber quantification by echocardiography in adults: an update from the American society of echocardiography and the European association of cardiovascular imaging. Journal of the American Society of Echocardiography. 2015;28:1‐39. [DOI] [PubMed] [Google Scholar]
- 14. Rapsomaniki E, Timmis A, George J, et al. Blood pressure and incidence of twelve cardiovascular diseases: lifetime risks, healthy life‐years lost, and age‐specific associations in 1·25 million people. Lancet. 2014;383:1899‐1911. [DOI] [PMC free article] [PubMed] [Google Scholar]
- 15. Lavie CJ, Patel DA, Milani RV, Ventura HO, Shah S, Gilliland Y. Impact of echocardiographic left ventricular geometry on clinical prognosis. Prog Cardiovasc Dis. 2014;57:3‐9. [DOI] [PubMed] [Google Scholar]
- 16. SPRINT Research Group , Wright JT Jr, Williamson JD, Whelton PK, et al, SPRINT Research Group . A randomized trial of intensive versus standard blood‐pressure control. N Engl J Med. 2015;373:2103‐2016. [DOI] [PMC free article] [PubMed] [Google Scholar]
- 17. Whelton PK, Carey RM, Aronow WS, et al. 2017 ACC/AHA/AAPA/ABC/ACPM/AGS/APhA/ASH/ASPC/NMA/PCNA guideline for the prevention, detection, evaluation, and management of high blood pressure in adults: executive summary: a report of the American college of cardiology/American heart association task force on clinical practice guidelines. J Am Soc Hypertens. 2018;12:579.e1‐579.e73. [DOI] [PubMed] [Google Scholar]
- 18. Williams B, Mancia G, Spiering W, et al. Authors/Task Force Members: 2018 ESC/ESH Guidelines for the management of arterial hypertension: the Task Force for the management of arterial hypertension of the European Society of Cardiology and the European Society of Hypertension: the Task Force for the management of arterial hypertension of the European Society of Cardiology and the European Society of Hypertension. J Hypertens. 2018;36:1953‐2041. [DOI] [PubMed] [Google Scholar]
- 19. Sundstrom J, Lind L, Arnlov J, Zethelius B, Andren B, Lithell HO. Echocardiographic and electrocardiographic diagnoses of left ventricular hypertrophy predict mortality independently of each other in a population of elderly men. Circulation. 2001;103:2346‐2351. [DOI] [PubMed] [Google Scholar]
- 20. Almahmoud MF, O'Neal WT, Qureshi W, Soliman EZ. Electrocardiographic versus echocardiographic left ventricular hypertrophy in prediction of congestive heart failure in the elderly. Clin Cardiol. 2015;38:365‐370. [DOI] [PMC free article] [PubMed] [Google Scholar]
- 21. Soliman EZ, Ambrosius WT, Cushman WC, et al, SPRINT Research Study Group . Effect of intensive blood pressure lowering on left ventricular hypertrophy in patients with hypertension: sPRINT (Systolic Blood Pressure Intervention Trial). Circulation. 2017;136:440‐450. [DOI] [PMC free article] [PubMed] [Google Scholar]
- 22. Wachtell K, Okin PM, Olsen MH, et al. Regression of electrocardiographic left ventricular hypertrophy during antihypertensive therapy and reduction in sudden cardiac death: the LIFE Study. Circulation. 2007;116:700‐705. [DOI] [PubMed] [Google Scholar]
- 23. Okin PM, Devereux RB, Harris KE, et al, LIFE Study Investigators . Regression of electrocardiographic left ventricular hypertrophy is associated with less hospitalization for heart failure in hypertensive patients. Ann Intern Med. 2007;147:311‐319. [DOI] [PubMed] [Google Scholar]
- 24. Levy D, Garrison RJ, Savage DD, Kannel WB, Castelli WP. Left ventricular mass and incidence of coronary heart disease in an elderly cohort. The Framingham Heart Study. Ann Intern Med. 1989;110:101‐107. [DOI] [PubMed] [Google Scholar]
- 25. Aronow WS, Ahn C, Kronzon I, Koenigsberg M. Congestive heart failure, coronary events and atherothrombotic brain infarction in elderly blacks and whites with systemic hypertension and with and without echocardiographic and electrocardiographic evidence of left ventricular hypertrophy. Am J Cardiol. 1991;67:295‐299. [DOI] [PubMed] [Google Scholar]
- 26. Desai CS, Bartz TM, Gottdiener JS, Lloyd‐Jones DM, Gardin JM. Usefulness of left ventricular mass and geometry for determining 10‐year prediction of cardiovascular disease in adults aged >65 years (from the cardiovascular health study). Am J Cardiol. 2016;118:684‐690. [DOI] [PMC free article] [PubMed] [Google Scholar]
Associated Data
This section collects any data citations, data availability statements, or supplementary materials included in this article.
Supplementary Materials
Supporting infromation
Supporting infromation
Supporting infromation