

Abstract
Objective
To estimate the effects of Children's Health Insurance Reauthorization Act (CHIPRA), a policy that provided states the option to extend Medicaid/CHIP eligibility to immigrant children who have not been legal residents for five years or more, on insurance coverage, access, utilization, and health outcomes among immigrant children.
Data Sources
Restricted use 2000–2016 National Health Interview Survey (NHIS).
Study Design
We used a difference‐in‐differences design that compared changes in CHIPRA expansion states to changes in non‐expansion states.
Data Collection
Our sample included immigrant children who were born outside the US, aged 0–18 with family income below 300% of the Federal Poverty Level (FPL). Subgroup analyses were conducted across states that did and did not have a similar state‐funded option prior to CHIPRA (state‐funded vs. not state‐funded), by the length of time in the US (5 years vs. 5–14 years), and global region of birth (Latin American vs. Asian countries).
Principle Findings
We found that CHIPRA was associated with a significant 6.35 percentage point decrease in uninsured rates (95% CI: −11.25, −1.45) and an 8.1 percentage point increase in public insurance enrollment for immigrant children (95% CI: 1.26, 14.98). However, the effects of CHIPRA became small and statistically not significant 3 years after adoption. Effects on public insurance coverage were significant in states without state‐funded programs prior to CHIPRA (15.50 percentage points; 95% CI:8.05, 22.95) and for children born in Asian countries (12.80 percentage points; 95% CI: 1.04, 24.56). We found no significant changes in health care access and utilization, and health outcomes, overall and across subgroups due to CHIPRA.
Conclusions
CHIPRA's eligibility expansion was associated with increases in public insurance coverage for low‐income children, especially in states where CHIPRA represented a new source of coverage versus a substitute for state‐funded coverage. However, we found evidence of crowd‐out in certain subgroups and no effect of CHIPRA on access to care and health. Our results suggest that public coverage may be an important tool for promoting the well‐being of immigrant children but other investments are still needed.
Keywords: child, emigrants and immigrants, Medicaid, medically uninsured
What is known on this topic
Children's Health Insurance Program Reauthorization Act of 2009 provided states the option to extend Medicaid/CHIP eligibility to immigrant children who had not resided in the US for five years (i.e., the “five‐year bar”).
Studies found CHIPRA was associated with a 10 percentage point decrease in the uninsured rate of immigrant children.
Existing work focused on the earliest CHIPRA adoption states and found there is no evidence that later adopting states had higher uninsured rates or that program effects were persistent.
What this study adds
The effect of CHIPRA was strong during the first three years of adoption but diminished with time.
States that covered immigrant children under the five‐year bar prior to CHIPRA experienced smaller effects than states that did not have pre‐existing programs.
1. INTRODUCTION
Nearly 2.5 million children in the United States are foreign‐born. 1 Immigrant children face several barriers to health care access including economic status, language difficulties, acculturation pressures, and xenophobia. 2 , 3 , 4 , 5 , 6 , 7 Compared to US‐born children, foreign‐born immigrant children are less likely to have health insurance or access to health services even when insured. 8 , 9
Immigrant children also face explicit legal barriers to enrolling in public programs. The Personal Responsibility and Work Opportunity Act (PRWORA) of 1996 excluded all immigrants with less than five years of legal permanent residency from federally funded safety‐net programs like Medicaid and the Children's Health Insurance Program—a policy known as the as the “five‐year bar”. 10 Lurie found PRWORA was associated with a 10 percentage point increase in uninsurance among immigrant children. 10 Kaushal and Kaestner found that PRWORA increased the proportion of unmarried immigrant women that were uninsured by 10.7 percentage points. 11
In response to the five‐year bar, 21 states and the District of Columbia (DC) created state‐funded insurance programs for low‐income immigrant children with less than 5 years of legal residence. 12 Research found that immigrant children living in states with state‐funded insurance programs had higher rates of being insured and better access to care. 13 In addition, immigrant children used more preventive and ambulatory care than children in states that did not provide such programs. 13 However, the overall effects of state‐funded insurance programs were limited because state‐funded programs were unable to cover the full eligibility and benefits provided by federally supported Medicaid/CHIP programs. 13 , 14 From 2000 to 2009, the proportion of low‐income US‐born children without insurance decreased by 50%. In comparison, low‐income immigrant children experienced a 16% reduction. 13 , 15 , 16
The Children's Health Insurance Program Reauthorization Act (CHIPRA) of 2009 was the first major legislation during President Obama's first year in office. 17 Under CHIPRA's option 214 (“the CHIPRA option”), states could eliminate the five‐year bar and obtain federal funding to cover previously excluded children through a separate Medicaid waiver. 17 21 states and DC immediately adopted CHIPRA's option in January 2010 and 14 more states adopted between 2011 and 2016.
A handful of studies have examined the impact of the CHIPRA option on immigrant children and pregnant women. Saloner et al. used a triple‐difference strategy and 3 waves of the National Survey of Children's Health to find that CHIPRA adoption was associated with a 14.9‐percentage‐point increase in the insured rate and a 13.7‐ percentage‐point‐decline in unmet health care needs among immigrant children. 14 In a similar study, Mahmud used data from the Current Population Survey and found that CHIPRA was associated with an 8 percentage point decrease in the uninsured rate among immigrant children. 18 A more recent study examined the effects of the CHIPRA option on immigrant children's interstate migration patterns but did not find evidence of an association. 19 Lastly, Wherry et al. found CHIPRA was positively associated with prenatal care use among immigrant pregnant women but had no effect on birth outcomes. 20
While these studies provide important insights about the effects of CHIPRA, they leave several important questions unanswered. First, both Saloner et al. and Mahmud focused on states that expanded CHIPRA in 2010. The estimated effects of CHIPRA in 2010 adoption states might not generalize to later adopting states. Furthermore, it is unclear if estimated coverage gains found in previous work persisted over‐time, especially in the context of the economic recovery that followed the Great Recession.
Second, it is unclear how state‐funded insurance programs may moderate the effects of CHIPRA. On one hand, CHIPRA's impact may be smaller in states with pre‐existing programs if CHIPRA primarily acted as a substitute. On the other hand, CHIPRA could have larger effects if state‐funded programs “primed the pump” through establishing effective outreach strategies or through fostering network effects in immigrant communities. 21 Saloner et al. estimated average effects across states with and without a program. Mahmud attempted to estimate effects separately in states with and without a program. However, findings were inconclusive because only 3 of 22 CHIPRA adoption states at the time of the study lacked a state‐funded program.
Third, the effects of CHIPRA across subgroups of children have been understudied. For instance, compared to other immigrants, Latino immigrant adults tend to have fewer years of schooling, are less likely to have legal US residency, and are less likely to be English proficient. 22 , 23 , 24 Such factors could negatively impact their ability to enroll their children in available health insurance plans. Another factor that could moderate CHIPRA's effect is time spent in the US (as distinct from to time as a legal resident). Years lived in the US is correlated with acculturation and English proficiency which might facilitate take‐up. 5 , 25 , 26 , 27
Finally, the effect of CHIPRA on the health of immigrant children remains an open question. Cousineau et al. found the California Children's Health Initiatives (CHI), which provided public insurance coverage options to all children regardless immigration status, was associated with reduction in preventable hospitalization. 28 However, it is difficult to establish a link between public coverage and the health status of children over shorter time horizons. 29
In this study, we revisit the effects of the CHIPRA option on immigrant children's access to health insurance, access to care, and health outcomes. Our study includes the 35 states and DC that adopted the option between 2010 and 2016.The latest econometric techniques were applied to handle variation in treatment timing. 30 , 31 We estimate effects separately for Latino and Asian immigrant children, in states with and without pre‐existing state‐funded programs, and by length of US residency.
2. METHODS
2.1. Data
We used the restricted version of the National Health Interview Survey (NHIS) for years 2000–2016. 32 The NHIS is an on‐going cross‐sectional survey sponsored by the Centers for Disease and Prevention (CDC). Data are collected from personal interviews that gather information on every member of a sampled household. All household children provide key information about demographics, health insurance status, and immigration status. Available immigration‐related measures include country of birth, US citizenship, and years lived in the US. The survey does not gather information on legal residency status. More extensive information such as usual source of care, health care utilization, and specific physical and mental health conditions is collected from one randomly selected child per family (the “sample child”). 32
We created a state‐by‐year policy dataset by consolidating policy information from various reports by the Kaiser Family Foundation, Migration Policy Institute, Urban Institute, and Medicaid.gov.The dataset includes the following: (1) whether states provided state‐funded insurance programs covering immigrant children under the five‐year bar prior to CHIPRA adoption, and (2) whether states adopted CHIPRA. Using state identifiers, this dataset was merged with restricted NHIS data by an analyst from the National Center for Health Statistics Research Data Center. All analyses were performed in the US Census Bureau's Federal Statistical Research Data Center, and all study results were reviewed and approved for disclosure risk by the National Center for Health Statistics. The University of Maryland Institutional Review Board determined the study was exempt.
2.2. Study population
Our sample consisted of immigrant children, defined as children born outside the US that were non‐US citizens at the time of interview. We limited our main sample to immigrant children who were less than 18 years of age with family incomes less than 300% of the Federal Poverty Level (FPL). 14 , 18 We selected this income threshold to capture children who were most likely to be eligible based on income. 14 Our analytical sample consisted of 12,448 children.
2.3. Dependent variables
We examined three categories of dependent variables. First, we examined three binary outcomes related to point‐in‐time health insurance coverage: (1) uninsured, (2) publicly insured (Medicaid/CHIP/Other state programs), and (3) privately insured at time of interview. We excluded individuals who reported both public and private insurance coverage simultaneously. Second, we assessed binary outcomes related to access to care: (1) having a usual source of care, and (2) needed but could not afford medical care in the past 12 months. Lastly, we examined three health outcomes: (1) whether physical health was excellent/very good, (2) difficulties with emotion, concentration, behavior, or social interactions (“emotional difficulties”), and (3) any missed school days due to illness.
2.4. Independent variable
The independent variable of interest assessed the status and year that states adopted CHIPRA. 2010 was the first year states could expand eligibility under CHIPRA. Consistent with previous studies examining the effects of Medicaid expansion, we considered a state to have adopted CHIPRA's option if the expansion approval from CMS was effective on or before September 1 of that year. 18 , 33 Appendix S1 presents the status and year of states adopting CHIPRA's option as of 2016.
2.5. Covariates
Andersen's Behavioral Model of Healthcare utilization motivated the selection of covariates. 34 First, we controlled for individual child characteristics: age, sex, race/ethnicity. Second, we controlled for parental characteristics: education attainment, employment status, and marital status. Lastly, we adjusted for family income as a categorical variable (relative to the FPL) and parental structure (two‐parent vs. single‐parent households).
2.6. Statistical analyses
To assess whether CHIPRA adoption was associated with changes in immigrant Children's health insurance coverage, health care access, and health outcomes a linear probability models were estimated:
| (1) |
In this model, represents a dependent variable of interest for person i, in a state s, and in year t. is an indicator equal to one if a state had expanded coverage under the CHIPRA option in year t. X ist is a vector that includes covariates described above. We also include year fixed effects to flexibly account for time trends common to all states and state fixed effects to account for unobserved time‐invariant state characteristics. measures the effect of CHIPRA expansion on outcomes. All analyses use survey weights and standard errors are clustered at the state level.
In addition to the static difference‐in‐differences (DID) specification described above, we also estimate event‐study specifications that allow us to measure the evolution of outcomes over time:
| (2) |
Under this model, measures the effect of CHIPRA expansion at relative time k, with k ranging from five years before to 4 years after the CHIPRA adoption. The year prior to CHIPRA expansion () was omitted as the reference.
2.7. Subgroup analyses
We examined CHIPRA effects on three separate subgroups: (1) immigrant children living in states that did and did not have a pre‐existing state‐funded program prior to CHIPRA expansion, (2) children born in Latin or Asian countries, and (3) by the child's time in the US (<5 years versus 5–14 years). We did not include parental length of time in the US since 92.5% of immigrant parents have the same time as their children. Heterogeneity by region of birth and time in the US reflects both differences in enabling resources that determine take‐up among the eligible and differences in the probability of legal status that determine eligibility. Appendix S3 presents estimates of the TWFE DID model for all subgroup outcomes.
2.8. Supplementary analyses
We conducted two supplementary analyses. First, recent work in econometrics shows that coefficients from two‐way fixed effects (TWFE) can be biased when the timing of treatment varies (as is the case in our study) and treatment effects vary over time. 31 , 35 , 36 We examined if our main TWFE results were robust to two alternative estimators that are specifically designed to reduce such biases: Gardner's 2‐stage DID method and Sun and Abraham's interacted weighted event‐study approach. Two‐stage DID first estimates the group and period effect in the untreated sample, removing these effects from the outcome using residuals, and estimates treatment effects on the residualized outcome. The interaction‐weighted event‐study approach constrains the comparison group to never‐treated states and allows the event‐study coefficients to vary across each treatment timing cohort. The cohort‐specific event‐study coefficients are averaged using cohort‐shares. Second, we conducted event‐study analyses for two subgroups: (1) immigrants in CHIPRA adoption states that had state‐funded programs and (2) immigrant children in CHIPRA adoption states that did not have state‐funded programs. The purpose was to better understand how differences of CHIPRA effects were moderated by pre‐existing state‐funded programs.
2.9. Assumptions
The primary assumption of our approach is that the change in outcomes in states that did not adopt CHIPRA's option reflects what would have occurred in adopting states If they chose not to adopt. While that assumption is fundamentally untestable, we assess its plausibility in two ways. First, using our event‐study approach, we can examine if outcomes were differentially changing in adoption states relative to non‐adopting states prior to CHIPRA adoption. Second, we conducted placebo tests by rerunning the main empirical model of insurance coverage with the sample of immigrant children with household income over 300% FPL and US‐born children with household income over 300% FPL. These two groups were unlikely to gain insurance coverage as a result the CHIPRA option. Statistically significant effects in these two groups would suggest flaws in the study design.
3. RESULTS
Table 1 presents descriptive statistics for the overall sample and state's prior to CHIPRA status. The preponderance of immigrant children resided in states that provided state‐funded insurance programs (78.75%). Over half of immigrant children in our study sample were of Latino ethnicity (65.28%); Asian immigrant children were the second largest ethnic group. Close to half of immigrant children in both groups of states lived in households with family incomes below 100% of the FPL (45.88%). Nearly 50% of immigrant children's parents had less than high school education (46.98%); the majority resided with two parents (76.67%) that were married (89.44%).
TABLE 1.
Descriptive characteristics of immigrant children, by whether or not their states had state‐run insurance programs prior Children's Health Insurance Reauthorization Act (CHIPRA)
| Overall | States w/state‐run insurance programs | States w/o state‐run insurance programs | ||||
|---|---|---|---|---|---|---|
| mean (%) | 95% CI | Mean (%) | 95% CI | Mean (%) | 95% CI | |
| Unweighted number | 12,448 | 9804 | 3644 | |||
| Characteristics | ||||||
| Age groups | ||||||
| 0–5 years old | 12.44 | (11.65, 13.22) | 12.17 | (11.36, 13.02) | 14.39 | (12.17, 16.92) |
| 6–11 years old | 34.56 | (33.58, 35.54) | 34.46 | (33.41, 35.52) | 35.8 | (33.02, 38.69) |
| 12–18 years old | 53 | (51.78, 54.21) | 53.38 | (52.07, 54.68) | 49.81 | (46.44, 53.19) |
| Race/Ethnic groups | ||||||
| NH White | 11.54 | (10.08, 12.99) | 11.76 | (10.28, 13.42) | 10.6 | (7.25, 15.25) |
| NH Black | 7.41 | (6.449, 8.370) | 7.59 | (6.65, 8.65) | 6.95 | (4.19, 11.3) |
| NH Asian | 15.35 | (13.80, 16.89) | 15.9 | (14.25, 17.7) | 13.07 | (10.16, 16.65) |
| Hispanic | 65.28 | (63.10, 67.45) | 64.35 | (61.96, 66.68) | 68.88 | (62.8, 74.37) |
| NH Others | 0.42 | (0.224, 0.616) | 0.4 | (0.23, 0.68) | 0.5 | (0.14, 1.75) |
| Sex | ||||||
| Male | 51.3 | (50.32, 52.28) | 50.87 | (49.81, 51.93) | 54.2 | (51.55, 56.83) |
| Female | 48.7 | (47.72, 49.68) | 49.13 | (48.07, 50.19) | 45.8 | (43.17, 48.45) |
| Highest parental education | ||||||
| Less than HS | 46.98 | (45.07, 48.88) | 46.3 | (44.31, 48.3) | 52.15 | (46.1, 58.14) |
| High school | 19.54 | (18.28, 20.79) | 19.86 | (18.54, 21.26) | 16.63 | (13.39, 20.46) |
| Some college | 12.91 | (11.93, 13.89) | 13.07 | (12.03, 14.19) | 10.76 | (8.84, 13.04) |
| BS or higher | 20.58 | (19.07, 22.08) | 20.76 | (19.22, 22.39) | 20.46 | (15.95, 25.84) |
| Parents' marital status | ||||||
| Single/separated | 6.8 | (6.153, 7.446) | 7.29 | (6.61, 8.04) | 3.74 | (2.6, 5.36) |
| Divorced/widowed | 19.54 | (18.28, 20.79) | 3.92 | (3.38, 4.53) | 2.57 | (1.62, 4.04) |
| Married | 89.44 | (88.59, 90.28) | 88.79 | (87.83, 89.68) | 93.69 | (91.63, 95.27) |
| Family income (in FPL) | ||||||
| <100% FPL | 45.88 | (44.27, 47.48) | 45.59 | (43.83, 47.36) | 48.07 | (43.83, 52.33) |
| 100%–199% FPL | 39.15 | (37.68, 40.62) | 39.16 | (37.6, 40.75) | 38.79 | (34.78, 42.96) |
| 200%–299% FPL | 14.98 | (13.88, 16.07) | 15.25 | (14.09, 16.49) | 13.14 | (10.4, 16.47) |
| Parental employment status | ||||||
| Both parents are not employed | 6.69 | (5.768, 7.611) | 6.7 | (5.74, 7.8) | 6.99 | (4.89, 9.9) |
| At least one parent is employed | 93.31 | (92.38, 94.23) | 93.3 | (92.2, 94.26) | 93.01 | (90.1, 95.11) |
| Self‐reported health status | ||||||
| Excellent/very good | 73.95 | (72.65, 75.24) | 73.05 | (71.61, 74.45) | 78.91 | (75.22, 82.19) |
| Good/fair/poor | 26.05 | (24.75, 27.34) | 26.95 | (25.55, 28.39) | 21.09 | (17.81, 24.78) |
| Family structure | ||||||
| Single‐parents household | 14.31 | (13.29, 15.32) | 15.21 | (14.12, 16.35) | 8.9 | (6.94, 11.13) |
| Two biological parents | 76.67 | (75.41, 77.92) | 75.87 | (74.52, 77.17) | 81.62 | (77.65, 85.02) |
| At least one step parent | 9.02 | (8.294, 9.745) | 8.92 | (8.2, 9.7) | 9.48 | (7.29, 12.25) |
Note: The study sample was restricted to foreign‐born, noncitizen children with family income below 300% of federal poverty line.
Abbreviations: CI, confidence interval; FPL, federal poverty level; NH, non‐Hispanic.
Source: Analysie of data from National Health Interview Survey, 2000–2016.
Figure 1 presents the trends in uninsurance and public insurance coverage for CHIPRA adoption states that had a pre‐existing programs, CHIPRA‐adoption only states, and states that never adopted CHIPRA. In 2000, 65.3% of immigrant children residing in states that never adopted CHIPRA (labeled as “Neither” in Figure 1) were uninsured, versus 47.7% in CHIPRA adoption states that had a pre‐existing program and 43.5% in CHIPRA only states. The uninsured rate for all three groups fluctuated and declined slightly from 2000 to 2009, but the difference between the groups persisted. From 2010 to 2016, the uninsured rate among immigrant children decreased by 10 percentage points in CHIPRA adoption states that had a pre‐existing program and 14 percentage points in CHIPRA‐only states. However, uninsured rates in states that did not adopt the CHIPRA option declined by only 0.3 percentage points.
FIGURE 1.
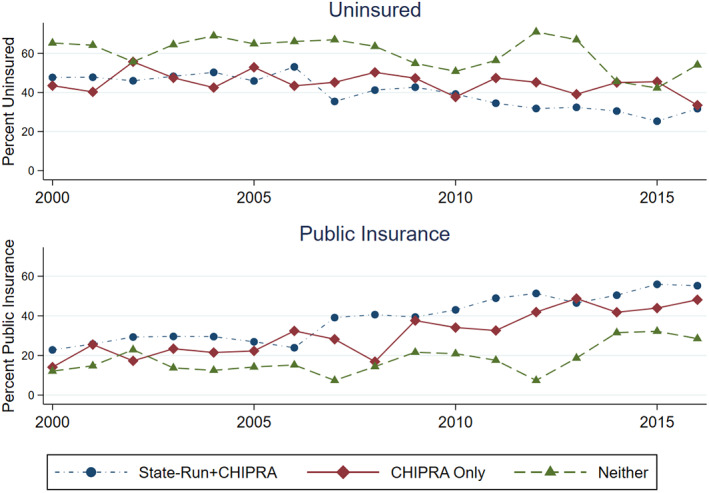
Unadjusted uninsured rate and public insurance rate among low‐income immigrant children, 2000–2016. Analyses of data from National Health Interview Survey, 2000–2016. The study sample was restricted to foreign‐born, noncitizen children with family income below 300% of federal poverty line. State‐Run+CHIPRA is states that both had state‐run programs prior to CHIPRA, and adopted CHIPRA option. CHIPRA Only is states that only adopted CHIPRA's option. Neither are states that did neither state‐run programs nor adopted CHIPRA's option. Estimates are survey weighted. [Color figure can be viewed at wileyonlinelibrary.com]
The steady decline of uninsured rates among immigrant children residing in CHIPRA adoption states appears to be associated with the increasing enrollment in public insurance programs: 22.8% of immigrant children in CHIPRA states that had a state‐run program were insured with public insurance in 2000 versus 14.1% of immigrant children in CHIPRA‐adoption only states and 12.1% in “Neither” states. The gap remained essentially unchanged between 2000 and 2009 and increased from 2010 to 2016. By the end of our study period, 55.2% of immigrant children in CHIPRA adoption states that had a pre‐existing program had public insurance, compared to 48.1% in CHIPRA only states and 28.5% in “Neither” states.
Table 2 shows the adjusted associations between CHIPRA adoption, insurance coverage, access to care, and health outcomes of low‐income immigrant children. The estimates suggest that adopting CHIPRA's option was associated with a 6.35 percentage‐point (95% CI: −11.25 to −1.45) decrease in uninsured rate. This represents a 12.35% decrease from the baseline rate. Public insurance coverage increased by 8.12 percentage points (95% CI: 1.26 to 14.98). Private coverage declined by −3.04 percentage points (95% CI: −8.33 to 2.25), though the change was not statistically significant. The sign of the associations between CHIPRA adoption and the access and health outcomes was suggestive of positive effects, but the point estimates were not statistically significant.
TABLE 2.
Estimated effects of Children's Health Insurance Reauthorization Act (CHIPRA) adoption on low‐income immigrant children, 2000–2016
| Estimated effects (percentage point) | 95% CI | Baseline average (%) | Percent change | |
|---|---|---|---|---|
| Insurance | ||||
| Uninsured | −6.35* | (−11.25, −1.45) | 51.4 | −12.35% |
| Public insurance | 8.12* | (1.26, 14.98) | 26.6 | 30.51% |
| Private insurance | −3.04 | (−8.33, 2.25) | 24.3 | −12.49% |
| Access to care | ||||
| Delayed care due to cost | −1.47 | (−7.35, 4.41) | 8.18 | −17.97% |
| Had an Usual source of care | 2.76 | (−3.71, 9.23) | 69.6 | 3.96% |
| Health | ||||
| Was very healthy/healthy | 1.73 | (−8.66, 12.12) | 73.1 | 2.37% |
| Had emotional difficulties | 0.17 | (−6.10, 6.44) | 26.9 | 0.63% |
| Missed a school day | 1.77 | (−7.83, 11.37) | 50.5 | 3.50% |
Note: The estimated effect represent coefficients from a difference‐in‐differences model, relative to not states that did not adopt CHIPRA. The baseline average is calculated using 2000–2009 public use NHIS. The measures represent the means of outcomes for immigrants prior to any CHIPRA expansion. The study sample was restricted to foreign‐born, noncitizen children with family income below 300% of federal poverty line. The model adjusted for age, sex, race/ethnicity, family income, family structure, parental education status, parental employment status, and status of state‐funded programs for low‐income immigrant children prior to CHIPRA. Standard errors were clustered at the state level. *p < 0.05.
Abbreviation: CI, confidence interval.
Source: Analyses of data from the National Health Interview Survey (NHIS), 2000–2016.
Figure 2 displays the event‐study coefficients in the main sample for selected outcomes using the TWFE event‐study estimator. The coefficients on pre‐adoption relative time suggest little evidence of differential pre‐treatment trends. The post‐adoption coefficients suggest that CHIPRA adoption had immediate effects on insurance coverage, but the effects attenuated 3 years after adoption. Consistent with findings from the DID models, CHIPRA adoption did not significantly impact the likelihood of having a usual source of care or having emotional difficulties among immigrant children.
FIGURE 2.

Adjusted percentage point differences in selected outcomes for immigrant children living in States that adopted CHIPRA's Option, 2000–2016. Analyses of data from National Health Interview Survey, 2000–2016. Percentage point differences come from estimates by event‐study models. The year before CHIPRA adoption (−1) is the omitted reference category. Year 0 is the first year of CHIPRA adoption. The error bars indicate 95% confidence intervals. TWFE is two‐way fixed effect event‐study model. [Color figure can be viewed at wileyonlinelibrary.com]
Figure 3 presents coefficients from the static DID comparisons (detailed results presented in Appendix S6) across subgroups. Effects on uninsurance were generally consistent across groups, but estimates for some groups were less precisely estimated. The major exception was for children with less than 5 years of residence in the US which had a near zero, not significant coefficient. Children born in Asian countries had statistically significant increases in public insurance coverage. Like the results from the main sample, no subgroups experienced any significant changes in access to care and health outcomes. Estimates for public coverage suggested larger effects for children in CHIPRA‐only states (Figure 3). We repeated event‐study analyses for immigrant children living in states that had state‐funded programs prior to CHIPRA only states (Table S5). The initial effects of CHIPRA on public insurance take‐up in states without a pre‐existing program were larger in the first two years after adoption. Consistent with results from the overall sample, the effects eroded after 3 years.
FIGURE 3.

Estimated effects of CHIPRA adoption on subgroups of low‐income immigrant children, 2000–2016. Analyses of data from National Health Interview Survey, 2000–2016. Effects of CHIPRA adoption come from generalized difference‐in‐differences models. Unit is percentage points. State‐run+CHIPRA is states that both provided state‐run insurance programs and adopted CHIPRA option. CHIPRA only is states that only adopted CHIPRA option. <5 years in US is immigrants living in the US for less than 5 years. 5–14 years in US is living in the US between 5 and 14 years. [Color figure can be viewed at wileyonlinelibrary.com]
We examined potential sources of bias with sensitivity analyses. First, we examined the effects of CHIPRA using two alternative estimation methods that are robust to bias from staggered adoption timing (Tables S2 and S3). While the alternative estimators did produce different estimates, they were generally consistent with TWFE and did not alter our conclusions. Second, the erode of CHIPRA effects estimated by the event‐study models could reflect the changing composition of states by event‐time. However, our event‐study analyses suggest similar conclusions about eroding when we exclude states that adopted the CHIPRA option after 2014 (Table S4).
Lastly, we conducted placebo tests for immigrant children with household income over 300 percent FPL, and US‐born children with household income over 300 percent FPL. Estimates for both placebo groups were small and there were no significant associations between CHIPRA adoption, insurance coverage, access to care or health outcomes (Appendix S7). These null‐effects suggest that CHIPRA adoption was not correlated with other factors related to the outcomes.
4. DISCUSSION
CHIPRA provided states with an option to expand eligibility for public insurance coverage to immigrant children under the five‐year bar. Thirty‐six states adopted CHIPRA's option between 2010 and 2016. Our findings suggest that the CHIPRA option reduced the uninsured rate by 6.35 percentage points. We estimated changes to uninsurance that were slightly smaller than estimated increases in public coverage, suggesting potential crowd‐out. However, estimates on private coverage (while negative) were not significant.
Our results are consistent with results from previous studies. 14 , 18 However, this study presents new evidence that program effects eroded with time. A potential reason for diminishing effects may be the combination of disenrollment related to eligibility renewal and declines of immigrant children in US. The population of immigrant children residing in the US declined from 3 million in 2000 to 2.7 million in 2016. 1 The decline in immigrant children may have resulted in fewer new applications in Medicaid/CHIP and more existing enrollees lost to renewal. To maintain newly gained insurance coverage immigrant children must comply with renewal every 6–12 months or face disenrollment from Medicaid/CHIP. 37 , 38 The renewal process previously required mail‐in forms to be signed and validated by parents/guardians of children. 39 , 40 In addition, processing renewals were time consuming. 39 , 40 It is plausible immigrant children lost coverage due to incomplete/lost forms or delayed processing time. 37 , 38 , 39 , 40 , 41
In 2015 states began to implement automatic renewals for Medicaid and CHIP using electronic data matches to reduce administrative burden. 40 However, to further prevent immigrant children “churning” in Medicaid and CHIP states should consider the option to guarantee children's Medicaid/CHIP eligibility for 12 months. 41 As of 2021, only 27 states offer continuous eligibility in CHIP, and 21 in Medicaid. 42
Another potential explanation for program effects eroding over time may be related to our study period coinciding with the full implementation of the Patient Protection and Affordable Care Act (ACA). In 2014, the individual mandate and employer mandate to purchase and provide insurance, Medicaid expansion, and s insurance exchanges were functional and being fully or partially enforced 43 , 44 , 45 Immigrant children who were legal permanent residents were required to maintain insurance coverage or to pay the individual Shared Responsibility Payment whether or not they lived in CHIPRA expansion states. 46 Figure 1 suggests that the erosion may have occurred not because of reduced coverage in adoption states, but improvements in states that did not adopt the option. The improvement of insured rates in non‐CHIPRA states is likely related to the ACA's individual mandate and improved access to insurance through federal or state exchanges. Importantly, the ACA grants tax credits and cost sharing reduction subsidies for private insurance to immigrants who are not eligible for Medicaid/CHIP due to the five‐year bar, even when they fall below the 100% FPL threshold that applies to citizens or immigrants living in the US longer than 5 years.
Our study showed that compared to the immigrant children residing in CHIPRA states that had state‐funded programs prior to CHIPRA, immigrant children in CHIPRA‐only states experienced a greater increase in public insurance coverage (15.5 percentage points in CHIPRA only states vs. 7.73 percentage points in CHIPRA & state‐funded program states). This difference might be explained by pre‐existing exposure to coverage options in states covering immigrant children prior to CHIPRA. If there are existing coverage programs in place states could adopt CHIPRA's option by simply switching funding sources from states to the federal government. 18 , 47 This also suggests that any “priming the pump” effect from state‐funded programs prior to CHIPRA was likely to be modest.
In analyses of subgroups, our study shows the effects of CHIPRA adoption varied by immigrant children's time in the US (as distinct from the legal residence rules used in the five‐year bar) and country of birth. There are two possible explanations. First, eligibility varies across immigrant groups due to differences in the probability of having legal immigration status. Latino immigrants have the highest proportion of individuals without permanent residency. 22 , 23 , 24 For instance, over 53% of Mexican immigrants in the US do not have legal immigration status. 24 These immigrants are not eligible for any federally funded public programs except in emergency situations on a temporary basis. Separately, because of the application backlogs in the US Citizenship and Immigration Services (USCIS), the average wait‐time to obtain permanent residency is now close to 6 years. 48 An important downstream consequence of this backlog is that immigrants waiting for permanent residency remain ineligible for public benefits. The second explanation is that enabling factors such as acculturation, language barriers, and knowledge of the US health care system may impact public insurance take‐up differently across immigrant groups. 26 For instance, Latino immigrants are more likely to have language barriers compared to other immigrant racial/ethnic groups. 25 , 26 , 49 Such variation in enabling factors between subgroups may differentially affect insurance take‐up among immigrants.
This study considered a larger set of health care access and health outcomes than previous work on the CHIPRA option. However, we did not find significant impacts of CHIPRA adoption on immigrant children's access to care or health outcomes Our estimated effects of CHIPRA adoption on immigrant children's health outcomes were consistent with findings from previous studies. 29 , 50 The estimated effects of CHIPRA adoption on immigrant children's access to care in our study were much smaller than results from similar Medicaid eligibility expansion studies among all children in US. 29 , 50 , 51 However, our findings are consistent with prior research examining the impact of insurance expansion and immigrants' access to care. 26 , 27 , 52 One explanation of smaller effects among immigrant children may be related to the “healthy immigrant effect.” 53 The theory suggests that recently arrived immigrants are more likely to be healthy (and not demand care) compared to their long‐term counterparts and the US‐born population. 26 Immigrant children may also face non‐financial barriers to care even when insured. Some of this effect is likely structural and might dissipate as they gain knowledge of how to navigate the US health system such that their access and utilization of care may begin to resemble that of long‐term US immigrants. 2 , 25 , 26 , 27
Our study is not without limitations. First, CHIPRA's 214 option targets immigrant children that established permanent legal residence in the past five years. NHIS does not ascertain the legal status of immigration children or ask survey respondents to report which year they received permanent residency. Therefore, our estimates apply to immigrant children of any legal status. Second, the sample sizes of NHIS for immigrant children were relatively small in all survey years. This may limit our ability to detect more modest effects in access to care and health. In addition, because of the limited sample size, we could not perform analyses on smaller and detailed subgroups (e.g., age groups, country of birth, and household incomes). Third, despite conducting several robustness tests our study design could be subject to unobserved biases.
Despite these limitations, this study presents new evidence about the role that the CHIPRA option plays in health insurance, health access, and health of low‐income foreign‐born children. Our study suggests that eliminating the five‐year bar at the federal level would be an effective way of increasing health insurance among immigrant children. However, additional policy tools, such as a federal requirement for 12‐months of continuous eligibility in Medicaid/CHIP, strong state and community level outreach programs that improve health literacy and support navigation, and publicly‐funded and readily‐available interpretation services during enrolling and care seeking will be needed to maintain the increase in insurance coverage among immigrant children and possibly improve access to care and health outcomes. In addition, future studies should examine the long‐term impacts of five‐year bar elimination in immigrant children's childhood on adult health outcomes and health care access.
FUNDING INFORMATION
Agency for Healthcare Research and Quality Grant/Award Number: R361R36HS028532‐01A1.
Supporting information
Table S1. Status of states with state‐funded programs before CHIPRA, CHIPRA adoption as of 2016.
Table S2. Comparison of estimated effects of Children's Health Insurance Reauthorization Act (CHIPRA) adoption on low‐income immigrant children, 2000–2016.
Table S3. Comparison of TWFE event‐study estimates and sun/abraham event‐study estimates.
Table S4. TWFE event‐study estimates: Immigrant children living in states adopted CHIPRA before 2014.
Table S5. TWFE event‐study estimates: Adjusted trends of insurance coverage for immigrant children in CHIPRA adoption states that did have state‐funded programs, and for immigrant children in CHIPRA adoption states that did not have state‐funded programs.
Appendix S6. Estimated effects of CHIPRA adoption on low‐income immigrant children in states with and without a pre‐existing program, 2000–2016.
Table S7. Placebo tests.
ACKNOWLEDGMENT
The majority of the work for this paper was completed while Jun Chu was affiliated with the Department of Health Policy and Management, School of Public Health, University of Maryland, College Park.
This project used restricted data from the National Health Interview Survey. The survey does not collect direct information on the legal residency status of any participant. The findings and conclusions drawn from these data are those of the authors and do not necessarily represent the views of the United States Census Bureau Research Data Center, the National Center for Health Statistics, or the Centers for Disease Control and Prevention. We thank the editor and anonymous reviewers for their feedback and support.
Chu J, Roby DH, Boudreaux MH. Effects of the Children's Health Insurance Reauthorization Act on immigrant children's healthcare access. Health Serv Res. 2022;57(Suppl. 2):315‐325. doi: 10.1111/1475-6773.14061
[Correction added on 29 September 2022, after first online publication: the affiliation of Jun Chu has been corrected in this version.]
Funding information Agency for Healthcare Research and Quality, Grant/Award Number: 1R36HS028532‐01A1
REFERENCES
- 1. Immigrant Children . Child trends. Accessed February 18, 2020. https://www.childtrends.org/indicators/immigrant-children
- 2. Knipper SH, Rivers W, Goodman JM. Effects of citizenship status, Latino ethnicity, and household language on health insurance coverage for US adolescents, 2007–2016. Health Serv Res. 2019;54(6):1166‐1173. [DOI] [PMC free article] [PubMed] [Google Scholar]
- 3. Suleman S, Garber KD, Rutkow L. Xenophobia as a determinant of health: an integrative review. J Public Health Policy. 2018;39(4):407‐423. [DOI] [PubMed] [Google Scholar]
- 4. Derose KP, Baker DW. Limited English proficiency and Latinos' use of physician services. Med Care Res Rev. 2000;57(1):76‐91. [DOI] [PubMed] [Google Scholar]
- 5. Flores G, Abreu M, Tomany‐Korman SC. Limited English proficiency, primary language at home, and disparities in Children's health care: how language barriers are measured matters. Public Health Rep. 2005;120(4):418‐430. [DOI] [PMC free article] [PubMed] [Google Scholar]
- 6. Guendelman S, Schauffler HH, Pearl M. Unfriendly shores: how immigrant children fare in the US health system. Health Aff. 2001;20(1):257‐266. [DOI] [PubMed] [Google Scholar]
- 7. Ku L, Jewers M. Health Care for Immigrant Families: Current Policies and Issues. Migration Policy Institute; 2013. [Google Scholar]
- 8. Ku L, Matani S. Left out: Immigrants' access to health care and insurance. Health Aff. 2001;20(1):247‐256. [DOI] [PubMed] [Google Scholar]
- 9. Mohanty SA, Woolhandler S, Himmelstein DU, Pati S, Carrasquillo O, Bor DH. Health care expenditures of immigrants in the United States: a nationally representative analysis. Am J Public Health. 2005;95(8):1431‐1438. [DOI] [PMC free article] [PubMed] [Google Scholar]
- 10. Lurie IZ. Welfare reform and the decline in the health‐insurance coverage of children of non‐permanent residents. J Health Econ. 2008;27(3):786‐793. [DOI] [PubMed] [Google Scholar]
- 11. Kaushal N, Kaestner R. Welfare reform and health Insurance of Immigrants. Health Serv Res. 2005;40(3):697‐722. [DOI] [PMC free article] [PubMed] [Google Scholar]
- 12. Cohen R, Jarlenski M, Artiga S, Marks C. A Foundation for Health Reform: Findings of a 50 State Survey of Eligibility Rules, Enrollment and Renewal Procedures, and Cost‐ Sharing Practices in Medicaid and CHIP for Children and Parents during 2009. Kaiser Commission on Medicaid and the Uninsured; 2009. [Google Scholar]
- 13. Bronchetti ET. Public insurance expansions and the health of immigrant and native children. J Public Econ. 2014;120:205‐219. [Google Scholar]
- 14. Saloner B, Koyawala N, Kenney GM. Coverage for low‐income immigrant children increased 24.5% in states that expanded CHIPRA eligibility. Health Aff. 2014;33(5):832‐839. [DOI] [PubMed] [Google Scholar]
- 15. Borjas GJ. Poverty and program participation among immigrant children. Futur Child. 2011;21(1):247‐266. [DOI] [PubMed] [Google Scholar]
- 16. Fix M, Rosenblum R. Immigrants and Health Care Reform: What's Really at Stake?. Migration Policy Institute; 2009. [Google Scholar]
- 17. CHIPRA . Medicaid. Centers for Medicare and Medicaid Services. 2011. Accessed February 14, 2022. https://www.medicaid.gov/chip/chipra/index.html
- 18. Mahmud M. Immigrant Children's Access to Public Health Insurance after CHIPRA‐2009. 2016. Accessed February 18, 2020. https://mpra.ub.uni-muenchen.de/80602
- 19. Yasenov VI, Lawrence D, Mendoza FS, Hainmueller J. Public health insurance expansion for immigrant children and interstate migration of low‐income immigrants. JAMA Pediatr. 2020;174(1):22‐28. [DOI] [PMC free article] [PubMed] [Google Scholar]
- 20. Health Insurance Coverage of Children 0–18 (CPS) . Washington DC: Kaiser family institute. 2021. https://www.kff.org/other/state-indicator/health-insurance-coverage-of-children-0-18-cps/. Accessed February 24, 2022.
- 21. Aizer A, Currie J. Networks or neighborhoods? Correlations in the use of publicly‐funded maternity care in California. J Public Econ. 2004;88(12):2573‐2585. [Google Scholar]
- 22. Batalova JBJL and J. South American Immigrants in the United States . Migration policy institute. 2022. Accessed February 19, 2022. https://www.migrationpolicy.org/article/south-american-immigrants-united-states
- 23. Batalova JBEB and J. Central American Immigrants in the United States . Migration policy institute. 2021. Accessed February 19, 2022. https://www.migrationpolicy.org/article/dominican-immigrants-united-states-2021
- 24. Batalova JZ Jeanne Batalova Jie Zong and Jeanne . Mexican immigrants in the United States. 2018. Accessed February 19, 2022. https://www.migrationpolicy.org/article/mexican-immigrants-united-states-2017
- 25. Yu SM, Huang ZJ, Schwalberg RH, Overpeck M, Kogan MD. Acculturation and the health and well‐being of US immigrant adolescents. J Adolesc Health. 2003;33(6):479‐488. [DOI] [PubMed] [Google Scholar]
- 26. Bustamante AV, Chen J, McKenna RM, Ortega AN. Health care access and utilization among US immigrants before and after the affordable care act. J Immigr Minor Health. 2019;21(2):211‐218. [DOI] [PMC free article] [PubMed] [Google Scholar]
- 27. Bustamante AV, McKenna RM, Viana J, Ortega AN, Chen J. Access‐to‐care differences between Mexican‐heritage and other Latinos in California after the affordable care act. Health Aff. 2018;37(9):1400‐1408. [DOI] [PMC free article] [PubMed] [Google Scholar]
- 28. Cousineau MR, Stevens GD, Pickering TA. Preventable hospitalizations among children in California counties after child health insurance expansion initiatives. Med Care. 2008;46(2):142‐147. [DOI] [PubMed] [Google Scholar]
- 29. Howell EM, Kenney GM. The impact of the Medicaid/CHIP expansions on children: a synthesis of the evidence. Med Care Res Rev. 2012;69(4):372‐396. [DOI] [PubMed] [Google Scholar]
- 30. Gardner J. Two‐stage differences in differences. Accessed January 01, 2022. https://jrgcmu.github.io/2sdd_current.pdf
- 31. Sun L, Abraham S. Estimating dynamic treatment effects in event studies with heterogeneous treatment effects. J Econ. 2021;225(2):175‐199. [Google Scholar]
- 32. National Health Inverview Survey . National Center for Health Statistics. 2021. Accessed January 31, 2022. https://www.cdc.gov/nchs/nhis/data-questionnaires-documentation.htm
- 33. Khouja T, Burgette JM, Donohue JM, Roberts ET. Association between Medicaid expansion, dental coverage policies for adults, and children's receipt of preventive dental services. Health Serv Res. 2020;55(5):642‐650. [DOI] [PMC free article] [PubMed] [Google Scholar]
- 34. Andersen RM. Revisiting the behavioral model and access to medical care: does it matter? J Health Soc Behav. 1995;36(1):1‐10. [PubMed] [Google Scholar]
- 35. Goodman‐Bacon A. Difference‐in‐differences with variation in treatment timing. J Econ. 2021;225(2):254‐277. [Google Scholar]
- 36. Callaway B, Sant'Anna PHC. Difference‐in‐differences with multiple time periods. J Econ. 2021;225(2):200‐230. [Google Scholar]
- 37. Sommers BD. From Medicaid to uninsured: drop‐out among children in public insurance programs. Health Serv Res. 2005;40(1):59‐78. [DOI] [PMC free article] [PubMed] [Google Scholar]
- 38. Sommers BD. Why millions of children eligible for Medicaid and SCHIP are uninsured: poor retention versus poor take‐up. Health Aff. 2007;26(Supplement 2):w560‐w567. [DOI] [PubMed] [Google Scholar]
- 39. Brooks T, Touschner J, Stephens J. Modern era Medicaid: findings from a 50‐state survey of eligibility, enrollment, renewal, and cost‐sharing policies in Medicaid and CHIP as of January 2015. Washington DC, Kaiser Family Foundation. 2015. Accessed February 18, 2022. https://www.kff.org/health‐reform/report/modern‐era‐medicaid‐findings‐from‐a‐50‐state‐survey‐of‐eligibility‐enrollment‐renewal‐and‐cost‐sharing‐policies‐in‐medicaid‐and‐chip‐as‐of‐january‐2015/
- 40. Brooks T, Miskell S, Cornachione E. Medicaid and CHIP eligibility, enrollment, renewal, and cost‐sharing policies as of January 2016: findings from a 50‐state survey ‐ Medicaid and CHIP enrollment and renewal processes. Washington DC: Kaiser Family Foundation. 2016. Accessed February 18, 2022. https://wwwkfforg/report‐section/medicaid‐and‐chip‐eligibility‐enrollment‐renewal‐and‐cost‐sharing‐policies‐as‐of‐january‐2016‐medicaid‐and‐chip‐enrollment‐and‐renewal‐processes/
- 41. Brantley E, Ku L. Continuous eligibility for Medicaid associated with improved child health outcomes. Med Care Res Rev. 2021;79(3):404‐413. [DOI] [PubMed] [Google Scholar]
- 42. Continuous Eligibility for Medicaid and CHIP Coverage | Medicaid . Centers for Medicare and Medicaid Services. 2021. Accessed February 20, 2022. https://www.medicaid.gov/medicaid/enrollment-strategies/continuous-eligibility-medicaid-and-chip-coverage/index.html
- 43. Eibner C, Saltzman E. How Does the ACA Individual Mandate Affect Enrollment and Premiums in the Individual Insurance Market?: RAND. 2015. Accessed April 28, 2020. https://www.rand.org/pubs/research_briefs/RB9812z4.html [Google Scholar]
- 44. Hopson E. Employer Mandate Delay & Phase‐in of employer shared responsibility payment provisions. Wyatt Employment Law Report. 2014. Accessed April 28, 2020. https://wyattemployment.com/2014/02/11/employer-mandate-delay-phase-in-of-employer-shared-responsibility-payment-provisions/
- 45. Covered California Seeing Fewer Problems Than Federal Health Exchange . Healthline. Accessed April 28, 2020. https://www.healthline.com/health‐news/insurance‐covered‐california‐in‐better‐shape‐than‐federal‐exchange‐102513
- 46. Individual Mandate Penalty You Pay If You Don't Have Health Insurance Coverage. HealthCare.gov. Accessed February 25, 2022. https://www.healthcare.gov/fees/fee-for-not-being-covered/
- 47. Children's Health Insurance Program Reauthorization Act of 2009 (CHIPRA). Washington DC: Kaiser family foundation. 2009. Accessed September 21, 2020. https://www.kff.org/health-reform/fact-sheet/childrens-health-insurance-program-reauthorization-act-of/
- 48. Immigration Wait Times from Quotas Have Doubled: Green Card Backlogs Are Long, Growing, and Inequitable . Cato Institute. 2019. Accessed February 18, 2022. https://www.cato.org/publications/policy‐analysis/immigration‐wait‐times‐quotas‐have‐doubled‐green‐card‐backlogs‐are‐long
- 49. Schwartz SJ, Pantin H, Sullivan S, Prado G, Szapocznik J. Nativity and years in the receiving culture as markers of acculturation in ethnic enclaves. J Cross‐Cult Psychol. 2006;37(3):345‐353. [DOI] [PMC free article] [PubMed] [Google Scholar]
- 50. Currie J, Decker S, Lin W. Has public health insurance for older children reduced disparities in access to care and health outcomes? J Health Econ. 2008;27(6):1567‐1581. [DOI] [PubMed] [Google Scholar]
- 51. Currie J, Gruber J. Health insurance eligibility, utilization of medical care, and child health. Q J Econ. 1996;111(2):431‐466. [Google Scholar]
- 52. Porteny T, Ponce N, Sommers BD. Immigrants and the affordable care act: changes in coverage and access to care by documentation status. J Immigr Minor Health. 2020;25:86‐94. [DOI] [PubMed] [Google Scholar]
- 53. McDonald JT, Kennedy S. Insights into the ‘healthy immigrant effect’: health status and health service use of immigrants to Canada. Soc Sci Med. 2004;59(8):1613‐1627. [DOI] [PubMed] [Google Scholar]
Associated Data
This section collects any data citations, data availability statements, or supplementary materials included in this article.
Supplementary Materials
Table S1. Status of states with state‐funded programs before CHIPRA, CHIPRA adoption as of 2016.
Table S2. Comparison of estimated effects of Children's Health Insurance Reauthorization Act (CHIPRA) adoption on low‐income immigrant children, 2000–2016.
Table S3. Comparison of TWFE event‐study estimates and sun/abraham event‐study estimates.
Table S4. TWFE event‐study estimates: Immigrant children living in states adopted CHIPRA before 2014.
Table S5. TWFE event‐study estimates: Adjusted trends of insurance coverage for immigrant children in CHIPRA adoption states that did have state‐funded programs, and for immigrant children in CHIPRA adoption states that did not have state‐funded programs.
Appendix S6. Estimated effects of CHIPRA adoption on low‐income immigrant children in states with and without a pre‐existing program, 2000–2016.
Table S7. Placebo tests.