

Abstract
Objective
To investigate the differential associations of homelessness with emergency department (ED) visits and hospitalizations by race, ethnicity, and gender.
Data Sources
California Medicaid enrollment and claims.
Study Design
We identified beneficiaries experiencing homelessness (BEH) and those who did not (NBEH) using diagnosis and place of service codes and residential addresses. Outcomes include four ED visit measures and four hospitalization measures. We compared the use of these services by BEH to NBEH overall and by race, ethnicity, and gender groups in regression models controlling for covariates.
Data Collection
We used a sample of Medicaid beneficiaries who met eligibility criteria for a California Medicaid demonstration program in 2017 and 2018 but were not enrolled in the program. We identified 473,069 BEH, and the rest (1,948,422) were considered NBEH. We used the 2018 data for utilization analyses and most covariates. We constructed lagged measures of health conditions using 2017 data.
Principal Findings
We found that homelessness was significantly associated with 0.34 more ED visits (p < 0.01) and a higher likelihood of frequent ED visits (2.77 percentage points [pp], p < 0.01), any ED visits due to mental health conditions (0.79 pp, p < 0.01), and any ED visits due to substance use disorders (1.47 pp, p < 0.01). Experiencing homelessness was also significantly associated with 0.03 more hospitalizations (p < 0.01), a higher likelihood of frequent hospitalizations (0.68 pp, p < 0.01) and high frequent hospitalizations (0.28 pp, p < 0.01), and a longer length of stay (0.53 days, p < 0.01). We found a larger association for American Indian and Alaska Native, Black, Native Hawaii or Pacific Islander, and White populations than that for Asian and Hispanic populations. The associations are larger for males than females.
Conclusions
Our findings identified distinct utilization patterns by race, ethnicity, and gender. They indicated the need for developing race, ethnicity, and gender‐specific strategies to reduce ED visits and hospitalizations of BEH.
Keywords: emergency department visits, ethnicity, gender, health equity, homelessness, hospitalizations, race
What is known on this topic
Homelessness has been associated with worse health and higher utilization of acute services.
Causes of homelessness differ by race, ethnicity, and gender groups.
The COVID‐19 pandemic has exacerbated the homelessness crisis.
What this study adds
We provided evidence of the association between homelessness and health care utilization for understudied groups, including American Indian and Alaska Native (AIAN), Asian, Native Hawaiian or Pacific Islander (NHOPI) populations.
We found larger associations for AIAN, Black, NHOPI, and White populations than Asian and Hispanic populations, and the association was larger for males than females across racial and ethnic groups.
Using an innovative method in identifying homelessness status that is further assessed for misclassification bias, our study provided findings needed for effective strategies to address homelessness and its consequences.
1. INTRODUCTION
Homelessness increased by 5.6% from 2016 to 2020 across the United States. On a given night in 2020, more than half a million Americans were experiencing homelessness. 1 American Indian and Alaska Native (AIAN), Black, and Native Hawaiian and other Pacific Islander (NHOPI) populations were substantially overrepresented among those experiencing homelessness nationally in 2020. 1 In addition to racial and ethnic disparities, there are gender differences in homelessness trends. Most (61%) individuals experiencing homelessness identified as male, with the female population increasing from 27.9% in 2016 to 38.5% in 2020. 1 , 2
Individuals experiencing homelessness have worse physical and emotional health status, 3 , 4 , 5 have higher mortality rates, 6 , 7 and are frequent users of emergency departments (ED) and hospitals compared to low‐income patients not experiencing homelessness. 8 , 9 , 10 , 11 , 12 , 13 , 14 Based on the National Institute on Minority Health and Health Disparities (NIMHD) Research Framework, various factors could lead to such disparities, and many of them also cause homelessness, including family conflict, extreme poverty, psychiatric illness and substance abuse, poor health, and criminal convictions. 15 , 16 Individuals experiencing homelessness suffer from high rates of infectious diseases (e.g., HIV, tuberculosis, and Hepatitis B), unintentional injuries (e.g., victimization, burn injuries, and traumatic brain injury), food insecurity, poor access to primary and preventive care, and problems in managing chronic health conditions. 3 , 13 They had minimal social support from relatives and friends and experienced substantial discrimination. 15 , 17 , 18 Most of these problems are distributed unequally across populations. 15 Racism and gender discrimination further worsen the health equity among this particularly vulnerable group. 3 , 18 Yet, few have examined the relationship between homelessness and health care utilization of racial and ethnic groups or their gender. We identified one study that examined the risk of opioid‐related hospital admissions and ED visits in relation to homelessness for Black, Hispanic, and White populations. 19 Little is known about the differential associations of homelessness with ED visits and hospitalizations by race, ethnicity, and gender, particularly for smaller groups, including AIAN, Asian, and NHOPI populations.
Precursors of homelessness and its consequences vary across populations. 20 , 21 , 22 A review of the literature indicated that socioeconomic disadvantage along with racial discrimination was an important precursor of homelessness for blacks and other racial and ethnic minorities, while serious mental illness and family problems were precursors for White individuals experiencing homelessness. 20 The historical displacement and discrimination in housing and mortgage lending have led to the overrepresentation of the AIAN and Black populations. 15 Women experiencing homelessness faced different risks and vulnerabilities than men. 23 For instance, homeless women and transgender individuals are more likely to have experienced sexual assault but less likely to have a traumatic brain injury than homeless men. 3 Problems in health and health care access that vary by race, ethnicity, and gender usually also do so among the homeless. 3 , 13 , 15 , 18
Although the vulnerabilities and precursors of homelessness identified by these studies have the potential to influence acute care utilization, existing studies did not investigate or did not provide adequate evidence of the relationship between homelessness and high‐cost health care utilization, such as ED visits and hospitalizations by race, ethnicity, and gender. Understanding the relationship is further challenged by data limitations, including the data sources and the quality of homelessness indicators used. Earlier studies of this relationship were based on survey data with small sample sizes and a lack of a comparison group that consisted of individuals not experiencing homelessness. 24 , 25 , 26 , 27 Other studies were limited to analyses of hospital discharge data not reflecting broader populations experiencing homelessness or depended on unreliable homelessness indicators reported at the time of discharge or death. 19 , 28 , 29 , 30 , 31 , 32 Such indicators have been criticized for not being uniformly defined or accurate, and no information is available to assess the misclassification bias in their estimates. 29 , 32
The homelessness crisis is exacerbated by the COVID‐19 pandemic, which has disproportionately affected minorities and women. 33 , 34 The homelessness crisis and the pandemic have highlighted the inequities in the US health care system. Researchers and policymakers need better measures of these inequities to address them, improve population health, and reduce costs of care.
In this study, we close the evidence gap in the association of homelessness with ED visits and hospitalizations by race, ethnicity, and gender groups. We use a systematic approach to identifying homelessness status that is assessed for misclassification bias, a large administrative sample of low‐income individuals, and a comparison group of similar populations that are not experiencing homelessness.
To our knowledge, we are the first to examine the differential association of homelessness with ED visits and hospitalizations by race, ethnicity, and gender groups, particularly for smaller groups such as AIAN, Asian, and NHOPI populations. We use claims and enrollment data from a large administrative dataset, including millions of complex and high use Medicaid beneficiaries in California, a state that is racially and ethnically diverse and has the highest rate of homelessness in the United States (46 per 10,000 in 2019), which has grown by 16% from 2018 to 2019. 35
2. METHODS
2.1. Data and sample
We used California's Medicaid claims and enrollment data for 2,421,491 complex and high use Medicaid beneficiaries who met eligibility criteria for Whole Person Care (WPC) but were not enrolled. 36 , 37 (see Appendix Section 1 for details about WPC). We did not include WPC enrollees in the main analyses because they received various interventions designed to impact health care utilization. The WPC Pilot program consisted of 25 different Pilot programs in 26 California counties that provided care coordination, behavioral health, and social services to high utilizer Medicaid beneficiaries. 38
Our study used exclusively 2018 data to identify homelessness status and to construct ED and hospitalization indicators and demographics. We only used the 2017 claims data to construct lagged measures of health conditions to avoid simultaneity. We further used available data from WPC to assess misclassification bias for homelessness status in this study. This included the predictive performance data from a model that assessed homelessness status among WPC enrollees using a Pilot‐reported homelessness indicator (Table A1).
2.2. Measures
2.2.1. Dependent variables
We created four measures of ED visits: the number of ED visits; frequent ED visits (1 = 4+ ED visits; 0 otherwise) 39 , 40 ; any ED visits due to mental health disorders (1 = yes; 0 = no); and any ED visits due to substance use disorders (1 = yes; 0 = no).
Similarly, we created four hospitalization variables: the number of hospitalizations; frequent hospitalizations (1 = 2+ hospitalizations; 0 otherwise); high frequent hospitalizations (1 = 4+ hospitalizations; 0 otherwise) 41 ; and average length of hospitalization in days (length of stay).
2.2.2. Primary independent variable
The primary independent variable was whether beneficiaries experienced homelessness in 2018. We constructed a binary indicator variable based on residential addresses, diagnosis codes, and place of services codes as described below. The secondary variable of interest was race and ethnicity, which was from California's Medicaid enrollment and well measured; less than 10% of records were missing race and ethnicity, and the distribution by race and ethnicity is comparable to that from the American Community Survey. 42 We categorized beneficiaries into eight groups: American Indian and Alaska Native (AIAN), Asian, Black, Hispanic, Native Hawaiian and other Pacific Islander (NHOPI), Other or Multiracial, Unknown, and White. Our third variable of interest was gender (female vs. male) from the Medicaid enrollment data.
2.2.3. Control variables
We included several measures of beneficiaries' demographics and health conditions as covariates. These included age groups (18–34, 35–49, 50–64, and 65+) and an indicator of whether English was the beneficiaries' primary language (1 = Yes, 0 = No). We also included the number of months beneficiaries were enrolled in Medicaid in 2018 to account for the different lengths of Medicaid enrollment per beneficiary. We further included the beneficiary's county of residence to account for differences across counties, including health care resources and barriers to accessing health care such as lack of transportation, phone, inner‐city residence, and care coordination. 26
We included indicators of disease burden and health status that were one year lagged by using 2017 Medicaid claims data. Disease burden was measured by the Chronic Illness and Disability Payment System (CDPS) Score. The CDPS score is a summary score of risk weights from 58 CDPS risk categories based on diagnoses; a higher score indicates a higher burden of illness. 43 Health status measures included indicators for health conditions commonly used in the homelessness literature. 5 , 10 They consisted of 11 indicators for physical health conditions and six indicators for behavioral health conditions, listed in Table 1.
TABLE 1.
Descriptive statistics by beneficiaries' homelessness status
| Experiencing homelessness (N = 473,069) | Not experiencing homelessness (1,948,422) | Total (N = 2,421,491) | |
|---|---|---|---|
| Outcome variables | |||
| Emergency department (ED) visits | |||
| Number of ED visits | 1.57 | 1.03 | 1.14 |
| Proportion with frequent (4+) ED visit (%) | 11.56 | 6.05 | 7.13 |
| Proportion with any ED visits due to mental health disorders (%) | 9.85 | 5.96 | 6.72 |
| Proportion with any ED visits due to substance use disorders (%) | 9.54 | 2.86 | 4.17 |
| Hospitalizations | |||
| Number of hospitalizations | 0.36 | 0.31 | 0.32 |
| Proportion with frequent (2+) hospitalizations (%) | 6.34 | 4.92 | 5.20 |
| Proportion with more frequent (4+) hospitalizations (%) | 1.46 | 0.90 | 1.01 |
| Average length of stay | 2.03 | 1.56 | 1.65 |
| Control variables | |||
| Proportion of female (%) | 56.30 | 66.96 | 64.88 |
| Age groups (column percent, %) | |||
| 18–34 | 40.40 | 37.57 | 38.12 |
| 35–49 | 25.70 | 23.04 | 23.56 |
| 50–64 | 24.41 | 22.73 | 23.06 |
| 65+ | 9.49 | 16.67 | 15.27 |
| Proportion with English as primary language (%) | 84.68 | 66.60 | 70.13 |
| Race and ethnicity (column percent, %) | |||
| American Indian and Alaska Native | 1.10 | 0.53 | 0.64 |
| Asian | 2.57 | 6.42 | 5.67 |
| Black | 17.55 | 8.96 | 10.63 |
| Hispanic | 35.76 | 45.98 | 43.99 |
| Native Hawaiian and other Pacific islander | 1.04 | 2.03 | 1.83 |
| Other or multiracial | 3.57 | 5.08 | 4.79 |
| Unknown | 6.31 | 5.52 | 5.67 |
| White | 32.10 | 25.48 | 26.78 |
| Medicaid enrolled months (mean) | 9.37 | 9.50 | 9.48 |
| 1‐year lagged CDPS score (mean) | 1.06 | 1.12 | 1.11 |
| Proportion with physical health conditions (%) | |||
| Viral hepatitis | 3.89 | 2.11 | 2.46 |
| Cirrhosis | 6.22 | 7.00 | 6.85 |
| Human immunodeficiency virus | 1.25 | 0.66 | 0.78 |
| Hypertension | 27.72 | 31.81 | 31.01 |
| Asthma | 10.52 | 9.25 | 9.50 |
| Chronic obstructive pulmonary disease | 8.75 | 8.31 | 8.40 |
| Heart failure | 4.95 | 6.03 | 5.82 |
| Ischemic heart disease | 5.69 | 7.33 | 7.01 |
| Diabetes | 15.00 | 19.98 | 19.01 |
| Chronic kidney disease | 12.13 | 15.35 | 14.72 |
| Cancer | 1.62 | 2.61 | 2.41 |
| Proportion with behavioral health conditions (%) | |||
| Schizophrenia and other psychosis | 10.00 | 4.79 | 5.81 |
| Bipolar disorders | 8.99 | 4.64 | 5.49 |
| Depression | 19.19 | 15.01 | 15.83 |
| Anxiety | 19.57 | 16.00 | 16.69 |
| Alcohol abuse or dependence | 15.21 | 11.36 | 12.11 |
| Drug abuse or dependence | 19.63 | 7.46 | 9.84 |
Note: The overall analytic sample includes 2,421,491 complex and high‐use Medicaid beneficiaries (defined in the text). A CDPS score of 1.11 means that, given the prevalence of diseases in 2017, patients are expected to incur medical expenditure in 2018 that is 11% higher than the average expenditures of the average California Medicaid beneficiaries. Race and ethnicity categories are listed in alphabetical order.
Abbreviations: CDPS, Chronic Illness and Disability Payment System; ED, emergency department.
2.3. Empirical strategy
We used a two‐stage methodology for our analyses combining data mining techniques with econometric estimations. 44 , 45 , 46 Figure 1 maps out our analytic process.
FIGURE 1.
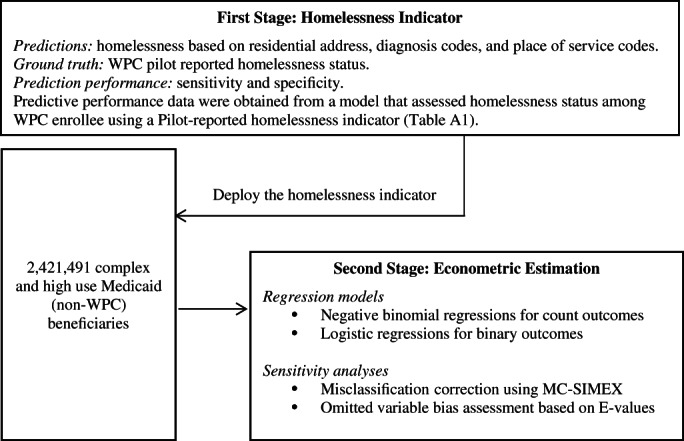
Overview of the two‐stage analytic process to study the associations of homelessness with emergency department visits and hospitalizations. WPC denotes California's Whole Person Care (WPC) Pilot program. MC‐SIMEX denotes the misclassification simulation extrapolation approach. “E‐value” was developed by VanderWeele and Ding (2017) 47 .
2.3.1. First stage: identifying beneficiaries experiencing homelessness
We identified beneficiaries experiencing homelessness (BEH) based on diagnosis codes and place of service codes in Medicaid claims data and textual classification data mining of their residential addresses in Medicaid enrollment data (see Appendix Section 2 for more details). Briefly, based on beneficiaries' residential addresses, we created three homelessness flags: The keyword indicator flagged those with residential addresses that included keywords indicative of homelessness; the non‐existent indicator flagged beneficiaries whose addresses did not match a real residential address by geo‐matching 48 ; the facility indicator flagged beneficiaries whose addresses matched to databases of California substance abuse and mental health treatment centers, hospitals, clinics, and social security administrations. 49 We further created the fourth homelessness flag, the ICD/POS indicator, based on the ICD‐10‐CM (International Classification of Diseases, Tenth Revision, Clinical Modification) diagnosis code (Z59.0) and a standard field in Medicaid data called “place of service” that indicates services provided at a homeless shelter. Based on the 2018 monthly enrollment data, we constructed these four indicators (keyword, non‐existent, facility, ICD/POS). We then aggregated the annual data by categorizing any individual as BEH if they had any of the indicators during any month. Therefore, our homelessness indicator included individuals who may have been housed for part of the year.
2.3.2. Second stage: econometric estimation of health care utilization by race, ethnicity, and gender
We used a negative binomial regression model for the number of ED visits, the number of hospitalizations, and length of stay and accounted for the violation of the equidispersion assumption in our data. We used the number of Medicaid enrollment months () as the exposure variable to adjust for different lengths of observation for health care utilization measures. We estimated:
For binary outcomes, we used a logistic regression model to estimate the likelihood of utilization:
where denotes health care utilization outcomes for individual in 2018. equals to 1 if an individual is flagged as experiencing homelessness by any of our four constructed homelessness indicators in 2018; 0 otherwise. represents a vector of time‐constant covariates, including gender, age groups, race and ethnicity, and primary language. contains a series of 1‐year lagged health measures based on 2017 Medicaid claims data, including CDPS scores, 11 physical health conditions, and 6 behavioral health conditions as listed above. represents the number of months enrolled in Medicaid in 2018. denotes county fixed effects. is the error term. We report heteroskedasticity‐robust standard errors clustered at the county level.
To examine the impact of experiencing homelessness by various races, ethnicity, and gender groups, we tested whether the differential associations of homelessness with ED visits and hospitalizations were statistically significant using models with a three‐way interaction term and reported the marginal effects of homelessness per beneficiary per year by each race and ethnicity and gender group. We also tested the statistical significance of differences in these marginal effects across groups and applied the Bonferroni correction method to correct the significance levels for multiple comparisons. 50 , 51 Results for those who identified their race and ethnicity as “Other or Multiracial,” and “Unknown” were not presented in the main text. However, we report them in the appendix because they had a larger sample representation than other categories (e.g., AIAN).
As sensitivity analyses, we assessed the misclassification bias of the homelessness classifier developed in the first stage by applying the misclassification simulation extrapolation (MC‐SIMEX) approach. 52 , 53 We also assessed the degree of omitted variable bias, or how strongly an unmeasured confounder would explain away the observed association between homelessness and health care utilization conditional on the measured covariates. We used the “E‐value” proposed in VanderWeele and Ding 47 to measure the minimum strength on the risk ratio scale 45 (see Appendix Sections 3 and 4 for more details).
We used SAS 9.4 to construct homelessness indicators and Stata 16.1 for all statistical analyses except for the MC‐SIMEX approach, which was conducted using R 4.1.2.
3. RESULTS
3.1. Comparing BEH and those not experiencing homelessness
Among the 2,421,491 complex and high‐use Medicaid enrollees, 19.54% were identified as BEH, and the rest did not (NBEH) (Table 1). Compared to NBEH, on average BEH had more ED visits (1.57 visits vs. 1.03 visits) and higher proportions of beneficiaries who had frequent ED visits (11.56% vs. 6.05%), any ED visits due to mental health disorders (9.85% vs. 5.96%), and any ED visit due to substance use disorders (9.54% vs. 2.86%). Hospitalizations followed a similar pattern, but the differences were slightly smaller. BEH had more hospitalizations and had higher proportions of individuals who had frequent (2+) and high frequent (4+) hospitalizations per year and had a slightly longer average length of stay (2.03 days vs. 1.56 days).
Compared to NBEH, BEH were generally younger and had a smaller proportion who were female, but a higher proportion who reported English as the preferred language. In addition, BEH had a larger proportion who were AIAN, Black, Unknown racial and ethnic, or White, but a smaller proportion who were Asian, Hispanic, NHOPI, or Other or Multiracial groups. Beneficiaries from both groups had similar lengths of Medicaid enrollment and CDPS scores. Although they shared similar physical health conditions, NBEH reported a slightly higher percentage of some chronic conditions (e.g., diabetes and hypertension). On the other hand, BEH had a higher proportion of beneficiaries who reported having infectious diseases (viral hepatitis and HIV). More importantly, behavioral health conditions were more prevalent among BEH, especially for schizophrenia and other psychosis (10.00% vs. 4.79%), alcohol abuse or dependency (15.21% vs. 11.36%), and drug abuse or dependence (19.63% vs. 7.46%).
3.2. Disparities in ED visits and hospitalizations among BEH
Figure 2 reports ED visits and hospitalizations by race, ethnicity, and gender groups among BEH. In our analytic sample of 473,069 Medicaid BEH, AIAN, Black, and White populations (men and women) had the highest number of ED visits and the highest rate of frequent ED visits, while Asian and NHOPI populations had the lowest number of ED visits. Males had a higher rate of any ED visits due to substance use disorders than females for all racial and ethnic groups. We found fewer variations across racial and ethnic groups in terms of hospitalization, but males had more hospitalizations than females. Males had a higher average number of hospitalizations than females and a higher rate of frequent hospitalizations than females. Males also had a longer length of hospital stay than females for all racial and ethnic groups (see Appendix Tables A2 and A3 for more details).
FIGURE 2.
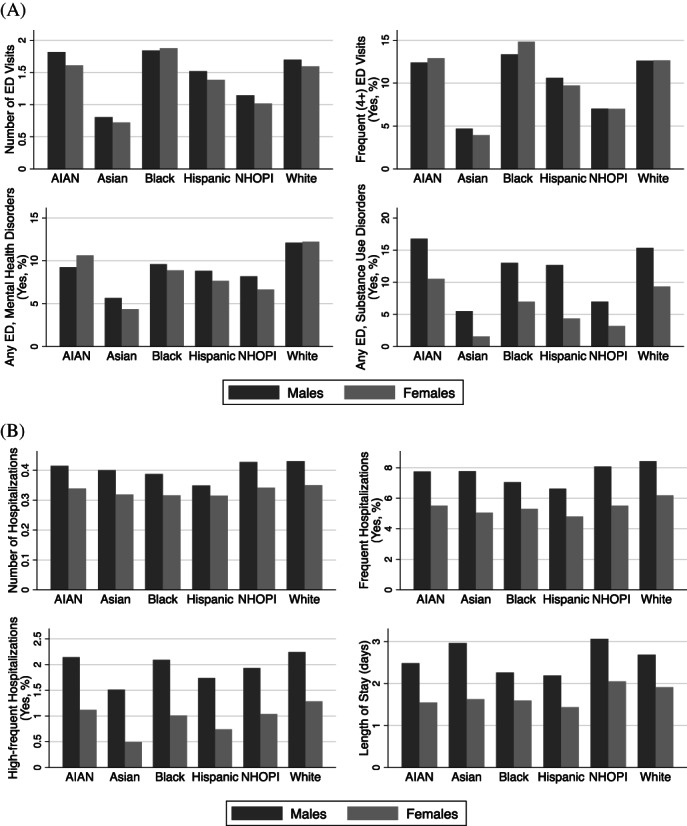
Disparities in emergency department visits and hospitalizations among beneficiaries experiencing homelessness by race, ethnicity, and gender groups. (A) Emergency department visits. (B) Hospitalizations. Shown are unadjusted health care utilization measures for beneficiaries experiencing homelessness (N = 473,069) by race and ethnicity‐gender groups. ED denotes Emergency Department. AIAN denotes American Indian and Alaska Native. NHOPI denotes Native Hawaiian and other Pacific Islander. Tables A2 and A3 describe ED visits and hospitalizations by homelessness status for all race, ethnicity, and gender groups, including those who identified their race/ethnicity as “Other or Multiracial,” and “Unknown.” Race and ethnicity categories are listed in alphabetical order.
3.3. The association between homelessness status and health care utilization
Table 2 displays the marginal effects of homelessness on health care utilization measures after adjusting for demographics and various health conditions. Compared to NBEH, experiencing homelessness was associated with 0.34 more ED visits per beneficiary per year, which was statistically significant. Homelessness was also associated with a higher probability of frequent ED visits (2.77 percentage points [pp]), any ED visits due to mental health disorders (0.79 pp), and any ED visits due to substance use (1.47 pp), which were all statistically significant.
TABLE 2.
Associations of homelessness with emergency department visits and hospitalizations
| Emergency department visits | Hospitalizations | |||||||
|---|---|---|---|---|---|---|---|---|
| Number of ED visits | Frequent (4+) ED visits (pp) | Any ED due to mental health disorders (pp) | Any ED due to substance use disorders (pp) | Number of hospitalizations | Frequent (2+) hospitalizations (pp) | More frequent (4+) hospitalizations (pp) | Length of stay | |
| Homelessness | 0.34*** | 2.77*** | 0.79*** | 1.47*** | 0.03*** | 0.68*** | 0.28*** | 0.53*** |
| (0.02) | (0.07) | (0.06) | (0.05) | (0.01) | (0.10) | (0.05) | (0.06) | |
| Female | 0.05*** | 1.06*** | −0.33*** | −1.83*** | 0.07*** | 0.29*** | −0.16*** | 0.56*** |
| (0.01) | (0.06) | (0.06) | (0.06) | (0.01) | (0.07) | (0.01) | (0.09) | |
| Age groups (ref = 18–34) | ||||||||
| 35–49 | −0.21*** | −1.88*** | −0.62*** | −0.45*** | −0.14*** | −1.60*** | −0.13 | −1.15*** |
| (0.01) | (0.15) | (0.08) | (0.05) | (0.01) | (0.28) | (0.17) | (0.13) | |
| 50–64 | −0.59*** | −5.14*** | −2.19*** | −1.33*** | −0.17*** | −2.13*** | −0.31 | −1.31*** |
| (0.01) | (0.17) | (0.09) | (0.05) | (0.02) | (0.5) | (0.29) | (0.14) | |
| 65+ | −1.04*** | −8.19*** | −3.41*** | −3.27*** | −0.16*** | −2.67*** | −0.45 | −0.42*** |
| (0.04) | (0.19) | (0.35) | (0.1) | (0.05) | (1.06) | (0.55) | (0.19) | |
| English as primary language | −0.09*** | 0.87*** | −0.19 | 0.84*** | −0.08** | −0.05 | −0.09*** | 0.08*** |
| (0.01) | (0.13) | (0.13) | (0.12) | (0.00) | (0.1) | (0.03) | (0.06) | |
| Race/ethnicity (ref = White) | ||||||||
| AIAN | 0.11*** | 0.54** | −0.32* | 0.47*** | 0.005 | 0.01 | 0.05 | −0.07* |
| (0.03) | (0.21) | (0.17) | (0.16) | (0.01) | (0.19) | (0.07) | (0.13) | |
| Asian | −0.34*** | −2.89*** | −0.99*** | −1.33*** | 0.04*** | 0.26 | −0.05 | 0.39*** |
| (0.02) | (0.15) | (0.18) | (0.12) | (0.01) | (0.16) | (0.08) | (0.14) | |
| Black | 0.22*** | 1.94*** | 0.17 | 0.09 | −0.01 | 0.13 | 0.20*** | −0.25** |
| (0.02) | (0.13) | (0.1) | (0.06) | (0.01) | (0.17) | (0.05) | (0.10) | |
| Hispanic | 0.11*** | 0.88*** | 0.34*** | −0.05 | 0.03*** | 0.42** | 0.12** | 0.09 |
| (0.01) | (0.09) | (0.12) | (0.08) | (0.01) | (0.20) | (0.05) | (0.11) | |
| NHOPI | −0.16*** | −1.31*** | −0.54*** | −1.23*** | 0.03*** | 0.36* | 0.05 | 0.50*** |
| (0.03) | (0.19) | (0.14) | (0.13) | (0.01) | (0.21) | (0.09) | (0.13) | |
| Other or multiracial | −0.04*** | −0.33*** | −0.44*** | −0.46*** | 0.007 | −0.09 | −0.12* | −0.03 |
| (0.01) | (0.09) | (0.15) | (0.09) | (0.01) | (0.16) | (0.07) | (0.08) | |
| Unknown | −0.06*** | −0.04 | 0.30* | −0.18*** | −0.01 | −0.02 | 0.15* | −0.17* |
| (0.01) | (0.10) | (0.17) | (0.06) | (0.01) | (0.22) | (0.08) | (0.09) | |
| Medicaid enrolled months | 0.08* | −0.01 | −0.06*** | −0.24*** | −0.03 | |||
| (0.04) | (0.03) | (0.01) | (0.05) | (0.02) | ||||
| 1‐year lagged CDPS score | −0.01 | 0.25*** | −0.10** | −0.08*** | 0.04*** | 0.63*** | 0.21*** | 0.85*** |
| (0.01) | (0.05) | (0.04) | (0.02) | (0.00) | (0.04) | (0.01) | (0.10) | |
Note: Shown are marginal effects from negative binomial regressions models for count outcomes and logistic regression models for binary outcomes. Medicaid enrolled months variable was used as the exposure variable in the negative binomial regression models; no coefficients displayed in the table. All models additionally control for physical health conditions, behavioral health conditions, and county fixed effects. Race and ethnicity categories are listed in alphabetical order. N = 2,421,491. Standard errors clustered at the county level are presented in parentheses.
Abbreviations: AIAN, American Indian and Alaska Native; CDPS, Chronic Illness and Disability Payment System; NHOPI, Native Hawaiian and other Pacific Islander; pp, percentage points.
p < 0.1; **p < 0.05; ***p < 0.01.
We also found a statistically significant impact of homelessness on the number of hospitalizations; experiencing homelessness was related to 0.03 additional hospitalizations per beneficiary per year. Compared to NBEH, BEH had a higher likelihood of frequent hospitalizations (0.68 pp), more frequent hospitalizations (0.28 pp), and longer length of stays (0.53 days). All findings were statistically significant.
3.4. Differential associations of homelessness with health care utilization by race, ethnicity, and gender
Our models with interactions between homelessness, race, and ethnicity, and gender that compare BEH with NBEH within each race and ethnicity‐gender subgroup revealed differential associations of homelessness with ED visits (Figure 3A and Table A4). For males, the associations between homelessness and the number of ED visits for Black and White people were similar and statistically larger than that of Asian and Hispanic individuals (Figure 3A). The association for AIAN people was similar to estimates for Black and White populations, while the association for NHOPI individuals was close to that for Hispanic people. Patterns were somewhat different among females, where the association was significantly larger for Black females than females from other racial and ethnic groups. Comparing differences between genders within each racial and ethnic group showed statistically lower associations of experiencing homelessness with numbers of ED visits for AIAN and White females versus males but no significant differences for other groups.
FIGURE 3.
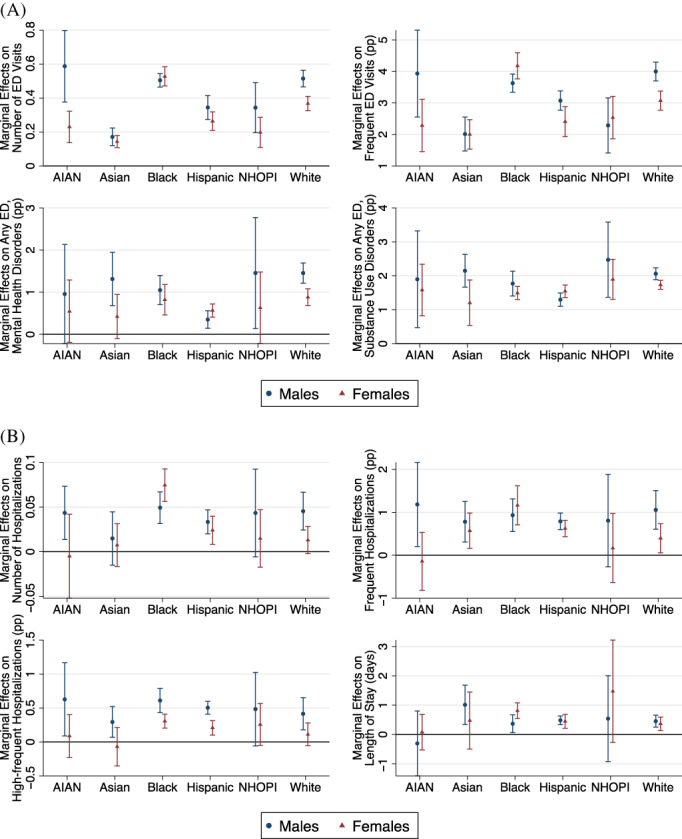
Differential associations of homelessness with emergency department visits and hospitalizations by race, ethnicity, and gender groups. (A) Emergency Department Visits. (B) Hospitalizations. Shown are marginal effects calculated after regression models with a three‐way interaction term for race and ethnicity, gender, and homelessness indicator (N = 2,421,491). Negative binomial regressions were used for count outcomes, while logistic regressions were used for binary outcomes. ED denotes emergency department. pp denotes percentage points. AIAN denotes American Indian and Alaska Native. NHOPI denotes Native Hawaiian and Pacific Islander. Numbers are available in Tables A4 and A5, including those who identified their race and ethnicity as “Other or Multiracial,” and “Unknown.” Statistical significances on pairwise comparisons of marginal effects after Bonferroni correction are consistent with the nonoverlapping of 95% confidence intervals shown in the above figures. Race and ethnicity categories are listed in alphabetical order. [Color figure can be viewed at wileyonlinelibrary.com]
Examining the associations of homelessness with the likelihood of having frequent ED visits, having any ED visits for mental health, and having any ED visits for substance use disorders (Figure 3A) had relatively similar patterns as that of the number of ED visits.
The associations between homelessness and hospitalization outcomes followed similar patterns as ED visits (Figure 3B, Table A5). The associations between homelessness and the number of hospitalizations were statistically similar for males in all racial and ethnic groups. Still, differences by race and ethnicity were observed among females, with a higher marginal number of hospitalizations among Black females than in other racial and ethnic groups.
Examining the associations of homelessness with the likelihood of having frequent hospitalizations, the likelihood of having high frequent hospitalizations, and the average length of stay (Figure 3B) had relatively similar patterns with some minor differences. For example, experiencing homelessness was associated with a significantly higher likelihood of having high frequent hospitalizations for Black and Hispanic males versus females.
Sensitivity Analyses. We found that correcting for misclassification bias increased our estimates of associations by about 2.40 times compared to estimates of models that were not corrected for this bias (Appendix Section 3 and Table A6). Moreover, our omitted variable bias analyses found that E‐values for our models ranged from 1.20 to 9.35 (Table A7), which suggests that omitted variable bias is not a big concern in this study (Appendix Section 4).
4. DISCUSSION
This study showed disparities in ED visits and hospitalizations by race, ethnicity, and gender groups exist among BEH and relative to comparable Medicaid beneficiaries not experiencing homelessness (NBEH). We found that Medicaid BEH had higher utilization of ED visits and hospitalizations than those NBEH in a sample of high utilizer California beneficiaries. Our results showed a larger association for AIAN, Black, NHOPI, and White populations than Asian and Hispanic populations. The association was also larger for males than females across racial and ethnic groups.
Our findings of a higher number of ED visits and hospitalizations and the higher likelihood of four or more such services by BEH versus similarly complex NBEH are consistent with previous studies of low‐income populations experiencing and not experiencing homelessness. 8 , 9 , 10 , 11 , 12 , 13 , 14 Our study improved the estimation of homelessness's impacts with better homelessness measures and a comprehensive sample that includes understudied AIAN, Asian, and NHOPI populations. We can assess the predictive performance of our homelessness identifier (sensitivity = 65.58%, and specificity = 70.19%) and, more importantly, use the information to mitigate potential misclassification bias. Prior studies using the State Inpatient Datasets rely on the homelessness flag reported by hospitals at the time of discharge or death to identify patients experiencing homelessness, but these studies could not assess the measurement and reporting bias in homelessness status. Some researchers have questioned the accuracy of the homelessness flag. 31 , 32 Some other studies have linked Medicaid or all‐payer claims data to administrative records from homelessness‐related programs. 54 , 55 Yet, most of these studies only included homeless people in the analysis. In addition, Medicaid complex and high utilizer NBEH are more comparable to BEH than the general low‐income population and the overall housed Medicaid enrollees used in prior studies. 5 , 19 As such, the independent influence of homelessness can be more accurately isolated in our study.
Among BEH, we found that AIAN, Black, and White populations (men and women) had the highest ED visits than other racial/ethnic groups. However, we found fewer variations across racial and ethnic groups regarding hospitalization among BEH, although males had more hospitalizations than females. The lower overall rates of acute care utilization for women may be because women experiencing homelessness are more likely to use outpatient care rather than hospitalizations. 5 , 14 Existing structural barriers to accessing health care systems could compound the different patterns in health care utilization among the homeless population. 56 , 57 For example, Asian Americans experiencing homelessness may have more access barriers due to lack of cultural competency of providers, variation in health navigation skills, and stigma associated with the use of services for mental illness or substance use disorders. 58 , 59 , 60 The COVID‐19 pandemic may have worsened these access disparities for Asian Americans. 61 , 62
Our findings of a higher likelihood of ED visits for mental health disorders and substance use disorders associated with homelessness are consistent with the higher prevalence of these conditions among those experiencing homelessness. 5 , 8 Other research that highlights reasons for higher use of acute services includes restricted access to primary care and medications, inability to manage care, challenges in complying with provider recommendations and prescription use, seeking shelter at the ED, and discrimination and exclusion due to housing status. 3 , 63 , 64 Research also indicates that exposure to harsh conditions such as weather or violence can also increase the use of the ED and hospitals. 65 , 66
Our new findings on the differential associations of homelessness with ED visits and hospitalizations by racial/ethnic and gender groups are noteworthy. Many barriers could worsen health care access and utilization for BEH. For example, the high rates of ED visits and hospitalizations among Black men and women may result from increased violence on the streets, limited access to outpatient care, or the ability to get medications. 67 , 68 The smaller association for Hispanic males and females may reflect a higher likelihood of intermittent homelessness because they may have opportunities to live with family or friends and avoid continuous exposure to harsh conditions while unhoused. 20 Prior evidence showed that women were less likely to use hospital services but more likely to use physician services. 69 Furthermore, the rate of unsheltered homeless is much higher for AIAN and NHOPI populations (56% and 57%, respectively) relative to the Black population (25%) and homeless individuals overall (37%), which partly explains the larger association of homelessness and acute health care utilization such as ED visits and hospitalizations. 70
4.1. Limitations
First, our method of identifying those experiencing homelessness is imperfect, but we aimed to address this problem by assessing the level of misclassification bias.
Second, our cross‐sectional methodology did not assess causal relationships between homelessness and service use. The control of 1‐year lagged health status measures partially accounted for reverse causality concerns when using health status indicators. While we controlled for physical and behavioral health conditions in our analyses, we lacked data on exposure to adverse events while experiencing homelessness or barriers to health care use and self‐care. We addressed these problems by further analyses and found that our estimates were robust to omitted variable bias.
Third, our data lacked relevant socioeconomic variables, past experiences of discrimination or trauma, and homelessness experiences that may have led to different use patterns. This prevented us from investigating all reasons attributed to the differential associations by groups.
Fourth, our study relied on Medicaid claims and enrollment data. The data inevitably excluded individuals who did not enroll in Medicaid (e.g., veterans) and uninsured individuals; our study also does not account for the avoidance of health care. In addition, although transgender and gender nonconforming homelessness is very prevalent in the United States, our measure of gender from enrollment data only includes males and females. 71
Last, we used data from 2018, which was before the COVID‐19 pandemic. Our results may not be generalizable to the years after the pandemic. As the COVID‐19 pandemic disproportionately affects people of color and women, disparities in homelessness and its related impacts on health care utilization may worsen and warrant further research.
4.2. Policy implications
Our findings have implications for policies that can promote health equity. Policies can promote the use of promising interventions such as care coordination to increase the integration of medical, behavioral, and social services to address all the patients' needs. Inclusion of services such as housing support, medical respite, and recuperative care in Medicaid is crucial. Programs based on the concept of Housing First reduce exposure to adverse conditions and reduce the need for acute services. 72 Provision of respite care following hospitalizations reduces readmissions. 72 Provision of recuperative care will reduce the use of ED for services that can be provided at lower intensity settings.
Our findings of differential use of acute services by race, ethnicity, and gender suggest that optimal strategies to improve the health of the unhoused require tailored interventions for each group. For example, addressing the high use of ED among unhoused Black females and the higher likelihood of death for these women found in other research indicate the need to prioritize outreach to this group. 73 These programs should consider the unique vulnerabilities from racism, sexism, and state‐perpetrated violence like racialized incarceration and the disproportionate burden from the COVID‐19 pandemic on this group. 74 , 75 , 76 , 77 Prior evidence suggests tailored primary care service design was related to better care experience among patients experiencing homelessness. 78
Interventions should also consider variations in factors contributing to homelessness, barriers to outpatient services and self‐care, and support services that assist patients with getting culturally competent care. Current efforts to curtail the high use of costly care in California and elsewhere have included implementing programs such as WPC that focus on high utilizing beneficiaries and providing supportive housing services to increase the likelihood of being housed and remaining so. The evidence from evaluations of this program indicates the importance of using community health workers and peers with lived experience to build rapport and trust and effectively coordinate the care needed by BEH. 37 Racial, ethnic, and gender concordance of these providers with these beneficiaries is likely to increase the effectiveness of these interventions. Future research is warranted to elucidate potential drivers for the differential associations of homelessness with ED visits and hospitalizations by race, ethnicity, and gender.
In addition, policies that address the underlying causes of homelessness are needed. These included policies that reduce structural inequities such as lack of affordable housing, income inequities, and incarceration in lieu of adequate behavioral health and social services. 15 , 79 Policies that address structural racism and discrimination in housing, employment, and criminalization are also needed. 80 Policies are also needed to improve social determinants of health, including employment training, affordable housing, and economic support.
5. CONCLUSIONS
Using an innovative method to identify BEH from the large administrative data, we provided new evidence on how homelessness and race, ethnicity, and gender differences impact health care utilization, particularly for those frequently underrepresented in data and research, including AIAN, Asian, and NHOPI populations. We showed differential associations by race, ethnicity, and gender groups. Our findings are fundamental and useful for effective strategies to pursue health equity by addressing homelessness and its consequences.
Supporting information
Appendix S1: Online appendix
ACKNOWLEDGMENTS
Preliminary results of this study were presented at the AcademyHealth Annual Research Meeting on June 15, 2021. The project was funded by the California Department of Health Care Services.
Yue D, Pourat N, Essien EA, Chen X, Zhou W, O'Masta B. Differential associations of homelessness with emergency department visits and hospitalizations by race, ethnicity, and gender. Health Serv Res. 2022;57(Suppl. 2):249‐262. doi: 10.1111/1475-6773.14009
Funding information California Department of Health Care Services
REFERENCES
- 1. The U.S. Department of Housing and Urban Development . The 2020 Annual Homeless Assessment Report to Congress. 2021. Accessed December 14, 2021. https://www.huduser.gov/portal/sites/default/files/pdf/2020-AHAR-Part-1.pdf
- 2. The U.S. Department of Housing and Urban Development . The 2016 Annual Homeless Assessment Report (AHAR) to Congress. U.S. Department of Housing and Urban Development; 2016. [Google Scholar]
- 3. Fazel S, Geddes JR, Kushel M. The health of homeless people in high‐income countries: descriptive epidemiology, health consequences, and clinical and policy recommendations. Lancet. 2014;384(9953):1529‐1540. [DOI] [PMC free article] [PubMed] [Google Scholar]
- 4. Hwang SW. Homelessness and health. CMAJ. 2001;164(2):229‐233. [PMC free article] [PubMed] [Google Scholar]
- 5. Lebrun‐Harris LA, Baggett TP, Jenkins DM, et al. Health status and health care experiences among homeless patients in federally supported health centers: findings from the 2009 patient survey. Health Serv Res. 2013;48(3):992‐1017. [DOI] [PMC free article] [PubMed] [Google Scholar]
- 6. Hwang SW, Wilkins R, Tjepkema M, O'Campo PJ, Dunn JR. Mortality among residents of shelters, rooming houses, and hotels in Canada: 11 year follow‐up study. BMJ. 2009;339:b4036. [DOI] [PMC free article] [PubMed] [Google Scholar]
- 7. Morrison DS. Homelessness as an independent risk factor for mortality: results from a retrospective cohort study. Int J Epidemiol. 2009;38(3):877‐883. [DOI] [PubMed] [Google Scholar]
- 8. Amato S, Nobay F, Amato DP, Abar B, Adler D. Sick and unsheltered: homelessness as a major risk factor for emergency care utilization. Am J Emerg Med. 2019;37(3):415‐420. [DOI] [PubMed] [Google Scholar]
- 9. Chambers C, Chiu S, Katic M, et al. High utilizers of emergency health services in a population‐based cohort of homeless adults. Am J Public Health. 2013;103 Suppl 2(S2):S302‐S310. [DOI] [PMC free article] [PubMed] [Google Scholar]
- 10. Mitchell MS, Leon CLK, Byrne TH, Lin WC, Bharel M. Cost of health care utilization among homeless frequent emergency department users. Psychol Serv. 2017;14(2):193‐202. [DOI] [PubMed] [Google Scholar]
- 11. Hwang SW, Weaver J, Aubry T, Hoch JS. Hospital costs and length of stay among homeless patients admitted to medical, surgical, and psychiatric services. Med Care. 2011;49(4):350‐354. [DOI] [PubMed] [Google Scholar]
- 12. Salit SA, Kuhn EM, Hartz AJ, Vu JM, Mosso AL. Hospitalization costs associated with homelessness in New York City. N Engl J Med. 1998;338(24):1734‐1740. [DOI] [PubMed] [Google Scholar]
- 13. Kushel MB, Perry S, Bangsberg D, Clark R, Moss AR. Emergency department use among the homeless and marginally housed: results from a community‐based study. Am J Public Health. 2002;92(5):778‐784. [DOI] [PMC free article] [PubMed] [Google Scholar]
- 14. Lin WC, Bharel M, Zhang J, O'Connell E, Clark RE. Frequent emergency department visits and hospitalizations among homeless people with Medicaid: implications for Medicaid expansion. Am J Public Health. 2015;105(Suppl 5):S716‐S722. [DOI] [PMC free article] [PubMed] [Google Scholar]
- 15. Lee BA, Tyler KA, Wright JD. The new homelessness revisited. Annu Rev Sociol. 2010;36(1):501‐521. [DOI] [PMC free article] [PubMed] [Google Scholar]
- 16. Flanagin A, Frey T, Christiansen SL, AMA Manual of Style Committee . Updated guidance on the reporting of race and ethnicity in medical and science journals. JAMA. 2021;326(7):621‐627. [DOI] [PubMed] [Google Scholar]
- 17. Paul DW Jr, Knight KR, Olsen P, Weeks J, Yen IH, Kushel MB. Racial discrimination in the life course of older adults experiencing homelessness: results from the HOPE HOME study. J Soc Distress Homeless. 2020;29(2):184‐193. [DOI] [PMC free article] [PubMed] [Google Scholar]
- 18. Markowitz FE, Syverson J. Race, gender, and homelessness stigma: effects of perceived blameworthiness and dangerousness. Deviant Behav. 2021;42(7):919‐931. [Google Scholar]
- 19. Yamamoto A, Needleman J, Gelberg L, Kominski G, Shoptaw S, Tsugawa Y. Association between homelessness and opioid overdose and opioid‐related hospital admissions/emergency department visits. Soc Sci Med. 2019;242:112585. [DOI] [PMC free article] [PubMed] [Google Scholar]
- 20. Jones MM. Does race matter in addressing homelessness? A review of the literature. World Med Health Policy. 2016;8(2):139‐156. [DOI] [PMC free article] [PubMed] [Google Scholar]
- 21. Gelberg L, Andersen R, Longshore D, et al. Hospitalizations among homeless women: are there ethnic and drug abuse disparities? J Behav Health Serv Res. 2009;36(2):212‐232. [DOI] [PMC free article] [PubMed] [Google Scholar]
- 22. Smereck GA, Hockman EM. Prevalence of HIV infection and HIV risk behaviors associated with living place: on‐the‐street homeless drug users as a special target population for public health intervention. Am J Drug Alcohol Abuse. 1998;24(2):299‐319. [DOI] [PubMed] [Google Scholar]
- 23. North CS, Smith EM. Comparison of white and nonwhite homeless men and women. Soc Work. 1994;39(6):639‐647. [PubMed] [Google Scholar]
- 24. Weinreb L, Goldberg R, Perloff J. Health characteristics and medical service use patterns of sheltered homeless and low‐income housed mothers. J Gen Intern Med. 1998;13(6):389‐397. [DOI] [PMC free article] [PubMed] [Google Scholar]
- 25. Gelberg L, Andersen RM, Leake BD. The behavioral model for vulnerable populations: application to medical care use and outcomes for homeless people. Health Serv Res. 2000;34(6):1273‐1302. [PMC free article] [PubMed] [Google Scholar]
- 26. Kushel MB, Vittinghoff E, Haas JS. Factors associated with the health care utilization of homeless persons. JAMA. 2001;285(2):200‐206. [DOI] [PubMed] [Google Scholar]
- 27. Larimer ME, Malone DK, Garner MD, et al. Health care and public service use and costs before and after provision of housing for chronically homeless persons with severe alcohol problems. JAMA. 2009;301(13):1349‐1357. [DOI] [PubMed] [Google Scholar]
- 28. Wadhera RK, Choi E, Shen C, Yeh RW, Joynt Maddox KE. Trends, causes, and outcomes of hospitalizations for homeless individuals: a retrospective cohort study. Med Care. 2019;57(1):21‐27. [DOI] [PMC free article] [PubMed] [Google Scholar]
- 29. Wadhera RK, Khatana SAM, Choi E, et al. Disparities in care and mortality among homeless adults hospitalized for cardiovascular conditions. JAMA Intern Med. 2020;180(3):357‐366. [DOI] [PMC free article] [PubMed] [Google Scholar]
- 30. Khatana SAM, Wadhera RK, Choi E, et al. Association of Homelessness with hospital readmissions‐an analysis of three large states. J Gen Intern Med. 2020;35(9):2576‐2583. [DOI] [PMC free article] [PubMed] [Google Scholar]
- 31. Bensken WP. How do we define homelessness in large health care data? Identifying variation in composition and comorbidities. Health Serv Outcomes Res Methodol. 2021;21(1):145‐166. [Google Scholar]
- 32. Murugiah K, Wang Y, Krumholz HM. Database inaccuracies and disparities in care among homeless adults hospitalized for cardiovascular conditions. JAMA Intern Med. 2020;180(4):612‐613. [DOI] [PubMed] [Google Scholar]
- 33. Wenham C, Smith J, Davies SE, et al. Women are most affected by pandemics—lessons from past outbreaks. Nature. 2020;583(7815):194‐198. [DOI] [PubMed] [Google Scholar]
- 34. Karaca‐Mandic P, Georgiou A, Sen S. Assessment of COVID‐19 hospitalizations by race/ethnicity in 12 states. JAMA Intern Med. 2021;181(1):131‐134. [DOI] [PMC free article] [PubMed] [Google Scholar]
- 35. The U.S. Department of Housing and Urban Development . The 2019 Annual Homeless Assessment Report to Congress. U.S. Department of Housing and Urban Development; 2020. [Google Scholar]
- 36. California Department of Health Care Services . Whole Person Care Pilots. 2021. Accessed December 30, 2021. https://www.dhcs.ca.gov/services/Pages/WholePersonCarePilots.aspx
- 37. Chuang E, Pourat N, Haley LA, O'Masta B, Albertson E, Lu C. Integrating Health And Human Services In California's Whole Person Care Medicaid 1115 Waiver Demonstration: an overview of a California demonstration program focused on improving the integrated delivery of health, behavioral health, and social services for certain Medicaid beneficiaries. Health Aff (Millwood). 2020;39(4):639‐648. [DOI] [PubMed] [Google Scholar]
- 38. Pourat N, Chuang E, Chen X, et al. Interim Evaluation of California's Whole Person Care (WPC) Program. UCLA Center for Health Policy Research; 2019. [Google Scholar]
- 39. Hunt KA, Weber EJ, Showstack JA, Colby DC, Callaham ML. Characteristics of frequent users of emergency departments. Ann Emerg Med. 2006;48(1):1‐8. [DOI] [PubMed] [Google Scholar]
- 40. Lei Matsumoto C, O'Driscoll T, Madden S, Blakelock B, Lawrance J, Kelly L. Defining “high‐frequency” emergency department use: does one size fit all for urban and rural areas? Can Fam Physician. 2017;63(9):e395‐e399. [PMC free article] [PubMed] [Google Scholar]
- 41. Fouayzi H, Ash AS. High‐frequency hospital users: The tail that wags the readmissions dog. Health Serv Res. 2021;57:579‐586. [DOI] [PMC free article] [PubMed] [Google Scholar]
- 42. Raslevich A, Kwon Y. Improving Health Equity in Medicaid: Data Needs, Challenges, and Opportunities. 2022. Accessed April 2, 2022. https://academyhealth.org/blog/2022-03/improving-health-equity-medicaid-data-needs-challenges-and-opportunities
- 43. Kronick R, Gilmer T, Dreyfus T, Lee L. Improving health‐based payment for Medicaid beneficiaries: CDPS. Health Care Financ Rev. 2000;21(3):29‐64. [PMC free article] [PubMed] [Google Scholar]
- 44. Moreno A, Terwiesch C. Doing business with strangers: reputation in online service marketplaces. Inf Syst Res. 2014;25(4):865‐886. [Google Scholar]
- 45. Jelveh Z, Kogut B, Naidu S. Political language in economics. Columbia Business School Research Paper 14‐57; 2018.
- 46. Fisher IE, Garnsey MR, Hughes ME. Natural language processing in accounting, auditing and finance: a synthesis of the literature with a roadmap for future research. Intell Syst Account Finance Manag. 2016;23(3):157‐214. [Google Scholar]
- 47. VanderWeele TJ, Ding P. Sensitivity analysis in observational research: introducing the e‐value. Ann Intern Med. 2017;167(4):268‐274. [DOI] [PubMed] [Google Scholar]
- 48. SAS . Proc Geocode. 2020. Accessed July 11, 2020. https://support.sas.com/rnd/datavisualization/mapsonline/html/geocode.html#overview
- 49. The U.S. Department of Health & Human Services . Substance Abuse and Mental Health Services Administration. 2020. Accessed July 11, 2020. https://findtreatment.samhsa.gov/locator
- 50. Dawson J, Richter AW. A Significance Test of Slope Differences for Three‐Way Interactions in Moderated Multiple Regression Analysis. Aston Business School; 2004. [Google Scholar]
- 51. UCLA Statistical Consulting Group . How can I understand a 3‐way continuous interaction? Stata 12 FAQ. 2021. Accessed January 20, 2022. https://stats.oarc.ucla.edu/stata/faq/how-can-i-understand-a-3-way-continuous-interaction-stata-12/
- 52. Yang M, Adomavicius G, Burtch G, Ren Y. Mind the gap: accounting for measurement error and misclassification in variables generated via data mining. Inf Syst Res. 2018;29(1):4‐24. [Google Scholar]
- 53. Kuchenhoff H, Mwalili SM, Lesaffre E. A general method for dealing with misclassification in regression: the misclassification SIMEX. Biometrics. 2006;62(1):85‐96. [DOI] [PubMed] [Google Scholar]
- 54. Bharel M, Lin WC, Zhang J, O'Connell E, Taube R, Clark RE. Health care utilization patterns of homeless individuals in Boston: preparing for Medicaid expansion under the Affordable Care Act. Am J Public Health. 2013;103 Suppl 2(Suppl 2):S311‐S317. [DOI] [PMC free article] [PubMed] [Google Scholar]
- 55. Treglia D, Johns EL, Schretzman M, et al. When crises converge: hospital visits before and after shelter use among homeless New Yorkers. Health Aff (Millwood). 2019;38(9):1458‐1467. [DOI] [PubMed] [Google Scholar]
- 56. Mayberry RM, Mili F, Ofili E. Racial and ethnic differences in access to medical care. Med Care Res Rev. 2000;57(1_suppl):108‐145. [DOI] [PubMed] [Google Scholar]
- 57. Yue D, Rasmussen PW, Ponce NA. Racial/ethnic differential effects of Medicaid expansion on health care access. Health Serv Res. 2018;53(5):3640‐3656. [DOI] [PMC free article] [PubMed] [Google Scholar]
- 58. Leong FT, Lau AS. Barriers to providing effective mental health services to Asian Americans. Ment Health Serv Res. 2001;3(4):201‐214. [DOI] [PubMed] [Google Scholar]
- 59. Kim W, Keefe RH. Barriers to healthcare among Asian Americans. Soc Work Public Health. 2010;25(3):286‐295. [DOI] [PubMed] [Google Scholar]
- 60. Ta VM, Juon HS, Gielen AC, Steinwachs D, Duggan A. Disparities in use of mental health and substance abuse services by Asian and Native Hawaiian/other Pacific Islander women. J Behav Health Serv Res. 2008;35(1):20‐36. [DOI] [PMC free article] [PubMed] [Google Scholar]
- 61. Quach T, Ðoàn LN, Liou J, Ponce NA. A rapid assessment of the impact of COVID‐19 on Asian Americans: cross‐sectional survey study. JMIR Public Health Surveill. 2021;7(6):e23976. [DOI] [PMC free article] [PubMed] [Google Scholar]
- 62. CareQuest Institute for Oral Health . COVID‐19 Pandemic Disproportionately Impacting Access to Health Care for Asian Americans. 2022. Accessed April 7, 2022. https://www.carequest.org/about/news/covid-19-pandemic-disproportionately-impacting-access-health-care-asian-americans
- 63. Johnstone M, Jetten J, Dingle GA, Parsell C, Walter ZC. Discrimination and well‐being amongst the homeless: the role of multiple group membership. Front Psychol. 2015;6:739. [DOI] [PMC free article] [PubMed] [Google Scholar]
- 64. Elwell‐Sutton T, Fok J, Albanese F, Mathie H, Holland R. Factors associated with access to care and healthcare utilization in the homeless population of England. J Public Health (Oxf). 2017;39(1):26‐33. [DOI] [PubMed] [Google Scholar]
- 65. Maness DL, Khan M. Care of the homeless: an overview. Am Fam Physician. 2014;89(8):634‐640. [PubMed] [Google Scholar]
- 66. Partis M. Hope in homeless people: a phenomenological study. Prim Health Care Res Dev. 2003;4(1):9‐19. [Google Scholar]
- 67. Manuel JI. Racial/ethnic and gender disparities in health care use and access. Health Serv Res. 2018;53(3):1407‐1429. [DOI] [PMC free article] [PubMed] [Google Scholar]
- 68. Mama A. Violence against black women: gender, race and state responses. Fem Rev. 1989;32(1):30‐48. [Google Scholar]
- 69. Song J, Chang RW, Manheim LM, Dunlop DD. Gender differences across race/ethnicity in use of health care among Medicare‐aged Americans. J Womens Health. 2006;15(10):1205‐1213. [DOI] [PubMed] [Google Scholar]
- 70. National Alliance to End Homelessness . State of Homelessness: A Look at Race and Ethnicity. 2021. Accessed January 19, 2021. https://endhomelessness.org/state-of-homelessness-a-look-at-race-and-ethnicity/
- 71. Flentje A, Leon A, Carrico A, Zheng D, Dilley J. Mental and physical health among homeless sexual and gender minorities in a major urban US city. J Urban Health. 2016;93(6):997‐1009. [DOI] [PMC free article] [PubMed] [Google Scholar]
- 72. Hwang SW, Burns T. Health interventions for people who are homeless. Lancet. 2014;384(9953):1541‐1547. [DOI] [PubMed] [Google Scholar]
- 73. Herrera S, Colletti J. Black Women Dying Homeless in Los Angeles City and County. Hub for Urban Initiatives; 2020. [Google Scholar]
- 74. Schmitt M, Dressel A, Del Carmen Graf M, et al. Adverse childhood experiences among previously homeless African American women. Public Health Nurs. 2022;39(2):446‐455. [DOI] [PubMed] [Google Scholar]
- 75. Heberle AE, Obus EA, Gray SAO. An intersectional perspective on the intergenerational transmission of trauma and state‐perpetrated violence. J Soc Issues. 2020;76(4):814‐834. [Google Scholar]
- 76. Walton QL, Campbell RD, Blakey JM. Black women and COVID‐19: The need for targeted mental health research and practice. Qual Soc Work. 2021;20(1‐2):247‐255. [DOI] [PMC free article] [PubMed] [Google Scholar]
- 77. Gur RE, White LK, Waller R, et al. The disproportionate burden of the COVID‐19 pandemic among pregnant black women. Psychiatry Res. 2020;293:113475. [DOI] [PMC free article] [PubMed] [Google Scholar]
- 78. Kertesz SG, Holt CL, Steward JL, et al. Comparing homeless persons' care experiences in tailored versus nontailored primary care programs. Am J Public Health. 2013;103(S2):S331‐S339. [DOI] [PMC free article] [PubMed] [Google Scholar]
- 79. Crane M, Byrne K, Fu R, et al. The causes of homelessness in later life: findings from a 3‐nation study. J Gerontol B Psychol Sci Soc Sci. 2005;60(3):S152‐S159. [DOI] [PubMed] [Google Scholar]
- 80. Olivet J, Wilkey C, Richard M, et al. Racial inequity and homelessness: findings from the SPARC study. Ann Am Acad Polit Soc Sci. 2021;693(1):82‐100. [Google Scholar]
Associated Data
This section collects any data citations, data availability statements, or supplementary materials included in this article.
Supplementary Materials
Appendix S1: Online appendix