

Abstract
Purpose:
This study estimates the rural-urban differences in outpatient service utilization and expenditures for depression, anxiety disorder, and substance use disorder, and the evolving mental health provider mix for privately insured US adults aged 18–64 during 2005–2018.
Methods:
We used the IBM MarketScan Commercial Claims and Encounters Database for individuals covered by employer-sponsored health insurance, from 2005 to 2018, with a yearly total number of beneficiaries ranging from 17.5 to 53.1 million. Claims for nonelderly adults with mental health and substance abuse coverage are included. Outcomes include rates of outpatient service utilization for depression, anxiety disorder, and substance use disorder; counts of outpatient visits; expenditure and share of the out-of-pocket cost; and the mental health services provider mix.
Findings:
Rural enrollees were less likely than urban enrollees to use outpatient mental health services for depression by 1.2% (percentage points) in 2005 and 0.6% in 2018. Among those who used outpatient mental health services, rural enrollees had fewer outpatient visits than their urban counterparts (difference: 1.8–2.4 visits for depression, 1.2–1.7 visits for anxiety disorder, and 0.7–2.1 visits for substance use disorder). Rural patients paid less per year for mental health outpatient visits of the 3 conditions but incurred a higher share of out-of-pocket expenses. Rural and urban patients differ in the mix of mental health providers, with rural enrollees relying more on primary care providers than urban enrollees.
Conclusions:
Rural-urban disparities in access to mental health services persist during 2005–2018 among a population with private insurance.
Keywords: anxiety disorder, depression, employer-sponsored insurance, rural-urban disparities, substance use disorder
INTRODUCTION
Mental illnesses pose significant health and economic burdens in the United States.1,2 In 2014, about 1 in 5 (43.6 million) adults aged 18 or older had any mental illness in the past year.1 Estimated spending related to mental health and substance use disorder (SUD) increased from $201 billion in 2013 to $280.5 billion by 2020.2,3
Studies indicate increasing rates of mental health service utilization.4–6 For example, the proportion of the population receiving outpatient services for anxiety disorders increased during 1987–1999.5 Data from the Medical Expenditure Panel Survey (MEPS) show that the percentage of adults with mental health outpatient visits increased from 2004 to 2015.4,6 The increase is largely accounted for by visits from adults with less serious psychological distress.4
The mental health service provider mix has evolved. Most increases in adult outpatient mental health visits between 2008 and 2015 appear to be with providers other than specialty providers and primary care physicians.6
Rural-urban disparities in access to mental health services exist.7 In 2003–2004, rural adults had a greater need for mental health services but fewer office-based mental health visits than urban adults.8 Contributing factors included higher proportions of older adults, lower incomes, slightly higher unemployment rates, the stigma associated with seeking mental health treatment, and fewer and less well-trained health care providers in rural areas.9–11 The mental health provider mix differs by rural and urban status. For fee-for-service Medicare beneficiaries in 2014, rural beneficiaries were more likely to visit primary care providers, including generalist physicians, nurse practitioners (NPs), and physician assistants (PAs), while urban beneficiaries saw more behavioral health specialists.12
In this study, we examine the trends in 12-month mental health services utilization for depression, anxiety disorder, and SUD by rural and urban residence in a large sample of adult beneficiaries aged 18–64 with employer-sponsored insurance (ESI) during 2005–2018. We also assess the trends in associated medical expenditures and out-of-pocket (OOP) payments and the evolving provider mix over the study period.
METHODS
Data
Fourteen years (2005–2018) of outpatient claims data were extracted from the IBM MarketScan Commercial Claims and Encounters (CCAE) Database. The MarketScan CCAE Database contains claims data from larger employers and insurance plans for active employees, early retirees, Consolidated Omnibus Budget Reconciliation Act (COBRA) continuees, and dependents. It covers a large portion of the US population with ESI plans, with 16.2 million enrollees in 2006 to 53.1 million in 2012. Claim and patient-level information, including age, sex, geographic location, diagnostic codes, and payment information, was available for analysis.
Study samples
We limited the analytic sample to those aged 18–64 with mental health and substance abuse (MHSA) coverage. Following prior studies, we focused on outpatient claims because patients are more likely to seek inpatient mental health care away from their rural residences than outpatient services.4–6,13
Mental health conditions
We examined depression and anxiety as they are more prevalent than other mental health conditions in the United States, and SUD because of its significant morbidity and economic burden.14–16 We used the primary diagnosis code to ascertain these conditions.14 A set of the International Classification of Diseases, Ninth Revision, Clinical Modification (ICD-9-CM) codes for depression, anxiety, and SUD was developed based on the existing literature (see online Appendix Table 1).14,15 Corresponding ICD-10-CM codes were used for claims after October 2015.
Analysis
The rates for the conditions were calculated as the number of enrollees who had at least 1 outpatient claim with the primary diagnosis code for the condition, divided by the total number of enrollees aged 18–64 and with MHSA coverage during the year. Because there may be multiple claims submitted for 1 visit, we consolidated an enrollee’s claims with a common service date into 1 visit. The average number of visits among those who had at least 1 related outpatient visit was calculated as the ratio of the total number of visits to the number of enrollees who had at least 1 outpatient claim for the condition in question. The total payment is the sum of the insurer’s payment, coordination of benefits, and OOP payment, including copayment, coinsurance, and deductible. An enrollee was considered living in a rural area if he/she lived in a nonmetropolitan area,17 as coded in the MarketScan CCAE database. The metropolitan status was based on the Office of Management and Budget delineations and mapped from the 5-digit ZIP Code of the primary beneficiary’s address.
Rates of mental health services utilization and the average number of visits among those with at least 1 visit for depression, anxiety disorder, and SUD are presented by rural and urban (Figure 1). Medical spending and OOP payment share associated with depression, anxiety disorder, and SUD by rural and urban are in Table 1. The payment variables are adjusted to 2019 dollars using the Gross Domestic Product price index.18 The mental health provider mix by rural and urban during 2005–2018 is shown in Figure 2. The mix included family physicians and general practitioners, NPs/PAs, psychiatrists, psychologists, therapists/clinical social workers, and others.
FIGURE 1.

Percent of enrollees aged 18–64 with at least 1 outpatient visit with primary diagnosis of the 3 mental health conditions and average number of related outpatient visits by rural and urban enrollees: 2005–2018 MarketScan CCAE Database
Source/Notes: Authors’ analysis of data from the MarketScan Commercial Claims and Encounters database, 2005–2018.
TABLE 1.
Spending and out of pocket payment (OOP) share associated with depression, anxiety disorder, and substance use disorder, adult enrollees from the MarketScan CCAE Database, 2005–2018
| Year | Depression |
Anxiety disorder |
Substance use disorder |
|||||||||
|---|---|---|---|---|---|---|---|---|---|---|---|---|
| Payment |
OOP share |
Payment |
OOP share |
Payment |
OOP share |
|||||||
| Urban | Rural | Urban | Rural | Urban | Rural | Urban | Rural | Urban | Rural | Urban | Rural | |
| 2005 | $474 | $289 | 22.32% | 27.62% | $103 | $71 | 25.32% | 31.72% | $71 | $52 | 13.31% | 19.69% |
| 2006 | $447 | $286 | 24.14% | 27.25% | $96 | $69 | 27.53% | 30.71% | $67 | $55 | 14.01% | 19.04% |
| 2007 | $407 | $237 | 25.04% | 26.15% | $96 | $61 | 27.76% | 28.07% | $69 | $52 | 14.77% | 19.79% |
| 2008 | $402 | $216 | 25.56% | 26.13% | $111 | $61 | 27.52% | 27.82% | $72 | $51 | 15.43% | 19.56% |
| 2009 | $388 | $199 | 25.86% | 27.11% | $110 | $59 | 28.32% | 28.92% | $72 | $54 | 15.88% | 19.78% |
| 2010 | $388 | $191 | 30.35% | 27.12% | $115 | $61 | 30.47% | 28.36% | $80 | $54 | 15.39% | 18.90% |
| 2011 | $341 | $165 | 26.49% | 26.80% | $108 | $59 | 27.59% | 28.43% | $92 | $59 | 14.58% | 18.17% |
| 2012 | $312 | $157 | 25.62% | 26.43% | $109 | $62 | 27.34% | 28.58% | $111 | $67 | 14.44% | 18.64% |
| 2013 | $312 | $150 | 25.93% | 27.72% | $120 | $63 | 28.30% | 30.35% | $141 | $86 | 14.21% | 17.61% |
| 2014 | $262 | $126 | 26.38% | 26.89% | $111 | $59 | 28.91% | 29.65% | $151 | $86 | 14.27% | 17.50% |
| 2015 | $294 | $139 | 28.08% | 30.00% | $134 | $74 | 31.57% | 34.41% | $303 | $174 | 13.41% | 16.46% |
| 2016 | $295 | $138 | 26.94% | 30.63% | $144 | $84 | 31.52% | 35.00% | $262 | $160 | 14.81% | 18.36% |
| 2017 | $294 | $137 | 27.43% | 31.37% | $148 | $86 | 32.44% | 35.99% | $254 | $148 | 14.98% | 19.66% |
| 2018 | $289 | $136 | 27.74% | 32.34% | $159 | $91 | 32.28% | 36.26% | $211 | $137 | 16.08% | 19.34% |
Source: Authors’ analysis of data from the MarketScan Commercial Claims and Encounters database, 2005–2018.
FIGURE 2.
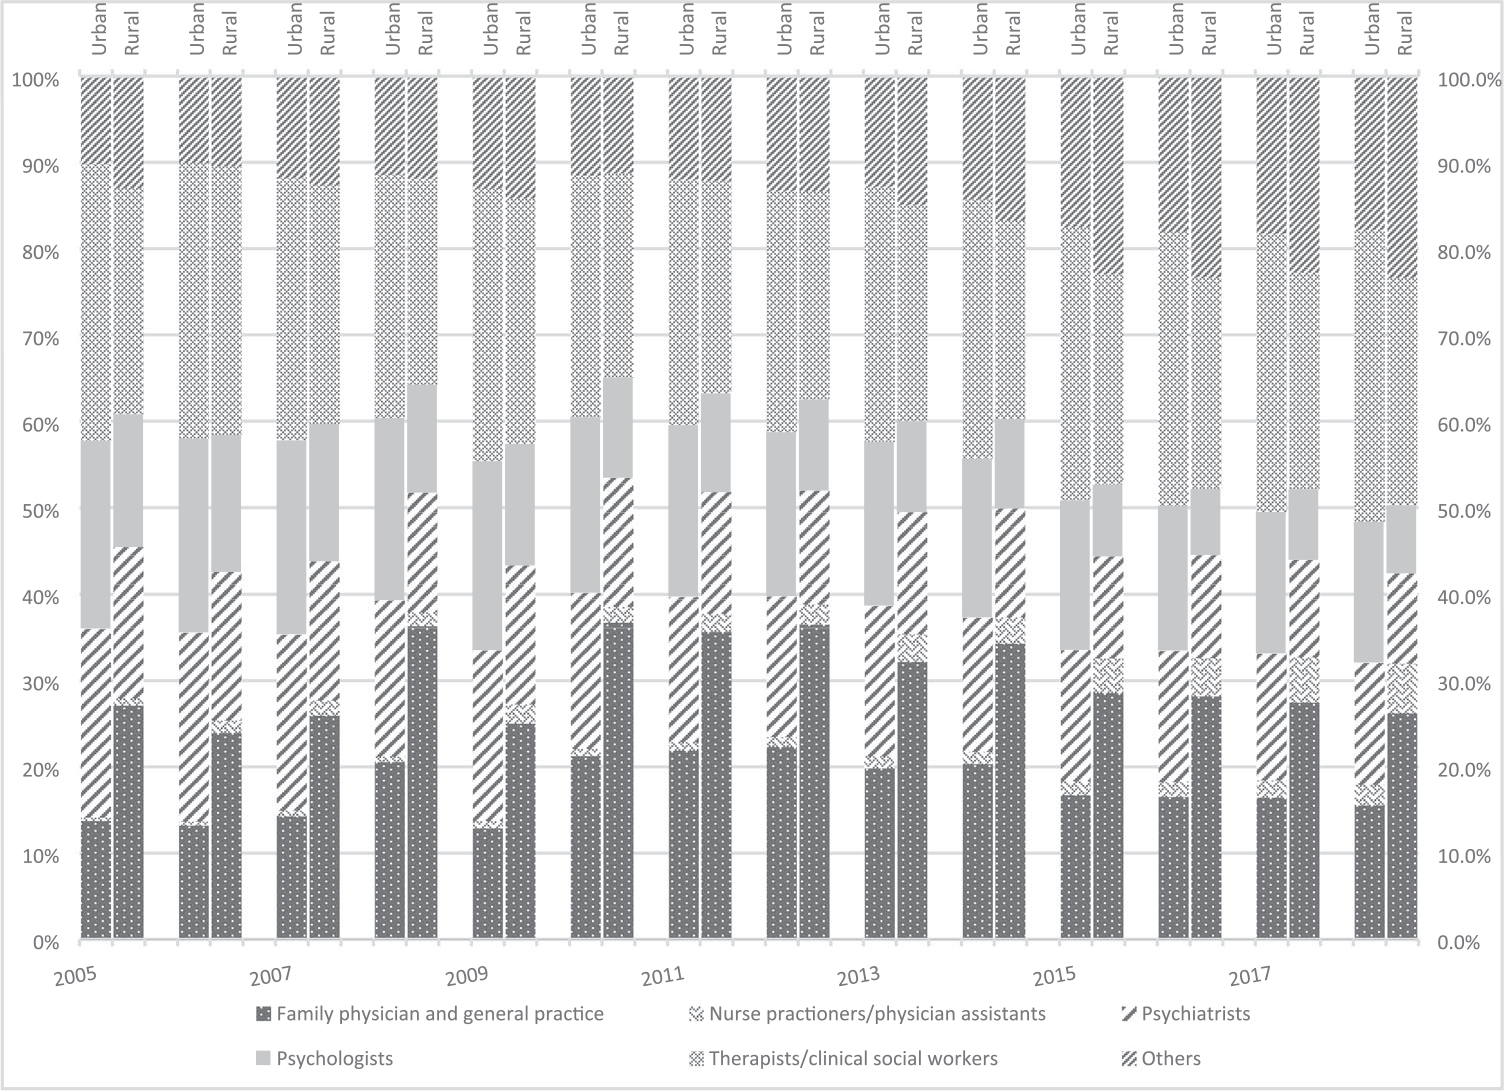
Percentage of types of outpatient visit providers (all 3 conditions combined), adult enrollees from the MarketScan CCAE Data, 2005–2018
Source/Notes: Authors’ analysis of data from the MarketScan Commercial Claims and Encounters database, 2005–2018.
MarketScan person-level national weights were used. Weighted results from MarketScan have been shown to provide a close representation of the national population with ESI.19
RESULTS
Our analysis included about 7.4-–30.1 million enrollees in each year over 2005-–2018 (see online Appendix Table 2). Enrollees in rural areas had lower rates of having at least 1 depression-related outpatient visit during 2005–2018 (3.9%–4.1% for rural vs 5.1%–4.7% for urban), with the rural-urban gap shrinking over time. Among those who had at least 1 depression-related claim, urban enrollees had more than 6 visits, while rural enrollees had 4 visits (Figure 1, Panel 1).
The rates of having at least 1 anxiety disorder-related outpatient visit for both rural and urban increased from about 2% in 2005 to about 4% in 2018, with rural enrollees having a slightly lower rate. Among those who had at least 1 anxiety disorder-related outpatient visit, the average number of visits increased from 3.5 in 2005 to about 4 since 2010 for urban enrollees, while the number of visits for rural enrollees remained stable at about 2.2–2.5 (Figure 1, Panel 2).
The rates of having at least 1 SUD-related outpatient visit doubled for both rural and urban enrollees from 0.5% in 2005 to 1% since 2012. Rural enrollees had lower rates initially but surpassed urban rates in 2009 and remained higher than urban enrollees. Among those who had at least 1 SUD-related outpatient visit, the average number of visits increased from 4.1 in 2005 to 7.3 since 2015 among urban enrollees, and from 3.2 in 2005 to 5.6 in 2018 among rural enrollees (Figure 1, Panel 3).
Average annual depression-related insurance payment for urban enrollees decreased by 39.1% from $474 in 2005 to $289 in 2018, while it reduced by 54.2% from $289 to $136 for rural enrollees during the same time. Depression-related OOP payment per outpatient visit declined for both rural and urban enrollees, but rural enrollees paid a slightly higher OOP share in all years except 2010 (Table 1). The average total payment for anxiety disorder-related visits increased by nearly $56 (54.2%) for urban and $20 (27.4%) for rural enrollees from 2005 to 2018. Rural enrollees paid a higher share of OOP payment than their urban counterparts except in 2010 (Table 1). Average SUD-related payment tripled for urban enrollees and more than doubled for rural enrollees. The OOP share of total payment decreased slightly over time for both urban and rural enrollees during 2005–2018, although rural enrollees paid a higher share of OOP (17.5%–19.7%) than urban enrollees (13.3%–16.0%).
About 28% of the outpatient visits for depression, anxiety disorder, and substance use among rural enrollees occurred in primary care settings, including family medicine, internal medicine, and general medicine. In contrast, only about 14% of urban enrollees’ outpatient visits were in a primary care setting. Both rural and urban enrollees used supportive therapists for MHSA visits frequently. Urban enrollees visited psychologists and psychiatrists more often than rural enrollees (Figure 2).
DISCUSSION
Our study is a timely follow-up of earlier studies on the rural-urban differences in access to mental health services.8,12 We find persisting rural-urban differences in access to outpatient mental health services, with rural enrollees of employer-sponsored plans having fewer visits for depression, anxiety disorder, and SUD but paying a higher OOP share for each visit. Rural and urban beneficiaries use different mixes of mental health providers, with rural enrollees using primary care providers more often than specialists for MHSA visits and consequently incurring lower total payments per visit than urban enrollees.
We have identified increasing trends in outpatient health service use for anxiety disorder and SUD, indicating a need to improve access to mental health services and to strengthen the mental health workforce.4–6 Urban beneficiaries have a high rate of outpatient visits for depression over the study period. This could indicate a higher burden of depression or easier access to mental health providers among urban beneficiaries than their rural counterparts, or a combination of both. However, because rural beneficiaries consistently have had fewer outpatient visits for depression, they may have less access to mental health providers than urban beneficiaries. Rates of having at least 1 outpatient visit and the number of outpatient visits for anxiety disorder and SUD also suggest disadvantages in accessing mental health services in rural areas.
Rural and urban beneficiaries have used evolving and different mixes of mental health providers. The role of NPs/PAs is expanding for both rural and urban beneficiaries. The “other” provider category also experienced steady increases, indicating an increasing role of other providers in meeting mental health needs, including other physicians and urgent care. Rural beneficiaries relied more on primary care providers and less on psychiatrists and psychologists. To address the continuing disparities in access to mental health services and their adverse consequences among all adults, strategies that might be considered include improving the rural mental health workforce and expanding access to mental health telemedicine.20,21
The mean mental health payments in the earlier years in our study appear to be close to earlier estimates of annual mental health expenditure paid by private insurance using the 2004–2005 waves of MEPS, considering the difference in the scope of the expenditure and the use of price indexes.8 However, our estimates for depression are considerably lower than that of Hockenberry and colleagues, which may result from our use of a more expansive case definition of depression.
This study has 2 strengths. First, although the study data are not nationally representative, it characterizes well those with employer-sponsored health insurance because of its large sample size, which varied over the years from 16.2 to 53.1 million persons. Our results corroborate the findings of increasing prevalence rates of mental health conditions in earlier studies using national survey data.4–6,22 Second, the claims information includes the exact amount paid by insurers and patients, eliminating recall bias associated with self-reported payment data. The claims information also provides the complete ICD-9 CM and ICD-10 CM coding, minimizing the risk of misclassification of cases.
Limitations
Our study has several limitations. First, our results are only rates of diagnosed conditions because claims data do not cover nonbillable services, a limitation shared by studies using claims data. Second, because multiple claims may occur on a single visit, we have consolidated claims on the same date into 1 visit. However, the consolidation may introduce undercounting by missing those who indeed had 2 visits on a particular day. We speculate that multiple outpatient visits on a particular day could be rare. Third, our use of primary diagnosis codes has avoided double-counting but may miss true comorbidities, for example, SUD and anxiety disorder may coexist. We conducted sensitivity analyses using additional diagnosis codes and found that while utilization rates increased slightly, mean payments had large increases (see online Appendix Table 3), likely because the secondary diagnosis codes indicating mental health conditions may be associated with costly comorbidies. Fourth, the introduction of ICD-10 codes may create inconsistency in the case definitions. However, because there is no apparent discontinuity of the series before and after 2015, the impact of such inconsistency, if exists, may be minimal. Fifth, the number of enrollees included in MarketScan has changed over time. However, the MarketScan sample has been found to be reasonably representative.23–25 Our estimated rates did not have sharp changes, which may indicate the stability of the sample. Sixth, our use of the rural classification is binary based on metropolitan status as in a previous study,26 while the USDA Rural-Urban Continuum Code may have more refined categories describing rurality.
CONCLUSIONS
The utilization of outpatient mental health services has increased over time among rural and urban enrollees in a large population aged 18–64 with ESI. However, rural-urban differences, for example, fewer outpatient visits by rural enrollees, persisted during 2005–2018. Rural enrollees have generally paid a higher share of OOP, although they incurred lower total payments per visit than urban enrollees. Rural enrollees have relied more on primary care physicians for mental health care than their urban counterparts.
Supplementary Material
Footnotes
DISCLAIMER
The findings and conclusions in this report are those of the authors and do not necessarily represent the official position of the Centers for Disease Control and Prevention.
SUPPORTING INFORMATION
Additional supporting information may be found in the online version of the article at the publisher’s website.
REFERENCES
- 1.Center for Behavioral Health Statistics and Quality. Behavioral health trends in the United States: Results from the 2014 National Survey on Drug Use and Health (HHS Publication No. SMA 15–4927, NSDUH Series H-50); 2015. Retrieved from http://www.samhsa.gov/data/ on December 27, 2021.
- 2.Substance Abuse and Mental Health Services Administration. Projections of National Expenditures for Treatment of Mental and Substance Use Disorders, 2010–2020. HHS Publication No. SMA-14–4883. Rockville, MD: Substance Abuse and Mental Health Services Administration; 2014. [Google Scholar]
- 3.Roehrig C Mental disorders top the list of the most costly conditions in the United States: $201 billion. Health Aff. 2016;35(6):1130–1135. [DOI] [PubMed] [Google Scholar]
- 4.Olfson M, Wang S, Wall M, Marcus S, Blanco C. Trends in serious psychological distress and outpatient mental health care of US adults. JAMA Psychiatry. 2019;76(2):152–161. [DOI] [PMC free article] [PubMed] [Google Scholar]
- 5.Olfson M, Marcus S, Wan G, Geissler E. National trends in the outpatient treatment of anxiety disorders. J Clin Psychiatry. 2004; 65(9):1166–1173. [DOI] [PubMed] [Google Scholar]
- 6.Germack H, Drake C, Donohue J, Golberstein E, Busch S. National trends in outpatient mental health service use among adults between 2008 and 2015. Psychiatr Serv. 2020;71(11):1127–1135. [DOI] [PMC free article] [PubMed] [Google Scholar]
- 7.Carpenter-Song E, Snell-Rood C. The changing context of rural America: a call to examine the impact of social change on mental health and mental health care. Psychiatr Serv. 2017;68(5): 503–506. [DOI] [PubMed] [Google Scholar]
- 8.Ziller E, Anderson N, Coburn A. Access to rural mental health services: service use and out-of-pocket costs. J Rural Health. 2010;26(3):214–224. [DOI] [PubMed] [Google Scholar]
- 9.Wagenfeld Morton O "A snapshot of rural and frontier America." Stamm BH (Ed). (2003). Rural Behavioral Health Care: An Interdisciplinary Guide (pp. 33–40). Washington, DC, US: American Psychological Association. [Google Scholar]
- 10.Wang PS, Lane M, Olfson M, Pincus HA, Wells KB, Kessler RC. Twelve-month use of mental health services in the United States: results from the National Comorbidity Survey Replication. Arch Gen Psychiatry. 2020;62(6):629–640. [DOI] [PubMed] [Google Scholar]
- 11.Hill S, Cantrell P, Edwards J, Dalton W. Factors influencing mental health screening and treatment among women in a rural south central Appalachian primary care clinic. J Rural Health. 2016;32(1):82–91. [DOI] [PubMed] [Google Scholar]
- 12.Andrilla CHA, Garberson LA, Patterson DG, Quigley TF, Larson EH. Comparing the health workforce provider mix and the distance travelled for mental health services by rural and urban Medicare beneficiaries. J Rural Health. 2020;37(4):692–699. [DOI] [PubMed] [Google Scholar]
- 13.Anderson L, Chen M, Perrin J, Van CJ. Outpatient visits and Medication prescribing for US children with mental health conditions. Pediatrics. 2015;136(5):e1178–e1185. [DOI] [PMC free article] [PubMed] [Google Scholar]
- 14.Mark T, Wier L, Malone K, Penne M, Cowell A. National estimates of behavioral health conditions and their treatment among adults newly insured under the ACA. Psychiatr Serv. 2015;66(4): 426–429. [DOI] [PubMed] [Google Scholar]
- 15.Fiest KM, Jette N, Quan H, et al. Systematic review and assessment of validated case definitions for depression in administrative data. BMC Psychiatry. 2014;14(1):1–11. [DOI] [PMC free article] [PubMed] [Google Scholar]
- 16.Somers JM, Goldner EM, Waraich P, Hsu L. Prevalence and incidence studies of anxiety disorders: a systematic review of the literature. Can J Psychiatry. 2006;51(2):100–113. [DOI] [PubMed] [Google Scholar]
- 17.Moy E, Garcia MC, Bastian B, et al. Leading causes of death in nonmetropolitan and metropolitan areas — United States, 1999–2014. MMWR Surveill Summ. 2019;66(1):1–8. [DOI] [PMC free article] [PubMed] [Google Scholar]
- 18.Dunn A, Grosse S, Zuvekas S. Adjusting health expenditures for inflation: a review of measures for health services research in the United States. Health Serv Res. 2018;53(1):175–196. [DOI] [PMC free article] [PubMed] [Google Scholar]
- 19.Dunn A, Rittmueller L, Whitmire B. Introducing the New BEA Health Care Satellite Account - 0115_bea_health_care_satellite_account.pdf. Bureau of Economic Analysis. https://apps.bea.gov/scb/pdf/2015/01%20January/0115_bea_health_care_satellite_account.pdf, Accessed on December 14, 2021.
- 20.Barnett ML, Huskamp HA. Telemedicine for mental health in the United States: making progress, still a long way to go. Psychiatr Serv. 2020;71(2):197–198. [DOI] [PMC free article] [PubMed] [Google Scholar]
- 21.Mehrotra A, Huskamp HA, Souza J, et al. Rapid growth in mental health telemedicine use among rural Medicare beneficiaries, wide variation across states. Health Aff. 2017;36(5):909–917. [DOI] [PubMed] [Google Scholar]
- 22.Hockenberry J, Joski P, Yarbrough C, Druss B. Trends in treatment and spending for patients receiving outpatient treatment of depression in the United States, 1998–2015. JAMA Psychiatry. 2019;76(8):810–817. [DOI] [PMC free article] [PubMed] [Google Scholar]
- 23.Zuvekas SH. Comparing MEPS Use and Expenditure Estimates for the Privately Insured to Truven MarketScan® and OptumLabs™ Claims Data, 2008–2013. AHRQ; 2021. https://www.meps.ahrq.gov/data_files/publications/workingpapers/wp_17001.pdf Accessed on December 14, 2021.
- 24.Dunn A, Liebman E, Pack S, Shapiro A. Medical care price indexes for patients with employer-provided insurance: nationally representative estimates from MarketScan Data. Health Serv Res. 2013;48(3):1173–1190. [DOI] [PMC free article] [PubMed] [Google Scholar]
- 25.Aizcorbe A, Liebman E, Pack S, Cutler D, Chernew M, Rosen A. Measuring health care costs of individuals with employer-sponsored health insurance in the U.S.: a comparison of survey and claims data. Stat J IAOS. 2012;28(1–2):43–51. [DOI] [PMC free article] [PubMed] [Google Scholar]
- 26.Kolor K, Chen Z, Grosse SD, et al. BRCA genetic testing and receipt of preventive interventions among women aged 18–64 years with employer-sponsored health insurance in nonmetropolitan and metropolitan areas – United States, 2009–2014. MMWR Surveill Summ. 2017;66(15):1–11. [DOI] [PMC free article] [PubMed] [Google Scholar]
Associated Data
This section collects any data citations, data availability statements, or supplementary materials included in this article.