

Abstract
Macrophages are critical players in the development of atherosclerotic lesions, where they promote local and systemic inflammation. Macrophages engulf lipoproteins and cell debris upon entry into the arterial wall, becoming lipid-laden foam cells. While most lipids found in foam cells are triglyceride and cholesterol, these cells accumulate several other lipids with bioactive properties, such as vitamin A and carotenoids. Vitamin A has strong immunomodulatory actions in macrophages and other immune cells. For example, macrophages release vitamin A as retinoic acid to modulate T cell differentiation, but the implication of intracellular vitamin A stores in this process remains elusive due to the lack of an adequate experimental model to load vitamin A into macrophages. The purpose of this study was to develop a reliable method to deliver vitamin A to cultured murine macrophages. Our results show that thioglycolate-elicited peritoneal macrophages fail to take up significant levels of vitamin A when provided as free retinol. Cultured macrophages and macrophages in the peritoneal cavity can take up retinyl esters, either as retinyl ester-loaded serum or retinyl esters infused directly into the peritoneal cavity. HPLC analyses in macrophage lysates revealed that the intraperitoneal injection method results in a fourfold greater vitamin A loading efficiency than retinyl ester-loaded serum added to cultured cells. These two alternative methods provide an efficient and reliable methodology to load macrophages with vitamin A for downstream applications such as studies of gene regulation trafficking of intracellular vitamin A, and vitamin A release from macrophages.
1. Introduction
Monocytes and macrophages are essential members of the mononuclear phagocytic family, a part of the innate immune system. Monocytes are produced in the bone marrow and released into the bloodstream. In response to several stimuli, monocytes can infiltrate tissues, where monocytes differentiate into macrophages. Unlike monocytes, macrophages can remain in tissues for several years and become activated in response to local signals and cues. Macrophages play a crucial role in the engulfment of particles by phagocytosis, antigen presentation, and inflammation signaling (Amengual & Barrett, 2019).
Upon exposure to pro-inflammatory signals such as lipopolysaccharide and interferon-gamma, macrophages activate to “classical” state or (M1). Macrophages can also be activated to an “alternative” state or (M2) in response to anti-inflammatory signals such as interleukin 4 (IL-4) and IL-13 (Amengual & Barrett, 2019; Murray et al., 2014). The activation status is crucial for several diseases, such as atherosclerosis, where M1 macrophages are associated with the progression of the disease. In contrast, M2 macrophages are involved in a healing process known as atherosclerosis regression (Barrett, 2020).
Atherosclerosis initiates in response to the excessive accumulation of lipoprotein particles in the intima layer of the arterial wall. These particles act as a chemoattractant for monocytes and macrophages, which will phagocytize lipoproteins to become lipid-laden foam cells. Among the diverse lipid species found in lipoproteins, and therefore in foam cells, our laboratory is interested in β-carotene and vitamin A and their potential to affect the phenotype of macrophages by modulating gene expression. β-Carotene is the main precursor of vitamin A in mammals. β-Carotene is cleaved by the enzyme β-carotene oxygenase 1 (BCO1), the limiting step for vitamin A formation in mammals, into two molecules of retinal. Retinal is either reduced to retinol or oxidized to retinoic acid, the transcriptionally active form of vitamin A (Fig. 1). Retinoic acid regulates several pathways involved in macrophage tissue localization, energy metabolism, and inflammatory status, commonly known as macrophage polarization. Several studies show that retinoic acid contributes to the phenotypic switch from M1 to an M2-like phenotype, which could contribute to the therapeutic use of retinoic acid in atherosclerosis (Miller, Coronel, & Amengual, 2020; Rhodes & Oliver, 1980; Rőszer, Menéndez-Gutiérrez, Cedenilla, & Ricote, 2013).
Fig. 1.
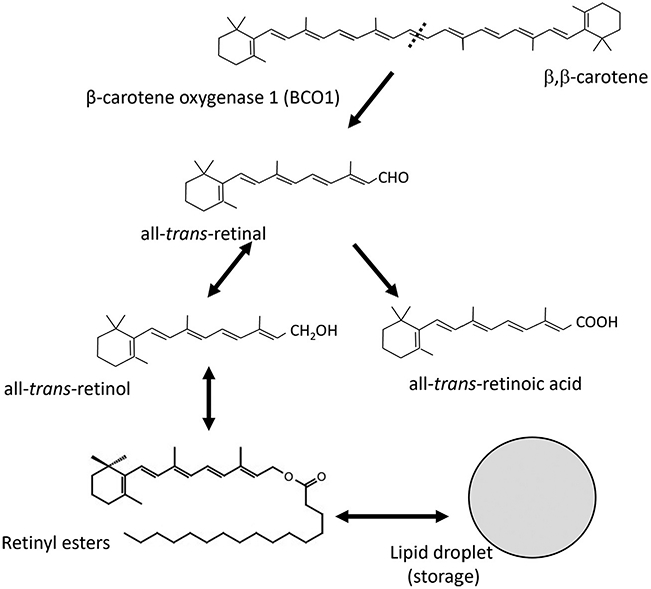
The enzyme β-carotene oxygenase 1 catalyzes the conversion of β-carotene to retinal, the first vitamin A intermediate. This scheme highlights the metabolic pathway of vitamin A formation and the main vitamin A metabolites.
We recently explored the vitamin A sources in macrophages and whether these cells could generate vitamin A from its precursor, β-carotene. To this end, we first examined whether BCO1 is expressed in macrophages. Our RNA sequencing data showed that macrophages derived from atherosclerotic lesions express low levels of BCO1 (Zhou et al., 2020). A second possibility by which macrophages could take up vitamin A is by the retinol binding protein 4 (RBP4) transport system. RBP4 bound to retinol is primarily secreted by the liver, which is the greatest vitamin A storage in mammals (Goodman, 1980). Most cell types take up retinol from RBP4 by a process driven by the law of mass action, where retinol esterification to retinyl esters drives its uptake (Amengual et al., 2013). However, macrophages cannot take up circulating retinol, as they do not express the Stimulated by Retinoic Acid 6 (STRA6) protein or retinol binding protein receptor 2 (RPBR2), the two membrane receptors for RBP4 (Miller et al., 2020). These results pointed us toward phagocytosis as another possibility by which macrophages could obtain vitamin A, an intrinsic characteristic of macrophages. Regardless of the uptake pathway, macrophages must esterify vitamin A into retinyl esters for storage. This process is carried out by the action of the diacylglycerol acyltransferase 1, as shown by Farese’s group (Yen, Monetti, Burri, & Farese, 2005).
This chapter describes a collection of streamlined and validated methods for delivery of vitamin A (either retinyl ester or retinol) to cultured peritoneal macrophages. We also present an assessment of these methods to facilitate the storage of retinyl esters within the cells vs metabolic breakdown to retinoic acid. These procedures can help fulfill various experimental requirements in which researchers aim to determine the metabolic fate of vitamin A in macrophages, as it is routinely done for cholesterol using comparable experimental approaches (Low, Hoang, & Sviridov, 2012).
2. Protocol
2.1. Equipment
| Equipment | Source | Catalog number | |
|---|---|---|---|
| 1. | Nunc 10cm petri dish (untreated) | Thermo Fisher Scientific | 150239 |
| 2. | 12 well-treated sterile plates | Thermo Fisher Scientific | 07-200-81 |
| 3. | 10mL serological pipettes 25mL serological pipettes |
Thermo Fisher Scientific | 1367811 E 1367811 |
| 4. | Nalgene™ Oak Ridge high-speed polycarbonate centrifuge tubes | Thermo Fisher Scientific | 3118-0050-PK |
| 5. | CO2 incubator | Thermo Electron Corporation | 3110 |
| 6. | Brightline hemocytometer | Thermo Fisher Scientific | 0267110 |
| 7. | SterilGARD Biosafety level II laminar flow hood | The Baker company Inc. | SG 600 |
| 8. | Centrifuges | Eppendorf Eppendorf |
5417 R 5810 R |
| 9. | Sorvall-RC-5B refrigerated superspeed centrifuge | Du Pont instruments | RC5B 9001008 |
| 10. | Fisher vortex Genie 2 | Thermo Fisher Scientific | 12-812 |
| 11. | Automatic environmental speed-Vac system | Savant Instruments Inc. | AES 1010-120 |
| 12. | High-performance liquid chromatography (HPLC) system with Empower software | Alliance equipped with a 2998 photodiode array detector (Waters) | Waters e2695 Separations Module |
| 13. | Zorbax RX-SIL (5μm 4.6 × 150mm column) | Agilent | 883975-901 |
| 14. | BD Precisionglide® syringe needles gauge 18, L 1 in. 305,195 and 25, L 1in. 305,125 | BD Biosciences | 148265 G and 1482113 D |
| 15. | 22g × 25mm curved gavage needle | Thermo Fisher Scientific | NC 1197789 |
| 16. | Surgical forceps and scissors | ||
| 17. | Fisherbrand™ Cell Lifters | Thermo Fisher Scientific | 08-100-240 |
| 18. | BD Vacutainer SST venous blood collection tube (8.5mL) | BD Biosciences | 367988 |
| 19. | Standard IVC cage for blood collection (11½” × 7¼”) | Allentown | 227422 |
| 20. | Millipore express plus 0.22μM PES steritop filter | Millipore Sigma | S-2-GPT-05-RE |
| 21. | Nanodrop 2000 spectrophotometer | Thermo Fisher Scientific | R-052 |
| 22. | GeneAmp PCR System 9700 | Applied Biosystems | 805-S-6061302 |
| 23. | StepOnePlus real-time PCR System | Thermo Fisher Scientific (Applied Biosystems) | 2720013071 |
| 24. | Beckman L7-80 ultracentrifuge | Beckman Inc. | 80-M-9208 |
| 25. | SW-41 Ti rotor | Beckman Inc. | 6826 |
| 26. | Polypropylene ultracentrifuge tubes (14 × 89 mm) | Beckman Inc. | 331372 |
| 27. | Polyvinylidene fluoride (PVDF) membrane (0.2μm; 26.5cm × 37.5cm) | Thermo Fisher Scientific | 88520 |
| 28. | Glass plates for electrophoresis | Bio-Rad | 1655308 1653312 |
| 29. | Bio-Rad Power pac 200 | Bio-Rad | 284-BR-04521 |
2.2. Reagents
| Reagent | Source | Catalog number | |
|---|---|---|---|
| 1. | Gibco™ DMEM, high glucose | Thermo Fisher Scientific | 11965118 |
| 2. | Fetal bovine serum | Thermo Fisher Scientific | 10437028 |
| 3. | Penicillin–streptomycin | Thermo Fisher Scientific | MT-30-002-CI |
| 4. | l-Glutamine | Thermo Fisher Scientific | MT-25-005-CI |
| 5. | RBC lysis buffer 1 × | Thermo Fisher Scientific | 00-4333-57 |
| 6. | Trypsin–EDTA (0.25%, phenol red) | Thermo Fisher Scientific | 25200114 |
| 7. | Thioglycolate medium brewer modified (dehydrated culture media) | BD BBL™ | BD 211716 |
| 8. | Trypan blue | Gibco | 15250061 |
| 9. | Ethanol | Thermo Fisher Scientific | 4355223 |
| 10. | Acetone | Thermo Fisher Scientific | A 184 |
| 11. | Hexane | Thermo Fisher Scientific | H 3024 |
| 12. | Ethyl acetate | Thermo Fisher Scientific | E 1954 |
| 13. | Retinyl palmitate | Cayman Chemicals | 23796 |
| 14. | Retinyl acetate | Cayman Chemicals | 20242 |
| 15. | Retinol | Sigma | R 7632 |
| 16. | Phosphate-buffered saline (PBS, 10 ×, pH 7.4) | Thermo Fisher Scientific | BP 3991 |
| 17. | Dimethyl sulfoxide (DMSO) | Sigma | D 2650 |
| 18. | Pierce™ Coomassie Plus (Bradford) Assay Kit | Thermo Fisher Scientific | 23236 |
| 19. | AIN 93G-Purified diet | Research Diets | D 17041301 |
| 20. | Alanine transaminase and aspartate aminotransferase activity kits | Abcam | ab 105134 and ab 105135 |
| 21. | Pierce™ chromogenic endotoxin quant kit | Thermo Fisher Scientific | A 39552 |
| 22. | TRIzol™ LS Reagent | Thermo Fisher Scientific | 10296010 |
| 23. | Direct-zol™ RNA MicroPrep (200 Preps) with Zymo-Spin IC Columns | Zymo Research | R 2063 |
| 24. | Verso cDNA synthesis reverse transcriptase kit | Thermo Fisher Scientific | AB 1453 B |
| 25. | Mouse Hprt probe | Thermo Fisher Scientific | Mm-03024075_m1 |
| 26. | Mouse Rarß probe | Thermo Fisher Scientific | Mm-01319677_m1 |
| 27. | Mouse Cyp26a1 probe | Thermo Fisher Scientific | Mm-00514486_m1 |
| 28. | Mouse Ccl2 probe | Thermo Fisher Scientific | Mm-00441242_m1 |
| 29. | Taqman fast advance mix | Thermo Fisher Scientific | 44-449-63 |
| 30. | Sudan black | Sigma | S-0395 |
| 31. | Ethylene glycol | Thermo Fisher Scientific | E-178-1 |
| 32. | Potassium bromide | Thermo Fisher Scientific | P-205-500 |
| 33. | Sucrose | Thermo Fisher Scientific | S5-500 |
| 34. | 30% Acrylamide | Bio-Rad | 1610158 |
| 35. | 2× Laemmli buffer | Bio-Rad | 1610737 |
| 36. | Ammonium persulfate | Sigma | A-3678 |
| 37. | Tetramethyl ethylenediamine (TEMED) | Sigma | 110-18-9 |
| 38. | anti-Apolipoprotein B (ApoB, Polyclonal) | Millipore Sigma | AB-742 |
| 39. | Polyclonal rabbit anti-human retinol-binding protein (anti-RBP4) | Dako | A-0040 |
| 40. | Retinoic acid | Sigma | R2500 |
2.3. Preparation of vitamin A-rich serum
During the development of atherosclerosis, macrophages phagocytize lipoproteins and lipoprotein aggregates to become foam cells. Taking advantage of the phagocytic properties of macrophages, we used two experimental approaches to load vitamin A into these cells. First, we utilized mice to generate vitamin A-rich serum (Section 2.3.1). Next, we utilized pigs to perform an alternative approach (Section 2.3.3). The following sections provide a detailed explanation of both methodologies, highlighting the advantages and disadvantages of both experimental approaches.
2.3.1. Preparation of vitamin A-rich serum in mice
Step 1. Based on the desired volume of serum, plan for an adequate number of C57BL/6 mice for the study. As an estimate, an adult mouse will render 600μL of serum
Step 2. Allow mice ad libitum access to a purified, carotenoid-free diet for at least 4 days to deplete dietary carotenoids in the serum (Fig. 2A)
Fig. 2.

(A) Experimental design—Pilot Study. Eight-week-old C57/B6 mice were fed a purified, carotenoid-free diet for 4 days before receiving a single gavage containing 500mg of retinyl palmitate/kg of body weight dissolved in olive oil. Mice were sacrificed at the indicated time points to isolate serum from the blood. (B) HPLC quantifications. (C) Representative chromatograms of mouse serum collected at the second hour after gavaging vitamin A (continuous black line) and a mixture of retinyl palmitate and retinol standards (dotted blue line). The insert show the spectrum for retinyl palmitate.
Step 3. Retinoids should always be handled under yellow or red light to prevent photodegradation (Mousseron-Canet, 1971). For this purpose, we always work under a yellow safety light when possible
Step 4. Prepare an emulsion of commercially available retinyl palmitate in oil. We typically use olive oil to prepare a solution in which we can provide 500mg retinyl palmitate/kg body weight of the mouse
Step 5. Vortex the emulsion to completely dissolve the retinyl palmitate in oil. If necessary, sonicate the solution
Step 6. We typically gavage 200–300 μL solution to mice, weighing 20–30g respectively, using a 22g × 25 mm curved gavage needle (Fig. 2A)
Step 7. We performed a time-course study to determine the kinetics of vitamin A in mouse serum, observing that retinyl esters peak in serum 2h after gavage. We suggest this time point to obtain the highest vitamin A content in serum (Fig. 2B and C). The methodology describing HPLC quantification is in Section 2.3.2
Step 8. We suggest sacrificing the mice by asphyxiation using a CO2 chamber. We do not recommend using any type of anesthetics, as these compounds could affect the downstream cell culture applications
Step 9. Once the mouse is completely unresponsive, we immediately collect the blood by cardiac puncture, then keep the sample on ice under dark conditions
Step 10. Under yellow light and biosafety conditions, isolate serum by centrifuging blood vials at 1000 × g for 15min at 4 °C
Step 11. We advise pooling all the sera after harvesting if the experiment is done using several mice. Then, working in a biosafety cabinet, filter the resulting serum using 0.22μm sterile syringe filters. After that, aliquot the pooled serum before freezing at −80°C
Step 12. We have used the same frozen aliquot for up to five freeze and thaw cycles with comparable experimental outcomes
2.3.2. HPLC quantification of vitamin A in serum samples
Step 1. Starting with a 100μL serum aliquot, add enough volume of 1 × PBS (pH 7.4) to reach 200μL in a 2mL microcentrifuge tube. Add 200μL of methanol or ethanol and vortex for at least 10s. Add 400μL acetone to the mixture and vortex for at least 10s
Step 2. Extract retinoids by adding 500μL hexane to the mixture and vortex three times, 10s each. Centrifuge the mixture at 500 × g for 1 min and transfer the upper layer containing hexane to a fresh 1.5mL microcentrifuge tube
Step 3. Repeat the previous step, and pool both upper hexane extracts containing retinoids in the 1.5mL tube
Step 4. Dry the supernatants under vacuum using a Speed-Vac or a gentle stream of nitrogen
Step 5. Reconstitute the dried extracts with 200μL HPLC grade hexane and inject 100μL for HPLC analysis. (Note: All HPLC analyses described herein were done using a gradient method on the Agilent Zorbax RX-SIL column. Samples were run for 20 min using ethyl acetate and hexane as the mobile phase. The gradient method alters the flow of ethyl acetate from 1% (0–4 min, through 20% (4–17 min) and to 1% (17–20 min). The concentration and flow rate of hexane is adjusted to the amount of ethyl acetate). The flow rate was 1.4mL/min
Step 6. Prepare pre-determined concentrations of retinol and retinyl palmitate standards, dry, reconstitute, and inject them into the HPLC system to generate a standard curve. (Note: For our experiments, we prepared a solution containing 80mmol of either retinol or retinyl ester in ethanol and hexane, respectively. We dried the solvents under nitrogen gas before resuspending them in olive oil. We injected the mice with 250μL of the resulting emulsion).
Step 7. Determine the concentration of retinoids in extracts of samples by comparing their elution times and spectra to those of the authentic standard. The slope obtained from the standard serves to calculate the concentration of the compound in the mouse serum samples
2.3.3. Preparation of vitamin A-rich serum from pigs
Larger mammals, including pigs, can be utilized as an alternative to mice to generate serum-rich vitamin A for downstream applications. We chose to use pigs, as this animal presents several advantages. For instance, a single pig will provide a larger volume of serum. For example, we could isolate approximately 1L of serum from a 125 kg pig, equivalent to the serum obtained using 2000 mice. Second, previous studies highlight the similarities between lipoprotein metabolism in pigs and humans (Chapman & Goldstein, 1976). Lastly, pigs have been used to perform vitamin A bioavailability studies similar to our vitamin A bioavailability studies. For instance, Gannon et al. show that serum retinyl esters accumulate at optimal levels in the 7th and 10th hour after administering a high dose of vitamin A in piglets (Gannon, Davis, Nair, Grahn, & Tanumihardjo, 2017). The authors used 200 kIU of retinyl palmitate, which translates to 73 mg/kg of body weight of retinyl palmitate.
To determine the kinetics of serum vitamin A levels upon a single vitamin A feeding in adult pigs, we performed a pilot study using adult pigs, as described in the following procedure:
Step 1. In our pilot study, we utilized two 25-weeks-old pigs. The animals weighed approximately 130kg each. We transported the pigs to the containment facility, where the procedures took place. On the experiment day, the pigs were fasted for approximately 8h before we provided a single dose of 500mg of retinyl acetate/kg of body weight mixed with their regular food. We allowed the animals to have access to the food for a limited amount of time (30min maximum), after which we replaced the vitamin A-enriched food with regular feed (Fig. 3A). With the help of veterinary personnel, we drew consecutive blood samples (3–5mL) from their jugular vein using a B.D. Vacutainer SST venous blood collection tube. We collected blood at time point zero (baseline),5, 6, 7, 8, 9, 10, 12, and 30h after vitamin A supplementation. Vials were stored on ice and in dark conditions until transported to the lab for processing
Fig. 3.

(A) Experimental design—Pilot Study. Two twenty-week-old pigs fasted for 8h and then fed a single dose of retinyl acetate, at a ratio of 500mg/kg body weight, mixed with feed. After this period, blood was drawn at the time point zero (baseline), 5, 6, 7, 8, 9, 10, 12, and 30h after vitamin A supplementation (see Section 2.3.3) for serum isolation. (B) Retinyl ester levels and free retinol in sera of two pigs determined by HPLC described in Section 2.3.2 (Pilot Study I and Pilot Study II). (C) Aspartate aminotransferase (AST) and alanine aminotransferase (ALT) activities in pooled serum.
Step 2. Serum was isolated from blood samples collected at each time point for measuring the serum retinyl ester concentration by HPLC, as described in Section 2.3.2 Fig. 3B represents our HPLC results obtained from two animals (denoted Pilot Study I and Pilot Study II). Note: Both pigs accumulated high amounts of retinyl ester, which was already detectable after 5h, but the pigs showed remarkable differences in accumulation profiles. We attributed these variations to differences in vitamin A intake, as we noticed that some pigs were more reluctant than others to eat vitamin A, even after several hours of fasting. Since pharmacological doses of vitamin A can cause liver toxicity (Olson, Ameer, & Goyal, 2021), we also measured transaminase activity levels in the serum as a surrogate marker of hepatic toxicity. Considering time point zero (before feeding vitamin A to the pig), we did not observe remarkable changes in alanine aminotransferase (ALT) and aspartate aminotransferase (AST) levels in response to vitamin A supplementation (Fig. 3C)
Step 3. As mentioned in Step 1 of this section, we observed that pigs did not consume the entire amount of feed mixed with added vitamin A, possibly due to the odor of the vitamin. We optimized a feeding protocol to ensure that the animals ate all the vitamin A, as described in Step 5 of this section
Step 4. Four days before the experiment started, pigs were transported to the containment facility, where they were fed only once a day, at the same hour every day until the day of vitamin A dosing. This feeding strategy was done to acclimate the pigs to the feeding procedure
Step 5. On the day of the experiment, we prepared a mixture of regular feed supplemented with vitamin A and approximately 50mL of molasses in warm water. This modification in the feeding schedule and the addition of molasses improved the acceptance of the vitamin A-supplemented diet
Step 6. Based on our preliminary studies and those by Gannon (Gannon et al., 2017), we determined that 7h post-feeding of vitamin A was a good time point for blood collection
Step 7. We utilized four male adult pigs of approximately 125kg for our experiments. Two pigs were used as negative controls (no vitamin A), and two were fed with 500mg/kg of retinyl acetate
Step 8. On the day of the experiment, following the same routine as done during the acclimation period, we mixed the retinyl acetate with molasses and warm water to supply a mixture of 600mg of feed to provide 500mg of retinyl acetate/kg of body weight. Pigs assigned to the control group were fed the same diet without vitamin A
Step 9. While the pig is expected to finish their feed, we recommend dividing the mixture into smaller portions (200 g each). This approach allows us to estimate how much vitamin A the animal ingested if it rejects the feed
Step 10. Euthanize pigs after 7h by electrical stunning
Step 11. When the pig is unresponsive, drain the blood from the jugular vein, following standard procedures approved by the IACUC
Step 12. Collect into containers the maximum volume of blood from each pig (Note: IVC cages were used in our study to collect blood for the main study) and cover the blood to protect it from light. Try to work under aseptic conditions, if feasible. Keep on ice until transport to the lab
Step 13. Transfer blood into sterile Nalgene™ Oak Ridge high-speed polycarbonate centrifuge tubes in the Biosafety level II laminar flow hood under sterile conditions. Isolate the serum (supernatant) from the blood by centrifuging at 840 × g for 15min at 4 °C
Step 14. Filter the serum using a Millipore Express Plus 0.22μm PES Steritop filter attached to the neck of an autoclaved bottle of 45mm neck diameter
Step 15. Aliquot serum samples at −20 °C until use in 50mL falcon tubes containing approximately 45mL of serum
Step 16. Measure vitamin A concentrations in the serum by HPLC, as described in Section 2.3.2
Experimental example: Fig. 4A shows vitamin A levels of the two pigs utilized for our final study. The majority of vitamin A in serum was in the retinyl ester form. ALT and AST showed no significant differences between animals and controls (as analyzed by t-test), indicating that vitamin A did not cause liver toxicity (Fig. 4B).
Fig. 4.

Results of the Final Study in pigs. (A) Vitamin A measurements in serum of control pigs fed a control standard diet and serum from retinyl ester-fed pigs at 7h after the feeding. (B) Aspartate aminotransferase (AST) and alanine aminotransferase (ALT) activities in sera of Control and vitamin A-fed pigs showed no significant differences (t-test analysis) in transaminase levels. (C) Retinyl ester (left) and free retinol (right) in isolated chylomicrons of mice fed vitamin A. Data are represented relative to the vitamin A content in total serum. (D) Immunoblot of total serum (TS) and isolated chylomicrons (IC) from the two pig samples fed retinyl ester. A mouse sample was used to identify Apo B100 and Apo B48 (top panel). Albumin (medium panel) and RBP4 (lower panel) blots were used to highlight the purity of the IC fractions. ApoB and RBP4 proteins were detected in samples by immunoblotting the membranes with with the corresponding antibodies (reagent 37 and 38, respectively).
Note: The ALT and AST data analysis shown in Fig. 4B are the average values of two pigs from control and vitamin A-fed groups each. The measurements were performed using two technical replicates per animal.
2.3.4. Identification of the lipoprotein fraction containing vitamin A in pig serum
Upon ingestion of lipids, enterocytes synthesize chylomicrons that are released to the lymphatic system. Part of the lipids contained in the chylomicrons is hydrolyzed to form chylomicron remnants that will eventually reach the liver (Miller et al., 2020). Ingested retinyl esters are hydrolyzed to retinol, re-esterified in the enterocyte, and packed into the chylomicrons. Hence, most of the retinyl esters found in our serum samples should be contained in these lipoproteins. To confirm this prediction, we isolated chylomicrons from pig serum following a simple protocol established by Terpstra, with few modifications (Terpstra, 1985).
Step 1. We utilized 2mL of a pig serum sample to which was added 0.2mL of 10% Sudan black solution dissolved in ethylene glycol. This dye allowed us to stain chylomicrons and monitor their isolation
Step 2. Dissolve 770mg of potassium bromide (KBr) and 50mg of sucrose in the pre-stained serum solution to obtain a solution of 1.250kg/L density (ρ20)
Step 3. Add the above preparation of the serum sample to the bottom of a polypropylene ultracentrifuge tube (14 × 89mm)
Step 4. Prepare KBr salt solutions I and II of ρ20 = 1.225 and 1.1 kg/L, respectively, as described by Terpstra (1985). Briefly, we prepared KBr solutions-I and II by dissolving 16.35g and 7.24g of KBr in 50mL double distilled water each, respectively
Step 5. Overlay the prepared serum solution in the ultracentrifuge tube with 2mL KBr-I, followed by 3.5mL of KBr-II, and finally with 3.5mL of double-distilled water (ρ20 = 0.998kg/L)
Step 6. Handle the tubes gently to maintain the density gradient
Step 7. Place all the tubes in a pre-cooled S.W. 41 Ti rotor and centrifuge at 153,911 × g at 4 °C, for 40min, under vacuum in a Beckman L7-80 ultracentrifuge
Step 8. After centrifugation, the chylomicron fraction will appear as a distinctly turbid and stained layer on the top of the gradient. Collect 1–1.5mL of this layer and freeze at −80 °C until further analysis
Experimental example: Fig. 4C shows the relative content of vitamin A in serum and chylomicron fractions measured by HPLC using the steps described in Section 2.3.2. Our data show that most of retinyl esters (approximately 70%) are in the chylomicron fraction. Free retinol levels in the chylomicron fraction were minimal compared to total serum. To confirm the identity and purity of the fractions isolated by ultracentrifugation, we loaded a urea SDS-PAGE using total serum (TS) and isolated chylomicrons (IC) following established protocols (Amengual et al., 2018). We used total vitamin A content in serum and fractions as loading controls (Fig. 4D). Western blotting results revealed the presence of apolipoprotein B48 (apo B48) and apo B100, the two main protein components of chylomicrons and very-low and low density lipoproteins ((V)LDL), respectively (Fig. 4D, upper panel). In the TS samples, bands corresponding to apoB48 and apoB100 were evident, confirming the presence of chylomicrons and (V) LDL, respectively. IC samples only presented a band corresponding to apoB48, which is only present in porcine chylomicrons (Farese et al., 1996). We failed to detect the presence of RBP4 and albumin in the IC fractions, confirming the purity of our preparations (Fig. 4D, middle and bottom panels), as done in the past (Amengual, Golczak, Palczewski, & Von Lintig, 2012). These results confirm the purity of our IC preparations (Fig. 4D).
Note: ApoB and RBP4 proteins were detected in samples by immunoblotting the membranes with goat anti-Apolipoprotein B antibody (reagent #37) and polyclonal rabbit anti-human retinol-binding protein (anti-RBP4, reagent #38) antibody.
2.3.5. Determination of the endotoxin levels in serum
If the endpoint analysis requires the study of macrophage polarization, it is important to determine whether the serum preparation contains endotoxin. Endotoxin is a ubiquitous contaminant of bacterial origin that stimulates macrophage polarization (Li & Boraschi, 2016). In our case, we typically use these sera for cell culture applications, and we advise measuring endotoxin levels after each isolation. We utilize the Pierce™ chromogenic endotoxin quant kit (reagent #20), following the instructions.
Step 1. In Fig. 5A, we compare the endotoxin levels of several serum samples. We utilized endotoxin-free fetal bovine serum (FBS) as a control (Fisher). The sample highlighted in red was incubated with activated charcoal, known to remove serum-containing lipopolysaccharide (Bysani, Shenep, Hildner, Stidham, & Roberson, 1990). Endotoxin levels in mouse serum samples were not detectable, while some batches of pig serum showed higher endotoxin levels than FBS or mouse sera
Fig. 5.

(A) Endotoxin levels measured in various sera samples. Fetal bovine serum (FBS) treated with activated charcoal to eliminate endotoxins was utilized as a control (red). (B) Ccl2 mRNA expression in mouse and pig sera levels relative to FBS treated with activated charcoal. Cells exposed to pure endotoxin were utilized as positive control. Hprt was utilized as housekeeping control. Experiments were carried out in triplicates. **** P < 0.0001 using One-way ANOVA with Dunnett’s multiple comparison testing.
Step 2. To determine the impact of endotoxin found in pig serum preparations, we incubated freshly-isolated macrophages in a media containing 10% mouse serum or 10% pig serum. Cells exposed to charcoal-stripped FBS (FBS, red bar) and the same media containing 100ng/mL of lipopolysaccharide (Endotoxin, black bar) were used as negative and positive control, respectively
Step 3. After 24h of incubation, we isolated total mRNA from the cells and measured levels of C-C Motif Chemokine Ligand 2 (Ccl2), which is typically utilized as a marker of macrophage activation, and the housekeeping control hypoxanthine phosphoribosyltransferase 1 (Hprt). Macrophages exposed to mouse or pig serum failed to show significant changes in Ccl2 mRNA expression in comparison to Control-treated cells, indicating that these media did not cause macrophage activation (Fig. 5B). Hence, these sera samples are suitable for applications involving polarization studies in cultured macrophages (Fig. 5B).
2.4. Induction of peritonitis and harvesting of peritoneal macrophages for cell culture
Thioglycolate is a sterile irritant commonly used to induce peritonitis in experimental models., Thioglycolate injection in the peritoneal cavity favors monocyte infiltration into the peritoneum. These cells will then differentiate into macrophages 4–5 days after injection (Hermida, Malta, Santos, & Dos-Santos, 2017). This methodology allows us to collect approximately 40 million macrophages/mouse. Peritoneal macrophages possess a greater phagocytic activity than those differentiated in vitro from circulating monocytes or bone marrow progenitor cells (Ichinose, Hara, Sawada, & Maeno, 1994). These unique phagocytic properties prompted us to utilize peritoneal macrophages for our experiment, although we have tested other cell types such as bone-marrow-derived macrophages and hepatic cell lines with similar results (data not shown).
The procedure for inducing peritonitis and culturing peritoneal macrophages is described as follows:
Step 1. Prepare a 4% stock solution of thioglycolate dissolved in water (modification of methods described by Ipseiz et al. (2020) and Kim et al. (2018)
Step 2. Autoclave and allow thioglycolate to stand in the dark for 1–2 months until green and brown layers form in the solution. This color change is indicative of the oxidation of the thioglycolate broth
Step 3. Store by freezing 3mL aliquots of the green layer at −20 °C until use. (Note: Always handle autoclaved thioglycolate and perform step 1.3 in a certified biosafety hood to prevent contamination)
Step 4. To induce peritonitis, thaw frozen aliquots of thioglycolate and inject 3mL/mouse intraperitoneally
Step 5. Four days after the injection, sacrifice mice by asphyxiation using a CO2 chamber. Place the carcasses on ice until peritoneal macrophages are harvested
Step 6. Isolate peritoneal macrophages under sterile conditions, as previously described (Yu et al., 2017)
Step 7. Plate peritoneal macrophages at approximately 1.5–2.5 × 10⁶ cells/mL of medium. We typically use non-treated Petri dishes (10cm) or non-treated 6- or 12-well plates
Step 8. Allow cells to attach to the plate for at least 2h at 37 °C in a 5% CO2 incubator. After this time, macrophages will attach to the plastic surface while other cell types remain in the cell medium
Step 9. Wash plated cells with 1 × PBS twice to remove unattached and dead cells
2.4.1. Treatment of peritoneal macrophages with vitamin A-rich serum
Step 1. Under our experimental conditions, we treat macrophages overnight with enough serum to achieve a 4–8μM concentration of retinyl esters in the medium. This approach has successfully attained detectable vitamin A levels in the cell pellet when using at least 25 million cells
Step 2. Allow the treatments to continue for the desired time at 37 °C in the 5% CO2 incubator. We have observed similar vitamin A levels in macrophages by incubating cells overnight or for 24h
Step 3. At the end of the treatment period, collect a 200μL aliquot of medium from each dish for HPLC quantification of retinoid concentration in the medium after treatment (as described in Section 2.3.2)
Step 4. Aspirate off the medium and wash twice with PBS
Step 5. Detach cells using 3mL trypsin for 3min in the incubator at 37 °C, followed by inactivation of trypsin using 7mL of growth medium (500mL of reagent #1, 50mL of reagent #2, and 10mL of reagents #3 and #4). Gently detach more cells with the aid of a cell lifter, if needed
Step 6. Transfer cell suspension to a Falcon tube and centrifuge at 400 × g for 5min. Aspirate off supernatant and carefully resuspend the cell pellet in 320μL sterile 1 × PBS
Step 7. Disrupt cells using a hand-held homogenizer or probe sonicator using short bursts to prevent overheating the sample
Step 8. Collect a small aliquot (20μL) to quantify total protein levels in cell lysates using any commercial colorimetric kit. We use the Pierce™ Coomassie Plus (Bradford) assay kit (reagent #18). This protein measurement will allow comparisons between groups and experiments
Step 9. From the remaining volume (300μL), quantify vitamin A content by HPLC, as described in Section 2.3.2
2.5. Intraperitoneal injection with retinoids
Macrophages are known to phagocytize lipoproteins, cellular debris, dead cells (efferocytosis), and bacteria. Taking advantage of their phagocytic capacity and maximizing vitamin A uptake, we tested whether macrophages in the peritoneal cavity could phagocytize vitamin A in the peritoneum.
This section describes methodology to load macrophages present in the peritoneal cavity with vitamin A.
Step 1. Inject C57BL/6 mice with thioglycolate, as described in Section 2.4 (steps 1–4)
Step 2. Three days after the thioglycolate injection, we inject an emulsion containing vitamin A intraperitoneally. We tried emulsions containing either free retinol or retinyl palmitate dissolved in olive oil as described in Section 2.3.2 (step 6-Note) (see Fig. 6A and B for results)
Fig. 6.

Comparison of different methodologies to deliver vitamin A to macrophages. The final concentration of retinoids in the medium was 4μM during the 24h before harvesting. (A) Intracellular retinyl ester and (B) and intracellular retinol levels (ROL) were measured by HPLC(as described in Section 2.3.2). Retinoid levels were standardized to total protein content in pellets. (C) Accumulation of the retinoic-acid sensitive Cyp26a1 and Rarß mRNAs relative to Hprt transcripts in peritoneal macrophages (as described in Section 2.6). For all experiments, retinoic acid in DMSO was utilized as a positive control and DMSO only as a negative control. Data represent n = 2 experiments in triplicate. Statistical differences were evaluated using one-way ANOVA with Dunnett’s multiple comparison testing (****, P < 0.001).
Step 3. Inject 250μL of the emulsion containing 500mg/kg of retinyl palmitate intraperitoneally, equivalent to 80mmol/mouse. We also inject equimolar amounts of retinol as a control for vitamin A between these two experimental groups
Step 4. Twenty-four hours after the injections, perform peritoneal macrophage isolation from control and experimental mice as described in section 2.4 (steps 5–6)
Step 5. Wash macrophages by adding 10mL of reagent 16 onto the plate to remove any vitamin A not taken up by the cells
Step 6. Collect peritoneal macrophages and plate them as described in section 2.4 (steps 7–9)
Step 7. To prevent contamination from retinoids present in the peritoneal cavity, perform multiple washes and allow cells to settle for at least 4h before harvesting
Step 8. Proceed to cell harvesting, disruption, retinoid isolation, and protein quantification, as described in Section 2.4.1 (steps 4–9)
2.6. Comparative analyses of methods to deliver vitamin A to macrophages
Next, we tested protocols (described in Sections 2.4.1 and 2.5) for vitamin A loading into peritoneal macrophages to compare the efficiency of vitamin A delivery.
For this analysis, we followed the next steps:
Step 1. Inject 3mL thioglycolate to mice, preferably of similar age and body weight. Allow the mice ad libitum access to food and water. If possible, use purified diets (deprived of carotenoids)
Step 2. We typically require two mice for each experimental group
Step 3. Three days after the thioglycolate injection, inject 250μL of either retinol or retinyl ester emulsions intraperitoneally
Step 4. Allow mice of both groups to continue being housed with ad libitum access to a purified, carotenoid-free diet as before for 24h
Step 5. Four days after the thioglycolate injections, sacrifice all mice by CO2 inhalation and collect peritoneal macrophages from each mouse as described in Section 2.4
Step 6. Resuspend cells in growth medium, count cell number, and plate an equal number of cells in untreated Petri dishes
Note: We have observed detectable levels of vitamin A in cells using 25 million cells/condition. For mRNA expression levels, we typically utilize 12-well plates with a total of 1–2 million cells/condition.
Step 7. As described in Section 2.4 (step 8), allow peritoneal macrophages to attach by incubating overnight
Step 8. The day after plating, aspirate medium to remove dead cells and replace it with fresh medium
Step 9. Incubate the cells with the different treatments highlighted in Fig. 6 and Step 18 for details
Step 10. Remove the medium and wash the cells before harvesting
Step 11. Proceed with the subsequent steps of washing, collection of cells by trypsin treatment, cell lysis, and solvent extraction of vitamin A as described in Section 2.4.1 (steps 4–9)
Step 12. Calculate retinyl ester and retinol levels in the samples as described in Section 2.3.2. Use protein quantification in the lysate to normalize cell numbers as described in Section 2.4.1 (step 8)
Step 13. In parallel to our experiments destined for HPLC analyses (Fig. 6A and B), we plated 1–2 million cells/well using 12-well plates for gene expression analyses (Fig. 6C)
Step 14. Vitamin A uptake and accumulation leads to the production of retinoic acid, the transcriptionally active form of vitamin A (Napoli & Race, 1988). Therefore, we measured the expression of two retinoic acid-sensitive genes to serve as surrogate markers of retinoic acid levels in cells. The genes tested were the cytochrome P450 family 26 subfamily A member 1 (Cyp26a1) and the retinoic acid receptor beta (Rarß)
Step 15. After treatment, aspirate off the medium, and add 300μL TRIzol (reagent #21) to each well. Perform RNA extraction using Zymo-Spin IC columns (reagent #22), according to kit instructions provided by Zymo Research
Step 16. Measure the concentration and purity of RNA extracted using a NanoDrop spectrophotometer
Step 17. Use 200ng of RNA and reverse transcriptase to produce cDNA using the Verso cDNA synthesis reverse transcriptase kit (reagent #23)
Step 18. Perform qPCR to measure gene expression of Cyp26a1 (reagent #26) and Rarß (reagent #25) with Hprt (reagent #24) as a housekeeping gene and the appropriate qPCR negative controls
Note: For comparison of the methods of vitamin A loading, we used the following experimental groups:
Control groups:
Dimethyl sulfoxide (DMSO, reagent 17): Vehicle control to dissolve retinol (reagent 15) and retinoic acid (reagent 39).
Retinol dissolved in DMSO
Retinoic acid dissolved in DMSO
Vitamin A-loading groups:
Vitamin A-rich sera: mouse serum (prepared according to Section 2.3.2) and pig serum (prepared according to Section 2.3.3) were administered to cells by mixing with media
The method of intraperitoneal (I·P) injection of retinoids (performed according to Sections 2.5 and 2.4.1).
2.6.1. Interpretation of the results
The comparative analysis of intracellular retinoid levels from all methods described in this article is highlighted in a representative experiment (Fig. 6). The intraperitoneal injection of retinyl ester resulted in the highest vitamin A accumulation in cells (Retinyl palmitate-I.P.). Among peritoneal macrophages exposed to serum lipoproteins, our data show that those cells treated with vitamin A-rich mouse serum yield higher intracellular vitamin A levels than an equimolar concentration of vitamin A in pig serum. These differences could be explained by a greater affinity for mouse lipoproteins when using murine macrophages. All experimental approaches using free retinol resulted in little to no detection of vitamin A in peritoneal cells (Fig. 6A and B).
Surprisingly, our gene expression data did not correlate with our HPLC results. Macrophages exposed to vitamin A-rich serum showed the highest upregulation in retinoic acid-responsive genes. A plausible explanation could be that retinyl esters taken up directly in the peritoneal cavity have a prolonged storage time within cells, while they are converted faster to retinoic acid in cells supplemented with vitamin A-rich sera (Fig. 6C).
3. Summary
Over the past years, the importance of vitamin A in macrophage physiology has gained significant interest, as this nutrient-like hormone mediates physiological processes such as immune system differentiation, macrophage polarization, and macrophage seeding into tissues (Miller et al., 2020). This study compared, tested, and validated two methodologies to deliver vitamin A effectively into cultured macrophages (Fig. 7). In our laboratory, we routinely utilize these two methodologies for different purposes; if we want a physiological approach in which we try to mimic how macrophages are loaded with vitamin A in vivo, we use vitamin A-rich sera. This method could be further improved if the researcher chooses to isolate the chylomicron fraction to perform later chemical modifications such as acetylation or lipoprotein oxidation, which have been shown to dramatically enhance lipoprotein uptake by macrophages (Goldstein, Ho, Basu, & Brown, 1979). However, one should be cautious and consider that chemically modified lipoproteins follow alternative cellular trafficking compared to native lipoproteins (Wang et al., 2007).
Fig. 7.

Schematic representation of the two experimental approaches to load macrophages with vitamin A.
In our second methodological approach, we injected vitamin A directly into the peritoneum of mice previously challenged with thioglycolate. This approach allowed us to increase dramatically the yield of vitamin A compared to vitamin A loading using lipoproteins, which could be helpful for specific purposes such as tracing vitamin A-loaded macrophages in the body.
This study has not explored the specific intracellular compartments in which vitamin A is stored. Since macrophages express the LDL receptor, which takes up lipoproteins including chylomicrons by a clathrin-mediated endocytic process, we assume that lipoprotein-mediated phagocytosis is the canonical pathway for vitamin A uptake in macrophages (Ellsworth, Kraemer, & Cooper, 1987; Goldstein & Brown, 2009; Linton, Babaev, Gleaves, & Fazio, 1999). This pathway results in the hydrolysis of lipids by the endolysosomal system (Hagen, Myhre, Tjelle, Berg, & Norum, 1999), which would be in agreement with our gene expression data showing that macrophages exposed to serum-rich vitamin A have increased levels of transcripts encoded by the two retinoic acid-sensitive genes Cyp26a1 and Rarß. Retinoic acid would be generated due to the hydrolysis of retinyl esters to form retinol (Fig. 1). The intracellular fate of vitamin A in our second method described in Section 2.5, where macrophages directly engulf vitamin A in the peritoneal cavity, is less clear. This topic is currently under investigation in our laboratory as this pathway could be physiologically relevant when efferocytosis occurs as it could happen in the liver when resident macrophages engulf apoptotic stellate cells (Elliott, Koster, & Murphy, 2017).
Acknowledgments
This work was funded by the National Institutes of Health (R01 EY028121) and the United States Department of Agriculture (W4002) to J.A.
References
- Amengual J, & Barrett TJ (2019). Monocytes and macrophages in atherogenesis. Current Opinion in Lipidology, 30(5), 401–408. [DOI] [PMC free article] [PubMed] [Google Scholar]
- Amengual J, Golczak M, Palczewski K, & Von Lintig J (2012). Lecithin: Retinol acyltransferase is critical for cellular uptake of vitamin a from serum retinol-binding protein. Journal of Biological Chemistry, 287(29), 24216–24227. [DOI] [PMC free article] [PubMed] [Google Scholar]
- Amengual J, Guo L, Strong A, Madrigal-Matute J, Wang H, Kaushik S, et al. (2018). Autophagy is required for sortilin-mediated degradation of apolipoprotein B100. Circulation Research, 122(4), 568–582. [DOI] [PMC free article] [PubMed] [Google Scholar]
- Amengual J, Widjaja-Adhi MAK, Rodriguez-Santiago S, Hessel S, Golczak M, Palczewski K, et al. (2013). Two carotenoid Oxygenases contribute to mammalian provitamin a metabolism. Journal of Biological Chemistry, 288(47), 34081–34096. [DOI] [PMC free article] [PubMed] [Google Scholar]
- Barrett TJ (2020). Macrophages in atherosclerosis regression. Arteriosclerosis, Thrombosis, and Vascular Biology, 40(1), 20–33. [DOI] [PMC free article] [PubMed] [Google Scholar]
- Bysani GK, Shenep JL, Hildner WK, Stidham GL, & Roberson PK (1990). Detoxification of plasma containing lipopolysaccharide by adsorption. Critical Care Medicine, 18(1), 67–71. [DOI] [PubMed] [Google Scholar]
- Chapman MJ, & Goldstein S (1976). Comparison of the serum low density lipoprotein and of its apoprotein in the pig, rhesus monkey and baboon with that in man. Atherosclerosis, 25(2–3), 267–291. [DOI] [PubMed] [Google Scholar]
- Elliott MR, Koster KM, & Murphy PS (2017). Efferocytosis signaling in the regulation of macrophage inflammatory responses. The Journal of Immunology, 198(4), 1387–1394. [DOI] [PMC free article] [PubMed] [Google Scholar]
- Ellsworth JL, Kraemer FB, & Cooper AD (1987). Transport of beta-very low density lipoproteins and chylomicron remnants by macrophages is mediated by the low density lipoprotein receptor pathway. Journal of Biological Chemistry, 262(5), 2316–2325. [PubMed] [Google Scholar]
- Farese RV, Véniant MM, Cham CM, Flynn LM, Pierotti V, Loring JF, et al. (1996). Phenotypic analysis of mice expressing exclusively apolipoprotein B48 or apolipoprotein B100. Proceedings of the National Academy of Sciences, 93(13), 6393–6398. [DOI] [PMC free article] [PubMed] [Google Scholar]
- Gannon BM, Davis CR, Nair N, Grahn M, & Tanumihardjo SA (2017). Single high-dose vitamin a supplementation to neonatal piglets results in a transient dose response in extrahepatic organs and sustained increases in liver stores. The Journal of Nutrition, 147(5), 798–806. [DOI] [PMC free article] [PubMed] [Google Scholar]
- Goldstein JL, & Brown MS (2009). The LDL receptor. Arteriosclerosis, Thrombosis, and Vascular Biology, 29(4), 431–438. [DOI] [PMC free article] [PubMed] [Google Scholar]
- Goldstein JL, Ho YK, Basu SK, & Brown MS (1979). Binding site on macrophages that mediates uptake and degradation of acetylated low density lipoprotein, producing massive cholesterol deposition. Proceedings of the National Academy of Sciences, 76(1), 333–337. [DOI] [PMC free article] [PubMed] [Google Scholar]
- Goodman DS (1980). Plasma retinol-binding protein. Annals of the New York Academy of Sciences, 348(1), 378–390. [DOI] [PubMed] [Google Scholar]
- Hagen E, Myhre AM, Tjelle TE, Berg T, & Norum KR (1999). Retinyl esters are hydrolyzed in early endosomes of J774 macrophages. Journal of Lipid Research, 40(2), 309–317. [PubMed] [Google Scholar]
- Hermida MD, Malta R, Santos MDDS, & Dos-Santos WL (2017). Selecting the right gate to identify relevant cells for your assay: A study of thioglycollate-elicited peritoneal exudate cells in mice. BMC Research Notes, 10(1), 1–7. [DOI] [PMC free article] [PubMed] [Google Scholar]
- Ichinose M, Hara N, Sawada M, & Maeno T (1994). A flow cytometric assay reveals an enhancement of phagocytosis by platelet activating factor in murine peritoneal macrophages. Cellular Immunology, 156(2), 508–518. [DOI] [PubMed] [Google Scholar]
- Ipseiz N, Czubala MA, Bart VM, Davies LC, Jenkins RH, Brennan P, et al. (2020). Effective in vivo gene modification in mouse tissue-resident peritoneal macrophages by intraperitoneal delivery of lentiviral vectors. Molecular Therapy-Methods & Clinical Development, 16, 21–31. [DOI] [PMC free article] [PubMed] [Google Scholar]
- Kim W, Kim SH, Jang JH, Kim C, Kim K, Suh YG, et al. (2018). Role of heme oxygenase-1 in potentiation of phagocytic activity of macrophages by taurine chloramine: Implications for the resolution of zymosan A-induced murine peritonitis. Cellular Immunology, 327, 36–46. [DOI] [PubMed] [Google Scholar]
- Li Y, & Boraschi D (2016). Endotoxin contamination: A key element in the interpretation of nanosafety studies. Nanomedicine, 11(3), 269–287. [DOI] [PubMed] [Google Scholar]
- Linton MF, Babaev VR, Gleaves LA, & Fazio S (1999). A direct role for the macrophage low density lipoprotein receptor in atherosclerotic lesion formation. Journal of Biological Chemistry, 274(27), 19204–19210. [DOI] [PubMed] [Google Scholar]
- Low H, Hoang A, & Sviridov D (2012). Cholesterol efflux assay. JoVE (Journal of Visualized Experiments), 61, e3810. [DOI] [PMC free article] [PubMed] [Google Scholar]
- Miller AP, Coronel J, & Amengual J (2020). The role of β-carotene and vitamin a in atherogenesis: Evidences from preclinical and clinical studies. Biochimica et Biophysica Acta (BBA)-Molecular and Cell Biology of Lipids, (158635). [DOI] [PMC free article] [PubMed] [Google Scholar]
- Mousseron-Canet M (1971). [242] photochemical transformation of vitamin a. in methods in enzymology. Vol. 18 (pp. 591–615). Academic Press. [Google Scholar]
- Murray PJ, Allen JE, Biswas SK, Fisher EA, Gilroy DW, Goerdt S,et al. (2014). Macrophage activation and polarization: Nomenclature and experimental guidelines. Immunity, 41(1), 14–20. [DOI] [PMC free article] [PubMed] [Google Scholar]
- Napoli JL, & Race KR (1988). Biogenesis of retinoic acid from beta-carotene. Differences between the metabolism of beta-carotene and retinal. Journal of Biological Chemistry, 263(33), 17372–17377. [PubMed] [Google Scholar]
- Olson JM, Ameer MA, & Goyal A (2021). Vitamin a toxicity. StatPearls (Internet). [PubMed] [Google Scholar]
- Rhodes J, & Oliver S (1980). Retinoids as regulators of macrophage function. Immunology, 40(3), 467. [PMC free article] [PubMed] [Google Scholar]
- Rőszer T, Menéndez-Gutiérrez MP, Cedenilla M, & Ricote M (2013). Retinoid X receptors in macrophage biology. Trends in Endocrinology and Metabolism, 24(9), 460–468. [DOI] [PubMed] [Google Scholar]
- Terpstra AHM (1985). Isolation of serum chylomicrons prior to density gradient ultracentrifugation of other serum lipoprotein classes. Analytical Biochemistry, 150(1), 221–227. [DOI] [PubMed] [Google Scholar]
- Wang MD, Kiss RS, Franklin V, McBride HM, Whitman SC, & Marcel YL (2007). Different cellular traffic of LDL-cholesterol and acetylated LDL-cholesterol leads to distinct reverse cholesterol transport pathways. Journal of Lipid Research, 48(3), 633–645. [DOI] [PubMed] [Google Scholar]
- Yen CLE, Monetti M, Burri BJ, & Farese RV (2005). The triacylglycerol synthesis enzyme DGAT1 also catalyzes the synthesis of diacylglycerols, waxes, and retinyl esters. Journal of Lipid Research, 46(7), 1502–1511. [DOI] [PubMed] [Google Scholar]
- Yu M, Amengual J, Menon A, Kamaly N, Zhou F, Xu X, et al. (2017). Targeted nanotherapeutics encapsulating liver x receptor agonist gw3965 enhance antiatherogenic effects without adverse effects on hepatic lipid metabolism in Ldlr −/− mice. Advanced Healthcare Materials, 6(20), 1700313. [DOI] [PMC free article] [PubMed] [Google Scholar]
- Zhou F, Wu X, Pinos I, Abraham BM, Barrett TJ, von Lintig J, et al. (2020). β-Carotene conversion to vitamin a delays atherosclerosis progression by decreasing hepatic lipid secretion in mice. Journal of Lipid Research, 61(11), 1491–1503. [DOI] [PMC free article] [PubMed] [Google Scholar]