Abstract
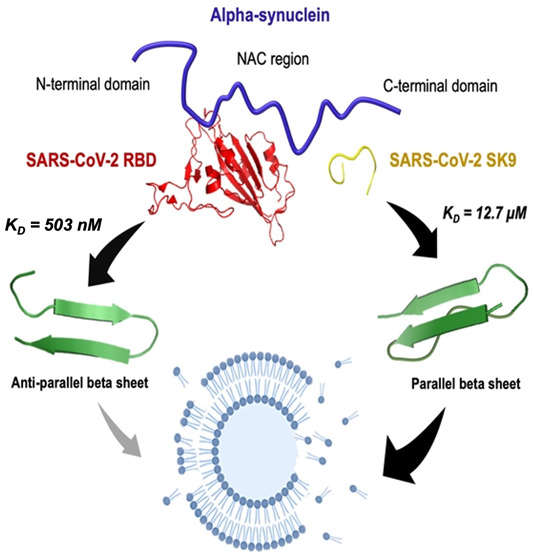
The neurological symptoms of long COVID and viral neuroinvasion have raised concerns about the potential interactions between SARS-CoV-2 protein segments and neuronal proteins, which might confer a risk of post-infection neurodegeneration, but the underlying mechanisms remain unclear. Here, we reported that the receptor-binding domain (RBD) of the spike protein and the nine-residue segment (SK9) of the envelope protein could bind to α-synuclein (αSyn) with Kd values of 503 ± 24 nM and 12.7 ± 1.6 μM, respectively. RBD could inhibit αSyn fibrillization by blocking the non-amyloid-β component region and mediating its antiparallel β-sheet structural conversions. Omicron-RBD (BA.5) was shown to have a slightly stronger affinity for αSyn (Kd = 235 ± 10 nM), which implies similar effects, whereas SK9 may bind to the C-terminus which accelerates the formation of parallel β-sheet-containing oligomers and abruptly increases the rate of membrane disruption by 213%. Our results provide plausible molecular insights into the impact of SARS-CoV-2 post-infection and the oligomerization propensity of αSyn that is associated with Parkinson’s disease.
More than 546 million people have been infected by severe acute respiratory syndrome coronavirus-2 (SARS-CoV-2) or its variants, such as the contagious Omicron,1,2 which poses increasing worldwide health concerns due to post-coronavirus disease conditions (long COVID).3 Some patients have developed neurological manifestations such as postural instability, rigidity, and bradykinesia.4,5 Cases of probable Parkinson’s disease (PD) have been reported, though the clinical correlation has yet to be established.4,6 Recent studies indicate that SARS-CoV-2 invades the central nervous system (CNS), which can cause neuroinflammation and brain-related abnormalities,7 and it is also suspected to spread in neuronal cells via tunneling nanotubes.8 Neuroinvasion is supported by autopsy reports showing its RNA and antigens in brain samples.9 Thus, these viral segments have the chance to interact with neuronal proteins, which might confer a risk of neurodegeneration.
SARS-CoV-2 is an enveloped RNA virus, containing spike (S) with receptor-binding domain (RBD), envelope (E), membrane (M), nucleocapsid (N), and nonstructural proteins.10 These proteins or their derived segments by enzymatic cleavage directly interact with host cells or form amyloids.11,12 S protein subunits were found to cross the blood–brain barrier (BBB) in mice.13 E protein was identified to invade the CNS to attach to neuronal receptors.14 Recent studies showed that S protein weakens the BBB at ∼10 nM,15 while E protein was found to effectively disrupt the BBB at ∼100 nM.16 With other factors such as the inflammatory response and pre-existing illness, the weakened BBB may allow more viral antigens to penetrate the CNS. Meanwhile, α-synuclein (αSyn), a presynaptic protein that controls neurotransmitter release, is upregulated as an immune response to infections.17 αSyn has 140 residues in its N-terminal region (1–60), non-amyloid-β component (NAC) region (61–95), and C-terminal region (96–140).18 Its monomers lack stable secondary structures but could assemble into oligomers to cause cell death and grow into fibers in Lewy bodies, which is a hallmark of PD.19 However, it is still unclear why αSyn aggregates, in which the SARS-CoV-2 infection further gives rise to its complications.20 There have been attempts to explore the interactions between SARS-CoV-2 proteins and αSyn. RBD of S protein acts to initiate cell entry,21 which has been studied by different researchers with contradictory arguments about its interaction with αSyn. Idrees and Kumar used docking simulations to predict a high affinity between αSyn and RBD.22 Claessens and co-workers, using fluorescence aggregation assays, found that S protein has no effect on αSyn aggregation whereas N protein accelerates it.23 In addition, E protein plays an important role in viral release, and its SFYVYSRVK fragment (SK9) is amyloidogenic but less understood.24 Hansmann and co-workers reported that an E protein segment alters αSyn conformations for amyloid formation by molecular dynamics simulations.25 Nevertheless, the existing results are insufficient to interpret their molecular mechanisms, because there is limited information about the effect of SARS-CoV-2 segments on αSyn oligomerization and membrane toxicity prior to fibrillation.
Here, we combined experimental and computational methods to quantify the binding affinity and thermodynamic driving force for the interaction between αSyn and two SARS-CoV-2 protein segments, RBD of S protein and SK9 of E protein. We analyzed the time-dependent structural changes of αSyn during the incubation with RBD and SK9, followed by assessments of their associated disruption of membrane integrity. Furthermore, we adopted our model to predict the effects of Omicron-RBD on αSyn oligomerization.
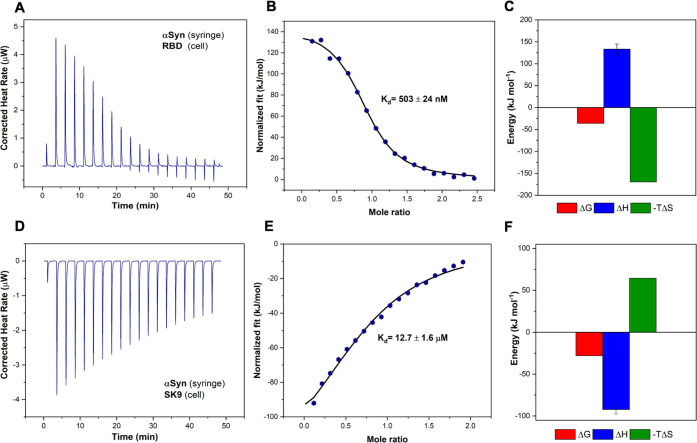
Using isothermal titration calorimetry (ITC), we investigated the interactions of these SARS-CoV-2 protein segments with αSyn. The thermogram profile of the titration of αSyn and RBD is shown in Figure 1A, which is corrected by control experiments (Figure S1). Further analyses of the binding curve and thermodynamics are illustrated in panels B and C of Figure 1, respectively, showing that the binding between RBD and αSyn is an endothermic and entropically driven process with a Kd of 503 ± 24 nM, a ΔG of −36 kJ mol–1, a ΔH of 133.5 kJ mol–1, and a −TΔS of −169.5 kJ mol–1. The nanomolar moderate binding affinity indicates polar interactions such as hydrogen bonding and dipole–dipole interactions. The enthalpic penalty could be due to the presence of nonpolar residues, but this repulsion is compensated by the entropic gain.26
Figure 1.
Interactions between αSyn and SARS-CoV-2 protein segments. (A) Thermogram of αSyn–RBD titration. (B) αSyn–RBD binding curve. (C) Thermodynamics of αSyn–RBD titration with ΔG (red), ΔH (blue), and −TΔS (green). (D) Thermogram of αSyn–SK9 titration. (E) αSyn–SK9 binding curve. (F) Thermodynamics of αSyn–SK9 titration with ΔG (red), ΔH (blue), and −TΔS (green).
The thermogram and binding profile of the titration of αSyn and SK9 are shown in Figure 1D–F. By contrast, the binding between SK9 and αSyn is an exothermic, enthalpically driven process with a Kd of 12.7 ± 1.6 μM, a ΔG of −28 kJ mol–1, a ΔH of −92.3 kJ mol–1, and a −TΔS of 64.3 kJ mol–1. The weaker binding affinity suggests relatively few polar interactions and nonbonded contacts. The enthalpic gain could be attributed to the salt-bridge and polar interactions, but this could also reduce some chain movement that leads to entropic loss.26 Overall, the Gibbs free energies of these two complexes are still negative, which indicates favorable binding between them. This implies the possibility that SARS-CoV-2 protein segments will influence the native monomeric αSyn for potential amyloidogenesis.
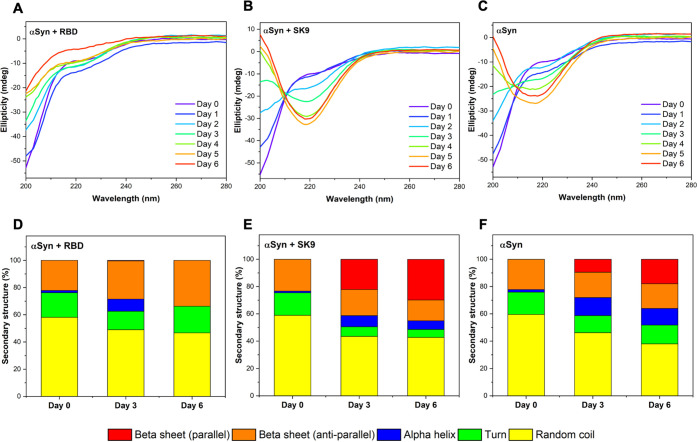
To study how the interactions with SARS-CoV-2 protein segments affect the assembly of αSyn, we monitored the time-dependent secondary structures of αSyn–RBD, αSyn–SK9, and αSyn systems by circular dichroism (CD) spectroscopy. The concentrations of the protein segments were selected to be greater than their concentration thresholds to cause disruption of the blood–blood barrier. Measurements were conducted during the incubation from day 0 to day 6, followed by spectral fitting analysis (Figure S2). The signal represents only ensemble αSyn structures because the contributions from RBD and SK9 are negligible (Figure S3). Figure 2A presents the CD spectra of αSyn–RBD, showing a consistent peak below 200 nm assigned to random coil.27 The spectral analysis in Figure 2D shows the initial αSyn–RBD system is dominated by random coil (58.1%) and has turn (18.1%), α-helix (1.7%), and antiparallel β-sheet (22.1%). The level of random coil decreases to 49.0% on day 3 and 46.7% on day 6, while the level of antiparallel β-sheet increases to 28.1% on day 3 and 33.8% on day 6. Although the signal shows no sign of aggregation, the increase in the level of antiparallel β-sheet may still affect the normal functions of αSyn. Because the intermolecular and intramolecular associations of αSyn could give rise to antiparallel β-sheet,28 it is likely that the system has off-pathway species that inhibit αSyn aggregation. By contrast, the CD spectra of the αSyn–SK9 system in Figure 2B show a significant spectral peak shift to 218 nm, indicating a change in the ensemble structure from random coil to β-sheet.27Figure 2E shows the initial profile of the αSyn–SK9 system dominated by random coil (58.9%) and with turn (16.5%), α-helix (1.3%), and antiparallel β-sheet (23.3%). The level of random coil decreases to 43.5% on day 3 and 42.8% on day 6, as does the level of antiparallel β-sheet to 19.1% on day 3 and 15.2% on day 6. Strikingly, the level of parallel β-sheet is 22.2% on day 3 and 29.9% on day 6. This indicates that αSyn could aggregate faster in the presence of SK9. As a control, Figure 2C shows the CD spectra of αSyn with a spectral shift from a peak below 200 nm to a medium peak at 218 nm, which means αSyn self-assembles to form β-sheet structures.27 Spectral analysis in Figure 2F reveals a typical monomeric profile of αSyn with random coil (59.5%), turn (16.4%), α-helix (1.9%), and antiparallel β-sheet (22.2%). The level of parallel β-sheet is 9.49% on day 3 and 17.9% on day 6, which is clearly higher than that of the αSyn–RBD system and lower than that of the αSyn–SK9 system. Furthermore, the thioflavin T assay shows no indications of αSyn fibrillar structure compared to the well-known αSyn filamentation with ions such as Mg2+ (Figure S4). Hence, these β-sheet-containing species of αSyn could be attributed to oligomers, an idea that is supported by the previous studies of wild-type αSyn oligomers.28
Figure 2.
Time-dependent structural changes of αSyn in the presence of RBD and SK9 determined by CD spectroscopy. Time-dependent spectra of (A) αSyn–RBD, (B) αSyn–SK9, and (C) αSyn, from day 0 to day 6. Structural profiles derived for (D) αSyn–RBD, (E) αSyn–SK9, and (F) αSyn, on selected days. Random coil (yellow), turn (green), α-helix (blue), antiparallel β-sheet (orange), and parallel β-sheet (red). The fitting details of the CD spectra are shown in Figure S2 and Table S1.
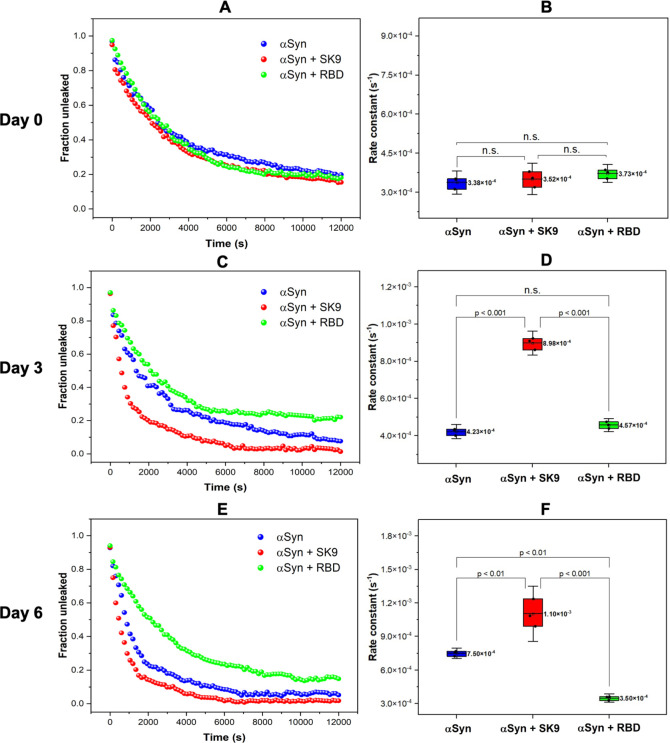
To evaluate the membrane toxicity of the αSyn species in the presence of RBD and SK9, we performed a fluorescence leakage assay using the small unilamellar vesicles (SUVs). The SUV composition is presented in the Supporting Information, and their size and polydispersity index are shown in Figure S5. The SUVs alone gave a consistent flat signal, while the addition of Triton X-100 gave a maximum quenched signal (Figure S6), which is the basis for leakage calculation. The fraction unleaked was plotted versus time, which was fitted with a single-exponential decay to derive the leakage rate constants (Figures S7–S9) for paired comparison. The extractives from all systems on day 0 exhibit similar decay curves in Figure 3A. Figure 3B shows the membrane leakage rate constants are statistically equivalent for the αSyn–RBD [k = (3.73 ± 0.17) × 10–4 s–1], αSyn–SK9 [k = (3.52 ± 0.30) × 10–4 s–1], and αSyn [k = (3.38 ± 0.22) × 10–4 s–1] systems. This implies identical forms of αSyn, which is consistent to their initially random coil dominant profile on day 0. It is also worth noting that none of them have achieved the complete leakage in the span of 12000 s, which verifies αSyn monomers with a slow membrane disruption ability. Figure 3C shows an abrupt decay for the αSyn–SK9 system on day 3, and Figure 3D presents a dramatic 153% increase in leakage rate constant for αSyn–SK9 [k = (8.98 ± 0.32) × 10–4 s–1], whereas the others are still statistically similar. The abrupt membrane leakage indicates the presence of αSyn oligomers, which are known for membrane toxicity.28 Considering the structural profile of the αSyn–SK9 incubation system on day 3 with the emerging 21% parallel β-sheet component in Figure 2, these toxic αSyn oligomers are likely generated from the intermolecular interactions and their development is accelerated by the presence of SK9 in the αSyn–SK9 incubation system. Figure 3E shows that the plots for the extractives from the three incubation systems on day 6 further deviate from each other. There is a steeper decay for αSyn–SK9, a sudden decay for αSyn, and an unchanged decay for αSyn–RBD. Figure 3F shows the leakage rate constants for the αSyn–SK9 [k = (1.10 ± 0.12) × 10–3 s–1], αSyn [k = (7.5 ± 0.24) × 10–4 s–1], and αSyn–RBD [k = (3.50 ± 0.18) × 10–4 s–1] systems. It is interesting that αSyn–RBD extractives on day 6 have the lowest rate, which implies a low level of toxic oligomerization. The increase in the level of the antiparallel β-sheet structural component in the 6-day αSyn–RBD incubation could be attributed to its off-pathway species that block the aggregation of αSyn. On the contrary, the leakage rate constants for the extractives of αSyn–SK9 and αSyn on day 6 have increased by 213% and 122%, respectively, compared to their initial values. This indicates that both exhibit membrane disruption ability. The difference in their leakage rate constants could arise from the heterogeneous nature of αSyn oligomers, which suggests that the αSyn–SK9 system is in an advanced state. Because αSyn oligomers could exert their neurotoxicity by disrupting the membrane integrity compared to its fibrils,29 the oligomers formed upon interacting with SARS-CoV-2 protein segments (i.e., SK9) may cause similar neurotoxicity.
Figure 3.
(A) Initial membrane leakage profiles of the extractives from the αSyn–RBD (green), αSyn–SK9 (red), and αSyn (blue) systems with (B) whisker plots of rate constants. (C) Membrane leakage profiles on day 3 with (D) whisker plots of rate constants. (E) Membrane leakage profiles of the extractives on day 6 with (F) whisker plots of rate constants. The mean of the rate constants (n = 3) and the paired comparison plot are included (no significant difference, n.s.; significant difference, p < 0.001, p < 0.01). The details of the fitting are listed in Table S2.
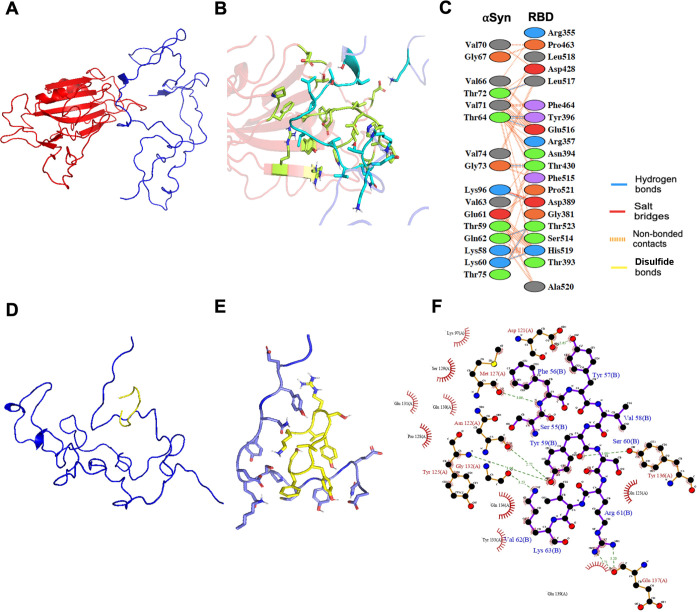
To provide the possible interaction interface between αSyn and the two protein segments (RBD and SK9) to explain the observations of the ensemble experiments, we performed protein–protein docking simulations. The recent docking22 was based on the crystal structure of the membrane-bound αSyn monomer, giving predicted affinities much stronger than the experimental values reported here. We adopted monomeric αSyn configurations to search for suitable models, which is described in the Supporting Information. The models were optimized by running through various conformations of αSyn until there is a good agreement between the predicted binding parameters and the experimental values as shown in Table 1. Panels A–C of Figure 4 illustrate the αSyn–RBD model and interface, which reveals one salt bridge, seven hydrogen bonds, and 100 nonbonded contacts to account for its nanomolar affinity. More importantly, it shows that RBD could bind to the NAC region of αSyn, where the nonpolar residues are dominant. This explains the enthalpic penalty due to the contact with polar and nonpolar residues. RBD prevents the αSyn NAC region from intermolecular assembly, which is critical for oligomerization. To further validate our proposed model and address the recent concerns about the Omicron variant (BA.5),2 we performed docking and ITC with its RBD, which contains 17 mutations compared to wild-type RBD (Figure S10). The binding of the αSyn–Omicron (BA.5) RBD interface (Figure S11) is predicted to be stronger (Kd = 210 nM) than that of αSyn–RBD (wild type), and it is validated experimentally (Kd = 235 ± 10 nM) in Figure S12. Its interface presents two salt bridges, five hydrogen bonds, and 112 nonbonded contacts, which explains the stronger affinity for αSyn. This Omicron RBD also binds to the NAC region of αSyn, which may exert similar effects on αSyn aggregation, but this should be verified by future experimental studies. Panels D–F of Figure 4 present the αSyn–SK9 model and interface, which reveals seven hydrogen bonds and 66 nonbonded contacts for its micromolar affinity. Interestingly, SK9 could bind to the C-terminal region of αSyn, where the interactions with polar residues are enthalpically favorable, but this reduces the chain flexibility and results in an entropic penalty. The interaction of the C-terminus of αSyn and SK9 facilitates its intermolecular attractions by exposing its NAC region to increase its aggregation propensity, as indicated by the merging parallel β-sheet structure in Figure 2, the abrupt membrane leakage in Figure 3, and other computational simulations.25 Moreover, this αSyn–SK9 model is consistent with recent studies that found that the binding of Ca2+ to the C-terminus of αSyn increases the solvent accessibility of its N-terminus toward a high aggregation propensity.30 Because the optimized αSyn–SK9 model also involves the interactions with those residues in the C-terminus of αSyn, a similar mechanism might be applied to explain why SK9 accelerates the αSyn oligomerization. The alignment of the optimized models with experimental observations could indicate one of the possible mechanisms for the interaction between αSyn and SARS-CoV-2 protein segments. However, due to the limitations of docking such as restricted sampling, the models may need more accurate computational methods to totally match the measured binding parameters to give a better explanation of our experimental ensemble observations.
Table 1. Comparison of the Experimental Values and Computationally Simulated Results for the Gibbs Free Energy and the Binding Affinity of the αSyn–RBD and αSyn–SK9 Interactions.
| Gibbs
free energy (kJ mol–1) |
binding affinity (mol L–1) |
|||
|---|---|---|---|---|
| a | b | a | b | |
| αSyn–RBD | –36.0 | –35.9 | 5.03 × 10⁻⁷ | 4.70 × 10⁻⁷ |
| αSyn–SK9 | –28.0 | –27.2 | 1.27 × 10⁻⁵ | 1.60 × 10⁻⁵ |
Experimental.
Computational.
Figure 4.
Molecular illustration of the interactions between αSyn and SARS-CoV-2 protein segments (RBD and SK9). (A) Optimized αSyn–RBD model from protein–protein docking. (B) Binding interface between αSyn and RBD. (C) Interacting residues from the αSyn–RBD interface. (D) Optimized αSyn–SK9 model from protein–peptide docking. (E) Binding interface between αSyn and SK9. (F) Interacting residues from the αSyn–SK9 interface.
In conclusion, we conducted a comprehensive investigation of how the two SARS-CoV-2 protein segments (RBD and SK9) alter the oligomerization propensity of αSyn. The excellent agreements of our experimental and computational analyses allow us to depict αSyn–RBD and αSyn–SK9 interactions with profound molecular insights. RBD binds to αSyn in an entropically driven process and may block its NAC region, which reduces the membrane-toxic αSyn oligomers and alleviates αSyn aggregation by promoting the off-pathway species in antiparallel β-sheet structures. On the contrary, SK9 interacts with αSyn in an enthalpically driven process and could attach to the C-terminus of αSyn. This implies that αSyn NAC and N-terminal regions are accessible for intermolecular parallel β-sheet formation to accelerate the oligomerization and cause the abrupt disruption of membrane integrity, with a rate increase of 213% versus its initial value. Although this study is focused on only protein segments, we cannot neglect the fact that these segments could be exposed when their parent proteins undergo proteolytic cleavage during the inflammatory response.20 Hence, our results suggest to consider E protein as one of the promoting factors for Parkinsonism, aside from N protein.23 Therefore, our findings may provide profound molecular insights into the neurodegenerative consequences of SARS-CoV-2 post-infection and affirm the role of different αSyn regions in its oligomerization propensity, which would shed light to the development of better therapeutics against viral infection and neurodegeneration diseases in the future.
Acknowledgments
J.H. acknowledges the funding support from the Research Grant Council of Hong Kong under Projects 16309721 and 16310022. Y.G. acknowledges the funding support from the Research Grant Council of Hong Kong under Project 16102921.
Supporting Information Available
The Supporting Information is available free of charge at https://pubs.acs.org/doi/10.1021/acs.jpclett.2c02278.
Detailed methods and supporting figures and tables showing ITC, CD, and fluorescence leakage assay control experiments; a ThT aggregation assay; the particle size distribution of SUVs; CD and fluorescence leakage assay fitting details; a SARS-CoV-2 RBD (wild type and Omicron) model; and an αSyn–RBD (Omicron) interaction model and its experimental binding affinity (PDF)
The authors declare no competing financial interest.
Supplementary Material
References
- World Health Organization . COVID-19 Weekly Epidemiological Update. 2022, No. June, 1–33.
- Karim S. S. A.; Karim Q. A. Omicron SARS-CoV-2 Variant: A New Chapter in the COVID-19 Pandemic. Lancet 2021, 398 (10317), 2126–2128. 10.1016/S0140-6736(21)02758-6. [DOI] [PMC free article] [PubMed] [Google Scholar]
- Leta V.; Rodríguez-Violante M.; Abundes A.; Rukavina K.; Teo J. T.; Falup-Pecurariu C.; Irincu L.; Rota S.; Bhidayasiri R.; Storch A.; Odin P.; Antonini A.; Ray Chaudhuri K. Parkinson’s Disease and Post–COVID-19 Syndrome: The Parkinson’s Long-COVID Spectrum. Mov. Disord. 2021, 36 (6), 1287–1289. 10.1002/mds.28622. [DOI] [PMC free article] [PubMed] [Google Scholar]
- Rao A. R.; Hidayathullah S. M.; Hegde K.; Adhikari P. Parkinsonism: An Emerging Post COVID Sequelae. IDCases 2022, 27, e01388 10.1016/j.idcr.2022.e01388. [DOI] [PMC free article] [PubMed] [Google Scholar]
- Schneider S. A.; Hennig A.; Martino D. Relationship between COVID-19 and Movement Disorders: A Narrative Review. Eur. J. Neurol. 2022, 29 (4), 1243–1253. 10.1111/ene.15217. [DOI] [PubMed] [Google Scholar]
- Makhoul K.; Jankovic J. Parkinson’s Disease after COVID-19. J. Neurol. Sci. 2021, 422, 117331. 10.1016/j.jns.2021.117331. [DOI] [PMC free article] [PubMed] [Google Scholar]
- Rutkai I.; Mayer M. G.; Hellmers L. M.; Ning B.; Huang Z.; Monjure C. J.; Coyne C.; Silvestri R.; Golden N.; Hensley K.; Chandler K.; Lehmicke G.; Bix G. J.; Maness N. J.; Russell-Lodrigue K.; Hu T. Y.; Roy C. J.; Blair R. V.; Bohm R.; Doyle-Meyers L. A.; Rappaport J.; Fischer T. Neuropathology and Virus in Brain of SARS-CoV-2 Infected Non-Human Primates. Nat. Commun. 2022, 13 (1), 1745. 10.1038/s41467-022-29440-z. [DOI] [PMC free article] [PubMed] [Google Scholar]
- Pepe A.; Pietropaoli S.; Vos M.; Barba-Spaeth G.; Zurzolo C. Tunneling Nanotubes Provide a Novel Route for SARS-CoV-2 Spreading between Permissive Cells and to Non-Permissive Neuronal Cells. Sci. Adv. 2022, 8 (29), eabo0171 10.1126/sciadv.abo0171. [DOI] [PMC free article] [PubMed] [Google Scholar]
- Mukerji S. S.; Solomon I. H. What Can We Learn from Brain Autopsies in COVID-19?. Neurosci. Lett. 2021, 742, 135528. 10.1016/j.neulet.2020.135528. [DOI] [PMC free article] [PubMed] [Google Scholar]
- V’kovski P.; Kratzel A.; Steiner S.; Stalder H.; Thiel V. Coronavirus Biology and Replication: Implications for SARS-CoV-2. Nat. Rev. Microbiol. 2021, 19 (3), 155–170. 10.1038/s41579-020-00468-6. [DOI] [PMC free article] [PubMed] [Google Scholar]
- Jackson C. B.; Farzan M.; Chen B.; Choe H. Mechanisms of SARS-CoV-2 Entry into Cells. Nat. Rev. Mol. Cell Biol. 2022, 23 (1), 3–20. 10.1038/s41580-021-00418-x. [DOI] [PMC free article] [PubMed] [Google Scholar]
- Nyström S.; Hammarström P. Amyloidogenesis of SARS-CoV-2 Spike Protein. J. Am. Chem. Soc. 2022, 144 (20), 8945–8950. 10.1021/jacs.2c03925. [DOI] [PMC free article] [PubMed] [Google Scholar]
- Rhea E. M.; Logsdon A. F.; Hansen K. M.; Williams L. M.; Reed M. J.; Baumann K. K.; Holden S. J.; Raber J.; Banks W. A.; Erickson M. A. The S1 Protein of SARS-CoV-2 Crosses the Blood–Brain Barrier in Mice. Nat. Neurosci. 2021, 24 (3), 368–378. 10.1038/s41593-020-00771-8. [DOI] [PMC free article] [PubMed] [Google Scholar]
- Szabo M. P.; Iba M.; Nath A.; Masliah E.; Kim C. Does SARS-CoV-2 Affect Neurodegenerative Disorders? TLR2, a Potential Receptor for SARS-CoV-2 in the CNS. Exp. Mol. Med. 2022, 54 (4), 447–454. 10.1038/s12276-022-00755-7. [DOI] [PMC free article] [PubMed] [Google Scholar]
- Buzhdygan T. P.; DeOre B. J.; Baldwin-Leclair A.; Bullock T. A.; McGary H. M.; Khan J. A.; Razmpour R.; Hale J. F.; Galie P. A.; Potula R.; Andrews A. M.; Ramirez S. H. The SARS-CoV-2 Spike Protein Alters Barrier Function in 2D Static and 3D Microfluidic in-Vitro Models of the Human Blood–Brain Barrier. Neurobiol. Dis. 2020, 146, 105131. 10.1016/j.nbd.2020.105131. [DOI] [PMC free article] [PubMed] [Google Scholar]
- Ju J.; Su Y.; Zhou Y.; Wei H.; Xu Q. The SARS-CoV-2 Envelope Protein Disrupts Barrier Function in an in Vitro Human Blood-Brain Barrier Model. Front. Cell. Neurosci. 2022, 16, 897564. 10.3389/fncel.2022.897564. [DOI] [PMC free article] [PubMed] [Google Scholar]
- Beatman E. L.; Massey A.; Shives K. D.; Burrack K. S.; Chamanian M.; Morrison T. E.; Beckham J. D. Alpha-Synuclein Expression Restricts RNA Viral Infections in the Brain. J. Virol. 2016, 90 (6), 2767–2782. 10.1128/JVI.02949-15. [DOI] [PMC free article] [PubMed] [Google Scholar]
- Stefanis L. A-Synuclein in Parkinson's Disease. Cold Spring Harbor Perspect. Med. 2012, 2 (2), a009399. 10.1101/cshperspect.a009399. [DOI] [PMC free article] [PubMed] [Google Scholar]
- Meade R. M.; Fairlie D. P.; Mason J. M. Alpha-Synuclein Structure and Parkinson’s Disease - Lessons and Emerging Principles. Mol. Neurodegener. 2019, 14 (1), 29. 10.1186/s13024-019-0329-1. [DOI] [PMC free article] [PubMed] [Google Scholar]
- Tavassoly O.; Safavi F.; Tavassoly I. Seeding Brain Protein Aggregation by SARS-CoV-2 as a Possible Long-Term Complication of COVID-19 Infection. ACS Chem. Neurosci. 2020, 11 (22), 3704–3706. 10.1021/acschemneuro.0c00676. [DOI] [PubMed] [Google Scholar]
- Shang J.; Ye G.; Shi K.; Wan Y.; Luo C.; Aihara H.; Geng Q.; Auerbach A.; Li F. Structural Basis of Receptor Recognition by SARS-CoV-2. Nature 2020, 581 (7807), 221–224. 10.1038/s41586-020-2179-y. [DOI] [PMC free article] [PubMed] [Google Scholar]
- Idrees D.; Kumar V. SARS-CoV-2 Spike Protein Interactions with Amyloidogenic Proteins: Potential Clues to Neurodegeneration. Biochem. Biophys. Res. Commun. 2021, 554, 94–98. 10.1016/j.bbrc.2021.03.100. [DOI] [PMC free article] [PubMed] [Google Scholar]
- Semerdzhiev S. A.; Fakhree M. A. A.; Segers-Nolten I.; Blum C.; Claessens M. M. A. E. Interactions between SARS-CoV-2 N-Protein and α-Synuclein Accelerate Amyloid Formation. ACS Chem. Neurosci. 2022, 13 (1), 143–150. 10.1021/acschemneuro.1c00666. [DOI] [PMC free article] [PubMed] [Google Scholar]
- Jana A. K.; Greenwood A. B.; Hansmann U. H. E. Presence of a SARS-CoV-2 Protein Enhances Amyloid Formation of Serum Amyloid A. J. Phys. Chem. B 2021, 125 (32), 9155–9167. 10.1021/acs.jpcb.1c04871. [DOI] [PMC free article] [PubMed] [Google Scholar]
- Jana A. K.; Lander C. W.; Chesney A. D.; Hansmann U. H. E. Effect of an Amyloidogenic SARS-COV-2 Protein Fragment on α-Synuclein Monomers and Fibrils. J. Phys. Chem. B 2022, 126 (20), 3648–3658. 10.1021/acs.jpcb.2c01254. [DOI] [PMC free article] [PubMed] [Google Scholar]
- Du X.; Li Y.; Xia Y. L.; Ai S. M.; Liang J.; Sang P.; Ji X.-L.; Liu S.-Q. Insights into Protein–Ligand Interactions Mechanisms, Models, and Methods. Int. J. Mol. Sci. 2016, 17 (2), 144. 10.3390/ijms17020144. [DOI] [PMC free article] [PubMed] [Google Scholar]
- Greenfield N. J. Using Circular Dichroism Spectra to Estimate Protein Secondary Structure. Nat. Protoc. 2006, 1 (6), 2876–2890. 10.1038/nprot.2006.202. [DOI] [PMC free article] [PubMed] [Google Scholar]
- Cremades N.; Chen S. W.; Dobson C. M. Structural Characteristics of α-Synuclein Oligomers. Int. Rev. Cell Mol. Biol. 2017, 329, 79–143. 10.1016/bs.ircmb.2016.08.010. [DOI] [PubMed] [Google Scholar]
- Winner B.; Jappelli R.; Maji S. K.; Desplats P. A.; Boyer L.; Aigner S.; Hetzer C.; Loher T.; Vilar M.; Campioni S.; Tzitzilonis C.; Soragni A.; Jessberger S.; Mira H.; Consiglio A.; Pham E.; Masliah E.; Gage F. H.; Riek R. In Vivo Demonstration That α-Synuclein Oligomers Are Toxic. Proc. Natl. Acad. Sci. U. S. A. 2011, 108 (10), 4194–4199. 10.1073/pnas.1100976108. [DOI] [PMC free article] [PubMed] [Google Scholar]
- Stephens A. D.; Zacharopoulou M.; Moons R.; Fusco G.; Seetaloo N.; Chiki A.; Woodhams P. J.; Mela I.; Lashuel H. A.; Phillips J. J.; De Simone A.; Sobott F.; Schierle G. S. K. Extent of N-Terminus Exposure of Monomeric Alpha-Synuclein Determines Its Aggregation Propensity. Nat. Commun. 2020, 11 (1), 2820. 10.1038/s41467-020-16564-3. [DOI] [PMC free article] [PubMed] [Google Scholar]
Associated Data
This section collects any data citations, data availability statements, or supplementary materials included in this article.


