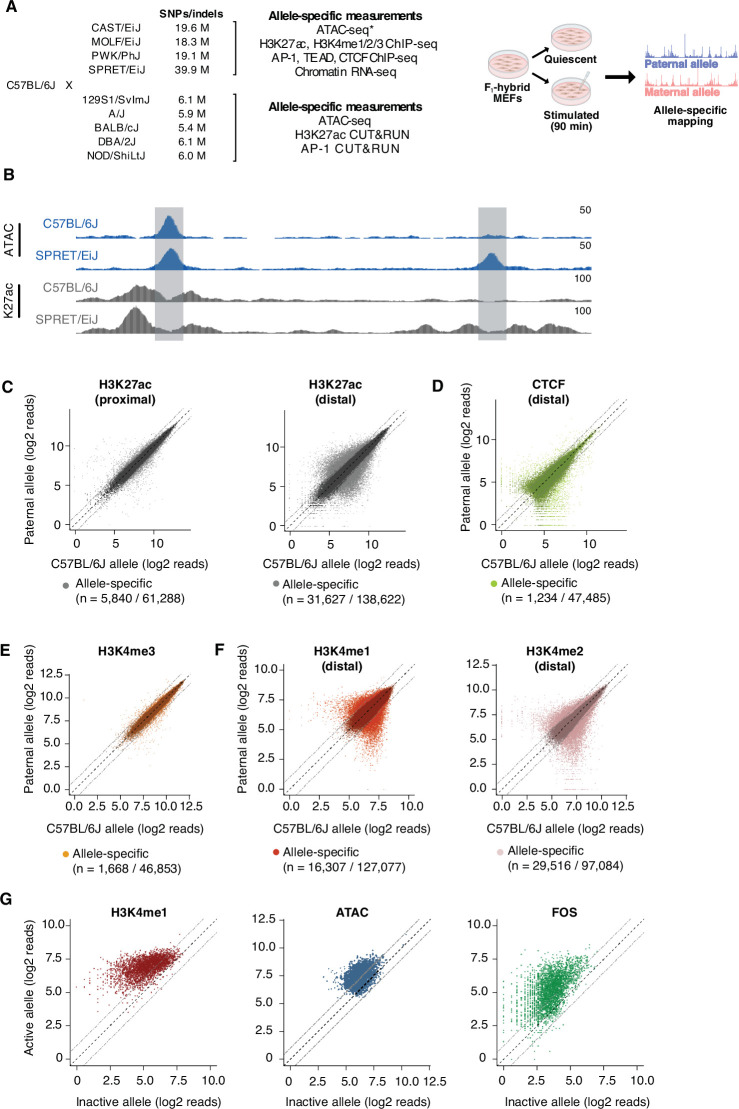
Figure 1. Allele-specific mapping of CREs and TF binding.
(A) F1-hybrid male MEFs were derived from crosses between female C57BL/6 J mice and male mice from a panel of inbred mouse strains. Experiments were performed in quiescent (0 min) and serum-stimulated (90 min) MEFs from at least two independent male embryos as biological replicates for each assay. Reads were mapped to either the maternal or paternal allele to quantify chromatin state and TF binding at CREs in an allele-specific manner. For wild-derived inbred strains, ATAC-seq data was generated using MEFs from corresponding parental lines and compared with chromatin accessibility in C57BL/6 J MEFs. Similarly, H3K27ac Hi-ChIP data was obtained only from starved and serum-stimulated MEFs from C57BL/6 J mice. All other genomic data indicated herein were obtained using MEFs derived from male F1-hybrid embryos. (B) Example genome browser track of a locus (chr5:147,587,473–147,599,697 in mm10 genome) with an allele-specific enhancer (indicated in gray, on the right) in C57BL/6 J x SPRET/EiJ F1-hybrid MEFs. Normalized read densities for ATAC-seq and H3K27ac ChIP-seq for each allele are shown. (C–F) Scatterplots of maternal (C57BL/6 J) and paternal allele-specific signal for histone modifications and CTCF binding (n=61,288 proximal H3K27ac, n=138,662 distal H3K27ac, n=47,485 distal CTCF, n=46,853 proximal H3K4me3, n=127,077 distal H3K4me1, and n=97,084 distal H3K4me2 allele pairs, respectively). Points indicated in light and dark colors represent peaks with and without a significant skew in signal between alleles, respectively (FDR <0.1 with DESeq2). CTCF and H3K4me3 levels were less likely to show an allele-specific skew in signal, in comparison with H3K27ac levels at active enhancers (Fisher’s exact test, p<2.2 x 10⁻¹⁶ for CTCF, p<2.2 x 10⁻¹⁶ for H3K4me3). (G) Scatterplot of allele-specific H3K4me1, ATAC-seq, and Fos binding signal at top decile of allele-specific enhancers, comparing signal from the active and inactive alleles (defined based on relative H3K27ac levels) to one another (n=13,862 allele pairs).


