

Abstract
The diurnal variation of photosynthesis, light response curve and CO2 response curve in Epimedium brevicornu Maxim leaves were determined with Li-6400 photosynthesis system to evaluate the photosynthesis of E. brevicornu. Fluorescence of chlorophyll in the leaves were determined with PAM-2500 portable chlorophyll fluorescence apparatus in the study. The results showed that the midday depression of photosynthesis was very obvious in the E. brevicornu leaves. The light compensation point of E. brevicornu leaves was about 15 µmol m−2 s−1. The light saturation point of E. brevicornu leaves was below 800 µmol m−2 s−1, which was lower than the general sunlight intensity at noon in summer. The CO2 saturation point of E. brevicornu leaves was much higher than the content of CO2 in general air. E. brevicornu was a typical shade plant and could survive in very low sunlight. E. brevicornu could not endure strong sunlight and high air temperature. The net photosynthetic rate of E. brevicornu leaves linearly correlated with the content of CO2 in the leaf chamber when the content was below CO2 saturation point. E. brevicornu possessed great potential of photosynthesis.
Subject terms: Ecology, Physiology
Introduction
As a kind of traditional Chinese medicine with aphrodisiac, anti-rheumatic and tonic effects, epimedii folium was usually used to cure impotence, emission, osteomalacia, rheumatism, apoplexy and so on1. Epimedii folium was dried leaves preparation from Epimedium brevicornu Maxim, E. pubescens Maxim, E. sagittatum (Sicb. et Zucc.) Maxim or E. koreanum Nakai1. There were some medicinal chemical components such as Icariin, Caohuoside, Baohuoside, Epimedin A, Epimedin B and Epimedin C in Epimedii folium2,3.
Epimedii folium came from wild resources in the past times. The wild Epimedii folium resources were sharply decreasing because of the increased demand on them and the change of environment. The plants in Epimedium are herbaceous perennial4. The root and the rhizome of these plants can grow for several years although their leaves wither in winter. The roots and rhizomes of these plants were usually dug out by people because there are certain content of medicinal chemical components in them. Therefore, Epimedii folium resources were seriously destroyed. To satisfy the needs of patient and protect wild Epimedii folium resources, the plants of Epimedii folium should be bred and cultivated.
The diurnal variation of photosynthesis, light response curve, CO2 response curve and chlorophyll fluorescence characteristics of E. brevicornu leaves were determined in this study to define the suitable growing conditions and provide evidence in support of cultivating E. brevicornu. The results contribute to studying the cultivation of E. brevicornu, satisfying the needs of patients on Epimedii folium and protecting the wild E. brevicornu resources.
Results
The results of the diurnal variation of photosynthesis in E. brevicornu leaves are shown in Table 1. The diurnal variation curve of photosynthesis in the leaves is drawn in Fig. 1.
Table 1.
Diurnal variations in Epimedium brevicornu leaves photosynthesis.
| Repeat | Time | Photo | PARi | Tleaf | CO2S | Trmmol | Cond | Ci |
|---|---|---|---|---|---|---|---|---|
| 1 | 7:12 | 0.0780 | 108.5 | 28.68 | 433.0 | 0.0433 | 0.000578 | 372.1 |
| 8:01 | 0.0931 | 176.8 | 31.67 | 433.0 | 0.0435 | 0.000153 | 371.0 | |
| 9:01 | 0.1888 | 628.7 | 33.24 | 433.1 | 0.0433 | 0.000578 | 201.7 | |
| 10:13 | 0.1070 | 1460.9 | 33.53 | 434.1 | 0.1344 | 0.001138 | 221.6 | |
| 11:04 | 0.0615 | 1578.3 | 35.16 | 427.0 | 0.1593 | 0.000865 | 218.2 | |
| 12:00 | 0.0377 | 1667.6 | 36.44 | 425.4 | 0.2048 | 0.001061 | 262.4 | |
| 13:15 | 0.0053 | 1598.9 | 37.25 | 421.2 | 0.2590 | 0.001659 | 323.1 | |
| 14:04 | 0.0276 | 1554.4 | 37.27 | 416.9 | 0.1860 | 0.001404 | 308.5 | |
| 15:00 | 0.0140 | 1446.8 | 36.39 | 415.3 | 0.0977 | 0.000652 | 295.7 | |
| 16:00 | 0.0752 | 1163.1 | 35.08 | 413.2 | 0.0487 | 0.000439 | 94.0 | |
| 17:00 | 0.1485 | 934.4 | 34.01 | 411.8 | 0.0586 | 0.000708 | 45.7 | |
| 18:00 | 0.1017 | 544.7 | 33.16 | 412.4 | 0.0353 | 0.000545 | 88.2 | |
| 19:00 | 0.0678 | 58.3 | 32.28 | 415.0 | 0.0367 | 0.000734 | 241.0 | |
| 2 | 7:12 | 0.0813 | 100.6 | 28.64 | 433.1 | 0.0415 | 0.000558 | 386.0 |
| 8:01 | 0.1014 | 180.7 | 31.65 | 433.0 | 0.0492 | 0.000223 | 373.3 | |
| 9:01 | 0.2082 | 589.5 | 33.26 | 433.0 | 0.0469 | 0.000596 | 171.4 | |
| 10:13 | 0.1086 | 1432.3 | 33.47 | 435.1 | 0.1358 | 0.000909 | 171.4 | |
| 11:04 | 0.0642 | 1578.4 | 35.17 | 427.0 | 0.1590 | 0.000864 | 213.7 | |
| 12:00 | 0.0400 | 1668.4 | 36.45 | 425.5 | 0.2057 | 0.001063 | 259.1 | |
| 13:15 | 0.0089 | 1555.1 | 37.23 | 421.0 | 0.2527 | 0.002035 | 338.5 | |
| 14:04 | 0.0376 | 1554.3 | 37.27 | 416.9 | 0.1857 | 0.001434 | 300.6 | |
| 15:00 | 0.0185 | 1349.0 | 36.51 | 414.5 | 0.0965 | 0.000773 | 304.4 | |
| 16:00 | 0.0779 | 1153.2 | 35.08 | 413.1 | 0.0512 | 0.000456 | 94.5 | |
| 17:00 | 0.1552 | 933.5 | 34.01 | 411.8 | 0.0599 | 0.000735 | 44.2 | |
| 18:00 | 0.1037 | 543.9 | 33.15 | 412.4 | 0.0356 | 0.000549 | 84.3 | |
| 19:00 | 0.0691 | 58.4 | 32.27 | 415.0 | 0.0363 | 0.000728 | 236.8 | |
| 3 | 7:12 | 0.0855 | 105.5 | 28.56 | 433.3 | 0.0363 | 0.000532 | 386.1 |
| 8:01 | 0.1086 | 178.8 | 31.65 | 433.0 | 0.0363 | 0.000202 | 371.2 | |
| 9:01 | 0.2234 | 591.9 | 33.26 | 433.0 | 0.0437 | 0.000556 | 220.4 | |
| 10:13 | 0.1122 | 1460.8 | 33.53 | 434.0 | 0.1333 | 0.001142 | 216.0 | |
| 11:04 | 0.0689 | 1634.3 | 35.59 | 425.6 | 0.1294 | 0.000783 | 201.7 | |
| 12:00 | 0.0488 | 1667.9 | 36.44 | 425.4 | 0.2057 | 0.001064 | 247.9 | |
| 13:15 | 0.0093 | 1598.9 | 37.25 | 421.2 | 0.2595 | 0.00165 | 319.0 | |
| 14:04 | 0.0432 | 1530.9 | 37.07 | 417.4 | 0.2176 | 0.001347 | 276.4 | |
| 15:00 | 0.0228 | 1397.9 | 36.32 | 414.8 | 0.0999 | 0.000889 | 308.7 | |
| 16:00 | 0.0859 | 1147.0 | 35.09 | 413.2 | 0.0517 | 0.000458 | 69.4 | |
| 17:00 | 0.1679 | 934.3 | 34.01 | 411.8 | 0.0584 | 0.000711 | 6.2 | |
| 18:00 | 0.1051 | 571.0 | 33.71 | 412.5 | 0.0390 | 0.000498 | 46.1 | |
| 19:00 | 0.0706 | 58.4 | 32.26 | 415.0 | 0.0368 | 0.000738 | 236.0 |
Photo, photosynthetic rate, unit: µmol CO2 m−2 s−1. PARi, in-chamber quantum sensor, unit: µmol m−2 s−1. Tleaf, temperature of leaf thermocouple, unit: °C. CO2S, sample cell CO2, unit: µmol mol−1. Trmmol, transpiration rate, unit: mmol H2O m−2 s−1. Cond, conductance to H2O, unit: mol H2O m−2 s−1. Ci, intercellular CO2 concentration, unit: μmol CO2 mol−1.
Figure 1.
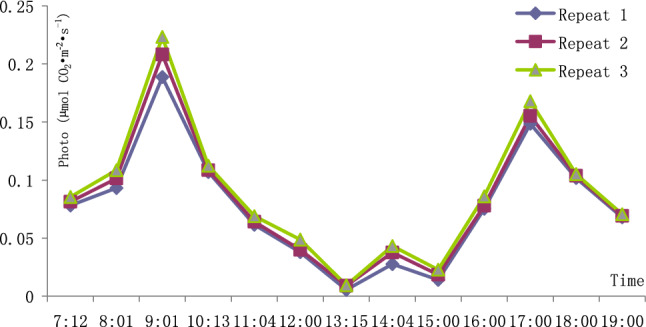
Diurnal variations in Epimedium brevicornu leaves photosynthesis.
There is obvious midday depression in the diurnal variation of photosynthesis of E. brevicornu leaves. They commonly photosynthesized in the morning and evening on sunny days in summer. The photosynthesis nearly stopped at noon when the air temperature was high and the sunlight was intense. E. brevicornu leaves did not endure the strong sunlight and high temperature.
The results of light response curves of photosynthesis in the leaves are shown in Tables 2 and 3. The fitted light response curve of photosynthesis in the leaves with the average fitted indexes in each repeat of light response curve determination is shown in Fig. 2.
Table 2.
Light response curves of Epimedium brevicornu leaves photosynthesis.
| Repeat | PARi | Photo | Fitted | CO2S | Trmmol | Tleaf | Cond | Ci |
|---|---|---|---|---|---|---|---|---|
| 1 | 2000.5 | 2.005 | 1.897 | 400.3 | 0.670 | 28.07 | 0.0496 | 326.6 |
| 1800.1 | 2.108 | 2.050 | 399.6 | 0.623 | 28.09 | 0.0450 | 315.6 | |
| 1498.9 | 2.147 | 2.272 | 400.2 | 0.640 | 27.93 | 0.0311 | 277.4 | |
| 1399.9 | 2.177 | 2.342 | 400.1 | 0.539 | 28.10 | 0.0380 | 299.3 | |
| 1001.2 | 2.684 | 2.600 | 399.5 | 0.491 | 28.12 | 0.0340 | 264.1 | |
| 801.5 | 2.705 | 2.702 | 400.2 | 0.454 | 27.96 | 0.0369 | 245.4 | |
| 600.8 | 2.736 | 2.765 | 399.8 | 0.442 | 28.14 | 0.0301 | 245.2 | |
| 399.6 | 2.699 | 2.738 | 400.3 | 0.416 | 28.14 | 0.0280 | 242.6 | |
| 199.7 | 2.570 | 2.419 | 399.8 | 0.396 | 28.14 | 0.0264 | 235.2 | |
| 150.8 | 2.250 | 2.205 | 399.3 | 0.405 | 28.14 | 0.0268 | 238.1 | |
| 100.6 | 1.825 | 1.833 | 400.1 | 0.387 | 28.15 | 0.0254 | 276.1 | |
| 49.6 | 0.925 | 1.092 | 399.9 | 0.400 | 28.15 | 0.0261 | 333.7 | |
| 20.5 | 0.341 | 0.266 | 400.7 | 0.373 | 28.15 | 0.0242 | 368.4 | |
| 2 | 2000.1 | 2.171 | 2.077 | 400.1 | 0.809 | 28.09 | 0.0543 | 326.2 |
| 1800.1 | 2.374 | 2.350 | 400.0 | 0.719 | 28.11 | 0.0477 | 297.1 | |
| 1499.9 | 2.720 | 2.713 | 399.6 | 0.678 | 28.12 | 0.0448 | 274.9 | |
| 1199.1 | 2.777 | 2.991 | 400.0 | 0.626 | 28.13 | 0.0411 | 284.3 | |
| 999.3 | 3.008 | 3.102 | 399.7 | 0.560 | 28.14 | 0.0364 | 257.9 | |
| 799.8 | 3.213 | 3.120 | 400.5 | 0.531 | 28.15 | 0.0345 | 280.7 | |
| 601.0 | 3.073 | 2.995 | 400.4 | 0.486 | 28.16 | 0.0314 | 255.4 | |
| 399.7 | 2.688 | 2.617 | 399.5 | 0.462 | 28.16 | 0.0299 | 267.7 | |
| 199.7 | 1.904 | 1.753 | 399.8 | 0.414 | 28.15 | 0.0269 | 277.0 | |
| 149.8 | 1.241 | 1.404 | 400.8 | 0.230 | 27.97 | 0.0072 | 330.0 | |
| 100.7 | 0.837 | 0.978 | 400.3 | 0.246 | 28.05 | 0.0117 | 334.3 | |
| 49.8 | 0.338 | 0.425 | 399.9 | 0.256 | 27.97 | 0.0123 | 285.6 | |
| 20.5 | 0.156 | 0.040 | 399.4 | 0.281 | 28.06 | 0.0133 | 335.2 | |
| 3 | 1999.9 | 0.952 | 0.898 | 484.7 | 0.944 | 28.79 | 0.0113 | 297.0 |
| 1800.6 | 1.226 | 1.201 | 483.3 | 0.964 | 28.20 | 0.0135 | 293.4 | |
| 1599.8 | 1.423 | 1.497 | 480.8 | 0.955 | 28.35 | 0.0158 | 298.1 | |
| 1400.8 | 1.751 | 1.779 | 477.7 | 0.925 | 27.84 | 0.0179 | 288.3 | |
| 1200.6 | 2.004 | 2.046 | 474.3 | 0.892 | 28.51 | 0.0202 | 287.0 | |
| 1001.2 | 2.230 | 2.286 | 471.3 | 0.822 | 28.29 | 0.0217 | 282.7 | |
| 800.5 | 2.570 | 2.485 | 468.6 | 0.751 | 28.13 | 0.0233 | 285.1 | |
| 600.7 | 2.676 | 2.607 | 465.8 | 0.678 | 28.01 | 0.0249 | 288.0 | |
| 399.7 | 2.493 | 2.571 | 463.7 | 0.713 | 28.24 | 0.0301 | 305.6 | |
| 200.2 | 2.164 | 2.109 | 463.1 | 0.779 | 27.87 | 0.0330 | 341.7 | |
| 149.6 | 1.823 | 1.825 | 462.3 | 0.793 | 27.55 | 0.0317 | 353.1 | |
| 99.5 | 1.420 | 1.398 | 461.4 | 0.751 | 28.16 | 0.0299 | 367.9 | |
| 49.7 | 0.617 | 0.725 | 461.2 | 0.702 | 28.26 | 0.0286 | 409.2 | |
| 20.8 | 0.195 | 0.136 | 458.8 | 0.523 | 28.11 | 0.0194 | 423.4 |
Photo, photosynthetic rate, unit: µmol CO2 m−2 s−1. PARi, in-chamber quantum sensor, unit: µmol m−2 s−1. Tleaf, temperature of leaf thermocouple, unit: °C. CO2S, sample cell CO2, unit: µmol mol−1. Trmmol, transpiration rate, unit: mmol H2O m−2 s−1. Cond, conductance to H2O, unit: mol H2O m−2 s−1. Ci, intercellular CO2 concentration, unit: μmol CO2 mol−1.
Table 3.
Results of fitting light response curves and CO2 response curves.
| Project | Repeat | E | M | N | LCP (CCP) | LSP (CSP) | E·LCP (E·CCP) | PLSP (PCSP) | R2 |
|---|---|---|---|---|---|---|---|---|---|
| Light response | 1 | 0.0536 | 0.000230 | 0.01465 | 14.017 | 534.52 | 0.751 | 2.771 | 0.979 |
| 2 | 0.01496 | 0.000304 | 0.002298 | 17.67 | 863.54 | 0.264 | 3.127 | 0.987 | |
| 3 | 0.0284 | 0.000389 | 0.00647 | 15.314 | 525.84 | 0.435 | 2.620 | 0.993 | |
| Average | 0.03232 | 0.000308 | 0.007806 | 15.667 | 641.30 | 0.483 | 2.839 | 0.986 | |
| CO2 response | 1 | 0.01113 | 0.000309 | 0.000001 | 35.56 | 1634.6 | 0.396 | 8.794 | 0.973 |
| 2 | 0.01011 | 0.0002707 | 0.000001 | 51.16 | 1871.0 | 0.517 | 9.063 | 0.982 | |
| 3 | 0.01049 | 0.000283 | 0.000001 | 58.72 | 1794.6 | 0.616 | 8.945 | 0.988 | |
| Average | 0.010577 | 0.000288 | 0.000001 | 48.48 | 1766.7 | 0.5097 | 8.934 | 0.981 |
LCP is light compensation point, unit: µmol m−2 s−1. CCP CO2 compensation point, unit: µmol mol−1. CSP is CO2 saturation point, unit: µmol mol−1. LSP is light saturation point, unit: µmol m−2 s−1. PLSP is the net photosynthetic rate at the light saturation point, unit: µmol m−2 s−1. PCSP is the net photosynthetic rate at the CO2 saturation point, unit: µmol m−2 s−1.
Figure 2.
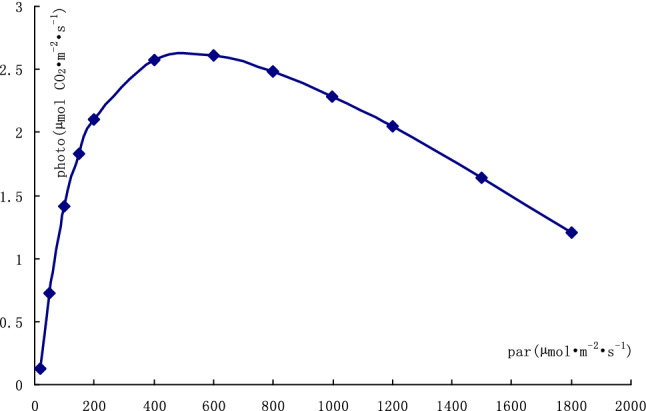
Fitted light response curve of Epimedium pubescens leaf photosynthesis with average indexes.
E. brevicornu leaves were able to survive in very low sunlight such as 15 µmol m−2 s−1. The photosynthesis in the leaves quickly increased along with the increase of light intensity when the light intensity was above the light compensation point. The light saturation point was much lower than the intensity of direct sunlight in summer. Strong sunlight inhibited the photosynthesis in E. brevicornu leaves.
The results of CO2 response curve of photosynthesis in the leaves are shown in Tables 3 and 4.
Table 4.
CO2 response curves of Epimedium pubescens leaves photosynthesis.
| Repeat | CO2S | Photo | Fitted | Trmmol | Tleaf | PARi | Cond | Ci |
|---|---|---|---|---|---|---|---|---|
| 2563.5 | 5.3565 | 5.834 | 1.043 | 28.09 | 1000.9 | 0.0488 | 2104.6 | |
| 1899.2 | 9.3139 | 8.553 | 0.894 | 28.13 | 1001.3 | 0.0411 | 1473.1 | |
| 1695.6 | 9.6047 | 8.781 | 0.923 | 28.14 | 1001.3 | 0.0426 | 1277.7 | |
| 1398.7 | 7.8518 | 8.603 | 0.971 | 28.24 | 1001.2 | 0.0445 | 1068.9 | |
| 1099.0 | 7.5999 | 7.808 | 1.012 | 28.07 | 1001.0 | 0.0474 | 825.9 | |
| 999.8 | 7.2034 | 7.409 | 1.012 | 28.18 | 1000.8 | 0.0468 | 720.1 | |
| 800.2 | 6.1402 | 6.401 | 1.038 | 28.24 | 1000.8 | 0.0478 | 567.8 | |
| 600.3 | 5.3804 | 5.117 | 1.020 | 28.06 | 1001.0 | 0.0479 | 400.5 | |
| 400.5 | 3.4728 | 3.558 | 0.966 | 28.17 | 1000.6 | 0.0447 | 262.8 | |
| 311.7 | 2.3457 | 2.777 | 0.908 | 28.13 | 1000.5 | 0.0420 | 212.2 | |
| 139.4 | 1.5264 | 1.106 | 0.325 | 29.06 | 1199.8 | 0.0112 | 80.5 | |
| 91.2 | 0.7625 | 0.602 | 0.856 | 29.55 | 1200.6 | 0.0185 | 20.9 | |
| 2 | 2567.3 | 7.3494 | 7.740 | 0.741 | 28.10 | 1000.4 | 0.0345 | 1987.4 |
| 1897.3 | 9.4502 | 9.061 | 0.667 | 28.11 | 1000.1 | 0.0309 | 1295.6 | |
| 1696.8 | 9.7506 | 8.980 | 0.682 | 28.11 | 1000.3 | 0.0316 | 1149.0 | |
| 1398.4 | 8.3402 | 8.453 | 0.690 | 28.09 | 1000.2 | 0.0321 | 937.5 | |
| 1099.3 | 7.4384 | 7.435 | 0.733 | 28.10 | 1000.3 | 0.0341 | 715.3 | |
| 1000.5 | 6.8615 | 6.991 | 0.712 | 28.09 | 1000.2 | 0.0332 | 637.9 | |
| 800.4 | 5.6185 | 5.929 | 0.720 | 28.09 | 1000.3 | 0.0336 | 507.4 | |
| 601.4 | 4.2436 | 4.654 | 0.697 | 28.09 | 1000.2 | 0.0325 | 373.7 | |
| 399.8 | 2.7830 | 3.142 | 0.641 | 28.08 | 1000.1 | 0.0298 | 238.1 | |
| 310.1 | 2.2032 | 2.397 | 1.014 | 28.22 | 1000.6 | 0.0468 | 224.3 | |
| 113.4 | 1.4361 | 0.610 | 0.322 | 28.00 | 1200.3 | 0.0111 | 95.2 | |
| 88.8 | 0.3868 | 0.371 | 0.920 | 27.89 | 1200.9 | 0.0561 | 75.4 | |
| 3 | 2564.2 | 6.6075 | 7.192 | 0.696 | 28.08 | 1000.3 | 0.0342 | 2016.5 |
| 1898.3 | 8.6724 | 8.913 | 0.609 | 28.09 | 1000.7 | 0.0477 | 1352.5 | |
| 1696.5 | 9.6606 | 8.917 | 0.585 | 28.09 | 1000.1 | 0.0325 | 1077.5 | |
| 1399.2 | 8.1282 | 8.482 | 0.698 | 28.10 | 1000.3 | 0.0324 | 952.8 | |
| 1099.7 | 7.3780 | 7.513 | 0.705 | 28.14 | 999.9 | 0.0303 | 805.4 | |
| 999.7 | 6.6075 | 7.071 | 0.676 | 28.04 | 1000.2 | 0.0388 | 685.7 | |
| 800.3 | 6.0660 | 6.012 | 1.040 | 28.17 | 1001.1 | 0.0483 | 572.3 | |
| 600.4 | 4.7405 | 4.714 | 1.028 | 28.18 | 1000.7 | 0.0476 | 421.0 | |
| 413.5 | 3.2650 | 3.285 | 1.003 | 28.14 | 1000.9 | 0.0466 | 287.5 | |
| 311.0 | 2.1327 | 2.413 | 0.974 | 28.14 | 1001.0 | 0.0452 | 225.0 | |
| 202.1 | 1.0168 | 1.418 | 0.866 | 28.13 | 1199.8 | 0.0340 | 146.6 | |
| 105.2 | 0.6105 | 0.473 | 0.750 | 28.03 | 1200.5 | 0.0199 | 51.2 | |
| 83.9 | 0.0484 | 0.323 | 0.992 | 28.75 | 1200.8 | 0.0324 | 77.5 |
Photo, photosynthetic rate, unit: µmol CO2 m−2 s−1. PARi, in-chamber quantum sensor, unit: µmol m−2 s−1. Tleaf, temperature of leaf thermocouple, unit: °C. CO2S, sample cell CO2, unit: µmol mol−1. Trmmol, transpiration rate, unit: mmol H2O m−2 s−1. Cond, conductance to H2O, unit: mol H2O m−2 s−1. Ci, intercellular CO2 concentration, unit: μmol CO2 mol−1.
The fitted CO2 response curve of photosynthesis with the average fitted indexes in each repeat of CO2 response curve determination is shown in Fig. 3.
Figure 3.
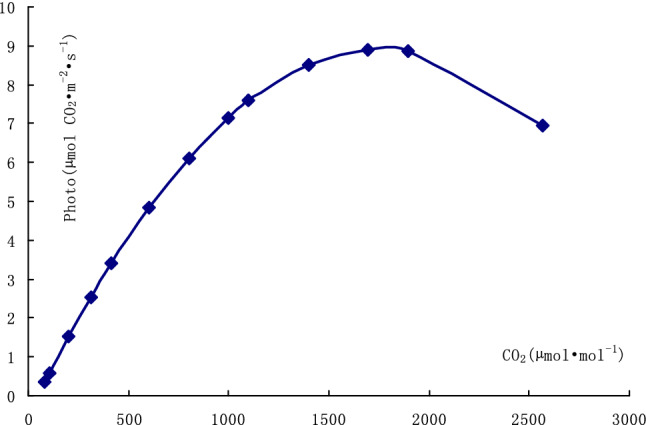
Fitted CO2 response curve of Epimedium pubescens leaf photosynthesis with average indexes.
The CO2 compensation point was about 48 µmol mol−1, which was much lower than the content of CO2 in air in field. The photosynthesis in E. brevicornu leaves was approximately linear to the content of CO2 in the leaf chamber. The CO2 saturation point the leaves was about 1766 µmol mol−1, which was much higher than the content of CO2 in air in field. E. brevicornu leaves possessed large potential of utilizing CO2 in photosynthesis. The CO2 with excessive content inhibited the photosynthesis in E. brevicornu leaves.
The results of slow kinetics of chlorophyll fluorescence in the leaves are shown in Table 5.
Table 5.
Slow kinetics and rapid light curves of chlorophyll fluorescence in Epimedium pubescens leaves.
| Repeat | Slow kinetics | |||||||||
|---|---|---|---|---|---|---|---|---|---|---|
| PAR | Y(II) | Y(NPQ) | Y(NO) | qN | qP | ETR | (Fm − Fo)/Fm | |||
| 1 | 198 | 0.124 | 0.62 | 0.256 | 0.879 | 0.5 | 10.3 | 0.5986 | ||
| 2 | 198 | 0.129 | 0.595 | 0.276 | 0.873 | 0.57 | 10.7 | 0.5630 | ||
| 3 | 198 | 0.137 | 0.565 | 0.298 | 0.851 | 0.568 | 11.4 | 0.5583 | ||
| Average | 198 | 0.13 | 0.593 | 0.2767 | 0.868 | 0.546 | 10.8 | 0.5733 | ||
| Repeat | Rapid light curves | |||||||||
|---|---|---|---|---|---|---|---|---|---|---|
| PAR | Y(II) | Y(NPQ) | Y(NO) | NPQ | qN | qP | qL | ETR | Fitted | |
| 1 | 0 | 0.573 | 0 | 0.427 | 0 | 0 | 1 | 1 | 0 | 0 |
| 6 | 0.36 | 0.264 | 0.376 | 0.701 | 0.559 | 0.837 | 0.745 | 0.9 | 0.503 | |
| 31 | 0.184 | 0.529 | 0.287 | 1.846 | 0.831 | 0.667 | 0.592 | 2.4 | 2.273 | |
| 101 | 0.124 | 0.585 | 0.292 | 2.005 | 0.843 | 0.459 | 0.383 | 5.3 | 5.502 | |
| 198 | 0.098 | 0.604 | 0.298 | 2.027 | 0.849 | 0.374 | 0.306 | 8.1 | 7.988 | |
| 363 | 0.066 | 0.626 | 0.308 | 2.034 | 0.856 | 0.265 | 0.213 | 10.1 | 10.244 | |
| 619 | 0.049 | 0.637 | 0.314 | 2.027 | 0.849 | 0.187 | 0.145 | 12.7 | 12.079 | |
| 981 | 0.032 | 0.648 | 0.32 | 2.027 | 0.853 | 0.125 | 0.096 | 13.1 | 13.603 | |
| 1386 | 0.02 | 0.657 | 0.323 | 2.034 | 0.856 | 0.078 | 0.06 | 14.4 | 14.839 | |
| 2015 | 0.015 | 0.664 | 0.321 | 2.064 | 0.856 | 0.059 | 0.045 | 16.6 | 16.497 | |
| 2970 | 0.015 | 0.665 | 0.32 | 2.08 | 0.862 | 0.061 | 0.047 | 18.6 | 19.070 | |
| 3588 | 0.015 | 0.666 | 0.319 | 2.087 | 0.858 | 0.059 | 0.045 | 22.5 | 20.978 | |
| 4292 | 0.013 | 0.672 | 0.315 | 2.134 | 0.873 | 0.056 | 0.043 | 22.8 | 23.547 | |
| 2 | 0 | 0.562 | 0 | 0.438 | 0 | 0 | 1 | 1 | 0 | 0.00 |
| 6 | 0.325 | 0.268 | 0.407 | 0.659 | 0.555 | 0.783 | 0.679 | 0.8 | 0.279 | |
| 31 | 0.165 | 0.544 | 0.291 | 1.87 | 0.849 | 0.68 | 0.617 | 2.2 | 1.371 | |
| 101 | 0.111 | 0.602 | 0.286 | 2.103 | 0.869 | 0.488 | 0.424 | 4.7 | 3.914 | |
| 198 | 0.087 | 0.62 | 0.293 | 2.111 | 0.869 | 0.381 | 0.322 | 7.2 | 6.554 | |
| 363 | 0.063 | 0.639 | 0.298 | 2.146 | 0.868 | 0.271 | 0.221 | 9.6 | 9.638 | |
| 619 | 0.044 | 0.653 | 0.303 | 2.154 | 0.877 | 0.203 | 0.166 | 11.5 | 12.601 | |
| 981 | 0.033 | 0.661 | 0.306 | 2.163 | 0.871 | 0.145 | 0.115 | 13.7 | 15.066 | |
| 1386 | 0.03 | 0.664 | 0.306 | 2.172 | 0.871 | 0.133 | 0.105 | 17.7 | 16.760 | |
| 2015 | 0.019 | 0.673 | 0.307 | 2.189 | 0.88 | 0.091 | 0.073 | 18.5 | 18.422 | |
| 2970 | 0.017 | 0.677 | 0.306 | 2.216 | 0.883 | 0.08 | 0.064 | 21 | 20.011 | |
| 3588 | 0.014 | 0.681 | 0.305 | 2.234 | 0.883 | 0.067 | 0.053 | 21.3 | 20.772 | |
| 4292 | 0.011 | 0.685 | 0.304 | 2.253 | 0.886 | 0.055 | 0.044 | 20.5 | 21.510 | |
| 3 | 0 | 0.538 | 0 | 0.462 | 0 | 0 | 1 | 1 | 0 | 0.00 |
| 6 | 0.376 | 0.154 | 0.47 | 0.327 | 0.342 | 0.801 | 0.681 | 0.9 | 0.579 | |
| 31 | 0.209 | 0.466 | 0.325 | 1.433 | 0.775 | 0.709 | 0.633 | 2.7 | 2.621 | |
| 101 | 0.139 | 0.553 | 0.308 | 1.792 | 0.837 | 0.565 | 0.495 | 5.9 | 6.348 | |
| 198 | 0.106 | 0.58 | 0.314 | 1.85 | 0.84 | 0.434 | 0.366 | 8.8 | 9.204 | |
| 363 | 0.083 | 0.595 | 0.322 | 1.85 | 0.838 | 0.333 | 0.273 | 12.6 | 11.756 | |
| 619 | 0.057 | 0.615 | 0.328 | 1.875 | 0.852 | 0.247 | 0.202 | 14.3 | 13.755 | |
| 981 | 0.036 | 0.632 | 0.332 | 1.901 | 0.848 | 0.152 | 0.12 | 14.8 | 15.296 | |
| 1386 | 0.039 | 0.629 | 0.332 | 1.892 | 0.848 | 0.165 | 0.131 | 16.1 | 16.428 | |
| 2015 | 0.021 | 0.643 | 0.335 | 1.918 | 0.863 | 0.099 | 0.079 | 17.9 | 17.777 | |
| 2970 | 0.015 | 0.649 | 0.335 | 1.936 | 0.869 | 0.074 | 0.059 | 19 | 19.583 | |
| 3588 | 0.014 | 0.284 | 0.702 | 0.405 | 0.456 | 0.078 | 0.065 | 21.5 | 20.764 | |
| 4292 | 0.012 | 0.652 | 0.335 | 1.945 | 0.867 | 0.058 | 0.046 | 22 | 22.196 | |
Unit of PAR: µmol m−2 s−1. Unit of ETR: μmol m−2 s−1.
The slow kinetics of chlorophyll fluorescence of E. brevicornu leaves indicates that the maximal photochemical efficiency of photosystem II ((Fm − Fo)/Fm) and the ETR of photosystem II in them were all very low.
The fraction of energy dissipated as heat via the regulated photoprotective NPQ mechanism (Y(NPQ)) was much more than that passively dissipated in the form of heat and fluorescence (Y(NO)).
The results of rapid light curves of chlorophyll fluorescence in E. brevicornu leaves are shown in Tables 5 and 6. The fitted rapid light curve of chlorophyll fluorescence with the average fitted indexes in each repeat of rapid light curve is shown in Fig. 4.
Table 6.
Results of fitting rapid light curves of chlorophyll fluorescence in Epimedium pubescens leaves.
| Index | Repeat | Average | ||
|---|---|---|---|---|
| 1 | 2 | 3 | ||
| fv/fm × ETR factor/2 | 0.241 | 0.236 | 0.226 | 0.2343 |
| Alpha | 0.043 | 0.046 | 0.06 | 0.0497 |
| ETRmax | 21.4 | 19.4 | 25.8 | 22.2 |
| Ik | 493.1 | 425.6 | 427.2 | 448.63 |
| (Fm − Fo)/Fm | 0.5727 | 0.5616 | 0.5383 | 0.5575 |
| A | −0.000006637 | −0.0000009711 | −0.000003762 | −0.00000379 |
| B | 0.06827 | 0.04571 | 0.05887 | 0.0576 |
| C | 11.5297 | 21.197 | 10.0040 | 14.24 |
| R2 | 0.993 | 0.987 | 0.952 | 0.977 |
fv/fm × ETR factor/2 is the maximum quantum yield of photosynthetic system II with a saturated pulse after dark adaptation. Alpha is the initial slope. ETRmax is the maximum electron transport rate. Ik is the minimum saturation of the light intensity.
Figure 4.
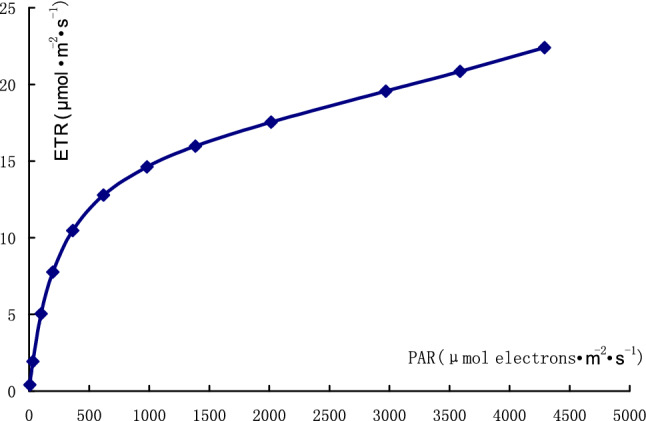
Fitted rapid light curve of chlorophyll fluorescence in Epimedium pubescens leaf with average indexes.
The fitted maximum electron transport rate in the leaves reached 22.2 μmol m−2 s−1, which was much higher than ETR of photosystem II in slow kinetics of chlorophyll fluorescence. The leaves possessed large potential of photosynthesis.
Discussion and conclusion
There was obvious midday depression in the photosynthesis of E. brevicornu leaves. The photosynthesis nearly stopped at noon when the direct sunlight was intense. Therefore, E. brevicornu could not endure strong sunlight and high air temperature. There was obvious midday depression in the photosynthesis of E. pseudowushannense also5,6. The midday depression in the photosynthesis of E. brevicornu leaves was related to sunlight and air temperature7. The net photosynthetic rate of E. brevicornu leaves significantly reduced when the sunlight intensity was above 1000 µmol m−2 s−1. There was little variation in sunlight intensity from 11:00 to 14:00 in summer. The net photosynthetic rates of E. brevicornu leaves was the lowest at 13:00 in summer because the air temperature was the highest at this time. The light compensation point of the leaves was about 15 µmol m−2 s−1, which indicated that E. brevicornu could survive in very low sunlight. The study of Liu et al. showed that the light compensation point of E. sagittatum (Sieb. & Zucc.) Maxim leaves was 13–17 µmol m−2 s−18, which was consistent with the result in this study. The result of WANG et al. that the light compensation point of E. sagittatum was about 3.6 µmol m−2 s−1 seemed not reasonable9. The light saturation point in the light response curve of E. brevicornu leaves was lower than general sunlight intensity at noon in summer. Wild E. brevicornu grew in forests or shady slope and was rarely seen in the open places in general. Therefore, E. brevicornu is a typical shade plant. Luo et al. studied the characteristics of photosynthesis in E. koreanum Nakai and found that the photosynthetic rate was the highest in 70% light transmittance10. E. brevicornu should be properly shaded when cultivated.
It was indicated in CO2 response curve in E. brevicornu leaves that the CO2 saturation point was about 1766 µmol mol−1, which was much higher than the content of CO2 in general air. Therefore, E. brevicornu is characteristic of C3 plant. The net photosynthetic rate of E. brevicornu leaves was linearly correlated with the content of CO2 in air when the leaf chamber when it was below CO2 saturation point. This is consistent with the study of Wang Xujun on E. sagittatum9. The results indicated that there was very great potential to utilize CO2 in E. brevicornu.
The characteristics of chlorophyll fluorescence in E. brevicornu showed that it possessed great potential of photosynthesis. It is prospective to breed a new breed with high photosynthetic rate and yield.
Materials and methods
All methods were performed in accordance with the local relevant guidelines, regulations and legislation.
Instruments
LI-6400 photosynthesis system (LI-6400 Inc., Lincoln, NE, USA) and PAM-2500 portable chlorophyll fluorescence apparatus (PAM-2500, Walz, Germany) were used in the study.
Materials
About 90 living E. brevicornu plants were collected from Taihang Mountains in October 2018. The E. brevicornu was not in endangered or protected. The collection of these E. brevicornu plants was permitted by local government. These plants were averagely planted in nine plots of 2 m2. The roots of E. pubescens were planted 6–8 cm below ground. These plots were placed on farmland near Taihang Mountains and covered with sunshade net (about 70% light transmittance). These plants were timely irrigated after planting to ensure that they grew well but not fertilized.
Determination of photosynthetic characteristics
The photosynthetic characteristics of mature leaves on the E. brevicornu plants were determined between June 6–8, 2019 with the Li-6400 photosynthesis system. The diurnal variation of photosynthesis in three leaves of three plants was determined. When the light response curve was determined, the temperature of the leaf chamber was set at 28 °C, and the concentration of CO2 in the leaf chamber was set at 400 µmol mol−1. When determining the CO2 response curve, the light intensity in the leaf chamber was set at 1000 µmol m−2 s−1, and the temperature of the leaf chamber was set at 28 °C. The light response curve and CO2 response curve were determined three times in three leaves of three different plants.
Determination of chlorophyll fluorescence characteristics
The fluorescence characteristics of chlorophyll in E. brevicornu leaves were determined with PAM-2500 portable chlorophyll fluorescence apparatus between June 8–9, 2019. The leaves underwent dark adaptation for 30 min before determining slow kinetics of chlorophyll fluorescence. Then the light curves of chlorophyll fluorescence were determined. All of these determinations were repeated three times on three mature leaves of three plants.
The data was analysed with SPSS (Statistical Product and Service Solutions, International Business Machines Corporation, USA). The light response curves were fitted with following modified rectangular hyperbola model11,12.
PAR is the value of light intensity in leaf chamber of Li-6400 photosynthesis system. Photo is net photosynthetic rate. LCP is the light compensation point. E is the apparent quantum yield. M and N are parameters. The dark respiration rate under the LCP is calculated according to E·LCP. The light saturation point (LSP) is calculated according to (((M + N) ·(1 + N·LCP)/M)½)/−1)/N.
The net photosynthetic rate under the light saturation point (LSP) can be calculated according to the above model.
The CO2 response curves were fitted with below modified rectangular hyperbola model11,12.
PAR is the value of light intensity in leaf chamber of Li-6400 photosynthesis system. Photo is net photosynthetic rate. CCP is CO2 compensation point. E is also the apparent quantum yield. M and N are parameters. The dark respiration rate under the CO2 calculated according to E·CCP. The CO2 saturation point (CSP) is calculated according to (((M + N) ·(1 + N·CCP)/M)½)/−1)/N.
The net photosynthetic rate under the CO2 saturation point (CSP) can be alternatively calculated according to the above model.
The light curves of chlorophyll fluorescence were fitted according to the below model of Eilers and Peeters12,13.
ETR is the electron transport rate of photosynthetic system II. PAR is fluorescence intensity. The letters a, b and c are parameters.
Author contributions
J.Z. Designed the study, implemented the experiment and wrote the manuscript. T.X. Participated in the experiment and data analysis. W.H. Participate in the experiment. X.G. Participate in the data analysis.
Data availability
Data have been permanently archived: https://zenodo.org/record/4106097#.X41VfNSF7Gg.
Competing interests
The authors declare no competing interests.
Footnotes
Publisher's note
Springer Nature remains neutral with regard to jurisdictional claims in published maps and institutional affiliations.
References
- 1.Chinese Pharmacopoeia Committee . Chinese Pharmacopoeia. 2020. Chemical industry Press; 2022. p. 340. [Google Scholar]
- 2.Yu-bo L, Fan-hao M, Xiu-mei L, Fa-mei L. Chemical constituents from herb of Epimedium brevicornum. China J. Chin. Mater. Med. 2005;30(8):586–588. [PubMed] [Google Scholar]
- 3.Ning, M., Kai, K., Shi-weng, L. Advances in studies on chemical constituents and pharmaceutical activities in species of Epimedium. Acta Bot. Borea1-Occident. Sin.30(5), 1063–1073 (2010).
- 4.Flora of China Committee. Flora of China Vol. 27. 296–299 (Science Press, 1979).
- 5.Xiaohong, G., Junqian, P., Xiangbo, Y., Zhihai, J., Li, L., Fei, G., & Baolin, G. Research on photosynthetic and eco-physiological characteristics of Epimedium pseudowushannense in different growing age. China J. Chin. Mater. Med.41(12), 2183–2189 (2016). [DOI] [PubMed]
- 6.Junqian, P., Xiaohong, G., & Baolin, G. Two Epimedium species: Diurnal variation of photosynthesis. J. Agric.7(4), 51–57 (2017).
- 7.Jinling L. Photosynthetic characteristics of Epimedium acuminatum Franch. Guizhou Agric. Sci. 2008;36(5):31–33. [Google Scholar]
- 8.Ju-lian, L., Fei-ying, Y., Guo-hua, J., You-jin, H., & Jian-yu, Z. Response of Epimedium sagittatum leaf to illumination. J. Zhejiang For. Sci. Tech. 35(2), 27–31 (2015).
- 9.Xujun W, Yurong Z, Zhanshuo C, Yulong X. Photosynthetic characteristics of Epimedium sagittatum. Hunan For. Sci. Technol. 2018;45(1):22–27. [Google Scholar]
- 10.Yan L, Yonggang Z, Limin Y, Yunliang H, Mei H. Effect of light intensity on growth, photosynthetic and fluorescence characteristics of Epimedium koreanum Nakai. J. Northeast For. Univ. 2018;46(7):44–48. [Google Scholar]
- 11.Zp Y. Application of light-response model in estimating the photosynthesis of super-hybrid rice combi nation-II Youming 86. Chin. J. Ecol. 2007;26(8):1323–1326. [Google Scholar]
- 12.Zai-You J, Wen-Quan W, Li M, Gui-Fang X, Qiu-Ling W, Wei-Dong L, JingBo Y. Comparison of photosynthetic and fluorescence characteristics among taxa in Paeonia sect, Paeonia. Chin. J. Plant Ecol. 2010;34(12):1463–1471. [Google Scholar]
- 13.Eilers PHC, Peeters JCH. A model for the relationship between light intensity and the rate of photosynthesis in phytoplankton. Ecol. Model. 1988;42:199–215. doi: 10.1016/0304-3800(88)90057-9. [DOI] [Google Scholar]
Associated Data
This section collects any data citations, data availability statements, or supplementary materials included in this article.
Data Availability Statement
Data have been permanently archived: https://zenodo.org/record/4106097#.X41VfNSF7Gg.