

Abstract
Background
Circulating tumor DNA (ctDNA) has made a breakthrough as an early biomarker in operable early‐stage cancer patients. However, the function of ctDNA combined with cell‐free DNA (cfDNA) as a predictor in advanced non‐small cell lung cancer (NSCLC) remains unknown. Here, we explored its potential as a biomarker for predicting the efficacy of epidermal growth factor receptor tyrosine kinase inhibitors (EGFR‐TKIs) in patients with advanced NSCLC.
Methods
A retrospective analysis was undertaken. Plasma collected from 51 patients with advanced NSCLC prior to and serially after starting treatment with EGFR‐TKIs was analyzed by next‐generation sequencing (NGS). The performance of ctDNA, cfDNA, and combining ctDNA with cfDNA were evaluated for their ability to predict survival outcomes.
Results
Patients with early undetectable ctDNA and increasing cfDNA had a markedly better progression‐free survival (PFS) (p < 0.001) and overall survival (OS) (p = 0.001) than those with early detectable ctDNA and decreasing cfDNA. Patients with early ctDNA clearance were more likely to have the ctDNA persistent clearance (p = 0.006). The early clearance rate of ctDNA in the normal carcinoembryonic antigen (CEA) group was significantly higher than in the low and high groups (p = 0.028). Patients with greater CEA decline had a higher early clearance rate of ctDNA than those with minor CEA change (p = 0.016).
Conclusions
We based this study on ctDNA and cfDNA, explored its prognostic predictive ability, and combined CEA to monitor EGFR‐TKI efficacy. This study may provide new perspectives and insights into the precise treatment strategies for NSCLC patients.
Keywords: non‐small cell lung cancer, epidermal growth factor receptor tyrosine kinase inhibitors, circulating tumor DNA , cell‐free DNA, carcinoembryonic antigen
The predictive model based on ctDNA and cfDNA showed four different types of prognoses of patients. The best curative effect was patients with an early ctDNA clearance combined with cfDNA increased, and the worst was patients without an early ctDNA clearance combined with cfDNA decreased. Our findings confirmed that CEA has a certain correlation with ctDNA. Combination monitoring of CEA and ctDNA may provide a convenient and feasible way to observe drug effects for patients on drug holidays.
INTRODUCTION
Molecular targeted therapy has been reported to have an excellent outcome for driver gene mutant advanced non‐small cell lung cancer (NSCLC) patients, 1 , 2 , 3 but the effectiveness is greatly different among patients. 4 , 5 , 6 , 7 How to achieve efficacy stratification is important for implementing individualized precision treatment and prolonging the overall survival. Radiological imaging fails to reflect clonal evolution at the molecular level timely. 8 , 9 The rapid development of circulating tumor DNA‐molecular residual disease (ctDNA‐MRD) has made it possible to realize this. 10 , 11 , 12 At present, ctDNA‐MRD is widely used in treating early‐operable cancer patients. Some studies have found that ctDNA detection after operation provides direct evidence of identifying patients with MRD and a higher risk of recurrence than undetectable ctDNA in operable early‐stage patients. 13 , 14 , 15 , 16 Another recent study found that the accurate MRD can be defined by blood ctDNA methylation or combined ctDNA mutation. 17 However, the potential of ctDNA‐MRD in advanced NSCLC is to be further developed. Because of the high content of nontumor‐derived DNA in blood, the proportion of ctDNA in plasma is always low in the vast majority of patients. 18 In particular, some advanced NSCLC patients exhibited clearance of ctDNA after using epidermal growth factor receptor tyrosine kinase inhibitors (EGFR‐TKIs). The abundance of ctDNA was too low to be detected by next‐generation sequencing (NGS), which dramatically challenged the test's sensitivity and accuracy. The efficacy evaluation of EGFR‐TKIs based on ctDNA clearance will lead to false‐negative and inaccurate results.
Cell‐free DNA (cfDNA) constitutes short DNA fragments released into the bloods‐stream via apoptosis, necrosis, and active secretion, which carry genome‐wide sequence information. 19 , 20 , 21 Previous studies found that higher cfDNA in NSCLC patients was associated with worse progression‐free survival (PFS) and overall survival (OS). 22 It has been found that higher cfDNA heralds a higher likelihood of bone/liver metastasis and more advanced M stages. 8 Another analysis shows that decreased ctDNA/cfDNA ratio was associated with a good prognosis in NSCLC patients. 23 However, the ratio change cannot reflect the impact of the dynamic process on the efficacy of EGFR‐TKIs in detail. To the best of our knowledge, there has been no report on the efficacy prediction guided by the kinetics of ctDNA and cfDNA. In this study, we reported the early dynamic changes of ctDNA combined with cfDNA during EGFR‐TKI treatment in advanced NSCLC patients. We explored the possibility of (ctDNA and cfDNA)‐MRD model as a biomarker for precisely predicting the efficacy of EGFR‐TKIs.
METHODS
Study population
Clinical data were reviewed retrospectively from medical records. Patients with advanced NSCLC harboring a driver mutation in EGFR were treated with EGFR‐TKIs, whether first‐line or posterior line therapy, in Daping Hospital (Chongqing, China) between July 2016 and September 2021 and had at least one early dynamic plasma ctDNA test after EGFR‐TKI treatment. The study was approved by the Ethics Committee for Human Study (Chongqing, China) in Daping Hospital of Army Medical University (approval no. 2020–117). This research was performed in accordance with ethical principles in the Declaration of Helsinki and will not affect future patient management.
Plasma response analysis
All patients participated in a charity project supported by Burning Rock Company, the “COMPASS” plan. 8 Patients are only required to pay for the first genetic test, and they can receive another six genetic tests free of charge during follow‐up treatment. A total of 51 patients with available data had at least one early test of plasma ctDNA and were recruited for plasma response analysis. Eligibility included detection of EGFR driver mutation by NGS at pretreatment baseline, and the availability of two subsequent plasma draws (at cycle 1 and 2; within 2–4 months and ≥4 months). Plasma ctDNA change was defined as the percent change of ctDNA amount between consecutive timepoints after starting therapy. Plasma ctDNA early change was defined as the percent change of ctDNA amount between baseline and cycle 1. ctDNA amount was obtained by maximum mutant allele frequency (MAF) in ctDNA multiplied by cfDNA amount measured directly, which was based on the previously reported in the literature. 8 , 23 , 24 All 51 eligible subjects had metrics for early ctDNA change between baseline and cycle 1, and 21 subjects had subsequent ctDNA change between cycle 1 and 2. All the patients had an effective response to EGFR‐TKIs throughout the dynamic monitoring.
Sample processing and NGS analysis
Blood samples were collected in K3EDTA‐containing tubes (Cell‐Free DNA BCT) and centrifuged at 2000 g at 4°C for 10 min within 72 h of their collection. The carefully aspirated plasma supernatant was transferred into fresh 15 ml centrifuge tubes without disturbing the buffy coat layer. The plasma samples were centrifuged at 16000 g for 10 min, and then the supernatant was removed to a new tube without disturbing the pellet. The plasma was stored at −80°C until further analysis. cfDNA was recovered from 4 to 5 ml of the plasma samples using the QIAamp circulating nucleic acid kit according to the manufacturer's standard protocol (Qiagen). cfDNA was quantified using the Qubit 2.0 Fluorometer with dsDNA HS assay kits (Life Technologies). The starting material for subsequent testing consisted of 50 ng cfDNA prepared by the Qiagen method. DNA was profiled using a commercially available capture‐based sequencing panel. Indexed samples were subjected to capture‐based targeted sequencing using a panel consisting of 168 lung cancer‐related genes. 25 , 26 DNA was hybridized with the capture probe baits, selected with magnetic beads, and amplified by polymerase chain reaction (PCR). A bioanalyzer high sensitivity DNA assay was then used to assess the quality and size range, and 30 indexed samples were sequenced onto a NextSeq 500 (Illumina, Inc.) with pair‐end reads.
Clinical outcomes
Fifty‐one patients were followed up regularly after receiving treatment with EGFR‐TKIs, assessed typically every 2 months with physical examination, tumor marker testing, and imaging. Complete response (CR), partial response (PR), stable disease (SD), progressive disease (PD), objective response rate (ORR), and PFS were determined using Response Evaluation Criteria in Solid Tumors (RECIST) version 1.1 by a respiratory physician. PFS was defined as the time from the start of EGFR‐TKIs to progression, death, or censoring. OS was defined as the time from the beginning of EGFR‐TKIs to death or censoring.
Statistical analysis
Descriptive statistics such as median, range (min to max), mean, frequencies, and percentages were used for the baseline demographic characteristics. The graphs were made using the GraphPad 8 software, and the descriptive statistics and statistical tests were conducted using the SPSS software (version 20). Characteristics were analyzed using the Chi‐squared test and Fishers' exact test. Continuous variables were analyzed using the t‐test. Log‐rank test and Cox's proportional hazard regression model were conducted for univariate and multivariate survival analyses. The cutoff value was calculated by the X‐Tile tool. Differences were defined as significant at p < 0.05.
RESULTS
Patient characteristics
A total of 245 patients with advanced NSCLC harboring a driver mutation in EGFR by plasma NGS testing received EGFR‐TKI treatment after pathological diagnosis in our department from July 2016 to September 2021. A total of 183 patients without dynamic plasma ctDNA testing following targeted therapy were excluded. We enrolled 51 patients with baseline ctDNA and at least one early dynamic plasma ctDNA test after EGFR‐TKI treatment (Figure 1).
FIGURE 1.

Study flow chart. NSCLC, non‐small cell lung cancer; EGFR‐TKIs, epidermal growth factor receptor‐tyrosine kinase inhibitors; NGS, next generation sequencing; ctDNA, circulating tumor DNA.
Table 1 showed the baseline characteristics of 51 patients. Their mean age was 60.8 (range: 39–81). The proportion of men and women was similar. Most were never smokers (37, 72.5%). The pathological diagnoses were all adenocarcinoma, and the majority (94.1%) of the clinical stages were stage IV. A total of eight (15.7%) patients had brain metastases, 28 (54.9%) patients had bone metastases, and 10 (19.6%) patients had pleural effusion. 49 (96.1%) patients had a performance status (PS) of 0–1. The median tumor size (sum of target lesion diameters) was 3.6 cm (range 0.7–12.2 cm). Among all 51 patients, 39 patients exhibited abnormal serum carcinoembryonic antigen (CEA) levels (>5.0 ng/ml), while the other 12 patients exhibited normal serum CEA levels (≤5.0 ng/ml). A total of 21 patients received osimertinib (9.8%), gefitinib (23.5%), or icotinib (7.8%), respectively, as the first‐line therapy and 30 patients received the second‐line osimertinib.
TABLE 1.
Clinical characteristics of patients
| Age (years) | n | 51 |
|---|---|---|
| Mean | 60.8 | |
| SD | 9.7 | |
| Min | 39 | |
| Max | 81 | |
| Sex, n (%) | Male | 25 (49.0) |
| Female | 26 (51.0) | |
| Smoking status, n (%) | Yes | 14 (27.5) |
| No | 37 (72.5) | |
| PS, n (%) | 0 | 32 (62.8) |
| 1 | 17 (33.3) | |
| 2 | 2 (3.9) | |
| Disease stage, n (%) | IV | 48 (94.1) |
| IIIb | 3 (5.9) | |
| Malignant pleural effusion, n (%) | Yes | 10 (19.6) |
| No | 41 (80.4) | |
| Brain metastasis, n (%) | Yes | 8 (15.7) |
| No | 43 (84.3) | |
| Bone metastases, n (%) | Yes | 28 (54.9) |
| No | 23 (45.1) | |
| Tumor size (cm) | Median | 3.6 |
| Min | 0.7 | |
| Max | 12.2 | |
| CEA, n (%) | ≤5.00 ng/ml | 12 (23.5) |
| >5.00 ng/ml | 39 (76.5) | |
| First‐line treatment of EGFR‐TKIs, n (%) | Osimertinib | 5 (9.8) |
| Gefitinib | 12 (23.5) | |
| Icotinib | 4 (7.8) | |
| Posterior treatment of EGFR‐TKIs, n (%) | Osimertinib | 30 (58.8) |
Abbreviations: CEA, carcinoembryonic antigen; EGFR‐TKIs, epidermal growth factor receptor‐tyrosine kinase inhibitors; PS, performance status.
Baseline plasma ctDNA status of NSCLC and kinetics of early plasma response
A total of 123 dynamic plasma samples were collected from 51 recipients. Among 51 patients with the baseline and early subsequent ctDNA assessment, 21 had the baseline, cycle 1, and cycle 2 data. At baseline, we identified 130 aberrations spanning 34 genes. Somatic mutations detected in plasma ctDNA were primarily point mutations (120, 92.3%), whereas the rest nine copy number variations (CNVs) and one gene fusion only contributed to a small proportion (7.7%) (Figure S1). All patients had EGFR‐TKI sensitive mutations and other frequently mutated driver genes, including TP53 (35%), PIK3CA (10%), CDKN2A (4%), ARID1A (4%), PRKDC (4%), BRCA1 (4%), CCND1 (4%), RB1 (4%), JAK2 (4%), and KRAS (4%). The overview of the mutation spectrum was shown in Figure 2a. We provided an overview of the dynamic change scatters plot of the maximum MAF in ctDNA. The median maximum MAF in ctDNA at baseline, cycle 1 and cycle 2 were 1.4% (range: 0.1%–62.9%), 0 (range: 0%–46.4%), and 0 (range: 0%–33.8%), respectively (Figure 2b). We further evaluated the change of cfDNA amounts determined by Qubit. The median cfDNA amounts of baseline, cycle 1 and cycle 2 were 50.0 ng/ml (range: 17.0–493.0 ng/ml), 41.0 ng/ml (range: 18.0–172.0 ng/ml), and 39.0 ng/ml (range: 22.0–154.0 ng/ml), respectively (Figure 2c). In 20 of the 51 patients, the cfDNA increased, whereas the remaining (31/51) cfDNA decreased from baseline to cycle 1 (Figure 2c). Next, we derived the corresponding ctDNA content of each sample by multiplying the cfDNA amounts by the maximum MAF obtained from the mutation profile of the ctDNA. The ctDNA content from baseline to cycle 2 were 0.7 ng/ml (range: 0–55.4 ng/ml), 0 ng/ml (range: 0–29.7 ng/ml), and 0 ng/ml (range: 0–52.1 ng/ml), respectively. A total of 58.8% (30/51) of patients had an early clearance of ctDNA, while 41.2% (21/51) of patients' ctDNA were still positive at cycle 1 (Figure 2d). In addition, we found that 21 patients had a repeated test at cycle 2. Of the 16 people who tested negative at cycle 1, 12 patients also tested negative at cycle 2. However, five out of 21 patients without a ctDNA clearance at cycle 1 were still positive at cycle 2. Namely, patients with an early ctDNA clearance were more likely to have a persistent ctDNA clearance than patients without an early ctDNA clearance (75% vs. 0, p = 0.006) (Figure 2e).
FIGURE 2.
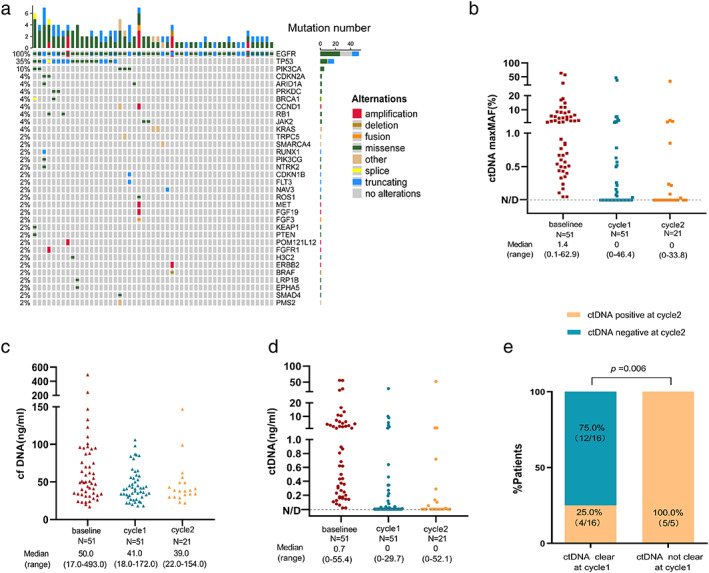
(a) OncoPrint of mutations identified at baseline. Different colors represent different types of mutations. The left side bar shows the percent of a specific mutation in 51 patients; the top bar shows the number of mutations a patient carries. (b) Dotplots comparing the change of the maximum MAF in ctDNA, (c) the amounts of cfDNA, and (d) the amounts of ctDNA across consecutive intervals following treatment initiation for the EGFR‐TKIs. (e) The clearance of ctDNA at cycle 1, and subsequent clearance of ctDNA at cycle 2. ctDNA, circulating tumor DNA; cfDNA, cell‐free DNA. MAF, mutant allele frequency; EGFR‐TKIs, epidermal growth factor receptor tyrosine kinase inhibitors.
Correlation between the baseline ctDNA/cfDNA ratio and EGFR‐TKI response at baseline
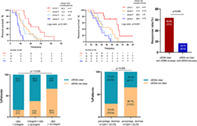
To compare the effect of the baseline ctDNA/cfDNA ratio (the maximum MAF of ctDNA) on EGFR‐TKI treatment, we used X‐tile software to calculate the most efficient cutoff value of 2.2% of the maximum MAF in ctDNA. According to the cutoff value, we defined maximum MAF in ctDNA less than or equal to 2.2% as the low ratio group and those with more than 2.2% as the high ratio group. In Table S1, patient characteristics between the two groups were well‐balanced. We found that the low ratio group had a better PFS (median PFS 14.2 months vs. 9.0 months, p = 0.006) and OS (median OS 49.2 months vs. 24.7 months, p = 0.002) (Figure 3a,b) than the high ratio group. Similarly, the low ratio group was significantly associated with a higher objective response rate (ORR) (58.6% vs. 18.2%, p = 0.004) (Figure 3c).
FIGURE 3.

(a) Overall response rate to EGFR‐TKIs in patients with the maximum MAF in ctDNA ≤2.2% versus the maximum MAF in ctDNA>2.2% in plasma at baseline. (b) Progression‐free survival (PFS) and (c) overall survival (OS) to EGFR‐TKIs in patients with the maximum MAF in ctDNA ≤2.2% versus the maximum MAF in ctDNA>2.2% in plasma at baseline. ctDNA, circulating tumor DNA; MAF, mutant allele frequency; EGFR‐TKIs, epidermal growth factor receptor‐tyrosine kinase inhibitors.
ctDNA and cfDNA dynamics evaluate the effect of EGFR‐TKI treatment
We next investigated the early kinetics of ctDNA and cfDNA in response to EGFR‐TKIs. We first examined the ctDNA alone. Detailed early kinetics of ctDNA over time in patients with CR, PR, SD, and PD are shown in Figure 4a–c. We observed that the clearance incidence rate of ctDNA (at cycle 1) was significantly higher in patients with CR and PR than in patients with SD and PD at their best response to EGFR‐TKI treatment (81.0% vs. 48.2% vs. 0, p = 0.007) (Figure 4d,e). We further looked at the correlation between the early clearance of ctDNA and the response to EGFR‐TKIs. Basic characteristics were balanced between the two groups whose ctDNA was detectable (ctDNA+) and not (ctDNA−) at cycle 1 (Table S2). Figure 5a,b show that the ctDNA+ group was significantly associated with inferior PFS (median PFS 16.8 months vs. 9.1 months, p < 0.001) and OS (median OS 51.0 months vs. 29.2 months, p = 0.002) than ctDNA− group. The same trend was true for ORR (56.7% vs. 19.0%, p = 0.007) (Figure 5c). Of note, from baseline to cycle 1, patients with increased cfDNA have a better PFS (median PFS 16.3 months vs. 10.1 months, p = 0.003) and OS (median OS 36.1 months vs. 29.0 months, p = 0.019) than those with decreased cfDNA (Figure 5d,e). The ORR was not statistically significantly different between them (Figure 5f). Next, we combined ctDNA with cfDNA in an early dynamic joint analysis. The patients were divided into four subgroups as follows: whose ctDNA not detected (ctDNA−) and cfDNA increased (group 1), ctDNA not detected (ctDNA−) and cfDNA decreased (group 2), ctDNA detected (ctDNA+) and cfDNA increased (group 3), ctDNA detected (ctDNA+) and cfDNA decreased (group 4). We found that group 1 showed the maximal benefit while group 4 showed the minimal benefit. Group 1 had a markedly better PFS and OS than group 4 (median PFS 20.2 months vs. 8.1 months, p < 0.001; median OS 62.3 months vs. 25.2 months, p = 0.001) (Figure 5g,h). Meanwhile, group 1 exhibited a great higher ORR than group 4 (63.6% vs. 16.7%, p = 0.036) (Figure 5i).
FIGURE 4.
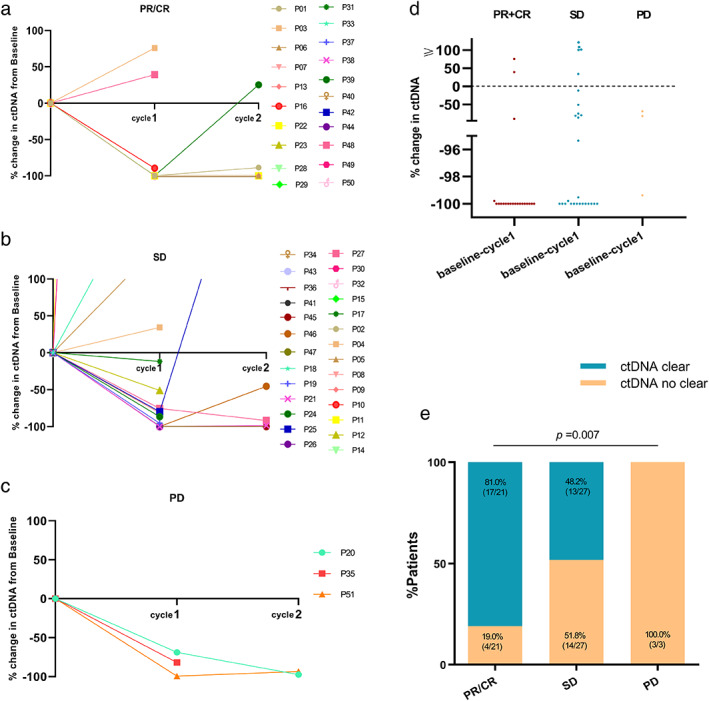
ctDNA change over time in patients with (a) partial or complete response (PR/CR), (b) stable disease (SD), and (c) progressive disease (PD) to EGFR‐TK therapy by RECIST version 1.1. (d) Scatter plot and (e) bar graph comparing the number of patients with ctDNA clearance based on PR/CR, SD, PD from baseline to cycle 1. ctDNA, circulating tumor DNA; RECIST, response evaluation criteria in solid tumors; EGFR‐TKIs, epidermal growth factor receptor‐tyrosine kinase inhibitors.
FIGURE 5.

(a) Overall response rate to EGFR‐TKIs in patients with detectable ctDNA versus undetectable ctDNA at cycle 1. (b) Progression‐free survival (PFS) and (c) overall survival (OS) to EGFR‐TKIs in patients with ctDNA detected versus not detected at cycle 1. (d) Overall response rate to EGFR‐TKIs in patients with cfDNA increase versus cfDNA decrease from baseline to cycle 1. (e) Progression‐free survival (PFS) and (f) overall survival (OS) to EGFR‐TKIs in patients with cfDNA increase versus cfDNA decrease from baseline to cycle 1. (g) Overall response rate to EGFR‐TKIs in patients with ctDNA undetected and cfDNA increase (group 1) versus ctDNA detected and cfDNA decrease from baseline to cycle 1 (group 4). (h) Progression‐free survival (PFS) and (i) overall survival (OS) to EGFR‐TKIs in patients with ctDNA undetected and cfDNA increase (group 1) versus ctDNA undetected and cfDNA decrease (group 2) versus ctDNA detected and cfDNA increase (group 3) versus ctDNA detected and cfDNA decrease (group 4) from baseline to cycle 1. ctDNA, circulating tumor DNA; cfDNA, cell‐free DNA; EGFR‐TKIs, epidermal growth factor receptor tyrosine kinase inhibitors.
Correlations between ctDNA early changes and serum biomarkers
In this study, we sought to correlate the level of tumor markers, including CEA, CYFRA21‐1, CA125, CA199, and NSE with the early changes of ctDNA to explore the possibility of tumor markers guiding ctDNA detection. The results confirmed that CEA has a certain correlation with ctDNA. ctDNA detailed kinetics based on different baseline levels of CEA are shown in Figure 6a–c. In ROC curve analysis for the baseline CEA level, the best cutoff point elected was 62.5 ng/ml, the area under the curve was 0.639, the sensitivity was 45.5%, and the specificity was 82.8% (95% confidence interval [CI]: 0.480–0.799) (Figure S2a). Patients were then divided into three groups. The baseline level of CEA was categorized as normal (CEA ≤5.0 ng/ml), low (5.0 ng/ml < CEA ≤62.5 ng/ml), and high (CEA >62.5 ng/ml). The early clearance rate of ctDNA was highest in the normal group (83.3%) and decreased significantly from low (62.5%) to high group (33.3%) (Figure 6d,e). Additionally, with the same methods, the cutoff value of the magnitude of the change in CEA was calculated as 23.0%, the area under the curve was 0.661, the sensitivity was 50.0%, and the specificity was 79.3% (95% CI: 0.508–0.815) (Figure S2b). Two groups were categorized according to the degree of CEA decline (cutoff value: 23.0%) at the best response following EGFR‐TKI therapy. ctDNA detailed kinetics based on different changes of CEA in two groups are shown in Figure 6f,g. Patients with greater CEA decline had an early clearance rate of ctDNA than those with minor CEA change (70.6% vs. 35.3%, p = 0.016) (Figure 6h,i).
FIGURE 6.
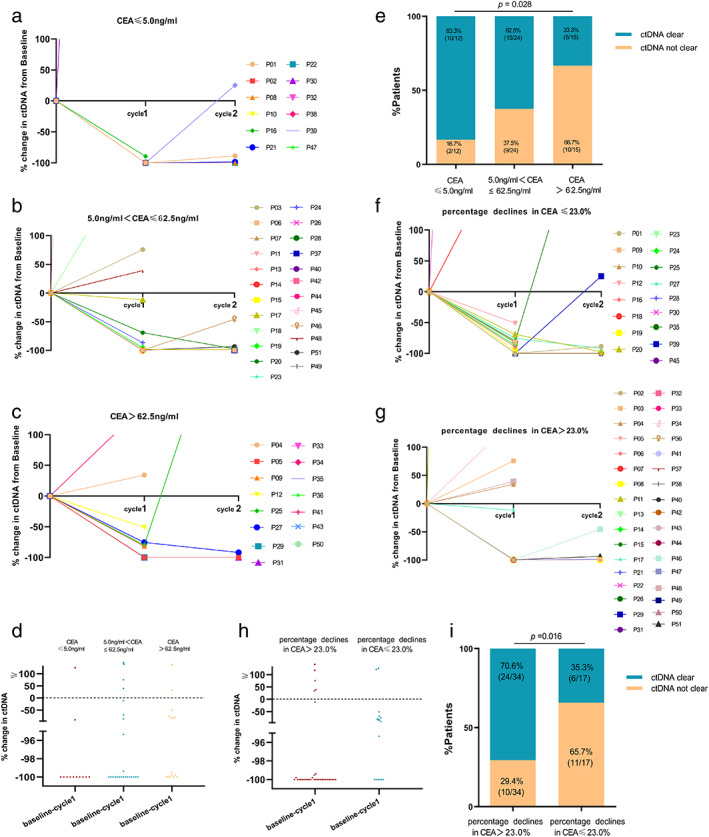
ctDNA change over time in patients with (a) CEA ≤5.0 ng/ml, (b) 5.0 ng/ml < CEA ≤62.6 ng/ml, and (c) CEA>62.6 ng/ml in serum before EGFR‐TKI therapy. (d) Scatter plot and (e) bar graph comparing the number of patients with ctDNA clearance at cycle 1 based on different level of CEA. ctDNA change over time in patients with (f) percentage declines in CEA >23.0%, (g) percentage declines in CEA ≤23.0%, at best response to EGFR‐TKI therapy. (h) Scatter plot and (i) bar graph comparing the number of patients with ctDNA clearance at cycle 1 based on different changes of CEA from baseline to best response to EGFR‐TKI therapy. ctDNA, circulating tumor DNA; CEA, carcinoembryonic antigen; EGFR‐TKIs, epidermal growth factor receptor‐tyrosine kinase inhibitors.
Cox regression analysis for PFS and OS in patients with advanced NSCLC
Finally, we performed univariate and multivariate Cox regression analyses to identify the prognostic factors. Independent univariate analysis showed that the pretherapy ctDNA/cfDNA ratio and the early dynamics of ctDNA and cfDNA were significant predictive factors for PFS and OS of EGFR‐TKI responders. The impact of these positive variables was confirmed after forwarding step‐wise Cox regression analysis. Table S3 showed the variable assignment of the Cox model. The early kinetics of ctDNA and cfDNA were the independent prognostic factors of PFS. The early kinetics of ctDNA and the baseline ctDNA/cfDNA ratio were the independent prognostic factors for OS. The result indicated that patients with detectable ctDNA following EGFR‐TKI treatment compared to undetectable ctDNA confer a 4.6‐ or 2.4‐fold risk of disease progression or death. In addition, patients with an early decreased cfDNA level had a 2.7 times greater risk of disease progression than those with an early increased cfDNA level after EGFR‐TKI treatment (Table 2).
TABLE 2.
Univariate and multivariate Cox regression analyses
| Variable | Num | Univariate analysis | Multivariate analysis | ||||
|---|---|---|---|---|---|---|---|
| HR | 95% CI | (p‐value) | HR | 95% CI | (p‐value) | ||
| Variable and PFS | |||||||
| Age (≤60 vs. >60) | 31 vs. 20 | 1.055 | 0.601–1.852 | 0.850 | |||
| Sex (male vs. female) | 25 vs. 26 | 0.977 | 0.561–1.703 | 0.934 | |||
| Smoking (yes vs. no) | 14 vs. 37 | 0.947 | 0.507–1.767 | 0.864 | |||
| PS (≤1 vs. >1) | 49 vs. 2 | 0.909 | 0.235–3.520 | 0.893 | |||
| Disease stage (IIIB vs. IV) | 3 vs. 48 | 0.587 | 0.231–1.489 | 0.351 | |||
| Malignant pleural effusion (yes vs. no) | 10 vs. 41 | 1.086 | 0.534–2.211 | 0.813 | |||
| Brain metastasis (yes vs. no) | 8 vs. 43 | 1.555 | 0.639–3.783 | 0.241 | |||
| Bone metastases (yes vs. no) | 28 vs. 23 | 0.766 | 0.435–1.351 | 0.338 | |||
| CEA (≤5.0 ng/ml vs. >5.0 ng/ml) | 12 vs. 39 | 0.681 | 0.370–1.251 | 0.246 | |||
| Tumor size (≤3.6 cm vs. >3.6 cm) | 26 vs. 25 | 1.437 | 0.818–2.524 | 0.189 | |||
| ctDNA/cfDNA (≤2.2% vs. >2.2%) | 29 vs. 22 | 2.100 | 1.126–3.914 | 0.0064** | |||
| ctDNA (clear vs. not clear) | 30 vs. 21 | 2.576 | 1.318–5.032 | 0.0003*** | 4.633 | 2.322–9.242 | <0.0001*** |
| cfDNA (increase vs. decrease) | 20 vs. 31 | 2.249 | 1.283–3.944 | 0.0028** | 3.739 | 1.923–7.271 | <0.0001*** |
| Variable and OS | |||||||
| Age (≤ 60 vs. > 60) | 31 vs. 20 | 0.813 | 0.420–1.573 | 0.521 | |||
| Sex (male vs. female) | 25 vs. 26 | 0.591 | 0.316–1.108 | 0.089 | |||
| Smoking (yes vs. no) | 14 vs. 37 | 1.348 | 0.638–2.850 | 0.391 | |||
| PS (≤1 vs. >1) | 49 vs. 2 | 0.712 | 0.173–2.929 | 0.189 | |||
| Disease stage (IIIB vs. IV) | 3 vs. 48 | 0.393 | 0.151–1.027 | 0.164 | |||
| Malignant pleural effusion (yes vs. no) | 10 vs. 41 | 1.727 | 0.714–4.175 | 0.137 | |||
| Brain metastasis (yes vs. no) | 8 vs. 43 | 2.211 | 0.739–6.618 | 0.047 | |||
| Bone metastases (yes vs. no) | 28 vs. 23 | 1.162 | 0.624–2.163 | 0.638 | |||
| CEA (≤5.0 ng/ml vs. >5.0 ng/ml) | 12 vs. 39 | 1.009 | 0.480–2.123 | 0.981 | |||
| Tumor size (≤3.6 cm vs. >3.6 cm) | 26 vs. 25 | 0.810 | 0.435–1.506 | 0.702 | |||
| ctDNA/cfDNA (≤2.2% vs. >2.2%) | 29 vs. 22 | 2.553 | 1.261–5.167 | 0.0015** | 2.393 | 1.215–4.717 | 0.012* |
| ctDNA (clear vs. not clear) | 30 vs. 21 | 2.439 | 1.214–4.899 | 0.0021** | 2.434 | 1.184–5.004 | 0.016* |
| cfDNA (increase vs. decrease) | 20 vs. 31 | 2.081 | 1.118–3.871 | 0.0185* | |||
Abbreviations: CEA, carcinoembryonic antigen; cfDNA, cell free DNA; CI, confidence interval; ctDNA, circulating tumor DNA; HR, hazard ratio.
p < 0.05.
p < 0.01.
p < 0.001.
DISCUSSION
For advanced NSCLC patients, accurate evaluation of cloning progress at the molecular level is the key to realizing individualized precision medicine and drug holiday. ctDNA‐MRD has great potential for the accurate efficacy prediction of EGFR‐TKIs in advanced NSCLC. ctDNA and cfDNA showed some degree of reactivity to MRD and reflected the micrometastases unseen by radiological imaging. 8 , 21 This study applied ctDNA combined with cfDNA dynamic changes to the accurate efficacy prediction of EGFR‐TKIs in advanced NSCLC. On the one hand, compared with the changes of ctDNA ratio, ctDNA, and cfDNA dynamic changes can more clearly show the specific impact of their respective status changes on the efficacy of EGFR‐TKIs at the early time after EGFR‐TKI treatment. On the other hand, we distinguished between true positive (cfDNA reduced after EGFR‐TKI treatment, but ctDNA could still be detected) and true negative (cfDNA increased after EGFR‐TKI treatment, but ctDNA could not be detected) in advanced NSCLC patients. Of course, the positive rate of ctDNA is closely related to the size of the panel in genotyping and the sensitivity of the detection method. By strictly controlling the sample quality and using an ultra‐high depth sequencing panel consisting of 168 lung cancer‐related genes, this study circumvented false negatives caused by samples and testing methods, thus ensuring the accuracy and comprehensiveness of the detection. In this study, the predictive model based on ctDNA and cfDNA showed four different types prognoses of patients. The best curative effect was patients with an early ctDNA clearance combined with cfDNA increased, and the worst was patients without an early ctDNA clearance combined with cfDNA decreased. Our findings may provide new ideas into the personalized and precise EGFR‐TKI treatment strategies for NSCLC patients.
NGS can be monitored more intensively in patients with the worst curative effect. Timely adjustments of treatment plans are expected to improve the prognosis and prolong the survival time of patients. Our research observed patients who benefited most from EGFR‐TKIs survived for as long as 5 years. Nowadays, patients have a longer duration of EGFR‐TKI therapy of up to many years, and targeted therapy usually starts with identifying sensitive mutations until the disease progresses. 27 Periodic reexaminations and drug side effects during targeted therapy increase medical costs, waste medical resources, and reduce their quality of life. 28 , 29 An increasing number of studies suggest that drug holidays play a vital role in delaying the evolution of drug resistance and realizing drug circulation in patients with advanced NSCLC. 30 , 31 Therefore, it is of great significance for these patients who have been treated with EGFR‐TKIs for many years to enjoy a drug holiday. However, the realization of drug holidays requires a high precision assessment of efficacy and is still in the preliminary exploratory stage in advanced NSCLC patients treated with EGFR‐TKIs. A recent study suggested that a drug holiday is allowed if patients achieved CR with MRD negative and CEA negative. 32 In our study, we screened out the patients with MRD true negative, that is, patients with ctDNA clearance and elevated cfDNA. We identified the implementable population of drug holidays. After a period of time of treatment, patients have no measurable lesion on radiological imaging (CT, MRI, or PET/CT), ctDNA clearance, elevated cfDNA, and CEA‐negative.
Studies have revealed that elevated CEA levels might be a more sensitive predictor of explosive progression in lung adenocarcinoma patients harboring mutant EGFR. 33 However, the investigation of tumor biomarkers and ctDNA is limited at present. We tried to find a method to use tumor markers to guide ctDNA monitoring. The results showed that ctDNA clearance differed at variant baseline CEA levels and diverse decline degrees in CEA at the best response. Furthermore, our analysis showed that patients with the first clearance of ctDNA were more likely to have continuous clearance. Therefore, for patients during drug holidays, with an early ctDNA clearance, if the baseline value of CEA was lower than the normal range and the CEA decreased greatly at the best curative effect, the detection of NGS did not rush. When CEA increased significantly, the ctDNA negative rate would be greatly reduced. For the best benefit groups of EGFR‐TKIs, they may take the drug holiday, and drug resistance would be delayed. At the same time, the frequency of NGS monitoring during the stable phase of CEA level could be decreased.
Finally, our study demonstrated that ctDNA and cfDNA early dynamic change could be used as an independent predictor of accurate identification of different responses to EGFR‐TKIs. Interestingly, our results suggested that patients with early increasing cfDNA levels had better EGFR‐TKI efficacy. The possible reason was that increasing cfDNA levels provided patients with an environment in which the ctDNA relative level was lower. It also indicated that combined ctDNA and cfDNA played a more critical role as a reliable predictive biomarker than either ctDNA alone or cfDNA alone. Our analysis was inherently limited by the cohorts of advanced NSCLC with EGFR‐mutant genotypes treated with EGFR‐TKIs. Because this was a retrospective study, time points for ctDNA detection were inconsistent. Due to the limited number of samples, the predictive value remains to be further verified. We are planning a prospective large sample study to further explore the predictive potential of tumor markers for MRD and prognosis, and drive the clinical applications of the drug holiday in advanced NSCLC patients.
In conclusion, this study demonstrated that the early dynamic changes of ctDNA combined with cfDNA accurately identified different outcomes and provided a rationale that informs clinical decisions for drug holidays in the management of advanced NSCLC patients treated with EGFR‐TKIs. We further demonstrated that combination monitoring of CEA and ctDNA may provide a convenient and feasible way to observe drug effects for patients on drug holidays. The cleverer strategy for surveillance methodology and targeted drugs may give us some surprises for clinical practice.
CONFLICT OF INTEREST
The authors report no conflicts of interest in this work.
Supporting information
Figure S1. Somatic mutations detected in plasma ctDNA. SNV, single nucleotide variation; CNV, copy number variations.
Figure S2. A ROC curve was drawn, and the area under the curve was calculated. (A) The area under the curve for CEA level at baseline was 0.639 (95% CI: 0.480–0.799, p < 0.05). When the CEA cutoff was 62.5 ng/ml, the sensitivity was 45.5% and the specificity was 82.8%. (B) The area under the curve for percentage declines in CEA at best response to EGFR‐TKIs therapy was 0.661 (95% CI: 0.508–0.815, p < 0.05). When the CEA cutoff was 22%, the sensitivity was 50.0% and the specificity was 79.3%. CEA, carcinoembryonic antigen; EGFR‐TKIs, epidermal growth factor receptor‐tyrosine kinase inhibitors.
Table S1. Patient characteristics.
Tables S2. Patient characteristics.
Table S3. The variable assignment of Cox model.
Zheng J, Wang Y, Hu C, Zhu M, Ii J, Lin C, et al. Predictive value of early kinetics of ctDNA combined with cfDNA and serum CEA for EGFR‐TKI treatment in advanced non‐small cell lung cancer. Thorac Cancer. 2022;13(22):3162–3173. 10.1111/1759-7714.14668
Jie Zheng and Yubo Wang contributed equally to this work.
Funding information National Natural Science Foundation of China, Grant/Award Numbers: 81802293, 81902343, 82172623; Chongqing Science Technology Commission, Grant/Award Number: cstc2021jcyj‐msxmX0014; Key Technology Project for Prevention and Control of Major Diseases in Chongqing, Grant/Award Number: 2019ZX002
Contributor Information
Rui Han, Email: hanrui0018@163.com.
Yong He, Email: heyong@tmmu.edu.cn.
REFERENCES
- 1. Noia VD, Aveni AD, Argento ED, et al. Treating disease progression with osi‐mertinib in EGFR‐mutated non‐small‐cell lung cancer: novel targeted agents and combination strategies. ESMO Open. 2021;6(6):100280. [DOI] [PMC free article] [PubMed] [Google Scholar]
- 2. Karuppasamy R, Veerappapillai S, Maiti S, Shin WH, Kihara D. Current progress and future perspectives of polypharmacology: from the view of non‐small cell lung cancer. Semin Cancer Biol. 2021;68:84–91. [DOI] [PMC free article] [PubMed] [Google Scholar]
- 3. Yuan M, Huang LL, Chen JH, Wu J, Xu Q. The emerging treatment landscape of target‐ed therapy in non‐small‐cell lung cancer. Signal Transduct Target Ther. 2019;4:61. [DOI] [PMC free article] [PubMed] [Google Scholar]
- 4. Wang SY, Yan B, Zhang YW, Xu J, Qiao R, Dong Y, et al. Different characteristics and survival in non‐small cell lung cancer patients with primary and acquired EGFR T790M muta‐tion. Int J Cancer. 2019;144(11):2880–6. [DOI] [PubMed] [Google Scholar]
- 5. Re MD, Bordi P, Rofi E, et al. The amount of activating EGFR mutations in cir‐culating cell‐free DNA is a marker to monitor osimertinib response. Br J Cancer. 2018;119(10):1251–8. [DOI] [PMC free article] [PubMed] [Google Scholar]
- 6. Steedam CM, Veerman GD, Pruis MA, et al. Plasma predictive features in treating EGFR‐mutated non‐small cell lung cancer. Cancer. 2020;12(11):3179. [DOI] [PMC free article] [PubMed] [Google Scholar]
- 7. Peng XZ, Long XY, Liu L, Zeng L, Yang H, Jiang W, et al. Clinical impact of uncommon epidermal growth factor receptor exon 19 in sertion‐deletion variants on epidermal growth factor receptor‐tyrosine kinase inhibitor efficacy in non‐small‐cell lung cancer. Eur J Cancer. 2020;141:199–208. [DOI] [PubMed] [Google Scholar]
- 8. Song Y, Hu CP, Xie ZH, et al. Circulating tumor DNA clearance predicts prognosis across treatment regimen in a large real‐world longitudinally monitored advanced non‐small cell lung cancer cohort. Transl Lung Cancer Res. 2020;9(2):269–79. [DOI] [PMC free article] [PubMed] [Google Scholar]
- 9. Chen G, Peng JJ, Xiao Q, Wu HX, Wu X, Wang F, et al. Postoperative circulating tumor DNA as markers of recurrence risk in stages II to III colorectal cancer. J Hematol Oncol. 2021;14:80. [DOI] [PMC free article] [PubMed] [Google Scholar]
- 10. Abbosh C, Birkbak NJ, Swanton C. Early stage NSCLC ‐ challenges to imple‐menting ctDNA‐based screening and MRD detection. Nat Rev Clin Oncol. 2018;15(9):577–86. [DOI] [PubMed] [Google Scholar]
- 11. Xia L, Mei JD, Kang R, Deng S, Chen Y, Yang Y, et al. Perioperative ctDNA‐based molecular residual disease detection for non‐small cell lung cancer: a prospective multicenter cohort study (LUNGCA‐1). Clin Cancer Res. 2021;3044:3308–17. [DOI] [PubMed] [Google Scholar]
- 12. Parikh AR, Van Seventer EE, Siravegna G, et al. Minimal residual disease detection using a plasma‐only circulating tumor DNA assay in patients with colorectal cancer. Clin Cancer Res. 2021;27(20):5586–94. [DOI] [PMC free article] [PubMed] [Google Scholar]
- 13. Peng MY, Huang Q, Yin W, Tan S, Chen C, Liu W, et al. Circulating tumor DNA as a prognostic bi‐omarker in localized non‐small cell lung cancer. Front Oncol. 2020;10:561598. [DOI] [PMC free article] [PubMed] [Google Scholar]
- 14. Wang YQ, Yang LF, Bao H, Fan X, Xia F, Wan J, et al. Utility of ctDNA in predicting response to ne‐oadjuvant chemoradiotherapy and prognosis assessment in locally advanced rec‐tal cancer: a prospective cohort study. PLoS Med. 2021;18(8):e1003741. [DOI] [PMC free article] [PubMed] [Google Scholar]
- 15. Tie j, Wang YX, Tomasetti C, et al. Circulating tumor DNA analysis detects minimal residual disease and predicts recurrence in patients with stage II co‐lon cancer. Sci Transl Med. 2016;8(346):346ra92. [DOI] [PMC free article] [PubMed] [Google Scholar]
- 16. Gombos A, Venet D, Ameye L, Vuylsteke P, Neven P, Richard V, et al. FDG positron emission tomography imag‐ing and ctDNA detection as an early dynamic biomarker of everolimus efficacy in advanced luminal breast cancer. NPJ Breast Cancer. 2021;7(1):125. [DOI] [PMC free article] [PubMed] [Google Scholar]
- 17. Luo H, Wei W, Ye Z, Zheng J, Xu RH. Liquid biopsy of methylation biomarkers in cell‐free DNA. Trends Mol Med. 2021;27(5):482–500. [DOI] [PubMed] [Google Scholar]
- 18. Sozzi G, Conte D, Mariani L, Lo Vullo S, Roz L, Lombardo C, et al. Analysis of circulating tumor DNA in plasma at diagnosis and during follow‐up of lung cancer patients. Cancer Res. 2001;61(12):4675–8. [PubMed] [Google Scholar]
- 19. Corcoran RB, Chabner BA. Application of cell‐free DNA analysis to cancer treatment. N Engl J Med. 2018;379(18):1754–65. [DOI] [PubMed] [Google Scholar]
- 20. Park BH, Joshua D. Circulating tumor DNA: measurement and Clini‐cal utility. Annu Rev Med. 2018;69:223–34. [DOI] [PubMed] [Google Scholar]
- 21. Zhao XL, Dai FQ, Mei LY, Huang D, Shen X, Zhang H, et al. The potential use of dynamics changes of ctDNA and cfDNA in the perioperative period to predict the recurrence risk in early NSCLC. Front Oncol. 2021;11:671963. [DOI] [PMC free article] [PubMed] [Google Scholar]
- 22. Wei ZJ, Shah N, Deng C, Xiao X, Zhong T, Li X. Circulating DNA addresses cancer monitoring in non small cell lung cancer patients for detection and capturing the dynamic changes of the disease. Springerplus. 2016;5:531. [DOI] [PMC free article] [PubMed] [Google Scholar]
- 23. Ricciuti B, Jones G, Severgnini M, Alessi JV, Recondo G, Lawrence M, et al. Early plasma circulating tumor DNA (ctDNA) changes predict response to first‐line pembrolizumab‐based ther‐apy in non‐small cell lung cancer (NSCLC). J Immunother Cancer. 2021;9(3):e001504. [DOI] [PMC free article] [PubMed] [Google Scholar]
- 24. Yang Y, Zheng D, Wu CY, et al. Detecting ultralow frequency mutation in Cir‐culating cell‐free DNA of early‐stage nonsmall cell lung cancer patients with unique molecular identifiers. Small Methods. 2019;1900206. [Google Scholar]
- 25. Mao XW, Zhang Z, Zheng XX, Xie F, Duan F, Jiang L, et al. Capture‐based targeted Ultradeep se‐quencing in paired tissue and plasma samples demonstrates differential sub‐clonal ctDNA‐releasing capability in advanced lung cancer. J Thorac Oncol. 2017;12(4):663–72. [DOI] [PubMed] [Google Scholar]
- 26. He YM, Sheng W, Hu WG, Lin J, Liu J, Yu B, et al. Different types of ROS1 fusion partners yield comparable efficacy to Crizotinib. Oncol Res. 2019;27(8):901–10. [DOI] [PMC free article] [PubMed] [Google Scholar]
- 27. Wu YL, Tsuboi M, He J, John T, Grohe C, Majem M, et al. EGFROsimertinib in resected ‐mutated non‐small‐cell lung cancer. N Engl J Med. 2020;383(18):1711–23. [DOI] [PubMed] [Google Scholar]
- 28. Lee HJ, Jeong GH, Li H, et al. Efficacy and safety of epidermal growth factor receptor‐tyrosine kinase inhibitor (EGFR‐TKI) monotherapy for advanced EGFR‐mutated non‐small cell lung cancer: systematic review and meta‐analysis. Eur Rev Med Pharmacol Sci. 2021;25(20): 6232–44. [DOI] [PubMed] [Google Scholar]
- 29. Esserman LJ, Thompson IM, Reid B, Nelson P, Ransohoff DF, Welch HG, et al. Addressing overdiagnosis and over‐treatment in cancer: a prescription for change. Lancet Oncol. 2014;15(6):e234–42. [DOI] [PMC free article] [PubMed] [Google Scholar]
- 30. Yamaoka T, Ohmori T, Ohba M, Arata S, Murata Y, Kusumoto S, et al. Distinct Afatinib resistance mechanisms identified in lung adenocarcinoma harboring an EGFR mutation. Mol Cancer Res. 2017;15(7):915–28. [DOI] [PubMed] [Google Scholar]
- 31. Becker A, Crombag L, Heideman DA, et al. Retreatment with erlotinib: regain of TKI sensitivity following a drug holiday for patients with NSCLC who initial‐ly responded to EGFR‐TKI treatment. Eur J Cancer. 2011;47(17):2603–6. [DOI] [PubMed] [Google Scholar]
- 32. Dong S et al. Presented at WCLC 2021. Absract WS06.06.
- 33. Gao Y, Song P, Li H, et al. Elevated serum CEA levels are associated with the explosive progression of lung adenocarcinoma harboring EGFR mutations. BMC Cancer. 2017;17(1):1–7. [DOI] [PMC free article] [PubMed] [Google Scholar]
Associated Data
This section collects any data citations, data availability statements, or supplementary materials included in this article.
Supplementary Materials
Figure S1. Somatic mutations detected in plasma ctDNA. SNV, single nucleotide variation; CNV, copy number variations.
Figure S2. A ROC curve was drawn, and the area under the curve was calculated. (A) The area under the curve for CEA level at baseline was 0.639 (95% CI: 0.480–0.799, p < 0.05). When the CEA cutoff was 62.5 ng/ml, the sensitivity was 45.5% and the specificity was 82.8%. (B) The area under the curve for percentage declines in CEA at best response to EGFR‐TKIs therapy was 0.661 (95% CI: 0.508–0.815, p < 0.05). When the CEA cutoff was 22%, the sensitivity was 50.0% and the specificity was 79.3%. CEA, carcinoembryonic antigen; EGFR‐TKIs, epidermal growth factor receptor‐tyrosine kinase inhibitors.
Table S1. Patient characteristics.
Tables S2. Patient characteristics.
Table S3. The variable assignment of Cox model.