

Abstract
Objective
The incidence of radiation pneumonitis (RP) has a highly linear relationship with low‐dose lung volume. We previously established a volume‐based algorithm (VBA) method to improve low‐dose lung volume in radiotherapy (RT). This study assessed lung inflammatory changes by integrating fluorine‐18‐fluorodeoxyglucose positron emission tomography/computed tomography (18F‐FDG PET/CT) with VBA for esophageal cancer patients undergoing arc‐based RT.
Methods
Thirty esophageal cancer patients received 18F‐FDG PET/CT imaging pre‐RT and post‐RT were included in a retrospective pilot study. We fused lung doses and parameters of PET/CT in RT planning. Based on VBA, we used the 5Gy isodose curve to define high‐dose (HD) and low‐dose (LD) regions in the lung volume. We divided patients into non‐RP (nRP) and RP groups. The maximum, mean standardized uptake value (SUVmax, SUVmean), global lung glycolysis (GLG), mean lung dose (MLD) and V5–30 in lungs were analyzed. Area under the curve values were utilized to identify optimal cut‐off values for RP.
Results
Eleven patients in the nRP group and 19 patients in the RP group were identified. In 30 RP lungs, post‐RT SUVmax, SUVmean and GLG of HD regions showed significant increases compared to values for pre‐RT lungs. There were no significant differences in values of 22 nRP lungs. Post‐RT SUVmax and SUVmean of HD regions, MLD, and lung V5 and V10 in RP lungs were significantly higher than in nRP lungs. For detecting RP, the optimal cut‐off values were post‐RT SUVmax > 2.28 and lung V5 > 47.14%.
Conclusion
This study successfully integrated 18F‐FDG PET/CT with VBA to assess RP in esophageal cancer patients undergoing RT. Post‐RT SUVmax > 2.28 and lung V5 > 47.14% might be potential indicators of RP.
Keywords: esophageal cancer, lung dose, lung inflammatory, PET/CT
The inflammatory changes of the high‐dose (HD) region in fluorine‐18‐fluorodeoxyglucose (18F‐FDG) positron emission tomography (PET)/computed tomography (CT) after radiotherapy in one esophageal cancer patient with radiation pneumonitis (RP). (A) RP with linear infiltration changes interpreted in CT images (blue arrow and red arrow). (B) Increased 18F‐FDG uptake of the left lung (red arrow) and right lung (blue arrow) in PET images. (C) Integration of the lung dose‐volume in RT planning and volume‐based parameters in PET/CT.
![]()
INTRODUCTION
Esophageal cancer is a common malignancy and concurrent chemoradiotherapy (CCRT) is an essential treatment for it. Radiation pneumonitis (RP), that is, radiation‐induced inflammation in the lung tissues, is one of the most common side effects after radiotherapy (RT) for esophageal cancer. 1 , 2 Several studies have indicated that the incidence of RP has a highly linear relationship with low‐dose lung volume. 3 , 4 , 5 Pinnix et al. 6 showed that lung V5 > 55% could be used as a predictor for RP. Wang et al. 7 demonstrated that when lung V5 ≤ 42% the incidence of RP could drop to 3%. The lung V5 is a crucial predictor of RP.
Functional and metabolic imaging with fluorine‐18‐fluorodeoxyglucose (18F‐FDG) positron emission tomography/computed tomography (PET/CT) has been widely utilized to detect malignant tumor cells 8 and also to quantify the inflammation based on the metabolism of normal tissues. 9 , 10 Volume‐based semiquantitative parameters such as standardized uptake values, metabolic tumor volume, and total lesion glycolysis could guide cancer diagnosis, staging, metastasis detection, and interpretation of treatment responses for esophageal cancer. 11 , 12 , 13
Castillo et al. 14 and Hart et al. 15 indicated that the quantitative parameters of 18F‐FDG PET/CT could be used as indicators for detecting RP for esophageal cancer patients. Abdulla et al. 16 combined the mean standardized uptake value (SUVmean) with the lung tissue volume to calculate the global lung glycolysis (GLG). They pointed out that GLG is a potential biomarker for detecting RP. Previously we proposed the volume‐based algorithm (VBA) method to reduce lung V5 by improving the arc angle in dynamic arc‐based RT. 17 We demonstrated that the percentage of irradiated lung volume in whole lung volume is highly correlated with lung V5. Additionally, only a few studies using 18F‐FDG PET have been reported to evaluate and quantify the inflammation in different radiation dose volumes of the lung. 4 , 18 , 19 This study therefore aimed to assess lung inflammatory changes by integrating 18F‐FDG PET/CT with VBA before and after arc‐based RT for esophageal cancer.
MATERIALS AND METHODS
Study population
The flowchart for the study population selection is shown in Figure 1. Patients with esophageal cancer who underwent CCRT in our hospital between 2014 and 2018 were retrospectively reviewed. The 18F‐FDG PET/CT scans were acquired 1 week before RT (pre‐RT) and 1–3 months after RT (post‐RT). Patients with stage I to III according to the 7th American Joint Committee on Cancer (AJCC) staging systems for esophageal cancer were included. 20 Exclusion criteria were as follows: esophageal cancer stage IV, synchronous cancer, previous thoracic surgery, patients did not receive pre‐ or post‐CCRT PET/CT, interval time between CCRT and post‐CCRT PET/CT >3 months.
FIGURE 1.

Flowchart of esophageal cancer patient selection
Thirty esophageal cancer patients treated with CCRT between 2014 and 2018 were eligible for analysis. According to Common Terminology Criteria for Adverse Events version 4.0, patients were divided into a nonradiation pneumonitis (nRP) group (grade 0) and and RP group (≥ grade 1). The study was approved by the Research Ethics Review Committee of Far Eastern Memorial Hospital (FEMH‐IRB No.: 108069‐E).
18F‐FDG PET/CT scans, quantification analysis, and evaluation of RP
PET/CT scans were acquired on a GE Discovery VCT PET/CT scanner (GE Medical Systems). Patients were required to fast for 6 h before the PET/CT scan to achieve a blood glucose level of <140 mg/dl. Patients were intravenously injected with 18F‐FDG according to their body weight (4 MBq/kg) and then rested for 60 min before image acquisition. CT images were acquired with the following parameters: tube voltage 120 kVp, tube current with automatic exposure control from 10 to 300 mA, slice thickness 3.75 mm, pitch of 1, and matrix size 512 × 512. The scan range was from the top of the head to mid‐thigh. Three‐dimensional PET images were acquired with a z axis field‐of‐view (FOV) of 15 cm for 3 min at each bed position. PET images were reconstructed using the Ordered Subset Expectation Maximization (OS‐EM) algorithm, corrected for normalization, attenuation, random, and scattered coincidences.
The standardized uptake value (SUV) is a semi‐quantitative evaluation method used in PET. It mainly evaluates the 18F‐FDG uptake in tissues, organs, tumors, or regions of interest (ROI). The calculation method is as follows:
Tissue concentration represents the tissue radioactivity per unit volume obtained after quantitative PET image reconstruction in the target FOV.
The maximum SUV (SUVmax) is defined as the maximum voxel value within the ROI and SUVmean is the average SUV value in all pixels within the ROI. The GLG is obtained by multiplying the SUVmean and lung volume. It is a derivative of total lesion glycolysis (TLG). TLG is a parameter for evaluating tumor activity and a prognostic factor of the tumor. TLG is focused on a lesion. In contrast, GLG is focused on the lung. Several studies have used GLG to detect normal tissue inflammation. 16 , 21
The calculation method is as follows:
CT grading of radiation pneumonitis
According to the Common Terminology Criteria for Adverse Events version 4.0, 22 RP was identified through clinical symptoms and the radiographic changes on the CT images in the pre‐ and post‐RT PET/CT scans. RP (≧ grade 1) was interpreted by two senior physicians (C.X. Hsu and S.Y. Wang) at our institution.
CT simulation and radiation treatment planning
The CT simulation images were input into the Pinnacle treatment planning system (version 9.8; Philips Medical Systems North America) to design the RT plan. The clinical tumor volume (CTV) was designed to cover a region with subclinical disease from gross tumor volume (GTV) by expanding 4 cm superiorly and inferiorly, and 0.5 cm laterally on both sides, anteriorly and posteriorly. To define the planning target volume (PTV), organ movements caused by breathing, swallowing, and position uncertainty in each therapy were considered. The normal organs such as the heart, lungs, and spinal cord were defined. According to the size and shape of the tumor, different gantry arc angles were designed by medical physicists. The prescribed dose to the PTV and the dose constraints of organs at risk were based on the International Commission on Radiation Units and Measurements Report 50 (ICRP 50), and esophageal and esophagogastric junction cancers, version 1.2015, NCCN Clinical Practice Guidelines in Oncology. 23 The mean lung dose (MLD), V5, V10, V15, V20, V25, and V30 in the lungs were collected. A dose‐volume histogram parameter of Vx was defined as the percentage of the organ volume exceeding a radiation dose of x (Gy).
Image fusion and the high‐ and low‐dose regions segmentation
The PET images and the simulation CT images were fused using the MIM vista treatment planning system (version 6.8.4, MIM Software Inc.). The images were adjusted and aligned based on the myocardium and spine. The Hounsfield unit (HU) between −950 HU and −250 HU was defined as the lung volume on CT images, 4 and the regions overlapping with the trachea and bronchus were manually removed. To avoid the 18F‐FDG uptake of the chest wall from affecting the calculation of inflammatory changes in the lung, the lung volume was obtained by shrinking a 1.5‐mm thick slab inward from its original three‐dimensional boundary in simulation CT. Spill‐out artifacts appeared in the 18F‐FDG high uptake area of the heart, liver, and lesion, which affected the 18F‐FDG value in the adjacent regions, 24 therefore the regions with SUV higher than 2.5 in the thoracic cavity were subtracted. 25
According to the VBA established by our team, 17 we proposed the VBA method to reduce lung V5 in dynamic arc‐based RT. Therefore, we integrated the irradiated lung volume in RT planning and volume‐based parameters in PET/CT. We used the 5 Gy isodose curve to define the high‐dose (HD) (≧5 Gy) and low‐dose (LD) (<5 Gy) regions in the lung volume (Figure 2) to assess lung inflammatory changes pre‐ and post‐RT. The SUVmean, SUVmax, and GLG of the HD and LD regions in the lungs were quantified in the pre‐ and post‐RT PET/CT, respectively.
FIGURE 2.

(a) Pre‐RT PET/CT image fused with 5 Gy isodose curve, (b) simulation CT with isodose curves (5–50 Gy), and (c) post‐RT PET/CT image fused with 5 Gy isodose curve. The yellow line is the 5 Gy isodose curve. The blue line is the right HD region. The red line is the left HD region. The brown line is the right LD region. The green line is the left LD region. The pink line is the GTV. The SUVmean, SUVmax, and GLG of the HD and LD regions in the lungs were quantified in the pre‐ and post‐RT PET/CT, respectively
Statistical analysis
The SPSS software package (version 24.0; IBM Corporation) was used for statistical analysis. A two‐tailed paired t‐test was used to compare the inflammatory changes of the HD and LD regions between pre‐ and post‐RT. An independent t‐test was used to compare the inflammatory changes of the HD and LD regions as well as lung dose between RP and nRP lungs. A p < 0.05 was considered statistically significant. Sensitivity, specificity, positive predictive values (PPV), and negative predictive values (NPV) were estimated for each marker. Receiver operator characteristic (ROC) curves and area under the curves (AUCs) of lung inflammatory changes and lung dose were performed, and the optimal cut‐off value was determined by the Youden index. 26
RESULTS
Patient population
Thirty esophageal cancer patients treated with VMAT were included between 2014 and 2018. The detailed patient characteristics are shown in Table 1. The median of the prescribed dose to PTV was 45 Gy. The median interval time between pre‐RT 18F‐FDG PET/CT and RT was 17 days (range 12–29 days). The median interval time between RT and post‐RT 18F‐FDG PET/CT was 37 days (range 21–89 days). The median interval time between the pre‐ and post‐RT 18F‐FDG PET/CT scans was 68 days (range 98–174 days). Eleven patients were identified as the nRP group and 19 patients were identified as the RP (≥ grade 1) group. Twenty‐two nRP lungs and 30 RP (≥ grade 1) lungs were identified. There were 14 right lungs and 16 left lungs with RP in 30 lungs.
TABLE 1.
Patient characteristics
| Characteristics | No. of patients (n = 30) |
|---|---|
| Sex | |
| Male | 20 |
| Female | 10 |
| Age (years) | |
| Median | 56 |
| Range | 43–78 |
| Staging | |
| I | 3 |
| II | 9 |
| III | 18 |
| Chemotherapy | |
| Yes | 30 |
| No | 0 |
| RT technique | |
| VMAT | 13 |
| Tomotherapy | 17 |
| Prescription dose | |
| Median (Gy) | 45 |
| Range (Gy) | 41–50.4 |
| Interval time between RT and post‐PET/CT | |
| Median (days) | 37 |
| Range (days) | 21–89 |
| nRP lungs | 22 |
| RP lungs (≥ grade 1) | 30 |
| Right lungs | 14 |
| Left lungs | 16 |
| Both right and left lungs | 11 |
Abbreviations: nRP, nonradiation pneumonitis; PET/CT, positron emission tomography/computed tomography; RP, radiation pneumonitis; RT, radiotherapy; VMAT, volumetric modulated arc therapy.
18F‐FDG PET inflammatory changes in lungs
Table 2 shows the inflammatory changes of the HD and LD regions in the right and left lungs between pre‐RT and post‐RT. There were significant increases in SUVmax, SUVmean, and GLG of the HD regions between pre‐RT and post‐RT. However, there were no significant differences in SUVmax, SUVmean, and GLG of the LD regions between pre‐RT and post‐RT.
TABLE 2.
Comparison of the inflammatory changes in lungs between pre‐RT and post‐RT
| Parameter | Pre‐RT | Post‐RT | Absolute change (Δ) | Relative change | Pre‐RT versus post‐RT p value |
|---|---|---|---|---|---|
| Right lungs (n = 30) | |||||
| HD region | |||||
| SUVmax | 2.04 ± 0.53 | 2.35 ± 0.72 | 0.30 ± 0.71 | 15% | 0.024* |
| SUVmean | 0.50 ± 0.10 | 0.56 ± 0.17 | 0.07 ± 0.14 | 13% | 0.034* |
| GLG (ml) | 300.79 ± 138.59 | 375.12 ± 181.42 | 77.47 ± 146.91 | 28% | 0.010* |
| LD region | |||||
| SUVmax | 1.89 ± 0.47 | 1.89 ± 0.38 | 0.02 ± 0.40 | 1% | 0.918 |
| SUVmean | 0.44 ± 0.09 | 0.47 ± 0.13 | 0.04 ± 0.11 | 8% | 0.136 |
| GLG (ml) | 450.19 ± 185.51 | 457.23 ± 185.13 | 10.24 ± 153.65 | 2% | 0.806 |
| Left lungs (n = 30) | |||||
| HD region | |||||
| SUVmax | 2.02 ± 0.39 | 2.41 ± 0.50 | 0.39 ± 0.49 | 20% | 0.000* |
| SUVmean | 0.52 ± 0.11 | 0.59 ± 0.17 | 0.07 ± 0.13 | 12% | 0.013* |
| GLG (ml) | 317.39 ± 117.87 | 401.40 ± 184.85 | 85.02 ± 136.48 | 28% | 0.002* |
| LD region | |||||
| SUVmax | 1.79 ± 0.48 | 1.96 ± 0.48 | 0.17 ± 0.57 | 10% | 0.119 |
| SUVmean | 0.44 ± 0.09 | 0.47 ± 0.14 | 0.04 ± 0.11 | 9% | 0.082 |
| GLG (ml) | 282.42 ± 130.87 | 283.36 ± 141.29 | 2.06 ± 89.51 | 1% | 0.955 |
Note: Values are presented as mean ± SD.
Abbreviations: GLG, global lung glycolysis; HD, high dose; LD, low dose; RT, radiotherapy; SUV, standard uptake value.
p < 0.05.
18F‐FDG PET inflammatory changes in RP and nRP lungs between pre‐RT and post‐RT
Table 3 shows the inflammatory changes in RP and nRP lungs between pre‐RT and post‐RT. In RP lungs (n = 30) between pre‐RT and post‐RT SUVmax, SUVmean, and GLG of the HD regions showed significant increases (all p < 0.05). However, there were no significant differences in the inflammatory changes of the HD and LD regions in nRP lungs. The inflammatory changes of HD regions in PET/CT images from one patient with RP are shown in Figure 3.
TABLE 3.
Comparison of the inflammatory changes in RP and nRP lungs between pre‐RT and post‐RT
| Pre‐RT | Post‐RT | p value | |
|---|---|---|---|
| RP lungs (n = 30) | |||
| Right lungs (n = 14) | |||
| HD region | |||
| SUVmax | 2.10 ± 0.60 | 2.83 ± 0.79 | 0.002* |
| SUVmean | 0.52 ± 0.12 | 0.64 ± 0.21 | 0.040* |
| GLG (ml) | 314.98 ± 151.93 | 394.29 ± 206.68 | 0.044* |
| LD region | |||
| SUVmax | 2.01 ± 0.60 | 2.06 ± 0.44 | 0.721 |
| SUVmean | 0.43 ± 0.10 | 0.51 ± 0.16 | 0.049* |
| GLG (ml) | 452.58 ± 202.19 | 500.59 ± 178.43 | 0.222 |
| Left lungs (n = 16) | |||
| HD region | |||
| SUVmax | 2.05 ± 0.38 | 2.68 ± 0.52 | 0.000* |
| SUVmean | 0.51 ± 0.12 | 0.65 ± 0.20 | 0.001* |
| GLG (ml) | 348.26 ± 115.15 | 451.61 ± 207.45 | 0.020* |
| LD region | |||
| SUVmax | 1.77 ± 0.59 | 1.95 ± 0.55 | 0.319 |
| SUVmean | 0.42 ± 0.11 | 0.51 ± 0.15 | 0.007* |
| GLG (ml) | 245.36 ± 131.97 | 289.99 ± 159.11 | 0.016* |
| nRP lungs (n = 22) | |||
| Right lungs (n = 11) | |||
| HD region | |||
| SUVmax | 2.06 ± 0.47 | 2.02 ± 0.25 | 0.786 |
| SUVmean | 0.51 ± 0.08 | 0.51 ± 0.10 | 0.921 |
| GLG (ml) | 278.58 ± 123.79 | 344.58 ± 173.13 | 0.282 |
| LD region | |||
| SUVmax | 1.79 ± 0.17 | 1.72 ± 0.20 | 0.451 |
| UVmean | 0.45 ± 0.07 | 0.44 ± 0.09 | 0.269 |
| GLG (ml) | 483.64 ± 181.87 | 415.91 ± 188.39 | 0.206 |
| Left lungs (n = 11) | |||
| HD region | |||
| SUVmax | 2.04 ± 0.44 | 2.12 ± 0.29 | 0.639 |
| SUVmean | 0.55 ± 0.10 | 0.53 ± 0.10 | 0.246 |
| GLG (ml) | 266.64 ± 113.65 | 327.81 ± 141.17 | 0.115 |
| LD region | |||
| SUVmax | 1.77 ± 0.30 | 1.97 ± 0.41 | 0.203 |
| SUVmean | 0.45 ± 0.08 | 0.45 ± 0.10 | 0.759 |
| GLG (ml) | 332.18 ± 113.09 | 279.59 ± 118.74 | 0.118 |
Note: Values are presented as mean ± SD.
Abbreviations: GLG, global lung glycolysis; HD, high dose region; LD, low dose region; nRP, non‐radiation pneumonitis; RP, radiation pneumonitis; RT, radiotherapy; SUV, standard uptake value.
p < 0.05.
FIGURE 3.

The inflammatory changes of the high‐dose (HD) region in fluorine‐18‐fluorodeoxyglucose (18F‐FDG) positron emission tomography (PET)/computed tomography (CT) after radiotherapy in one esophageal cancer patient with radiation pneumonitis (RP). (A) RP with linear infiltration changes interpreted in CT images (blue arrow and red arrow). (B) Increased 18F‐FDG uptake of the left lung (red arrow) and right lung (blue arrow) in PET images. (C) Integration of the lung dose‐volume in RT planning and volume‐based parameters in PET/CT. The yellow line is 5 Gy isodose curve. The blue line is the right HD region. The red line is the left HD region. The inflammatory changes of the HD region can be quantified in the left lung (SUVmax 2.43, SUVmean 0.73, GLG 368.27 ml) and right lung (SUVmax 2.82, SUVmean 1.13, GLG 472.9 ml). GLG, global lung glycolysis; RP, radiation pneumonitis; SUVmax, SUVmean, maximum and minimum standardized uptake values
Table 4 shows the post‐RT inflammatory changes and the RT dose between RP and nRP lungs. The post‐RT SUVmax (2.78 vs. 2.07, p = 0.000) and post‐RT SUVmean (0.64 vs. 0.52, p = 0.015) of the HD regions in RP lungs were significantly higher than those of the HD regions in nRP lungs. However, there were no significant differences in the GLG of the HD regions between RP and nRP lungs. The MLD (10.15 Gy vs. 8.11 Gy, p = 0.041), lung V5 (49.78% vs. 38.07%, p = 0.010), and lung V10 (32.25% vs. 24.71%, p = 0.017) of the RP lungs were significantly higher than for nRP lungs.
TABLE 4.
Comparison of post‐RT inflammatory changes and RT dose between 30 RP and 22 nRP lungs
| Parameter | RP lungs (n = 30) | nRP lungs (n = 22) | p value |
|---|---|---|---|
| Post‐RT inflammatory changes in HD region | |||
| SUVmax | 2.78 ± 0.64 | 2.07 ± 0.27 | 0.000* |
| SUVmean | 0.64 ± 0.20 | 0.52 ± 0.10 | 0.015* |
| GLG (ml) | 422.43 ± 204.77 | 336.26 ± 155.18 | 0.104 |
| RT dose of lung | |||
| Mean lung dose (Gy) | 10.15 ± 3.88 | 8.11 ± 2.83 | 0.041* |
| V5 (%) | 49.78 ± 17.69 | 38.07 ± 11.86 | 0.010* |
| V10 (%) | 32.25 ± 12.20 | 24.71 ± 8.80 | 0.017* |
| V15 (%) | 22.38 ± 10.01 | 17.43 ± 7.81 | 0.060 |
| V20 (%) | 16.32 ± 8.47 | 13.24 ± 6.68 | 0.165 |
| V25 (%) | 12.49 ± 7.30 | 10.21 ± 5.69 | 0.230 |
| V30 (%) | 9.39 ± 6.10 | 7.73 ± 4.78 | 0.293 |
Note: Values are presented as mean ± SD. V x , percentage of the total organ volume exceeding a radiation dose of x (Gy).
Abbreviations: GLG, global lung glycolysis; HD, high dose region; nRP, nonradiation pneumonitis; RP, radiation pneumonitis; RT, radiotherapy; SUV, standard uptake value.
p < 0.05.
ROC curve analysis, AUCs, and cut‐off values
The sensitivity, specificity, PPV, NPV, and AUC of post‐RT inflammatory changes and RT dose are presented in Table 5. In the post‐RT inflammatory changes, the single most sensitive predictor was GLG (83.33%), and the most specific, best positive predictor and best negative predictor was SUVmax (specificity 86.36%, PPV 88.90%, NPV 76.00%). The AUCs of post‐RT SUVmax, post‐RT SUVmean, and post‐RT GLG of the HD regions were 0.852 (p = 0.000, 95% confidence interval [CI] 0.719–0.931), 0.667 (p = 0.025, 95% CI 0.523–0.792), and 0.668 (p = 0.029, 95% CI 0.524–0.793), respectively, for discriminating the RP and nRP lungs (Figure 4). The differences of areas in the AUC between post‐RT SUVmax and post‐RT SUVmean, post‐RT SUVmax and post‐RT GLG, and post‐RT SUVmean and post‐RT GLG were 0.179 (p = 0.020), 0.179 (p = 0.038), and 0.0007 (p = 0.993), respectively. An ROC analysis of RP demonstrated that the AUC for post‐RT SUVmax was greater than those for post‐RT SUVmean or post‐RT GLG. Thus, the optimal cut‐off value of post‐RT SUVmax was 2.28.
TABLE 5.
Sensitivity, specificity, PPV, NPV, and AUC of post‐RT inflammatory changes and RT dose used in 30 RP and 22 nRP lungs
| Sensitivity % (95% CI) | Specificity % (95% CI) | PPV % (95% CI) | NPV % (95% CI) | AUC % (95% CI) | |
|---|---|---|---|---|---|
| Post‐RT inflammatory changes in HD region | |||||
| UVmax | 80.00 (61.4–92.3) | 86.36 (65.1–97.1) | 88.9 (73.4–95.9) | 76.0 (60.3–86.8) | 84.6 (71.9–93.1) |
| SUVmean | 60.00 (40.6–77.3) | 72.73 (49.8–89.3) | 75.0 (58.8–86.3) | 57.1 (44.5–68.9) | 66.7 (52.3–79.2) |
| GLG | 83.33 (65.3–94.4) | 54.55 (32.2–75.6) | 71.4 (60.6–80.2) | 70.6 (49.7–85.3) | 66.8 (50.4–79.3) |
| RT dose of lung | |||||
| Mean lung dose | 63.33 (43.9–80.1) | 72.73 (49.8–89.3) | 76.0 (60.3–86.8) | 59.3 (46.0–71.3) | 66.5 (52.1–79.0) |
| V5 | 60.00 (40.6–77.3) | 81.82 (59.7–94.8) | 81.8 (63.9–92.0) | 60.0 (48.1–70.8) | 72.7 (58.6–84.1) |
| V10 | 73.33 (54.1–87.7) | 63.64 (40.7–82.8) | 73.3 (60.3–83.3) | 63.6 (47.2–77.4) | 71.1 (56.9–82.9) |
Note: Sensitivity = TP/TP + FN, specificity = TN/TN + FP, PPV = TP/TP + FP, NPV = TN/TN + FN. V x , percentage of the total organ volume exceeding a radiation dose of x (Gy).
Abbreviations: AUC, area under the curve; CI, confidence interval; GLG, global lung glycolysis; HD, high‐dose region; NPV, negative predictive value; PPV, positive predictive value; nRP, nonradiation pneumonitis; RP, radiation pneumonitis; RT, radiotherapy; SUV, standard uptake value.
FIGURE 4.

Comparison of area under the receiver operating characteristic curve of post‐RT SUVmax, post‐RT SUVmean, and post‐RT GLG of high‐dose regions for discriminating between RP and nRP lungs. GLG, global lung glycolysis; MLD, mean lung dose; nRP, nonradiation pneumonitis; RP, radiation pneumonitis; RT, radiotherapy; SUVmax, SUVmean, maximum and minimum standardized uptake values; V x , percentage of the total organ volume exceeding a radiation dose of x (Gy)
In the RT dose to lung, the single most sensitive and best negative index was V10 (sensitivity 73.33%, NPV 63.60%), and the most specific and best positive index was V5 (specificity 81.82%, PPV 81.80%) (Table 4). The AUCs of MLD, lung V5, and lung V10 were 0.665 (p = 0.031, 95% CI 0.521–0.790), 0.727 (p = 0.001, 95% CI 0.586–0.841), and 0.711 (p = 0.003, 95% CI 0.569–0.829), respectively, for discriminating between the RP and nRP lungs (Figure 5). The differences of areas in the AUC between MLD and lung V5, MLD and V10, and lung V5 and V10 were 0.062 (p = 0.070), 0.046 (p = 0.063), and 0.015 (p = 0.609), respectively. An ROC analysis of RP demonstrated that the AUC for lung V5 was greater than those for MLD or lung V10. The optimal cut‐off value of lung V5 was 47.14%.
FIGURE 5.
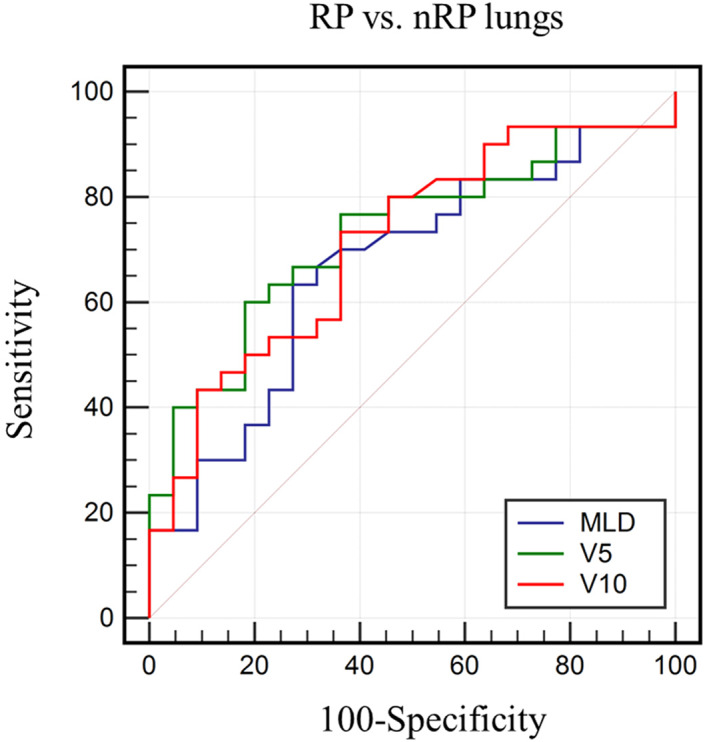
Comparison of area under the receiver operating characteristic curve of mean lung dose (MLD), lung V5, and lung V10 for discriminating between RP and nRP lungs. nRP, nonradiation pneumonitis; RP, radiation pneumonitis; V x , percentage of the total organ volume exceeding a radiation dose of x (Gy)
DISCUSSION
Increased 18F‐FDG uptake occurs not only in tumor cells with upregulated glucose transporter but also in the inflammatory process of normal tissue with cellular hypermetabolism. 27 In recent years, several studies have used 18F‐FDG PET/CT to assess and quantify the inflammation of lung tissue after RT for thoracic cancers. 21 , 28 Our study assessed lung inflammation between HD and LD regions by integrating 18F‐FDG PET/CT with VBA in esophageal cancer patients undergoing dynamic arc‐based RT. We found that the SUVmax, SUVmean, and GLG increased significantly in the HD regions of RP lungs between pre‐ and post‐RT. The present study indicated that the post‐RT SUVmax > 2.28 of HD regions lungs may be a potential indicator of RP and lung V5 can be less than 47.14% to prevent RP.
Several studies have demonstrated that 18F‐FDG PET/CT could be used to evaluate RP after RT. 9 , 29 , 30 Yue et al. 24 found that the changes of SUVmax, SUVmean, and GLG in lungs could detect the severity of RP during the first 6 months after treatment. Abdulla et al. 16 indicated that SUVmean and GLG in lung parenchyma could be potential biomarkers to quantify RP after thoracic RT in lung cancer. De Ruysscher et al. 31 found that the SUVmax is highly correlated with clinical radiation‐induced lung toxicity during the first week of thoracic RT. In the abovementioned studies, the analysis of the volume of interests was divided into the affected lung, the nonaffected lung, or the global lung volume to measure the inflammatory changes. However, the nonaffected lung would still receive LD radiation ≧5 Gy during RT for lung cancer and esophageal cancer. Numerous studies have reported that the lung V5 might reach as high as 40–60% in esophageal cancer, which indicates that 40–60% of the lung volume might receive absorbed doses of ≧5 Gy. LD radiation could be a significant predictor of RP. 6 , 7 , 32 Based on the VBA, 17 the present study used the 5 Gy isodose curve to define the HD (≧5 Gy) and LD (<5 Gy) regions in the lung volume to assess the relationship between inflammatory changes and absorbed dose. There were statistically significant increases in the SUVmax, SUVmean, and GLG of HD regions between pre‐ and post‐RT. Furthermore, we found that there were no statistically significant increases in the SUVmax, SUVmean, and GLG of LD regions between pre‐ and post‐RT.
Researchers have found that radiation‐induced lung inflammation may develop after the lungs received higher radiation doses. 4 , 33 Radiographically evident changes are uncommon when the total radiation dose delivered is less than 30 Gy, but they are almost always seen with doses higher than 40 Gy. 34 , 35 Furthermore, Zhang et al. 19 showed that there was a significant difference in the SUVmean of the lungs with RP group received more than 35 Gy for nonsmall‐cell lung cancer patients. It should be noted that several studies have evaluated patients with symptomatic RP (≥ grade 2) and asymptomatic RP by using volume‐based 18F‐FDG PET. 19 , 24 Yue et al. 24 found the cut‐off values of SUVmax, SUVmean, and GLG of 4.54, 0.78, and 2295, respectively, after RT predicted later development of symptomatic RP (≥ grade 2). The present study found that there were significant differences between pre‐ and post‐RT SUVmax, SUVmean, and GLG of the HD regions in RP lungs. We found the optimal cut‐off values of post‐RT SUVmax, post‐RT SUVmean, and post‐RT GLG were 2.28, 0.56, and 287.65 for detection of RP, respectively. The cut‐off values in this study were lower than those of Yue et al. The main reason for this was probably that we aimed to detect asymptomatic and symptomatic RP (≥ grade 1) while they detected symptomatic RP (≥ grade 2), therefore the cut‐off value might be more sensitive to detect asymptomatic RP. Our study showed that post‐RT SUVmax with the highest AUC has a sensitivity of 80% and a specificity of 86.36%. Post‐RT SUVmax >2.28 could be used as an early indicator for RP with grade ≥1.
It is common to assess the relationship between radiation absorbed dose and the risk of symptomatic RP. Graham et al. 36 indicated that the incidence of grade ≥2 RP was associated with the V20. Tonison et al. 37 found that the lung V20 should be kept below 23% to decrease the incidence of symptomatic RP. Wang et al. 7 demonstrated that lung V5 was highly related to the risk of RP, and the risks of V5 < 42% and V5 > 42% causing RP within 1 year were 3% and 38%, respectively. Pinnix et al. 6 noted that a lung V5 exceeding 55% was associated with the maximum likelihood ratio for RP. Jo et al. 38 showed a statistically significant association between the development of grade 2–3 RP and pulmonary dosimetric parameters, including lung V5, V10, V15, V20, V25, and MLD. The AUC value was highest for V5. However, we evaluated changes of lung dose and inflammatory changes in patients with grade ≥1 RP versus nRP to detect the presence of RP at the earlier stage. The results of the present study revealed that there were significant differences between RP and nRP in MLD, lung V5, and lung V10. However, there were no significant differences for lung V15, V20, and V25. Lung V5 has the highest AUC, with a sensitivity of 60.00% and specificity of 81.82%, similar to the results of the previous study. We recommend limiting V5 to ≦47.14% to decrease the incidence of grade ≥1 RP. Additionally, it was possible to define the HD and LD regions to assess RP by using the 5 Gy isodose in our study.
There were some limitations in this study. First, this study was a retrospective pilot study and we only analyzed the existing clinical data. Most esophageal cancer patients did not regularly have 18F‐FDG PET/CT scans within 3 months after RT, which resulted in the relatively small sample size in this study. Therefore, larger prospective studies with more patients are needed to verify the optimal cut‐off value for RP. Second, the interval time between completion of RT and post‐RT PET/CT scans ranged from 21 to 89 days. The degree of metabolism may change in different stages of the inflammatory process. The interval time of PET/CT scans could be standardized in a future study. Third, the two PET/CT scans were performed before and after RT treatment, therefore the lung volume might change in different PET/CT scans, somehow leading to the GLG changing. Finally, the fusion and registration of simulation CT images and PET/CT images were based on the experience of the operators in this study. There might be some inconsistencies in the manual operation.
CONCLUSION
This study successfully integrated 18F‐FDG PET/CT with VBA to assess RP in esophageal cancer patients undergoing dynamic arc‐based RT. The post‐RT SUVmax and post‐RT SUVmean of HD (≧5 Gy) regions can be used to evaluate RP. The post‐RT SUVmax > 2.28 of HD regions and lung V5 > 47.14% might be potential indicators of RP. 18F‐FDG PET/CT is a promising tool to detect RP for esophageal cancer patients treated with arc‐based RT.
FUNDING INFORMATION
This work was partly supported by Ministry of Science and Technology, Taiwan (#MOST 109‐2314‐B‐010‐023‐MY3), and the National Yang Ming Chiao Tung University Far Eastern Memorial Hospital Joint Research Program (#NYCU‐FEMH 105FN04 and 106DN02).
CONFLICT OF INTEREST
The authors declare no competing interests.
ETHICS STATEMENT
The institutional review board of Far Eastern Memorial Hospital (No. 108069‐E) approved this retrospective study and waived the need for written informed consent.
Hsu C‐X, Lin K‐H, Shueng P‐W, Wu Y‐W, Tsai W‐T, Chang C‐H, et al. Integrating 18F‐FDG PET/CT with lung dose‐volume for assessing lung inflammatory changes after arc‐based radiotherapy for esophageal cancer: A pilot study. Thorac Cancer. 2022;13(22):3114–3123. 10.1111/1759-7714.14661
Funding information Ministry of Science and Technology, Taiwan, Grant/Award Number: MOST 109‐2314‐B‐010‐023‐MY3; National Yang Ming Chiao Tung University Far Eastern Memorial Hospital Joint Research Program, Grant/Award Numbers: NYCU‐FEMH 105FN04, 106DN02
Contributor Information
Shan‐Ying Wang, Email: sywang201@gmail.com.
Tung‐Hsin Wu, Email: tung@ym.edu.tw.
DATA AVAILABILITY STATEMENT
The datasets used and/or analyzed during the current study are available from the corresponding author on reasonable request.
REFERENCES
- 1. Jain V, Berman AT. Radiation pneumonitis: old problem, new tricks. Cancers. 2018;10(7):222. [DOI] [PMC free article] [PubMed] [Google Scholar]
- 2. Cui Z, Tian Y, He B, Li H, Li D, Liu J, et al. Associated factors of radiation pneumonitis induced by precise radiotherapy in 186 elderly patients with esophageal cancer. Int J Clin Exp Med. 2015;8(9):16646–51. [PMC free article] [PubMed] [Google Scholar]
- 3. Tanabe S, Myojin M, Shimizu S, Fujino M, Takahashi H, Shirato H, et al. Dose‐volume analysis for respiratory toxicity in intrathoracic esophageal cancer patients treated with definitive chemoradiotherapy using extended fields. J Radiat Res. 2013;54(6):1085–94. [DOI] [PMC free article] [PubMed] [Google Scholar]
- 4. Guerrero T, Johnson V, Hart J, Pan T, Khan M, Luo D, et al. Radiation pneumonitis: local dose versus [18F]‐fluorodeoxyglucose uptake response in irradiated lung. Int J Radiat Oncol Biol Phys. 2007;68(4):1030–5. [DOI] [PubMed] [Google Scholar]
- 5. Fajardo LF, Berthrong M, Anderson RE. Radiation pathology. J Clin Pathol. 2002;55(6):480. [Google Scholar]
- 6. Pinnix CC, Smith GL, Milgrom S, Osborne EM, Reddy JP, Akhtari M, et al. Predictors of radiation pneumonitis in patients receiving intensity modulated radiation therapy for Hodgkin and non‐Hodgkin lymphoma. Int J Radiat Oncol Biol Phys. 2015;92(1):175–82. [DOI] [PMC free article] [PubMed] [Google Scholar]
- 7. Wang S, Liao Z, Wei X, Liu HH, Tucker SL, Hu CS, et al. Analysis of clinical and dosimetric factors associated with treatment‐related pneumonitis (TRP) in patients with non‐small‐cell lung cancer (NSCLC) treated with concurrent chemotherapy and three‐dimensional conformal radiotherapy (3D‐CRT). Int J Radiat Oncol Biol Phys. 2006;66(5):1399–407. [DOI] [PubMed] [Google Scholar]
- 8. Ben‐Haim S, Ell P. 18F‐FDG PET and PET/CT in the evaluation of cancer treatment response. J Nucl Med. 2009;50(1):88–99. [DOI] [PubMed] [Google Scholar]
- 9. Stumpe KD, Dazzi H, Schaffner A, von Schulthess GK. Infection imaging using whole‐body FDG‐PET. Eur J Nucl Med. 2000;27(7):822–32. [DOI] [PubMed] [Google Scholar]
- 10. Mok GS, Choi FP, Chu WC. Actinomycosis imitating parotid cancer with metastatic lymph nodes in FDG PET/CT. Clin Nucl Med. 2011;36(4):309–10. [DOI] [PubMed] [Google Scholar]
- 11. Pennathur A, Gibson MK, Jobe BA, Luketich JD. Oesophageal carcinoma. The Lancet. 2013;381(9864):400–12. [DOI] [PubMed] [Google Scholar]
- 12. Schreurs LMA, Janssens ACJW, Groen H, Fockens P, van Dullemen HM, van Berge Henegouwen MI, et al. Value of EUS in determining curative resectability in reference to CT and FDG‐PET: the optimal sequence in preoperative staging of esophageal cancer? Ann Surg Oncol. 2016;23(5):1021–8. [DOI] [PMC free article] [PubMed] [Google Scholar]
- 13. Han S, Kim YJ, Woo S, Suh CH, Lee JJ. Prognostic value of volumetric parameters of pretreatment 18F‐FDG PET/CT in esophageal cancer: a systematic review and meta‐analysis. Clin Nucl Med. 2018;43(12):887–94. [DOI] [PubMed] [Google Scholar]
- 14. Castillo R, Pham N, Castillo E, Aso‐Gonzalez S, Ansari S, Hobbs B, et al. Pre–radiation therapy fluorine 18 fluorodeoxyglucose PET helps identify patients with esophageal cancer at high risk for radiation pneumonitis. Radiology. 2015;275(3):822–31. [DOI] [PMC free article] [PubMed] [Google Scholar]
- 15. Hart JP, McCurdy MR, Ezhil M, Wei W, Khan M, Luo D, et al. Radiation pneumonitis: correlation of toxicity with pulmonary metabolic radiation response. Int J Radiat Oncol Biol Phys. 2008;71(4):967–71. [DOI] [PMC free article] [PubMed] [Google Scholar]
- 16. Abdulla S, Salavati A, Saboury B, Basu S, Torigian DA, Alavi A. Quantitative assessment of global lung inflammation following radiation therapy using FDG PET/CT: a pilot study. Eur J Nucl Med Mol Imaging. 2014;41(2):350–6. [DOI] [PubMed] [Google Scholar]
- 17. Lin K‐H, Hsu C‐X, Wang S‐Y, Mok GSP, Chang C‐H, Tien H‐J, et al. Volume‐based algorithm of lung dose optimization in novel dynamic arc radiotherapy for esophageal cancer. Sci Rep. 2021;11(1):4360. [DOI] [PMC free article] [PubMed] [Google Scholar]
- 18. Anthony GJ, Cunliffe A, Castillo R, Pham N, Guerrero T, Armato SG 3rd, et al. Incorporation of pre‐therapy (18) F‐FDG uptake data with CT texture features into a radiomics model for radiation pneumonitis diagnosis. Med Phys. 2017;44(7):3686–94. [DOI] [PMC free article] [PubMed] [Google Scholar]
- 19. Zhang Y, Yu Y, Yu J, Fu Z, Liu T, Guo S. 18FDG PET‐CT standardized uptake value for the prediction of radiation pneumonitis in patients with lung cancer receiving radiotherapy. Oncol Lett. 2015;10(5):2909–14. [DOI] [PMC free article] [PubMed] [Google Scholar]
- 20. Rice TW, Blackstone EH, Rusch VW. 7th edition of the AJCC Cancer Staging Manual: esophagus and esophagogastric junction. Ann Surg Oncol. 2010;17(7):1721–4. [DOI] [PubMed] [Google Scholar]
- 21. Jahangiri P, Pournazari K, Torigian DA, Werner TJ, Swisher‐McClure S, Simone CB, et al. A prospective study of the feasibility of FDG‐PET/CT imaging to quantify radiation‐induced lung inflammation in locally advanced non‐small cell lung cancer patients receiving proton or photon radiotherapy. Eur J Nucl Med Mol Imaging. 2019;46(1):206–16. [DOI] [PubMed] [Google Scholar]
- 22. National Cancer Institute NIoH, US Department of Health and Human Services . Common Terminology Criteria for Adverse Events (CTCAE), Version 4.0. NIH publication 09–7473. Published May 29, 2009; Revised June 14, 2010. http://evs.nci.nih.gov/ftp1/CTCAE/CTCAE_4.03_2010-06-14_QuickReference_5x7.pdf. Accessed March 16, 2015.
- 23. Ajani JA, D'Amico TA, Almhanna K, Bentrem DJ, Besh S, Chao J, et al. Esophageal and esophagogastric junction cancers, version 1. J Natl Compr Canc Netw. 2015;13(2):194–227. [DOI] [PubMed] [Google Scholar]
- 24. Yue J, McKeever M, Sio TT, Xu T, Huo J, Shi Q, et al. Association of lung fluorodeoxyglucose uptake with radiation pneumonitis after concurrent chemoradiation for non‐small cell lung cancer. Clin Transl Radiat Oncol. 2017;4:1–7. [DOI] [PMC free article] [PubMed] [Google Scholar]
- 25. Hong JH, Kim HH, Han EJ, Byun JH, Jang HS, Choi EK, et al. Total lesion glycolysis using (1)(8)F‐FDG PET/CT as a prognostic factor for locally advanced esophageal cancer. J Korean Med Sci. 2016;31(1):39–46. [DOI] [PMC free article] [PubMed] [Google Scholar]
- 26. Youden WJ. Index for rating diagnostic tests. Cancer. 1950;3(1):32–5. [DOI] [PubMed] [Google Scholar]
- 27. Metser U, Even‐Sapir E. Increased (18)F‐fluorodeoxyglucose uptake in benign, nonphysiologic lesions found on whole‐body positron emission tomography/computed tomography (PET/CT): accumulated data from four years of experience with PET/CT. Semin Nucl Med. 2007;37(3):206–22. [DOI] [PubMed] [Google Scholar]
- 28. Torigian D, Dam V, Chen X, Saboury B, Udupa J, Rashid A, et al. In vivo quantification of pulmonary inflammation in relation to emphysema severity via partial volume corrected18F‐FDG‐PET using computer‐assisted analysis of diagnostic chest CT. Hell J Nucl Med. 2013;16:12–8. [DOI] [PubMed] [Google Scholar]
- 29. Petit SF, van Elmpt WJ, Oberije CJ, Vegt E, Dingemans AM, Lambin P, et al. [18F]fluorodeoxyglucose uptake patterns in lung before radiotherapy identify areas more susceptible to radiation‐induced lung toxicity in non‐small‐cell lung cancer patients. Int J Radiat Oncol Biol Phys. 2011;81(3):698–705. [DOI] [PubMed] [Google Scholar]
- 30. Hicks RJ, Mac Manus MP, Matthews JP, Hogg A, Binns D, Rischin D, et al. Early FDG‐PET imaging after radical radiotherapy for non‐small‐cell lung cancer: inflammatory changes in normal tissues correlate with tumor response and do not confound therapeutic response evaluation. Int J Radiat Oncol Biol Phys. 2004;60(2):412–8. [DOI] [PubMed] [Google Scholar]
- 31. De Ruysscher D, Houben A, Aerts HJ, Dehing C, Wanders R, Ollers M, et al. Increased (18)F‐deoxyglucose uptake in the lung during the first weeks of radiotherapy is correlated with subsequent radiation‐induced lung toxicity (RILT): a prospective pilot study. Radiother Oncol. 2009;91(3):415–20. [DOI] [PubMed] [Google Scholar]
- 32. Wang L, Li C, Meng X, Li C, Sun X, Shang D, et al. Dosimetric and radiobiological comparison of external beam radiotherapy using simultaneous integrated boost technique for esophageal cancer in different location. Front Oncol. 2019;9:674–4. [DOI] [PMC free article] [PubMed] [Google Scholar]
- 33. McCurdy MR, Castillo R, Martinez J, Al Hallack MN, Lichter J, Zouain N, et al. [18F]‐FDG uptake dose–response correlates with radiation pneumonitis in lung cancer patients. Radiother Oncol. 2012;104(1):52–7. [DOI] [PMC free article] [PubMed] [Google Scholar]
- 34. Libshitz HI, Southard ME. Complications of radiation therapy: the thorax. Semin Roentgenol. 1974;9(1):41–9. [DOI] [PubMed] [Google Scholar]
- 35. Marks LB, Spencer DP, Bentel GC, Ray SK, Sherouse GW, Sontag MR, et al. The utility of SPECT lung perfusion scans in minimizing and assessing the physiologic consequences of thoracic irradiation. Int J Radiat Oncol Biol Phys. 1993;26(4):659–68. [DOI] [PubMed] [Google Scholar]
- 36. Graham MV, Purdy JA, Emami B, Harms W, Bosch W, Lockett MA, et al. Clinical dose‐volume histogram analysis for pneumonitis after 3D treatment for non‐small cell lung cancer (NSCLC). Int J Radiat Oncol Biol Phys. 1999;45(2):323–9. [DOI] [PubMed] [Google Scholar]
- 37. Tonison JJ, Fischer SG, Viehrig M, Welz S, Boeke S, Zwirner K, et al. Radiation pneumonitis after intensity‐modulated radiotherapy for esophageal cancer: institutional data and a systematic review. Sci Rep. 2019;9(1):2255–5. [DOI] [PMC free article] [PubMed] [Google Scholar]
- 38. Jo I‐Y, Kay C‐S, Kim J‐Y, Son S‐H, Kang Y‐N, Jung J‐Y, et al. Significance of low‐dose radiation distribution in development of radiation pneumonitis after helical‐tomotherapy‐based hypofractionated radiotherapy for pulmonary metastases. J Radiat Res. 2013;55(1):105–12. [DOI] [PMC free article] [PubMed] [Google Scholar]
Associated Data
This section collects any data citations, data availability statements, or supplementary materials included in this article.
Data Availability Statement
The datasets used and/or analyzed during the current study are available from the corresponding author on reasonable request.