

Summary
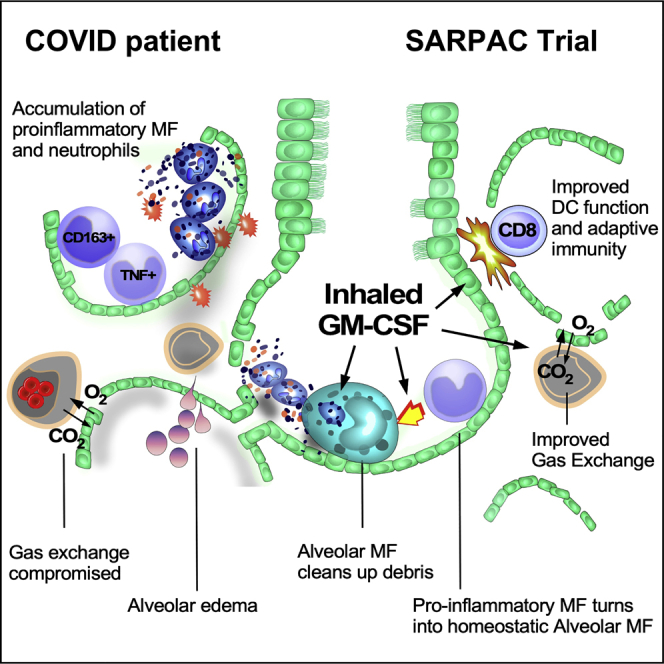
GM-CSF promotes myelopoiesis and inflammation, and GM-CSF blockade is being evaluated as a treatment for COVID-19-associated hyperinflammation. Alveolar GM-CSF is, however, required for monocytes to differentiate into alveolar macrophages (AMs) that control alveolar homeostasis. By mapping cross-species AM development to clinical lung samples, we discovered that COVID-19 is marked by defective GM-CSF-dependent AM instruction and accumulation of pro-inflammatory macrophages. In a multi-center, open-label RCT in 81 non-ventilated COVID-19 patients with respiratory failure, we found that inhalation of rhu-GM-CSF did not improve mean oxygenation parameters compared with standard treatment. However, more patients on GM-CSF had a clinical response, and GM-CSF inhalation induced higher numbers of virus-specific CD8 effector lymphocytes and class-switched B cells, without exacerbating systemic hyperinflammation. This translational proof-of-concept study provides a rationale for further testing of inhaled GM-CSF as a non-invasive treatment to improve alveolar gas exchange and simultaneously boost antiviral immunity in COVID-19. This study is registered at ClinicalTrials.gov (NCT04326920) and EudraCT (2020-001254-22).
Keywords: SARPAC, alveolar macrophage, GM-CSF, sargramostim, COVID-19, virus, RCT, oxygenation, leukine, CITE-seq
Graphical abstract
Highlights
-
•
Lack of alveolar macrophages and defective GM-CSF instruction in COVID-19 patients
-
•
Inhaled GM-CSF in COVID-19 patients is safe
-
•
Inhaled GM-CSF may improve oxygenation
-
•
Inhaled GM-CSF boosts virus-specific T cell responses
GM-CSF is crucial for alveolar macrophages that control alveolar homeostasis. Bosteels et al. demonstrate that the alveolar space in COVID-19 patients is devoid of alveolar macrophages and marked by defective GM-CSF instruction. They show that inhalation of rhu-GM-CSF is safe, improved oxygenation parameters, and boosted virus-specific immune responses.
Introduction
Gas exchange in the lungs occurs over a thin alveolocapillary membrane that is an easy portal of entry for bloodborne infection. Tissue-resident alveolar macrophages (TRAMs) adhere to and crawl on alveolar epithelial cells and in this exposed position continuously capture, conceal, and neutralize pathogens from inhaled air, without causing inflammation.1,2,3 Granulocyte-macrophage colony-stimulating factor (GM-CSF) provides the instructive signal that programs fetal monocytes to become homeostatic TRAMs in the alveolar niche in the first days of life.4,5,6,7,8 These TRAMs then self-maintain with only minimal input from circulating monocytes,5,9,10 but severe inflammatory insults can, however, temporarily deplete TRAMs and recruit monocytes that can later develop into long-lived recruited recruited AMs, a process again requiring epithelial derived GM-CSF.1,4,11,12,13
In patients with severe coronavirus disease 2019 (COVID-19), infection with SARS-CoV-2 virus has profound effects on alveolar homeostasis, resulting in hypoxemia through impaired alveolocapillary gas exchange, sometimes progressing to the acute respiratory distress syndrome (ARDS).14,15 The initial viral replication phase that occurs in lung alveolar epithelial cells (AECs), alveolar macrophages (AMs), and capillary endothelial cells is followed by a second hyperinflammatory phase in which alveolar homeostasis is severely disturbed, marked by recruitment of dysregulated myeloid cells, inflammatory macrophages, and neutrophils,16,17 leading to a state of immune silence hampering T cell activation.18,19,20,21,22,23,24 Systemic cytokine release can cause profound fever, overproduction of ferritin and acute-phase proteins, and progressive organ dysfunction.17,25,26,27,28,29 Despite the well-established beneficial effects of local epithelial cell-derived GM-CSF in lung homeostasis and boosting of dendritic cell (DC) function,30,31,32 GM-CSF has been proposed as one of the cytokines that could promote hyperinflammation when released systemically from activated T cells in severe COVID-19, particularly in the elderly.21,33 Indeed, in some diseases, GM-CSF promotes emergency myelopoiesis, providing the progenitors of pro-inflammatory macrophages, and primes neutrophils for neutrophil extracellular trap-osis (NETosis).34,35 The precise contribution of local versus systemic GM-CSF in COVID-19 disease is therefore unclear at present, and unraveling the tissue-specific role of this complex cytokine could reveal if GM-CSF function should be inhibited or boosted to improve disease outcome.36,37
In COVID-19 pneumonia, we found that TRAMs were replaced by recruited macrophages with various inflammatory profiles and different stages of development. Human COVID-19 lung macrophages are characterized by the loss of an evolutionarily conserved GM-CSF-mediated instruction that drives AM development and prevents the accumulation of pro-inflammatory macrophages in the lung. We therefore initiated a randomized controlled proof-of-concept clinical trial to investigate the feasibility and safety of inhaled sargramostim (rhu-GM-CSF, Leukine) in hospitalized COVID-19 patients with signs of hypoxemia.38 The primary objective was to study the impact and safety of 5 days of GM-CSF inhalation treatment on parameters of alveolar gas exchange, while exploratory and safety analyses included effects of GM-CSF inhalation on antiviral immunity and systemic hyperinflammation. This study is registered online at ClinicalTrials.gov (NCT04326920) and EudraCT (2020-001254-22).
Results
Profound perturbation of the lung macrophage compartment in COVID-19 patients
We profiled mRNA and 277 oligo-conjugated barcoded antibody binding of 223,927 individual bronchoalveolar lavage (BAL) cells from 19 hospitalized patients (Table S1 for demographic and clinical characteristics, Table S2 for details of the single-cell analysis) with COVID-19 (n = 8), non-COVID-19 pulmonary infection (n = 8), or interstitial lung disease (ILD) (n = 1) and control uninfected individuals undergoing diagnostic bronchoscopy (n = 2) (Figure 1A). This analysis revealed 12 distinct cell subsets (Figures 1A and 1B), which were each annotated based on differentially expressed genes and surface proteins (DEGs; DEPs). We identified monocytes (FCN1+VCAN+; CD14+CD244+), macrophages (FABP4+C1QA+; CD64+CD11a+), conventional DCs (FSCN1+FCER1A+CD1c+; HLA-DR+CD86+CD1c+), plasmacytoid DCs (SPIB+LILRA4+; CD162+CD62L+CD304+), B cells (CD79A+MS4A1+; HLA-DR+CD22+), plasma cells (IGHG1+IGHG2+; CD27+CD38+), basophils (TPSB2+GATA2+; CD22+CD151+), T cells (CD3D+CD2+; CD2+CD5+), NK cells (KLRC1+XCL1+; CD7+CD49a+), neutrophils (CXCR1+FCGR3B+; CD16+CD35+), ciliated cells (TTC29+HYDIN+PROM1+; CD133+), and epithelial cells (SFTPD+SFTA2+; CD142+CD26+) (Figures 1A, 1B, and S1). Lymphocytes, monocytes, and neutrophils were enriched in COVID-19 patients and patients with other pulmonary infections compared with healthy control and ILD samples (Figure 1B). A more in-depth analysis of the monocyte and macrophage clusters (55,304 cells) according to published datasets1,39 further divided these into classical monocytes (CCL20+CCL3L1+EGR3+; CD69+CD93+), heat-shock monocytes/macrophages (HSPA1+DNAJB1+HSPA6+), interferon (IFN)-stimulated monocytes/macrophages (IFIT1+CXCL10+RSAD2+), transitional monocytes (CHIT1+CHI3L1+; CD81+CD164+), interstitial macrophages (IMs; SLC40A1+FOLR2+; FOLR2+MERTK+CD163+), and TRAMs (LGALS3+FABP4+MME+; CD10+CD204+Mac2+) (Figures 1C–1G).
Figure 1.

Profiling of BAL monocyte and macrophage clusters
(A) Schematic overview of the CITE-seq pipeline on BAL cells and UMAP of the proteome- and transcriptome-based clustering.
(B) UMAPs of the annotated BAL monocyte and macrophage clusters in the healthy control group (n = 2; top left), patient with interstitial lung disease (n = 1; top right), patients with non-COVID-19 pulmonary infection (n = 8; bottom left), and COVID-19 patients (n = 8; bottom right).
(C and D) Heatmaps showing the top differentially expressed genes (C) and surface proteins (D) between BAL monocyte and macrophage clusters based on LogFC per cluster. Heatmaps were created by comparing the transcriptome or proteome of each annotated cluster.
(E) UMAP of the annotated BAL monocyte and macrophage clusters.
(F and G) UMAPs representing relative expression of key surface protein (F) and gene (G) annotation markers through CITE-seq on monocyte and macrophage subgroups (blue, low expression; red, high expression). BAL, bronchoalveolar lavage; cDCs, conventional dendritic cells; pDCs, plasmacytoid dendritic cells; NK cells, natural killer cells; UMAP, uniform manifold approximation and projection; CITE-seq, cellular indexing of transcriptomes and epitopes by sequencing.
In patients with COVID-19 and non-COVID-19 pulmonary infection, TRAM proportions were strongly reduced, while IFN-stimulated monocytes and CD163+FOLR2+ IMs40 were enriched compared with healthy controls (HCs) and ILD (Figures 2A–2C). CD163+FOLR2+ IMs and transitioning monocytes were more enriched in COVID-19 pneumonia compared with a non-COVID-19 pneumonia (Figures 2B and 2C). The differentiation process of monocytes and macrophages was modeled using slingshot trajectory inference analysis41 (Figures 2D and 2E), which predicted a trajectory starting from the monocyte cluster differentiating into IFN-stimulated monocytes or transitional monocytes. The transitional monocyte cluster then further bifurcates into CD163+FOLR2+ IMs or TRAMs (Figure 2D). In HCs, the end state of most monocytes/macrophages was the TRAM fate (Figure 2E, left), whereas in COVID-19 patients most recruited monocytes were predicted to differentiate into IFN-stimulated monocytes/macrophages and CD163+FOLR2+ IMs (Figure 2E, right). The presence of recruited CD163+FOLR2+ IMs in the alveolar lumen was also confirmed by immunohistochemistry in a fatal case of COVID-19 (Figure 2F). So, in line with earlier reports,18,20,42 we found that monocytes recruited to the lungs of COVID-19 patients fail to develop into AMs yet accumulate into highly pro-inflammatory monocytes and CD163+FOLR2+ IMs that end up in the alveolar lumen.
Figure 2.

Lack of alveolar macrophages and GM-CSF signature in COVID-19 patients
(A) UMAP of BAL monocytes and macrophages originating from healthy control (light blue; n = 2), patient with interstitial lung disease (dark blue; n = 1), patients with non-COVID-19 pulmonary infection (orange; n = 8), or COVID-19 patients (red; n = 8).
(B) UMAPs of the annotated BAL monocyte and macrophage clusters per patient group.
(C) Relative abundance of monocyte and macrophage clusters per patient group.
(D) Diffusion map and slingshot-mediated trajectory inference starting from monocytes bifurcating either to IFN-stimulated monocytes (1) or via a transitional monocyte state to either CD163+FOLR2+ interstitial macrophages (2) or alveolar macrophages (3).
(E) Diffusion map of the annotated BAL monocytes and macrophages from the healthy control group (left) versus COVID-19 patient group (right).
(F) Immunohistochemistry analysis of CD163 expression on lung section of a patient who succumbed to severe COVID-19.
(G) Schematic overview of mini-bulk microarray setup used on monocytes and macrophages isolated from lungs of WT or Csf2−/− mice after PBS or rGM-CSF treatment.
(H and I) Heatmaps showing the relative expression of the top genes present in the murine GM-CSF-dependent lung macrophage signature (H) and the murine lack-of-GM-CSF lung macrophage signature (I). In the last two columns of each panel, the relative expression of these genes by macrophages sorted from lungs of PND9 Csf2−/− mice treated with PBS (left) or rGM-CSF (right) is shown.
(J) Projection of the murine GM-CSF lung macrophage signature on patient BAL CITE-seq data.
(K) UMAPs representing the expression of two conserved genes between human and mouse that represent a GM-CSF gene signature (PPARg, left UMAP) or a lack-of-GM-CSF gene signature (CXCL10, right UMAP). DC, diffusion component; ILD, interstitial lung disease; rGM-CSF, recombinant granulocyte-macrophage colony-stimulating factor; PBS, phosphate-buffered saline; WT, wild type; PND9, post-natal day 9; TEAEs, treatment emergent adverse events.
Identification of the murine GM-CSF-dependent lung macrophage signature
We then compared human scRNA data to the various stages of mouse AM development, driven by the instructive cytokine GM-CSF.4,5,6,43 We performed microarray analysis on sorted lung monocyte and developing AM populations from lung tissue of C57BL/6 mice at different time points from embryonic to adult life (Figure 2G). First, we focused on the genes that shared three characteristics: they were (1) AM specific and not found in other tissue-resident macrophages,44 (2) lost in GM-CSF-deficient mice (Csf2−/−), and (3) rescued in Csf2−/− mice upon treatment with inhaled GM-CSF. We regarded these genes as reflective of the “murine GM-CSF-dependent lung macrophage signature” (Figure 2H), examples being Ear1, Plet4, Kazald1, and Pparg (Figure 2H). Macrophages sorted from the alveolar lumen of PND9 Csf2−/− mice lacked this GM-CSF-dependent AM signature, but inhaled treatment with recombinant GM-CSF (rGM-CSF) in the early life of Csf2−/− mice restored this gene signature (Figure 2H, right column; Figure S2A). Next, we looked into genes that were (1) upregulated in macrophages in Csf2−/− mice compared with wild-type AMs, but (2) downregulated again upon treatment with inhaled GM-CSF (Figure 2I, right column). These genes thus reflect the lack of GM-CSF instruction and are therefore considered as the “murine lack-of-GM-CSF lung macrophage signature” and include genes driven by type I IFN signaling, such as Cxcl9, Cxcl10, Ifit1, Ifit2, and Rsad2 (Figure 2I). Altogether, this demonstrates not only that (1) GM-CSF is a critical instructive cytokine for murine TRAM differentiation,5,43 but also that (2) lung monocytes develop into pro-inflammatory cells in the absence of GM-CSF, a state that is, however, reversible by inhalation of GM-CSF (Figure S2A).
Analysis of the COVID-19 scRNA-seq dataset suggests impaired GM-CSF instruction
We next compared murine AM differentiation transcriptional states with human COVID-19 single-cell RNA-sequencing (scRNA-seq) datasets. We projected the murine GM-CSF-dependent lung macrophage signature on the patients’ BAL clusters obtained from sequencing data (Figures 2J and S2B–S2E). Genes associated with the presence of GM-CSF (Figures 2H and S2B), as for example, PPARG6 (Figure 2K, left uniform manifold approximation and projection [UMAP]), were highly expressed by human TRAMs found in HCs (Figure 2K, left UMAP; Figure S2D, left). Vice versa, genes upregulated in the absence of GM-CSF (Figures 2I and S2C), such as CXCL10 (Figure 2K, right UMAP), IL18BP, TNFSF13B, and MMP14, were enriched in IFN-stimulated monocytes and CD163+FOLR2+ IMs from COVID-19-infected patients (Figure 2K, right UMAP; Figure S2D, right). In conclusion, these data led us to suspect that mononuclear cells in the lungs of COVID-19 patients lacked evolutionarily conserved GM-CSF instruction, leading to a lack of TRAMs and accumulation of pro-inflammatory monocyte/macrophage populations typically seen in GM-CSF-deficient states (Figure S2E). This provided the rationale for a randomized clinical trial in which inhaled GM-CSF (rhu-GM-CSF, sargramostim, Leukine) was administered to hypoxemic COVID-19 patients, in an attempt to improve alveolar homeostasis, with the underlying hypothesis that such treatment would promote the differentiation of transitional monocytes into AMs, reduce hyperinflammation, and restore the gas-exchange apparatus.
Clinical trial design assessing inhaled GM-CSF treatment
Eighty-one hospitalized COVID-19 patients were included in the Sargramostim in Patients with COVID-19 (acronym SARPAC) trial at five participating sites in Belgium. Enrolled patients had acute hypoxemic respiratory failure (oxygen saturation below 93% on ≥2 L oxygen per minute or a ratio of the partial pressure of oxygen [PaO2] to the fraction of inspired oxygen [FiO2; PaO2:FiO2 ratio] below 350 mm Hg). Patients suspected of profound systemic inflammation (serum ferritin >2,000 μg/L) or already on mechanical ventilation were excluded from participation (full clinical study protocol available in the supplemental information). Eighty-one patients were randomly assigned in a 1:1 ratio to receive 5 days of twice daily 125 μg of inhaled rhu-GM-CSF (sargramostim) on top of standard of care (SOC) or to receive SOC alone (Figure 3).
Figure 3.

Study flowchart
ABG, arterial blood gas
Seventy-three patients reached the evaluable primary endpoint (oxygenation parameters at day 6). Two patients discontinued treatment prematurely, three patients refused arterial puncture at day 6, and another three patients were excluded from analysis because of an error in FiO2 recording. All primary efficacy evaluable patients (n = 73) were included in a modified intention-to-treat analysis. All patients (n = 81) were included in the safety population. No patients discontinued participation because of safety reasons. The patients’ baseline demographic, clinical, and biological characteristics and co-administered medications were broadly similar across both groups (Table 1), with the exception of C-reactive protein (CRP) and IL1RA levels, which were slightly higher in the SOC group.
Table 1.
Baseline characteristics of patients
| SOC (n = 41) | Sargramostim (n = 40) | All patients (n = 81) | p value | |
|---|---|---|---|---|
| Age at randomization | ||||
| Median (IQR), years | 60 (53–69) | 59 (46–68) | 60 (49–69) | nse |
| Age ≥65 years, n (%) | 15 (36.6) | 11 (27.5) | 26 (32.1) | nsa |
| Male gender, n (%) | 25 (61.0) | 26 (65.0) | 51 (63.0) | nsa |
| Ethnicity | ||||
| White, n (%) | 39 (95.1) | 34 (85.0) | 73 (90.1) | nsb |
| Black, n (%) | 0 (0.0) | 4 (10.0) | 4 (4.9) | |
| Arabian, n (%) | 2 (4.9) | 2 (5.0) | 4 (4.9) | |
| BMI, median (IQR) | 27.6 (24.7–33.1) | 28.6 (26.0–33.8) | 28.0 (25.0–33.4) | nse |
| Days since symptom onset, median (IQR) | 10.0 (9.0–13.0) | 11.0 (8.5–14.0) | 11.0 (9.0–13.0) | nse |
| Days since hospitalization, median (IQR) | 3.0 (3.0–5.0) | 3.0 (2.5–4.5) | 3.0 (3.0–5.0) | nse |
| Comorbidity, n (%) | ||||
| Arterial hypertension | 7 (17.1) | 7 (17.5) | 14 (17.3) | nsa |
| Diabetes mellitus | 7 (17.1) | 9 (22.5) | 16 (19.8) | nsa |
| Cardiovascular disease | 1 (2.4) | 0 (0.0) | 1 (1.2) | nsb |
| Chronic kidney disease | 1 (2.4) | 0 (0.0) | 1 (1.2) | nsb |
| Severe liver disease | 0 (0.0) | 0 (0.0) | 0 (0.0) | nsb |
| Chronic lung disease | 0 (0.0) | 0 (0.0) | 0 (0.0) | nsb |
| Cancer | 2 (4.9) | 2 (5.0) | 4 (4.9) | nsb |
| Smoking status, n (%) | ||||
| Current | 3 (7.3) | 0 (0.0) | 3 (3.7) | nsb |
| Former | 16 (39.0) | 18 (45.0) | 34 (42.0) | |
| Concomitant medication at randomization, n (%) | ||||
| Glucocorticoids | 9 (22.0) | 11 (27.5) | 20 (24.7) | nsa |
| Antiviral drugs (remdesivir) | 0 (0.0) | 3 (7.5) | 3 (3.7) | nsb |
| Hydroxychloroquine | 26 (63.4) | 24 (60.0) | 50 (61.7) | nsa |
| Antibiotics | 2 (4.9) | 1 (2.5) | 3 (3.7) | nsb |
| Oxygenation, median (IQR) | ||||
| PaO2/FiO2 ratio (mm Hg) | 297.00 (242.00–319.50) | 291.50 (251.50–329.00) | 295.00 (248.00–328.00) | nse |
| P(A-a)O2 gradient (mm Hg) | 45.55 (38.60–61.75) | 50.15 (39.80–63.75) | 47.65 (38.90–61.75) | nse |
| Lab values, median (IQR) | ||||
| C-reactive protein level (mg/L) | 83.00 (38.40–180.00) | 73.20 (39.10–122.80) | 74.50 (38.75–147.45) | 0.0499e |
| Eosinophil count (×109/L) | 0.02 (0.00–0.09) | 0.01 (0.00–00.10) | 0.02 (0.00–0.10) | nse |
| Lymphocyte count (×109/L) | 0.88 (0.65–1.22) | 1.08 (0.83–1.40) | 1.00 (0.70–1.30) | nse |
| Ferritin (μg/L) | 721.00 (425.00–1,068.00) | 736.50 (446.50–1,063.50 | 721.00 (425.00–1,068.00) | nse |
| D-dimer (nmol/L) | 3.61 (2.39–5.04) | 4.36 (3.12–5.80) | 3.81 (2.79–5.31) | nse |
| Lactate dehydrogenase (μkat/L) | 5.98 (4.31–6.86) | 4.98 (4.14–6.40) | 5.26 (4.21–6.68) | nse |
| Aspartate aminotransferase (μkat/L) | 0.65 (0.57–0.89) | 0.62 (0.44–1.01) | 0.65 (0.48–0.95) | nse |
| Alanine aminotransferase (μkat/L) | 0.57 (0.40–0.92) | 0.59 (0.38–0.86) | 0.58 (0.40–0.89) | nse |
| Creatinine (μmol/L) | 78.68 (68.07–92.82) | 75.14 (68.07–88.40) | 77.35 (68.07–92.82) | nse |
| Biomarkers in serum, median (IQR) | ||||
| IL1RA (ng/mL) | 1,288.00 (905.10–2,350.00) | 839.30 (595.80–1,494.00) | 1,162.00 (678.40–1,806.00) | 0.0260c |
| IL-6 (pg/mL) | 11.54 (4.85–36.84) | 11.47 (4.50–21.73) | 11.54 (4.85–24.90) | nsc |
| IL-8 (pg/mL) | 27.44 (15.91–46.49) | 22.51 (14.14–32.11) | 23.99 (15.91–39.73) | nsc |
| IL-18 (pg/mL) | 150.70 (87.13–198.30) | 101.30 (73.80–164.70) | 131.00 (80.32–184.80) | nsc |
| C5a (ng/mL) | 8.83 (4.52–16.06) | 11.18 (3.91–16.28) | 9.94 (4.37–16.12) | nsc |
| GM-CSF (fg/mL) | 9.12 (6.82–13.39) | 9.13 (7.35–12.42) | 9.12 (7.05–12.71) | nsc |
| TNF (pg/mL) | 14.77 (8.53–25.91) | 16.32 (12.17–20.13) | 14.99 (10.66–22.28) | nsc |
| SOFA score, median (IQR) | 2.0 (1.0–3.0) | 2.0 (1.0–2.0) | 2.0 (1.0–2.0) | nsd |
| Six-category ordinal scale at randomization, no. (%) | ||||
| 3: hospitalized, on non-invasive ventilation or high-flow oxygen devices | 5 (12.2) | 1 (2.5) | 6 (7.4) | nsb |
| 4: hospitalized, requiring supplemental oxygen | 33 (80.5) | 38 (95.0) | 71 (87.7) | |
| 5: hospitalized, not requiring supplemental oxygen | 3 (7.3) | 1 (2.5) | 4 (4.9) | |
Chi-square test.
Fisher’s exact test.
Mann Whitney test.
Wilcoxon test.
t test.
Effect of inhaled GM-CSF on clinical outcome measures
We analyzed the a priori defined primary endpoint of this proof-of-concept trial by examining the gradient between partial pressure of oxygen in the alveolar air and the arterial blood (P(A-a)O2 gradient), which is a marker for alveolar gas exchange and ventilation/perfusion mismatch. When analyzing the continuous comparisons for the P(A-a)O2 gradient, we did not observe better oxygenation in the sargramostim compared with the SOC treatment arm (Table S3). Similarly, a second primary endpoint, the change in the PaO2/FiO2 ratio, often used in the ICU setting in ventilated patients, was also not statistically different between the SOC and the sargramostim group (Table S3). However, the spread and skewing of these oxygenation parameters after 5 days of treatment were more extensive than anticipated in the statistical analysis plan, resulting in a non-parametric distribution. The clinical responder rate represents an additional parameter that can be used in clinical trials where clinical outcome measures are dispersed due to clinical heterogeneity of the study population. The proportion of clinical responders defined by at least 25% improvement in P(A-a)O2 gradient after 5 days of treatment compared with baseline values was higher in the sargramostim group than in the SOC group (15/38 [39.5%] versus 22/35 [62.9%]; p = 0.0459) (Figures 4B and S3A and Table S3). This was also the case when clinical response was defined by a more marked improvement of at least 33% in P(A-a)O2 gradient (10/38 [26.3%] versus 19/35 [54.3%]; p = 0.0147) or at least 50% improvement (6/38 [15.8%] versus 12/35 [34.4%]; p = 0.1023) (Figure 4B and Table S3). The proportion of patients showing at least 25% improvement in the PaO2/FiO2 ratio was not statistically different between groups (11/38 [28.9%] versus 11/35 [31.4%]; p = 0.817) (Figures 4D and S3B and Table S3). No evidence for an enhanced treatment effect of sargramostim could be found in post hoc-specified subgroups (concomitant glucocorticoid use, P(A-a)O2 gradient above or below the median value at randomization, CRP and ferritin level at randomization above or below the median value), although patients’ numbers were too small to draw definitive conclusions (Figure S4).
Figure 4.

Primary endpoint
(A) Absolute change from baseline of P(A-a)O2 gradient (mm Hg) on day 6.
(B) Responder rate of patients with at least 25%, 33%, or 50% improvement in P(A-a)O2 gradient (mm Hg) on day 6 compared with baseline.
(C) Absolute change from baseline of PaO2/FiO2 ratio (mm Hg) on day 6.
(D) Responder rate of patients with at least 25%, 33%, or 50% improvement in PaO2/FiO2 ratio (mm Hg) on day 6 compared with baseline.
In this small proof-of-concept study, no evidence for a treatment effect of sargramostim could be found for any of the supportive endpoints listed in Table S3, including duration of hospital stay, progression to mechanical ventilation or ARDS, and all-cause mortality rate at 4 weeks post-randomization.
GM-CSF inhalation in COVID-19 does not promote hyperinflammation or end-organ damage
Since increased numbers of GM-CSF-producing T cells21 and higher serum GM-CSF concentrations33 were reported in some patients with COVID-19, and since GM-CSF can boost the production of pro-inflammatory cytokines, an a priori defined pharmacodynamic endpoint was used to study if inhaled sargramostim enhanced cytokine-release syndrome. For patients in three selected study sites, we quantified serum concentrations of cytokines, chemokines (IL-1β, IL-1Ra, IL-6, IL-8, IL-10, IL-18, ICAM, C5a, CXCL10, G-CSF, GM-CSF, TNF-α, and IFNγ), and biomarkers (Ang-2, sRAGE, MUC-1, and GDF15) at randomization and at day 6 and compared these with a cohort of age-matched HCs and a cohort of patients with severe COVID-19 and signs of cytokine-release syndrome (Table S4). At randomization, serum concentration of GM-CSF was low in most patients, comparable to HC samples, and not altered after 5 days of treatment (Figure S5A). Principal-component (PC) analysis on pro-inflammatory cytokines clearly separated HCs from severe COVID-19 patients (Figures 5A, left and right, and S5B). After 5 days of sargramostim treatment, PC1 values were significantly lower compared with baseline and overlapped partly with values of HCs (Figure 5A, middle and right). Examined at an individual level, the pro-inflammatory cytokines, comprising both PC1 and PC2, were all significantly increased in COVID-19 patients included in SARPAC at randomization compared with HCs (Figures 5B and S5C). Importantly, these cytokines declined over the next days and were not increased by 5 days of sargramostim (Figures 5B and S5C). Cytokine release promotes complement activation and is an ominous driver of severe COVID-19.17,45 The C5a concentration was higher in COVID-19 patients in our cohort, compared with HCs at randomization, but by day 6 had dropped, independent of sargramostim treatment (Figure S5D). High serum concentrations of ferritin and CRP, and low circulating numbers of lymphocytes and eosinophils, can be signs of cytokine-release syndrome, but between randomization and day 6, virtually all patients demonstrated amelioration of these key laboratory parameters, irrespective of their treatment arm (Table S3).
Figure 5.

Effect of sargramostim on hyperinflammation and end-organ damage
(A) PC analysis of pro-inflammatory cytokines measured in serum of healthy controls (HC; n = 19), patients with severe COVID-19 (n = 39), and patients included in SARPAC at baseline (T1; n = 73) and after 5 days of treatment (T2) with either standard of care (SOC; n = 34) or sargramostim (n = 39).
(B) Cytokines measured in serum of HC (n = 19), SOC (n[T1] = 36; n[T2] = 34), and sargramostim groups (n[T1] = 37; n[T2] = 39) at baseline (T1) and after 5 days of treatment (T2).
(C and D) Percentages of low-density neutrophils (C) and CD14+CD16− monocytes, CD14+CD16+ monocytes, and CD14−CD16+ monocytes (D) in the PBMC fraction at baseline (T1) and after 5 days of treatment (T2).
(E) Surface expression of HLA-DR (MFI) on inflammatory monocytes in the PBMC fraction at baseline (T1) and after 5 days of treatment (T2).
(F–H) Serum levels of sRAGE and MUC1 (F), Ang-2 (G), and GDF15 (H) in HC (n = 16), SOC (n[T1] = 26; n[T2] = 25), and sargramostim groups at baseline (T1; n = 27) and after 5 days of treatment (T2; n = 21). Statistical testing was performed using Kruskal Wallis test with Dunn’s test to correct for multiple comparisons (A–H). Statistical differences are noted as ∗p < 0.05, ∗∗p < 0.01, ∗∗∗p < 0.001, and ∗∗∗∗p < 0.0001.
Systemic GM-CSF has been shown to promote the priming of neutrophils in other forms of ARDS, and low-density CD24+ activated neutrophils46 were seen in higher numbers in our COVID-19 cohort, compared with HCs. Sargramostim treatment did not, however, promote this neutrophil activation state (Figure 5C). GM-CSF is a prototypical growth and maturation factor for DCs, and circulating conventional DCs (cDC2s and cDC3s) and plasmacytoid DCs (pDCs) were depleted in COVID-19 patients at randomization and after 6 days, irrespective of sargramostim treatment (Figure S5E). Systemic GM-CSF promotes emergency hematopoiesis and could be involved in expansion of myelomonocytic cells.25 However, after 6 days of follow-up, there was no increase in the percentage of CD14+ or CD16+ monocytes in patients receiving sargramostim, compared with those in the SOC group (Figure 5D). Downregulation of HLA-DR on monocytes is frequently found in ARDS-associated immunosuppression,47 and we did find evidence of this in our COVID-19 patients at randomization, compared with HCs (Figure 5E). Soluble receptor for advanced glycation end products (sRAGE), released by damaged type I AECs,48 was significantly elevated at baseline in COVID-19 patients; however, it returned to levels seen in HCs after 5 days in both treatment arms (Figure 5F, left). Elevated Mucin-1 (MUC1, KL-6) levels can reflect severe interstitial lung damage, epithelial lung alterations, and regenerative processes secondary to SARS-CoV-2 infection.49 MUC1 serum levels were not increased after 5 days of inhaled sargramostim and even tended to be lower compared with the SOC group (Figure 5F, right). Angiopoietin-2 (Ang-2), a biomarker of endothelial cell injury,50 was significantly increased in the serum of COVID-19 patients, but not altered by sargramostim treatments (Figure 5G). Another marker of end-organ damage, growth differentiation factor-15 (GDF15), has been shown to be an independent predictor of the progression of COVID-19.51 Serum levels of GDF15 did not differ after 5 days of treatment between the SOC and the sargramostim group (Figure 5H). In conclusion, these findings suggest that inhaled GM-CSF in COVID-19 patients does not lead to (1) a cytokine-release syndrome, nor (2) expansion of circulating pro-inflammatory myeloid cells, or (3) elevated levels of markers associated with end-organ damage.
Adverse and serious adverse events were generally balanced between both groups, except for mild epistaxis, which was reported more in the sargramostim group (20.0% versus 4.9% in SOC) (Table 2). Overall, 12 patients died during the study, of which 1 died during the first 6 days and 4 during the first 28 days after randomization. We did not find evidence for differences in mortality between study arms and, if any, mortality was higher in the control group (Table 2).
Table 2.
Safety and most common TEAE and serious TEAEs
| SOC (n = 41) | Sargramostim (n = 40) | Total (n = 81) | p value | |
|---|---|---|---|---|
| Adverse event | ||||
| Patients with ≥1 event, no. (%) | 33 (80.5) | 30 (75.0) | 63 (77.8) | nsa |
| No. of events | 114 | 139 | 253 | |
| Serious adverse event | ||||
| Patients with ≥1 event, no. (%) | 4 (9.8) | 6 (15.0) | 10 (12.3) | nsa |
| No. of events | 13 | 15 | 28 | |
| Adverse events not leading to mortality | ||||
| Infectious disorder (not COVID-19) | 9 (22.0) | 7 (17.5) | 16 (19.8) | nsb |
| Epistaxis | 2 (4.9) | 8 (20.0) | 10 (12.3) | 0.0480b |
| Constipation | 6 (14.6) | 3 (7.5) | 9 (11.1) | nsb |
| Thrombosis | 0 (0.0) | 1 (2.5) | 1 (1.2) | nsb |
| Acute kidney injury | 0 (0.0) | 2 (5.0) | 2 (2.5) | nsb |
| Cardiac disorder | 3 (7.3) | 2 (5.0) | 5 (6.2) | nsb |
| Abnormal liver-function | 0 (0.0) | 1 (2.5) | 1 (1.2) | nsb |
| Anaphylaxis | 0 (0.0) | 0 (0.0) | 0 (0.0) | nsb |
| Mortality at 20 weeks, no. (%) | ||||
| COVID-19 | 1 (2.4) | 0 (0.0) | 1 (1.2) | nsb |
| Infectious disorder (not COVID-19) | 2 (4.9) | 1 (2.5) | 3 (3.7) | nsb |
| Nervous system disorder | 1 (2.4) | 0 (0.0) | 1 (1.2) | nsb |
| Other | 4 (9.8) | 3 (7.5) | 7 (8.6) | nsb |
“Epistaxis” and “constipation” are the preferred terms that have a >10% incidence in the overall population if grades I–II. No terms have >5% incidence in the overall population if grades III–IV. TEAEs, Treatment Emergent Adverse Events.
Chi-square test.
Fisher’s exact test.
GM-CSF inhalation boosts anti-COVID-19 immunity
GM-CSF has significant immune-stimulating effects in models of bacterial and viral lung infection.30,31,52 To investigate whether inhaled GM-CSF altered the cellular and humoral immune response against SARS-CoV-2, we performed high-dimensional flow cytometry on the peripheral blood mononuclear cells (PBMCs) and used UMAP visualization to reduce dimensionality (Figure 6A). Gating on the B cell population (CD20+ cells), we identified eight B cell and plasmablast clusters using signature surface markers (Figures 6A, 6B, and S6A). Compared with HCs, COVID-19 patients included in SARPAC had a significant relative increase in plasmablasts (cluster 8) and tended to have a relative increase in CD11c+ switched memory (SM) B cells (cluster 7) (Figures 6B and 6C). Circulating SM B cells were significantly increased after 5 days of treatment with sargramostim (Figure 6D), whereas the increase in plasmablasts was independent of the treatment arm (Figure S6B). Virus-specific humoral responses assessed by quantifying both IgG and IgA directed against the receptor binding domain (RBD) of the spike (S1) protein and IgG directed against the nucleocapsid protein (NCP) were markedly increased in both the SOC and the sargramostim group after 5 days of treatment (Figure 6E). Similar to the plasmablasts, the observed increases were independent of sargramostim treatment.
Figure 6.

Effect of sargramostim on the circulating B cell compartment
(A) UMAP plot of CD20+ PBMCs depicting manual annotation of B cell clusters obtained from HCs (n = 20) and SARPAC study patients at baseline (T1; n = 35) and after 5 days of treatment (T2; n = 37).
(B) Relative proportions that contribute to each B cell cluster in HC or SARPAC patients at baseline and after 5 days of treatment.
(C) Relative proportions of CD11c+ switched memory B cells (top) and plasmablasts (bottom) in HCs (n = 20) and SARPAC patients at baseline (T1; n = 35) and after 5 days of treatment (T2; n = 37).
(D) Percentage of switched memory B cells in PBMC fraction of HC (n = 11), SOC (n[T1] = 25; n[T2] = 25), and sargramostim group (n[T1] = 26; n[T2] = 26) at baseline (T1) and after 5 days of treatment (T2).
(E) IgG and IgA antibodies against SARS-CoV-2 Spike protein 1 (S1) and nucleocapsid protein (NCP)-specific IgG antibodies in HC (n = 23), SOC (n[T1] = 30; n[T2] = 27), and sargramostim group (n[T1] = 28; n[T2] = 26) at baseline (T1) and after 5 days of treatment (T2). Statistical testing was performed using the Kruskal Wallis test with Dunn’s correction for multiple comparisons for (C) and (E) and the Wilcoxon test for (D). The line in (C) and (E) indicates the median. Statistical differences are noted as ∗p < 0.05, ∗∗p < 0.01, ∗∗∗p < 0.001, and ∗∗∗∗p < 0.0001.
In parallel, we studied cellular immune responses. Using UMAP projection of CD3+ PBMCs, we identified 19 T cell clusters, encompassing one combined MAIT/iNKT cell cluster, two γδ T cell populations, and eight CD8 and eight CD4 T cell clusters (Figures 7A, 7B, and S6C). Comparing COVID-19 patients included in SARPAC at day 1 and day 6 with matched HCs revealed a relative increase in CD38+ HLA-DR+ effector memory (EM) CD4 and CD8 T cells in COVID-19 patients at both time points (Figures 7B and 7C). Importantly, we observed a significant increase in activated CD38+ HLA-DR+ EM CD8 T cells after 5 days of sargramostim treatment, but not in the control group compared with baseline (Figure 7D). We finally addressed if these T cell responses were specifically directed against the virus and, therefore, stimulated T cells with a megapool (MP) of 221 peptides (15-mer) spanning the entire S protein of SARS-CoV-2, or with 246 predicted MHCII-restricted or 628 predicted MHCI-restricted peptides covering the rest of the SARS-CoV-2 proteome.53,54 After stimulation with the CD8 MP, the number of IFNγ-producing cells in an ELISpot assay was significantly increased after 5 days of sargramostim treatment compared with SOC, and some of these cells simultaneously produced IL-2 (Figure 7E). A major expansion of activated CD38+ HLA-DR+ EM or SARS-CoV-2-specific CD4 T cells was not observed upon sargramostim inhalation (Figures S6D and S6E).
Figure 7.

Effect of sargramostim on the T cell compartment
(A) UMAP plot of CD3e+ PBMCs depicting manual annotation of T cell clusters obtained from HC (n = 20) and SARPAC study patients at baseline (T1; n = 35) and after 5 days of treatment (T2; n = 37).
(B) Relative proportions that contribute to each T cell cluster in HC or SARPAC patients at baseline and after 5 days of treatment.
(C) Relative proportions of HLA-DR+CD38+ effector memory CD8 (top) and CD4 (bottom) T cells in HC (n = 20) and SARPAC patients at baseline (T1; n = 35) and after 5 days of treatment (T2; n = 37).
(D) Flow cytometry plots pre-gated on viable effector CD8 T cells and gated on the HLA-DR+CD38+ fraction in representative samples of standard of care (SOC) and sargramostim groups at baseline (T1) and after 5 days of treatment (T2). The percentage of activated (HLA-DR+CD38+) CD8 T cells in the PBMC fraction of HC (n = 11), SOC (n[T1] = 25; n[T2] = 25), and sargramostim groups (n[T1] = 26; n[T2] = 26) at baseline (T1) and after 5 days of treatment (T2) is shown.
(E) Absolute numbers of IFNγ+ (left) or IFNγ+IL-2+ (right) spots detected by ELISpot after CD8 T cell stimulation with SARS-CoV-2 peptide pools in HC (n = 22), SOC (n[T1] = 29; n[T2] = 24), and sargramostim groups (n[T1] = 30; n[T2] = 27) at baseline (T1) and after 5 days of treatment (T2). Statistical testing was performed using the Kruskal Wallis test with Dunn’s correction for multiple comparisons for (C), the Wilcoxon test for (D), and the Mann Whitney test for (E). The line in (C) and (E) indicates the median. Statistical differences are noted as ∗∗p < 0.01, ∗∗∗p < 0.001, and ∗∗∗∗p < 0.0001.
Together, these data from a small proof-of-principle study in 81 patients demonstrate that inhalation of sargramostim in COVID-19 patients is feasible and safe, potentially leading to improved gas exchange in the lung, simultaneously boosting the immune response against the virus, without enhancing cytokine-release syndrome.
Discussion
The precise reasons for TRAM loss in COVID-19 have remained elusive, and one possible explanation was that AMs are directly infected by SARS-CoV-2.42 This leaves the question of why recruited newcomer monocytes fail to differentiate into TRAMs when they encounter an empty alveolar niche.1 We found that recruited lung macrophages in COVID-19 lungs lack GM-CSF instruction. GM-CSF is the prime instructive cytokine of the alveolar niche, produced by type II AECs.4 We have tried to measure GM-CSF levels in the BAL fluid of COVID-19 patients and other pulmonary infections but failed to detect it (data not shown), and serum levels of GM-CSF were very low in our cohort, despite an earlier report.33 Several explanations are possible for the lack of GM-CSF instruction on recruited monocytes in COVID-19 lungs. First, through their expression of ACE2 receptor, type II AECs are prime targets of SARS-CoV-2 infection,42,55 so the demise of these cells in COVID-19 pneumonia would lead to the loss of a major source of GM-CSF. Second, subversion of GM-CSF production might be unique to the betacoronavirus family. The SARS-CoV-1 virus 3C-like proteinase, which is conserved in SARS-CoV-2, specifically subverts the production of GM-CSF, but not other cytokines, when overexpressed in lung epithelial cells.56 Finally, the inflammatory milieu of the COVID-19 lung with high numbers of neutrophils and pro-inflammatory cytokines could inhibit the differentiation of AMs by competing for available autocrine and paracrine GM-CSF57 or by antagonizing downstream signaling induced by GM-CSF instruction. Indeed, hyperinflammation in COVID-19 is accompanied by oxidative stress, a known suppressor of GM-CSF production by type II AECs.58
Based on prior success of inhaled GM-CSF in other pulmonary disorders characterized by lack of TRAMs,8 we initiated a randomized controlled proof-of-concept clinical trial to study if inhaled sargramostim treatment would improve alveolar oxygenation, a primary readout of the function of the alveolus. Although there was no difference in the mean value of P(A-a)O2 gradient change between treatment groups, after 5 days of inhaled sargramostim, we found a higher clinical responder rate defined by at least 25% improved oxygenation. Unfortunately, we could not perform pre-intervention and post-intervention bronchoscopy in this clinical trial setting in infectious COVID-19 patients, to minimize risk to staff and discomfort for critically ill patients. We can therefore only speculate as to why alveolar oxygenation improved in more sargramostim-treated patients. Based on our translational studies in mice that were treated with inhaled GM-CSF, one obvious explanation is that alveolar inflammation was suppressed via differentiation of locally recruited monocytes and their differentiation into homeostatic TRAMs.59 In animal models, GM-CSF inhalation and autocrine GM-CSF release in the lung has been shown to improve alveolocapillary barrier function, minimize alveolar water loss and edema, and directly promote epithelial repair, which are critical to maintain or restore alveolar gas exchange.60,61 Finally, we could also show that GM-CSF inhalation directly boosted B cell memory responses and SARS-CoV-2-specific CD8 T cell responses, in line with previous mouse models of viral or bacterial pneumonia.30,31,62,63 Like others, we detected a deficiency at least in circulating DC subsets in our cohort of COVID-19 patients, and remaining DCs were reported as hypofunctional.64 GM-CSF is the prime cytokine boosting the numbers and function of DCs that cross-present antigens derived from infected AECs to CD8 T cells.31,52
Despite the beneficial effects of lung GM-CSF on alveolar homeostasis, gas exchange, and antimicrobial immunity, there is still a lot of controversy surrounding GM-CSF as a therapeutic target in COVID-19, given that it can promote emergency myelopoiesis, boost cytokine release, and promote priming of neutrophils.36,37 Blockade of systemic GM-CSF or its receptor was also proposed as a strategy to dampen hyperinflammation in severe COVID-19. At least six randomized clinical trials have been launched since the beginning of the pandemic,36 two of which already reported promising results,65,66 while another did not show benefit and was prematurely halted.67 Major differences in the outcomes of GM-CSF interventions might depend on the timing of intervention, but also on the route of administration. While our study’s primary endpoint was oxygenation after 5 days of inhaled GM-CSF, the protocol did allow for systemic administration based on the clinician’s decision after the 6-day period in both study arms, if clinical deterioration occurred. Although only eight patients received intravenous GM-CSF after the primary endpoint analysis, this form of treatment was also not associated with more adverse events, in line with earlier observations in sepsis and pneumonia-associated ARDS patients.68,69
In conclusion, this translational study from mice to proof-of-concept in humans with COVID-19 identified inhalation with GM-CSF as a potential therapy for COVID-19 pneumonia, improving blood oxygenation and at the same time boosting antiviral immunity with minimal side effects.
Limitations of the study
Three main limitations of the SARPAC trial include the open-label design, reliance on the surrogate primary endpoint of “oxygenation,” and exclusion of patients with critical COVID-19. All patients were unvaccinated at the time of inclusion. Most patients were white and male. All these factors could limit the extrapolation of our findings to different patient populations, current SOC, and other SARS-CoV-2 variants of concern.
STAR★Methods
Key resources table
| REAGENT or RESOURCE | SOURCE | IDENTIFIER |
|---|---|---|
| Antibodies | ||
| Please see Table S5 (excel-format table) | N/A | N/A |
| Biological samples | ||
| Human BAL samples | This paper | N/A |
| Human PBMCs | This paper | N/A |
| Human serum | This paper | N/A |
| Chemicals, peptides, and recombinant proteins | ||
| Streptavidin, PE-Cy5 conjugated | BD Biosciences | Cat# 554062, RRID:AB_10053563 |
| Streptavidin, PE-CF594 conjugated | BD Biosciences | Cat#562284 |
| Fc block | Biosciences | Cat# 564219, RRID:AB_2728082 |
| Folligon | Intervet | Cat# BE-V059272 |
| Chorulon | Intervet | Cat# BE-V059315 |
| Leukine (Sargramostim; human GM-CSF) | Partner Therapeutics | N/A |
| Recombinant Mouse GM-CSF | VIB Protein Service Facility | N/A |
| RPMI | Thermo Fisher Scientific | Cat# 21875-059 |
| GlutaMAX | Thermo Fisher Scientific | Cat# 35050-038 |
| Penicicillin-Streptomycin | Thermo Fisher Scientific | Cat# 15140122 |
| Sodium Pyruvate | Thermo Fisher Scientific | Cat# 11360070 |
| NEAA | Thermo Fisher Scientific | Cat# 11140035 |
| 2-mercaptoethanol | Thermo Fisher Scientific | Cat# 31350010 |
| Liberase TL | Roche | Cat# 05 401 020 001 |
| DNase I | Roche | Cat# 04 536 282 001 |
| Leucosep™ | Greiner Bio-One | Cat# 227290 |
| Lymphoprep™ | Stemcell technologies | Cat# 07851 |
| CD4 SARS-CoV-2 peptide pools | Provided by Alessandro Sette54 | N/A |
| CD8 SARS-CoV-2 peptide pools | Provided by Alessandro Sette54 | N/A |
| FoxP3 Transcription factor staining buffer kit | eBioscience | Cat# 00-5523-00 |
| Critical commercial assays | ||
| Live/Dead eFluor 506 | Thermo Fisher Scientific | Cat# 65-0866-18 |
| FluoSpot Flex | Mabtech | Cat# FSP-0102-10 |
| S-PLEX Human GM-CSF Kit | MSD | Cat# K151F3S-1 |
| V-plex Cytokine panel 2 (human) kit | MSD | Cat# K151WTD |
| V-plex Proinflammatory panel 1 (human) kit | MSD | Cat# K15049D |
| U-plex Human IL-18 | MSD | Cat# K151VJK |
| U-plex Human G-CSF | MSD | Cat# K151VGK |
| V-plex Chemokine panel 1 (human) kit | MSD | Cat# K151NVD |
| V-plex vascular injury panel 2 (human) kit | MSD | Cat# K151SUD |
| MicroVue Complement Multiplex | Quidel | Cat# A905s |
| ELISA kit for anti-spike 1 (S1) IgA | EUROIMMUUN | Cat# EI 2606-9601 A |
| ELISA kit for anti-spike 1 (S1) IgG | EUROIMMUUN | Cat# EI 2606-9601 G |
| ELISA kit for anti-NCP IgG | EUROIMMUUN | Cat# EI 2606-9601-2 G |
| Deposited data | ||
| Human CITE-sequencing data | This paper | GSE216705 |
| Murine Micro-array data | This paper | GSE216705 |
| Experimental models: Organisms/strains | ||
| Mouse: Csf2−/− | Bred at the animal facility of the University of Ghent | Guilliams et al., 20135 |
| Mouse: C57BL/6j SPF | Janvier Labs | N/A |
| Software and algorithms | ||
| REDCap | Vanderbilt University | N/A |
| limma R package (v 3.42.2) | Bioconductor | RRID:SCR_001320 |
| mogene10sttranscriptcluster.db R package | Bioconductor | RRID:SCR_006442 |
| ComBat function (sva R package, v3.34.0) | Bioconductor | RRID:SCR_006442 |
| Adobe Illustrator | Adobe | www.adobe.com |
| Cell Ranger | 10X Genomics | https://support.10xgenomics.com/single-cell-gene-expression/software/pipelines/latest/what-is-cell-ranger |
| FlowJo v10.6.1 | FlowJo | https://www.flowjo.com |
| GraphPad Prism 9 | GraphPad | https://www.graphpad.com/ |
| Other | ||
| GeneChip Mouse Gene 1.0 ST arrays | Affymetrix | RRID:SCR_008323 |
| NovaSeq 6000 Sequencing System | Illumina | RRID:SCR_016387 |
Resource availability
Lead contact
Further information and requests for resources and reagents should be directed to and will be fulfilled by the lead contact, Bart N. Lambrecht (bart.lambrecht@ugent.be).
Material availability
This study did not generate new unique reagents.
Experimental model and subject details
In vivo animal studies
The following mice were used in this study; female C57BL/6 mice (aged 6–10 weeks) were purchased from Janvier (France); Csf2−/− mice were bred at the animal facility of the VIB-UGhent. All animals were housed under specific-pathogen-free conditions in individually ventilated cages in a controlled day-night cycle and given food and water ad libitum. All experiments were approved by the independent animal ethical committee “Ethische Commissie Dierproeven – faculteit Geneeskunde en Gezondheids-wetenschappen Universiteit Gent.”
Human studies
SARPAC trial oversight and role of the funder
The trial was approved by the competent authorities and the Ethical Committee of Ghent University Hospital, and the trial was conducted in accordance with Good Clinical Practice guidelines and the Declaration of Helsinki. Bart N. Lambrecht designed the trial and was the coordinating investigator. An independent data safety monitoring board monitored participant safety. Every patient or their legal representative provided informed consent for participation. All investigators take responsibility for the integrity of the trial and the publication. The first authors wrote the first draft of the manuscript. All authors made the decision to submit the manuscript for publication and vouch for the accuracy and completeness of the data and for the fidelity of the trial to the protocol.
SARPAC trial design, participants and randomization
We conducted a randomized controlled, multi-center, open-label, interventional study across 5 hospitals in Belgium. Eligible patients were adults (18–80 years of age) with confirmed recent COVID-19 pneumonia (i.e. positive polymerase-chain reaction (PCR) assay, antigen detection test or serology <2 weeks prior to randomization) and acute respiratory failure defined as a ratio of the partial arterial pressure of oxygen to the fraction of inspired oxygen (PaO2/FiO2) below 350 mmHg or blood oxygen saturation level (SpO2) below 93% on minimal 2 L/min supplemental oxygen. The FiO2 is measured for high-flow oxygen devices and is an estimate in patients breathing spontaneously on low-flow oxygen devices.
Patients were excluded from the trial in case of (1) known serious allergic reactions to yeast-derived products, (2) lithium carbonate therapy, (3) mechanical ventilation prior to randomization, (4) peripheral white blood cell count above 25.000/μL and/or active myeloid malignancy, (5) high dose systemic steroid therapy (>20 mg methylprednisolone or equivalent) for a COVID-19-unrelated disorder, (6) enrolment in another investigational study, (7) pregnant or breastfeeding or (8) ferritin levels >2000 μg/mL (which will exclude ongoing CRS). The full list of in- and exclusion criteria can be found in the study protocol (See additional resources). All patients received standard of care validated at that time (e.g. anti-viral treatment, glucocorticoids and supportive care). However, concomitant treatment with another investigational agent was prohibited.
Eligible patients were randomly assigned in a 1:1 ratio to receive sargramostim 125 μg twice daily for 5 days as a nebulized inhalation on top of standard of care (active group), or to receive standard of care treatment (control group). Upon progression of disease requiring initiation of non-invasive or invasive mechanical ventilatory support within the 5-day period, in patients in the active group, inhaled sargramostim is replaced by intravenous sargramostim 125 μg/m2 body surface area once daily until the 5-day period is reached. Randomization and subsequent data collection were done using REDCap. The primary analysis was performed at day 6 or hospital discharge whichever came first. The final trial visit occurred 10–20 weeks after randomization. Detailed information related to the subjects (e.g., sample size, etc.) can be found in Table 1.
Enrolled patients underwent multiple daily evaluations. Additional serum and EDTA samples and arterial blood gas samples were collected on day 1 and 6 since randomization and on follow-up (10–20 weeks after randomization). The majority of patients randomized before July 2020 received hydroxychloroquine as per standard of care and the majority of patients randomized from July 2020 onwards received dexamethasone as per standard of care.
Human BAL samples
BAL fluid was obtained from patients who have been hospitalized with COVID-19 (n = 8), non-COVID-19 pulmonary infection (n = 8), interstitial lung disease (ILD) (n = 1) and control individuals (n = 2). Detailed information related to the subjects can be found in Table S2.
Method details
Timed pregnancies
For timed pregnancies, female C57BL/6 mice were injected intraperitoneal with 5 IU serum gonadotropin (Folligon; Intervet) to stimulate follicle growth and 5 IU human chorionic gonadotropin (Chorulon; Intervet) to induce ovulation. Briefly, neonatal Csf2−/− mice were treated 5 times on the first 5 days of birth with rGM-CSF (5ug GM-CSF in 5 ul PBS per day via i.n. administration).5 Negative control mice = Csf2−/− mice treated with PBS (also 5 ul). All animal experiments were approved by the local animal ethics committee (VIB-UGhent) and were performed according to local guidelines and Belgian animal protection law.
Flow cytometry and cell sorting of murine samples
Cell sorting was performed on a FACSAria II cytometer. After cell sorting, purity was checked (always >95%). For flow cytometry, lungs were cut into small pieces, incubated in RPMI containing Liberase TM (Roche) and DNase (Roche), and then syringed through a 19-gauge needle to obtain a homogenous cell suspension. Red blood cells were lysed for 4 min at room temperature in 1 mL osmotic lysis buffer. Cells were sorted exactly as in Guilliams et al.5 (macrophages, pre-AMs and AMs in WT see Figure 3, GM-CSF treated mice gating see Figure 6). Antibodies used in this study can be found in the key resources table.
Neutrophils (Ly-6GhiCD11bhiCD64loLy-6Chi cells), Eosinophils (SiglecFhiCD11bhiCD64loLy-6Cint cells), T cells (CD3hiCD11bloCD64lo cells), and B cells (CD19hiCD11bloCD64lo cells) were systematically outgated before analysis. Fixable live/dead marker Aqua was purchased from Invitrogen. Dead cells were outgated using the live/marker before analysis.
GM-CSF signature
To identify the mouse alveolar macrophage (AMF) signature genes that are CSF2 dependent we compared GeneChip Mouse Gene 1.0 ST arrays (Affymetrix) microarrays of GM-CSF KO mice to microarrays covering the AMF development: Yolk Sac MF (E12.5), Fetal liver monocyte (E15.5), Bone Marrow monocyte (adult), lung macrophage on E15.5, E17.5 and E19.5, Pre-AMF on day of birth, AMF on day 9 after birth and adult AMF.
The microarrays were analysed using the limma R package (v 3.42.2). The Robust Multi-array Average (RMA) procedure was used to normalize data within arrays (probeset summarization, background correction and log2-transformation) and between arrays (quantile normalization). Probesets were filtered and converted into gene symbols using the mogene10sttranscriptcluster.db R package (v 8.7.0).
To identify the AMF signature genes that are CSF2 dependent we first calculated the DE genes between the AMF group and the primitive MF groups combined with the BM_mono and FL_mono. A gene was considered differentially expressed when the Log2fold change >1 and the Adjusted p value <0.05 (limma Bioconductor package, multiple testing correction by the Benjamini-Hochberg method).
In order to only retain the genes with a perfect gene signature, we only kept the DE genes where the (mean normalised expression values in the AMF samples) > (mean normalised expression values in the primitive MF groups, BM_mono and FL_mono samples) + 1. A final filtering was done by only keeping the genes that overlap with our AMF core gene list. The AMF core gene list was obtained by comparing Alveolar Macrophages to Liver Macrophages, Spleen Macrophages, Brain Macrophages, Peritoneal Macrophages and Small Intestine Macrophages. Combat was used to correct for batch effects caused by the different experiments: overlapping samples over the different experiments were used as input for the ‘mod’ parameter of the ComBat function (sva R package, v3.34.0). For each gene we calculated the mean and median expression in the AMF samples, and the mean and median expression in the other MF samples. Genes that have a mean and median value which is >1.2 times higher in the AMF samples compared to the other MF samples, were retained. We next scaled the expression values of these genes by calculating the mean expression value per gene over all MF samples, which is then subtracted from each MFs’ particular gene expression value. These scaled expression values needed to be positive for every AMF sample and negative for every other MF sample (but 3 mismatches were allowed here) in order to add the gene to the AMF core list. All this resulted in 128 AMF core genes and 22 AMF signature genes that are CSF2 dependent.
To identify the AMF signature genes lacking in GM-CSF KO mice we first calculated the DE genes between MF_Gm_csfKO and AMF group, primitive MF groups, BM_mono and combined. A gene was considered differentially expressed using the same cut offs as described above. In order to only retain the genes with a perfect gene signature, we only kept the DE genes where the (mean normalised expression values in the MF_Gm_csfKO samples) > (mean normalised expression values in the AMF, primitive MF groups, BM_mono and FL_mono samples) + 1. This resulted in 73 AMF signature genes lacking in GM-CSF KO mice.
We next converted the found genes into the human orthologs by looking up the human gene symbol on NCBI (https://www.ncbi.nlm.nih.gov/search/) and checking if there is an ortholog in human listed under the ‘Ortholog’ tab. The found orthologs were then used as input for the SingleCellSignatureExplorer tool to identify where these genes are enriched in the UMAP.
Human BAL samples and single cell library preparation
We profiled matching BAL fluid from patients who have been hospitalized with COVID-19 (n = 8), non-COVID-19 pulmonary infection (n = 8), interstitial lung disease (ILD) (n = 1) and control individuals (n = 2). The analysis includes single-cell 3′ RNA-sequencing along with the quantitative measurement of surface proteins using panels of more than 250 oligo-conjugated antibodies (TotalSeq A - CITEseq). The study population entails adult patients with a diagnostic or therapeutic need for bronchoscopy. Patients aged 18–100 years old were eligible for study inclusion if they had clinical symptoms suggestive of COVID-19 and if hospitalization was required. Controls were asymptomatic and were selected from a group of patients requiring a bronchoscopy with BAL for diagnostic work or follow-up of other diseases. In these cases, lavage was always performed in a healthy lung lobe and SARS-CoV-2 was formally ruled-out by RT-PCR. This study was performed in accordance with the principles expressed in the Declaration of Helsinki. Written informed consent was obtained from all patients or a legal representative. The study was approved by the Ethics Committee of Ghent University Hospital (Belgium), AZ Jan Palfijn (Belgium) and AZ Maria Middelares (Belgium), where all samples have been collected. After dimensionality reduction, integration and clustering of the BAL cells, we mapped more than 60 clusters corresponding with immune and epithelial cell identities in our preliminary analysis defined by expression of specific marker genes or antibodies.
Bronchoscopy with BAL was performed bedside using a single use disposable video bronchoscope. Bronchoscopy was only performed in hemodynamically and respiratory stable patients. In spontaneously breathing patients, an additional oxygen need of 3L/min in rest was required. Recommended personal protective equipment was used: full face mask, disposable surgical cap, medical protective mask (N95/FFP2/FFP3), work uniform, disposable medical protective gown, disposable gloves. Three to five aliquots of 20 mL sterile normal saline were instilled into the region of the lung with most aberrations on chest CT. Retrieval was done by suctioning of the scope. BAL fluid was collected in siliconized bottles to prevent cell adherence and kept at 4°C. BAL fluid was filtered through a 100 μm cell strainer (BD Biosciences) and centrifuged for 7 min at 1300 rpm at 4°C. The supernatant was removed and the BAL fluid cells were counted and subsequently processed fresh for CITEseq/scRNAseq. One million of cells was used for subsequent single cell RNA sequencing while the remaining cells were frozen in 1 mL 90% fetal calf serum (FCS, Sigma), 10% dimethyl sulphoxide Hybri-Max (DMSO, Sigma) in a cryovial using a 5100 Cryo 1°C Freezing Container (Nalgene) to −80°C. Afterwards the cells were stored in liquid nitrogen (- 196°C). Whole blood was collected in EDTA tube and processed within a maximum of 1.5 hours after collection. Whole blood separation was performed by bringing whole blood, diluted with PBS 7.2 (ThermoFisher Scientific, # 20012027), in a Leucosep™ tube, (Greiner Bio-One, # 227290), prefilled with 15 mL Lymphoprep™(Stemcell technologies, # 07851), followed by a centrifugation step of 30 minutes at 1500 rpm (acceleration 5, brake 3). After isolation, the PBMCs were twice washed in PBS 7.2 and centrifuged at 350 xg for 10 minutes in a cooled centrifuge at 4°C. Isolated PBMCs were counted, cryopreserved in 1mL FCS/DMSO 10% and stored in liquid nitrogen (- 196°C).
Preprocessing data
Single cell sequencing libraries were sequenced with a NovaSEQ S4 flow cell with custom sequencing metrics (single-indexed sequencing run, 28/8/0/98 cycles for R1/i7/i5/R2) (Illumina). Sequencing was performed at the VIB Nucleomics Core (VIB, Leuven).
The demultiplexing of the raw data was performed using CellRanger software (10x – version 4.0; cellranger mkfastq which wraps Illumina’s bcl2fastq). The reads obtained from the demultiplexing were used as the input for ‘cellranger count’ (CellRanger software), which aligned the reads to a merged human/SARS-CoV-2 genome using STAR and collapses to unique molecular identifier (UMI) counts. In order to maintain explicit control over all gene and cell quality control filters, we used the raw feature-barcode matrix instead of the filtered feature-barcode matrix generated by CellRanger. As an initial filtering, we removed all cells with less than 200 genes and genes expressed in less than 3 cells.
First, the hashed samples were demultiplexed by allocating cells to a specific donor using a SNP-based algorithm. Droplets with reads from different donors were omitted from the analysis. We next identified outlier cells based on 3 metrics: library size, number of expressed genes and mitochondrial proportion. All cells that were 5 median absolute deviation (MADs) higher or lower than the median value for each metric were removed. Cells that expressed less than 200 genes – if still present - were removed. Genes expressed in less than 50 cells were discarded. For the antibodies (ABs) we selected the top 120 most expressed ABs. The complete proteogenomic information was utilized for the single cell analysis by applying TotalVI (scvi Python package v0.6.7), an algorithm that combines protein and mRNA profiles for the cell clustering in the dimensionality reduction by uniform manifold approximation and projection (UMAP). The BAL dataset contains 19 samples of which 16 samples are CITE-Seq samples. We analyzed this dataset using the ‘Integration of CITE-seq and scRNA-seq data with totalVI’ workflow as described on http://docs.scvi-tools.org/.
The UMAP was checked for contamination cells, doublets and other unwanted cells, such as cells with high AB counts, cells with lower nGenes,… After multiple rounds of cleaning a final UMAP was obtained on which we calculated the DE genes and DE proteins using the scvi Python package. A gene was considered differential expressed when ‘lfc_median’ > 1.0, ‘bayes_factor’ > 1 and ‘non_zeros_proportion1’ > 0.10. An antibody was considered differential expressed when ‘proba_de’ > 0.05 and ‘(raw_mean1/raw_mean2∗lfc_mean)>=0.2’.
Heatmaps were made by scaling the normalized values (denoised values; calculated by the TotalVI workflow) using the scale_quantile function of the SCORPIUS R package (v1.0.7) and the pheatmap R package (v1.0.12). The plots showing the expression of certain genes or proteins were created based on the normalized values (denoised values) using a quantile cutoff of 0.95 and via the scanpy.pl.umap function of the Scanpy Python package (v1.5.1).
The diffusion map was created using the scanpy.tl.diffmap function of the Python Scanpy package (v1.5.1). Slingshot was applied on the first three diffusion components together with the annotated clusters using the slingshot R package (v1.4.0). The Monocyte cluster was used as the starting point of the trajectory.
Outcomes of the clinical trial
The primary endpoint was the improvement in oxygenation after 5 days of sargramostim treatment and/or standard of care. Oxygenation was assessed on an arterial blood gas by the PaO2/FiO2 ratio and P(A-a)O2 gradient. Median change from baseline in oxygenation to day 6 and the numbers of patients that experienced at least 25%, 33% and 50% improvement in oxygenation were analyzed in the sargramostim group and the usual care group.
Supportive secondary endpoints included amongst others: time to clinical improvement; length of hospital stay; time until progression to mechanical ventilation and/or ARDS. For patients of selected sites, additional blood samples were collected to measure specific immunological parameters. All supportive and secondary endpoints are listed in the statistical analysis plan, which can be found in the extended data supplement.
Key safety endpoints included all-cause mortality, serious adverse events, sepsis and septic shock during hospital stay. Adverse events were recorded according to the system organ class and preferred terms in the Common Terminology Criteria for Adverse Events, version 6.0.
Sample collection and processing
Peripheral venous blood specimens were collected from healthy individuals and study patients using simultaneously obtained EDTA and serum tubes. Healthy individuals were age, BMI and gender matched without prior medical history and in the absence of recent infection or vaccination (<6 weeks). Healthy controls provided written informed consent prior to blood sampling and storage of their samples in the PID biobank (EC Ghent University Hospital 2012/593). EDTA blood was diluted 1:2 in Hank’s Balanced Salt Solution (HBSS; Fisher Scientific; 24020117) and peripheral blood mononuclear cells (PBMCs) isolated after gradient centrifugation over Ficoll-Paque (GE Healthcare; 17-1440-02). Cell free plasma was subsequently transferred from the supernatant, aliquoted and stored at −80°C. After two washings in cold HBSS, the yielded layer of PBMCs was counted in a Neubauer plate with trypan blue exclusion of dead cells. PBMCs were aliquoted in 90% Fetal Calf Serum (FCS; Sigma Aldrich; F7524) and 10% dimethyl sulfoxide (DMSO; Sigma Aldrich; D2650). Vials were placed in a −80°C freezer using controlled rate freezing in preparation for final storage at −150°C until further use. Serum tubes were spun at 4°C and cell free serum was subsequently aliquoted and stored at −80°C until analysis.
Extended immunophenotyping on PBMCs
Cryopreserved PBMCs were thawed in 37°C preheated complete medium (RPMI-1640 medium supplemented with GlutaMAX, 10% FCS, 1% penicillin-streptomycin (Pen/Strep; 10,000 U/mL; Gibco; 15140122), 1 mM sodium pyruvate (Gibco; 11360070), 1% non-essential amino acids (NEAA; Gibco; 11140035) and 50 μM 2-mercaptoethanol (Gibco; 31350010). Cells were left to recuperate for 30 min at 37°C and 5% CO2 after removal of DMSO. Cells were counted using Luna-FX7 (Logos Biosystem) and 4∗10ˆ6 cells were plated for immunophenotyping. Next, cells were first stained with FcR block (Biolegend; 422302) together with Mono Block (Biolegend; 426102), biotin conjugated antibodies and Fixable Viability dye eFluor 506 (Thermofisher; 65-0866-14) in PBS. In a second step, remaining surface markers were stained with a mixture of antibodies in FACS buffer (DPBS pH7.4, 1% Bovine Serum Albumin, 0,05% NaN3, 1 mM EDTA) and Brilliant Stain buffer (BD Biosciences). Cells were fixed, permeabilized and intracellular stained with antibodies using FoxP3 staining buffer (Thermofisher; 00-5523-00) following manufacturer’s protocol. Acquisition and analysis of labeled cell suspensions was performed with a FACSymphony flow cytometer (BD biosciences) and subsequent analysis of data with FlowJo10 software (BD biosciences). Antibodies used to define PBMC populations can be found in the key resources table.
T cell restimulation and FluoroSpot
To quantify SARS-CoV-2 specific CD4 and CD8 T cells, peptide restimulation with Fluorospot for IFN and IL-2 was performed (Mabtech; Fluorospot Flex). In short, 2,5X10ˆ5 PBMC were resuspended in complete medium, plated in triplicate into 96 well plates with a PVDF membrane bottom layer, precoated overnight with capturing antibodies directed against IFN and IL-2. PBMC were stimulated with CD4 T cell (CD4-R and CD4-S MP) or CD8 T cell (CD8-A and CD8-B MP) specific peptide pools at a final concentration of 1 mg/mL, as described in Weiskopf et al.54 After 23 hours of stimulation, plates were collected and spots were developed following manufacturer’s protocol (Mabtech, FSP-0102-10). Spots were revealed and quantified using Mabtech IRIS Fluorospot reader (Mabtech).
Biomarker quantification
Serum cytokines IL-1β, IL1Ra, IL-6, IL-8, IL-10, IL-18, CXCL10, ICAM, G-CSF, GM-CSF, TNFα, IFNg were quantified by MSD using the S-plex GM-CSF Human kit (MSD; K151F3S-1), the V-plex Cytokine panel 2 (human) kit (MSD; K151WTD), the V-plex Proinflammatory panel 1 (human) kit (MSD; K15049D), U-plex Human IL-18 (MSD; K151VJK), U-plex Human G-CSF (MSD; K151VGK), V-plex Chemokine panel 1 (human) kit (MSD; K151NVD), V-plex vascular injury panel 2 (human) kit (MSD; K151SUD) according to manufacturer’s protocol, with data acquired on a MESO QuickPlex SQ 120.
C5a measurement
Complement components were measured in cell free plasma. C5a was measured using customizable enzyme immunoassay multiplex kits (MicroVue Complement Multiplex, Quidel; A905s), according to manufacturer’s instructions. Data were acquired on a Q-View Imager LS, using the Q-View Software 3.11.
Immunoglobulin ELISA
SARS-CoV-2 antibodies on stored serum samples of included patients were analyzed with antigen-coated ELISA kits (EUROIMMUN AG) for anti-spike 1 (S1) IgA (EI 2606-9601 A) and IgG (EI 2606-9601 G) and anti-nucleocapsid protein (NCP) IgG (EI 2606-9601-2 G), according to manufacturer’s protocol.
Quantification and statistical analysis
Sample calculation and power analysis
The outcome(s) on which the sample size calculation is based upon, is the primary endpoint measurement of oxygenation, defined as PaO2/FiO2 ratio and P(A-a)O2. Sample calculation and power analysis have been performed using Genstat. The target difference is the difference measured at the primary endpoint (at day 6) between the control and the treated group. Given a sample size of 40 patients each, a minimal improvement of 10% in the treated group relative to the control group will be detected as significant at a significance level of 0,01 with a power of 0.90. The error variance was set at 100 units, corresponding with a standard deviation of 10 units.
The post-treatment evaluations should be assessed within 24 hours of the last dose of treatment. That is, Day 6 will be the timepoint for measures of efficacy endpoints based on 5 days of treatment. If the patient is discharged from hospital prior to the day 6 efficacy evaluation, the values at day of discharge will be used as value for measuring efficacy endpoints.
Statistical analysis
Safety data were analyzed descriptively in the safety population which included all patients that received at least one dose of sargramostim on the active arm and all patients who received only standard of care on the control arm. All efficacy endpoints were based on the modified intention-to-treat population, unless otherwise specified. Some specific sensitivity analyses of efficacy were based on ITT (for primary endpoints only), which included all patients who had undergone randomization. Patients with missing data (i.e. no arterial blood gas analysis at baseline and/or day 6) were excluded from the analyses for which the missing data are necessary. Patients with a negative P(A-a)O2 gradient were excluded for oxygenation analyses, given these values are biologically not possible.
Categorical endpoints are calculated as the percentage of patients with the event, relative to the number of patients treated. Continuous endpoints will be summarized by n, means or medians, minimum, maximum, and 25th and 75th percentiles. F-test and two sample t-test may be used to compare patients on the sargramostim and control arms. In the event that the underlying assumptions and/or distributions for a given statistical method were not satisfied, alternative statistical methods were employed.
The number of patients that experienced at least 25%, 33% and 50% improvement in oxygenation was compared between the sargramostim group and the standard of care group by a Chi-square test. The median change from baseline in oxygenation to day 6 was analyzed by a Brown-Mood test. p values were two sided, and any p value less than 0.05 was considered statistically significant. Statistical details of experiments can be found in the figure legends. The complete SAP is provided in the Supplementary Appendix.
Additional resources
This study is registered online with ClinicalTrials.gov (NCT04326920) and EudraCT (2020-001254-22) and is complete. The study protocol (Data S1) and statistical analysis plan (Data S2) are available as supplemental Data items.
Acknowledgments
The authors acknowledge the clinical trial teams of the Department of Respiratory Medicine and the Health Innovation & Research Institute of UZ Gent (HIRUZ) and the hospital pharmacy of UZ Gent. The authors thank Veronique De Backer, Nancy Cabooter, Kim Deswarte, Declercq Zara, Justine Van Moorleghem, Roanne Schuppers, Helena Flipts, Lisa Roels, Karlien Claes, Helena Aegerter, Ursula Smole, Leen Seys, and Dorine Sichien for the PBMC isolation. We thank the IRC-VIB Flow core facility for assistance, VIB Tech Watch and the VIB Single-Cell Accelerator program for their help in benchmarking single-cell technologies such as CITE-seq. Ghent University Hospital provided trial resources. Partner Therapeutics, LLC (Lexington, MA), provided the study medication sargramostim (Leukine). The Ghent University Special Research Fund (BOF) supported the clinical follow-up of patients. Funding for biomarker analysis was provided by the VIB Grand Challenges program and by an unrestricted research grant from Partner Therapeutics. The single-cell CITE-seq profiling of BAL cells was funded through the Chan Zuckerberg Initiative (CZI) “Covid atlas” project (2020-216717), UGent Covid grant “Covid-Track” project (BOFCOV; 01C04620), FWO Covid grant “Covid-Trace” project (G0G4520N), and Ghent University GOA project (01G02418). This work was funded by NIH contract 75N9301900065 (D.W., A.S.).
Author contributions
Conceptualization, B.N.L.; methodology, B.N.L., S.J.T., and M.G.; software, L.M., S.D., R.S., and N.V.; validation, B.N.L., C.B., E.D.L., K.V.D., J. Declercq, B.M., V.B., L.H., and L.N.; formal analysis, C.B., E.D.L., K.V.D., J. Declercq, B.M., L.M., S.D., R.S., and N.V.; investigation, B.N.L., C.B., E.D.L., K.V.D., J. Declercq, B.M., V.B., L.H., L.N., N.D., J. Deckers, B.C., M.P., Y.V.W., T.M., S.J.V., I.K.D., H.S., S.A., P.D., E.V.B., J.D.C., and F.H.; resources, B.N.L., D.F.R., C.B., E.D.L., K.V.D., J. Declercq, B.M., Y.V.W., T.M., S.J.V., I.K.D., H.S., S.A., P.D., E.V.B., L.V., D.W., and A.S.; data curation, B.N.L., M.G., S.J.T., C.B., L.M., R.S., and N.V.; writing – original draft, B.N.L., C.B., S.J.T., and M.G.; writing – review & editing, B.N.L. and C.B.; supervision, B.N.L.; project administration, B.N.L.; funding acquisition, B.N.L., L.V., and N.V.
Declaration of interests
A.S. is a consultant for Gritstone bio, Flow Pharma, Arcturus, Immunoscape, CellCarta, Oxford Immunotec, and Avalia. L.J.I. has filed for patent protection for various aspects of T cell epitope and vaccine design work. D.F.R. is an employee of and has stock options in Partner Therapeutics.
Inclusion and diversity
We support inclusive, diverse, and equitable conduct of research.
Published: November 15, 2022
Footnotes
Supplemental information can be found online at https://doi.org/10.1016/j.xcrm.2022.100833.
Supplemental information
and S2
Data and code availability
-
•
The sc-RNA and CITE-Seq data from the COVID-19 patients are publicly available online via singularity portal of the Flemish institute for Biotechnology (VIB) via the COVID-19 response link (https://www.single-cell.be/covid19/browser) and are publicly available as of the date of publication. De-identified individual participant data will be available upon approval of a reasonable proposal. The shared data can be used for the analyses mentioned in the approved proposal without restriction. Proposals should be directed to and will be fulfilled by the lead contact, Bart N. Lambrecht (bart.lambrecht@ugent.be).
-
•
Microscopy data reported in this paper will be shared by the lead contact upon request without restriction.
-
•
This paper does not report original code. Any additional information required to reanalyze the data reported in this paper is available from the lead contact upon request without restriction.
References
- 1.Aegerter H., Lambrecht B.N., Jakubzick C.V. Biology of lung macrophages in health and disease. Immunity. 2022;55:1564–1580. doi: 10.1016/j.immuni.2022.08.010. [DOI] [PMC free article] [PubMed] [Google Scholar]
- 2.Westphalen K., Gusarova G.A., Islam M.N., Subramanian M., Cohen T.S., Prince A.S., Bhattacharya J. Sessile alveolar macrophages communicate with alveolar epithelium to modulate immunity. Nature. 2014;506:503–506. doi: 10.1038/nature12902. [DOI] [PMC free article] [PubMed] [Google Scholar]
- 3.Neupane A.S., Willson M., Chojnacki A.K., Vargas E Silva Castanheira F., Morehouse C., Carestia A., Keller A.E., Peiseler M., DiGiandomenico A., Kelly M.M., et al. Patrolling alveolar macrophages conceal bacteria from the immune system to maintain homeostasis. Cell. 2020;183:110–125.e11. doi: 10.1016/j.cell.2020.08.020. [DOI] [PubMed] [Google Scholar]
- 4.Gschwend J., Sherman S.P.M., Ridder F., Feng X., Liang H.E., Locksley R.M., Becher B., Schneider C. Alveolar macrophages rely on GM-CSF from alveolar epithelial type 2 cells before and after birth. J. Exp. Med. 2021;218:e20210745. doi: 10.1084/jem.20210745. [DOI] [PMC free article] [PubMed] [Google Scholar]
- 5.Guilliams M., De Kleer I., Henri S., Post S., Vanhoutte L., De Prijck S., Deswarte K., Malissen B., Hammad H., Lambrecht B.N. Alveolar macrophages develop from fetal monocytes that differentiate into long-lived cells in the first week of life via GM-CSF. J. Exp. Med. 2013;210:1977–1992. doi: 10.1084/jem.20131199. [DOI] [PMC free article] [PubMed] [Google Scholar]
- 6.Schneider C., Nobs S.P., Kurrer M., Rehrauer H., Thiele C., Kopf M. Induction of the nuclear receptor PPAR-gamma by the cytokine GM-CSF is critical for the differentiation of fetal monocytes into alveolar macrophages. Nat. Immunol. 2014;15:1026–1037. doi: 10.1038/ni.3005. [DOI] [PubMed] [Google Scholar]
- 7.Suzuki T., Sakagami T., Rubin B.K., Nogee L.M., Wood R.E., Zimmerman S.L., Smolarek T., Dishop M.K., Wert S.E., Whitsett J.A., et al. Familial pulmonary alveolar proteinosis caused by mutations in CSF2RA. J. Exp. Med. 2008;205:2703–2710. doi: 10.1084/jem.20080990. [DOI] [PMC free article] [PubMed] [Google Scholar]
- 8.Tazawa R., Ueda T., Abe M., Tatsumi K., Eda R., Kondoh S., Morimoto K., Tanaka T., Yamaguchi E., Takahashi A., et al. Inhaled GM-CSF for pulmonary alveolar proteinosis. N. Engl. J. Med. 2019;381:923–932. doi: 10.1056/NEJMoa1816216. [DOI] [PubMed] [Google Scholar]
- 9.Jakubzick C., Gautier E.L., Gibbings S.L., Sojka D.K., Schlitzer A., Johnson T.E., Ivanov S., Duan Q., Bala S., Condon T., et al. Minimal differentiation of classical monocytes as they survey steady-state tissues and transport antigen to lymph nodes. Immunity. 2013;39:599–610. doi: 10.1016/j.immuni.2013.08.007. [DOI] [PMC free article] [PubMed] [Google Scholar]
- 10.Byrne A.J., Powell J.E., O'Sullivan B.J., Ogger P.P., Hoffland A., Cook J., Bonner K.L., Hewitt R.J., Wolf S., Ghai P., et al. Dynamics of human monocytes and airway macrophages during healthy aging and after transplant. J. Exp. Med. 2020;217:e20191236. doi: 10.1084/jem.20191236. [DOI] [PMC free article] [PubMed] [Google Scholar]
- 11.Aegerter H., Kulikauskaite J., Crotta S., Patel H., Kelly G., Hessel E.M., Mack M., Beinke S., Wack A. Influenza-induced monocyte-derived alveolar macrophages confer prolonged antibacterial protection. Nat. Immunol. 2020;21:145–157. doi: 10.1038/s41590-019-0568-x. [DOI] [PMC free article] [PubMed] [Google Scholar]
- 12.Guilliams M., Svedberg F.R. Does tissue imprinting restrict macrophage plasticity? Nat. Immunol. 2021;22:118–127. doi: 10.1038/s41590-020-00849-2. [DOI] [PubMed] [Google Scholar]
- 13.Mould K.J., Barthel L., Mohning M.P., Thomas S.M., McCubbrey A.L., Danhorn T., Leach S.M., Fingerlin T.E., O'Connor B.P., Reisz J.A., et al. Cell origin dictates programming of resident versus recruited macrophages during acute lung injury. Am. J. Respir. Cell Mol. Biol. 2017;57:294–306. doi: 10.1165/rcmb.2017-0061OC. [DOI] [PMC free article] [PubMed] [Google Scholar]
- 14.Guan W.J., Ni Z.Y., Hu Y., Liang W.H., Ou C.Q., He J.X., Liu L., Shan H., Lei C.L., Hui D.S.C., et al. Clinical characteristics of coronavirus disease 2019 in China. N. Engl. J. Med. 2020;382:1708–1720. doi: 10.1056/NEJMoa2002032. [DOI] [PMC free article] [PubMed] [Google Scholar]
- 15.Vabret N., Britton G.J., Gruber C., Hegde S., Kim J., Kuksin M., Levantovsky R., Malle L., Moreira A., Park M.D., et al. Immunology of COVID-19: current state of the science. Immunity. 2020;52:910–941. doi: 10.1016/j.immuni.2020.05.002. [DOI] [PMC free article] [PubMed] [Google Scholar]
- 16.Gu S.X., Tyagi T., Jain K., Gu V.W., Lee S.H., Hwa J.M., Kwan J.M., Krause D.S., Lee A.I., Halene S., et al. Thrombocytopathy and endotheliopathy: crucial contributors to COVID-19 thromboinflammation. Nat. Rev. Cardiol. 2021;18:194–209. doi: 10.1038/s41569-020-00469-1. [DOI] [PMC free article] [PubMed] [Google Scholar]
- 17.Dorward D.A., Russell C.D., Um I.H., Elshani M., Armstrong S.D., Penrice-Randal R., Millar T., Lerpiniere C.E.B., Tagliavini G., Hartley C.S., et al. Tissue-specific immunopathology in fatal COVID-19. Am. J. Respir. Crit. Care Med. 2021;203:192–201. doi: 10.1164/rccm.202008-3265OC. [DOI] [PMC free article] [PubMed] [Google Scholar]
- 18.Wauters E., Van Mol P., Garg A.D., Jansen S., Van Herck Y., Vanderbeke L., Bassez A., Boeckx B., Malengier-Devlies B., Timmerman A., et al. Discriminating mild from critical COVID-19 by innate and adaptive immune single-cell profiling of bronchoalveolar lavages. Cell Res. 2021;31:272–290. doi: 10.1038/s41422-020-00455-9. [DOI] [PMC free article] [PubMed] [Google Scholar]
- 19.Bost P., De Sanctis F., Canè S., Ugel S., Donadello K., Castellucci M., Eyal D., Fiore A., Anselmi C., Barouni R.M., et al. Deciphering the state of immune silence in fatal COVID-19 patients. Nat. Commun. 2021;12:1428. doi: 10.1038/s41467-021-21702-6. [DOI] [PMC free article] [PubMed] [Google Scholar]
- 20.Liao M., Liu Y., Yuan J., Wen Y., Xu G., Zhao J., Cheng L., Li J., Wang X., Wang F., et al. Single-cell landscape of bronchoalveolar immune cells in patients with COVID-19. Nat. Med. 2020;26:842–844. doi: 10.1038/s41591-020-0901-9. [DOI] [PubMed] [Google Scholar]
- 21.Zhao Y., Kilian C., Turner J.E., Bosurgi L., Roedl K., Bartsch P., Gnirck A.C., Cortesi F., Schultheiß C., Hellmig M., et al. Clonal expansion and activation of tissue-resident memory-like Th17 cells expressing GM-CSF in the lungs of severe COVID-19 patients. Sci. Immunol. 2021;6:eabf6692. doi: 10.1126/sciimmunol.abf6692. [DOI] [PMC free article] [PubMed] [Google Scholar]
- 22.Vanderbeke L., Van Mol P., Van Herck Y., De Smet F., Humblet-Baron S., Martinod K., Antoranz A., Arijs I., Boeckx B., Bosisio F.M., et al. Monocyte-driven atypical cytokine storm and aberrant neutrophil activation as key mediators of COVID-19 disease severity. Nat. Commun. 2021;12:4117. doi: 10.1038/s41467-021-24360-w. [DOI] [PMC free article] [PubMed] [Google Scholar]
- 23.Chua R.L., Lukassen S., Trump S., Hennig B.P., Wendisch D., Pott F., Debnath O., Thürmann L., Kurth F., Völker M.T., et al. COVID-19 severity correlates with airway epithelium-immune cell interactions identified by single-cell analysis. Nat. Biotechnol. 2020;38:970–979. doi: 10.1038/s41587-020-0602-4. [DOI] [PubMed] [Google Scholar]
- 24.Sefik E., Israelow B., Mirza H., Zhao J., Qu R., Kaffe E., Song E., Halene S., Meffre E., Kluger Y., et al. A humanized mouse model of chronic COVID-19. Nat. Biotechnol. 2022;40:906–920. doi: 10.1038/s41587-021-01155-4. [DOI] [PMC free article] [PubMed] [Google Scholar]
- 25.Merad M., Martin J.C. Pathological inflammation in patients with COVID-19: a key role for monocytes and macrophages. Nat. Rev. Immunol. 2020;20:355–362. doi: 10.1038/s41577-020-0331-4. [DOI] [PMC free article] [PubMed] [Google Scholar]
- 26.Stephenson E., Reynolds G., Botting R.A., Calero-Nieto F.J., Morgan M.D., Tuong Z.K., Bach K., Sungnak W., Worlock K.B., Yoshida M., et al. Single-cell multi-omics analysis of the immune response in COVID-19. Nat. Med. 2021;27:904–916. doi: 10.1038/s41591-021-01329-2. [DOI] [PMC free article] [PubMed] [Google Scholar]
- 27.Xu Z., Shi L., Wang Y., Zhang J., Huang L., Zhang C., Liu S., Zhao P., Liu H., Zhu L., et al. Pathological findings of COVID-19 associated with acute respiratory distress syndrome. Lancet Respir. Med. 2020;8:420–422. doi: 10.1016/S2213-2600(20)30076-X. [DOI] [PMC free article] [PubMed] [Google Scholar]
- 28.Mehta P., McAuley D.F., Brown M., Sanchez E., Tattersall R.S., Manson J.J., HLH Across Speciality Collaboration, UK COVID-19: consider cytokine storm syndromes and immunosuppression. Lancet. Lancet. 2020;395:1033–1034. doi: 10.1016/S0140-6736(20)30628-0. [DOI] [PMC free article] [PubMed] [Google Scholar]
- 29.Lucas C., Wong P., Klein J., Castro T.B.R., Silva J., Sundaram M., Ellingson M.K., Mao T., Oh J.E., Israelow B., et al. Longitudinal analyses reveal immunological misfiring in severe COVID-19. Nature. 2020;584:463–469. doi: 10.1038/s41586-020-2588-y. [DOI] [PMC free article] [PubMed] [Google Scholar]
- 30.Rösler B., Herold S. Lung epithelial GM-CSF improves host defense function and epithelial repair in influenza virus pneumonia-a new therapeutic strategy? Mol. Cell. Pediatr. 2016;3:29. doi: 10.1186/s40348-016-0055-5. [DOI] [PMC free article] [PubMed] [Google Scholar]
- 31.Unkel B., Hoegner K., Clausen B.E., Lewe-Schlosser P., Bodner J., Gattenloehner S., Janßen H., Seeger W., Lohmeyer J., Herold S. Alveolar epithelial cells orchestrate DC function in murine viral pneumonia. J. Clin. Invest. 2012;122:3652–3664. doi: 10.1172/JCI62139. [DOI] [PMC free article] [PubMed] [Google Scholar]
- 32.Greter M., Helft J., Chow A., Hashimoto D., Mortha A., Agudo-Cantero J., Bogunovic M., Gautier E.L., Miller J., Leboeuf M., et al. GM-CSF controls nonlymphoid tissue dendritic cell homeostasis but is dispensable for the differentiation of inflammatory dendritic cells. Immunity. 2012;36:1031–1046. doi: 10.1016/j.immuni.2012.03.027. [DOI] [PMC free article] [PubMed] [Google Scholar]
- 33.Thwaites R.S., Sanchez Sevilla Uruchurtu A., Siggins M.K., Liew F., Russell C.D., Moore S.C., Fairfield C., Carter E., Abrams S., Short C.E., et al. Inflammatory profiles across the spectrum of disease reveal a distinct role for GM-CSF in severe COVID-19. Sci. Immunol. 2021;6:6. doi: 10.1126/sciimmunol.abg9873. [DOI] [PMC free article] [PubMed] [Google Scholar]
- 34.Ingelfinger F., De Feo D., Becher B. Master regulator of the T cell-phagocyte interface during inflammation. Semin. Immunol. 2021;54:101518. doi: 10.1016/j.smim.2021.101518. [DOI] [PubMed] [Google Scholar]
- 35.Sterner R.M., Sakemura R., Cox M.J., Yang N., Khadka R.H., Forsman C.L., Hansen M.J., Jin F., Ayasoufi K., Hefazi M., et al. GM-CSF inhibition reduces cytokine release syndrome and neuroinflammation but enhances CAR-T cell function in xenografts. Blood. 2019;133:697–709. doi: 10.1182/blood-2018-10-881722. [DOI] [PMC free article] [PubMed] [Google Scholar]
- 36.Lang F.M., Lee K.M.C., Teijaro J.R., Becher B., Hamilton J.A. GM-CSF-based treatments in COVID-19: reconciling opposing therapeutic approaches. Nat. Rev. Immunol. 2020;20:507–514. doi: 10.1038/s41577-020-0357-7. [DOI] [PMC free article] [PubMed] [Google Scholar]
- 37.Mehta P., Porter J.C., Manson J.J., Isaacs J.D., Openshaw P.J.M., McInnes I.B., Summers C., Chambers R.C. Therapeutic blockade of granulocyte macrophage colony-stimulating factor in COVID-19-associated hyperinflammation: challenges and opportunities. Lancet Respir. Med. 2020;8:822–830. doi: 10.1016/S2213-2600(20)30267-8. [DOI] [PMC free article] [PubMed] [Google Scholar]
- 38.Bosteels C., Maes B., Van Damme K., De Leeuw E., Declercq J., Delporte A., Demeyere B., Vermeersch S., Vuylsteke M., Willaert J., et al. Sargramostim to treat patients with acute hypoxic respiratory failure due to COVID-19 (SARPAC): a structured summary of a study protocol for a randomised controlled trial. Trials. 2020;21:491. doi: 10.1186/s13063-020-04451-7. [DOI] [PMC free article] [PubMed] [Google Scholar]
- 39.Li X., Kolling F.W., Aridgides D., Mellinger D., Ashare A., Jakubzick C.V. ScRNA-seq expression of IFI27 and APOC2 identifies four alveolar macrophage superclusters in healthy BALF. Life Sci. Alliance. 2022;5:e202201458. doi: 10.26508/lsa.202201458. [DOI] [PMC free article] [PubMed] [Google Scholar]
- 40.Gibbings S.L., Thomas S.M., Atif S.M., McCubbrey A.L., Desch A.N., Danhorn T., Leach S.M., Bratton D.L., Henson P.M., Janssen W.J., Jakubzick C.V. Three unique interstitial macrophages in the murine lung at steady state. Am. J. Respir. Cell Mol. Biol. 2017;57:66–76. doi: 10.1165/rcmb.2016-0361OC. [DOI] [PMC free article] [PubMed] [Google Scholar]
- 41.Street K., Risso D., Fletcher R.B., Das D., Ngai J., Yosef N., Purdom E., Dudoit S. Slingshot: cell lineage and pseudotime inference for single-cell transcriptomics. BMC Genom. 2018;19:477. doi: 10.1186/s12864-018-4772-0. [DOI] [PMC free article] [PubMed] [Google Scholar]
- 42.Grant R.A., Morales-Nebreda L., Markov N.S., Swaminathan S., Querrey M., Guzman E.R., Abbott D.A., Donnelly H.K., Donayre A., Goldberg I.A., et al. Circuits between infected macrophages and T cells in SARS-CoV-2 pneumonia. Nature. 2021;590:635–641. doi: 10.1038/s41586-020-03148-w. [DOI] [PMC free article] [PubMed] [Google Scholar]
- 43.van de Laar L., Saelens W., De Prijck S., Martens L., Scott C.L., Van Isterdael G., Hoffmann E., Beyaert R., Saeys Y., Lambrecht B.N., Guilliams M. Yolk sac macrophages, fetal liver, and adult monocytes can colonize an empty niche and develop into functional tissue-resident macrophages. Immunity. 2016;44:755–768. doi: 10.1016/j.immuni.2016.02.017. [DOI] [PubMed] [Google Scholar]
- 44.Gautier E.L., Shay T., Miller J., Greter M., Jakubzick C., Ivanov S., Helft J., Chow A., Elpek K.G., Gordonov S., et al. Gene-expression profiles and transcriptional regulatory pathways that underlie the identity and diversity of mouse tissue macrophages. Nat. Immunol. 2012;13:1118–1128. doi: 10.1038/ni.2419. [DOI] [PMC free article] [PubMed] [Google Scholar]
- 45.Ma L., Sahu S.K., Cano M., Kuppuswamy V., Bajwa J., McPhatter J., Pine A., Meizlish M.L., Goshua G., Chang C.H., et al. Increased complement activation is a distinctive feature of severe SARS-CoV-2 infection. Sci. Immunol. 2021;6:6. doi: 10.1126/sciimmunol.abh2259. [DOI] [PMC free article] [PubMed] [Google Scholar]
- 46.Morrissey S.M., Geller A.E., Hu X., Tieri D., Ding C., Klaes C.K., Cooke E.A., Woeste M.R., Martin Z.C., Chen O., et al. A specific low-density neutrophil population correlates with hypercoagulation and disease severity in hospitalized COVID-19 patients. JCI Insight. 2021;6:148435. doi: 10.1172/jci.insight.148435. [DOI] [PMC free article] [PubMed] [Google Scholar]
- 47.Giamarellos-Bourboulis E.J., Netea M.G., Rovina N., Akinosoglou K., Antoniadou A., Antonakos N., Damoraki G., Gkavogianni T., Adami M.E., Katsaounou P., et al. Complex immune dysregulation in COVID-19 patients with severe respiratory failure. Cell Host Microbe. 2020;27:992–1000.e3. doi: 10.1016/j.chom.2020.04.009. [DOI] [PMC free article] [PubMed] [Google Scholar]
- 48.Lim A., Radujkovic A., Weigand M.A., Merle U. Soluble receptor for advanced glycation end products (sRAGE) as a biomarker of COVID-19 disease severity and indicator of the need for mechanical ventilation, ARDS and mortality. Ann. Intensive Care. 2021;11:50. doi: 10.1186/s13613-021-00836-2. [DOI] [PMC free article] [PubMed] [Google Scholar]
- 49.d'Alessandro M., Cameli P., Refini R.M., Bergantini L., Alonzi V., Lanzarone N., Bennett D., Rana G.D., Montagnani F., Scolletta S., et al. Serum KL-6 concentrations as a novel biomarker of severe COVID-19. J. Med. Virol. 2020;92:2216–2220. doi: 10.1002/jmv.26087. [DOI] [PMC free article] [PubMed] [Google Scholar]
- 50.Leisman D.E., Mehta A., Thompson B.T., Charland N.C., Gonye A.L.K., Gushterova I., Kays K.R., Khanna H.K., LaSalle T.J., Lavin-Parsons K.M., et al. Alveolar, endothelial, and organ injury marker dynamics in severe COVID-19. Am. J. Respir. Crit. Care Med. 2022;205:507–519. doi: 10.1164/rccm.202106-1514OC. [DOI] [PMC free article] [PubMed] [Google Scholar]
- 51.Myhre P.L., Prebensen C., Strand H., Røysland R., Jonassen C.M., Rangberg A., Sørensen V., Søvik S., Røsjø H., Svensson M., et al. Growth differentiation factor 15 provides prognostic information superior to established cardiovascular and inflammatory biomarkers in unselected patients hospitalized with COVID-19. Circulation. 2020;142:2128–2137. doi: 10.1161/CIRCULATIONAHA.120.050360. [DOI] [PMC free article] [PubMed] [Google Scholar]
- 52.Greter M., Helft J., Chow A., Hashimoto D., Mortha A., Agudo-Cantero J., Bogunovic M., Gautier E.L., Miller J., Leboeuf M. GM-CSF controls nonlymphoid tissue dendritic cell homeostasis but is dispensable for the differentiation of inflammatory dendritic cells. Immunity. 2012;6:1031–1046. doi: 10.1016/j.immuni.2012.03.027. http://linkinghub.elsevier.com/retrieve/pii/S1074761312002464 [DOI] [PMC free article] [PubMed] [Google Scholar]
- 53.Grifoni A., Sidney J., Vita R., Peters B., Crotty S., Weiskopf D., Sette A. SARS-CoV-2 human T cell epitopes: adaptive immune response against COVID-19. Cell Host Microbe. 2021;29:1076–1092. doi: 10.1016/j.chom.2021.05.010. [DOI] [PMC free article] [PubMed] [Google Scholar]
- 54.Weiskopf D., Schmitz K.S., Raadsen M.P., Grifoni A., Okba N.M.A., Endeman H., van den Akker J.P.C., Molenkamp R., Koopmans M.P.G., van Gorp E.C.M., et al. Phenotype and kinetics of SARS-CoV-2-specific T cells in COVID-19 patients with acute respiratory distress syndrome. Sci. Immunol. 2020;5:eabd2071. doi: 10.1126/sciimmunol.abd2071. [DOI] [PMC free article] [PubMed] [Google Scholar]
- 55.Bost P., Giladi A., Liu Y., Bendjelal Y., Xu G., David E., Blecher-Gonen R., Cohen M., Medaglia C., Li H., et al. Host-viral infection maps reveal signatures of severe COVID-19 patients. Cell. 2020;181:1475–1488.e12. doi: 10.1016/j.cell.2020.05.006. [DOI] [PMC free article] [PubMed] [Google Scholar]
- 56.Liao H.H., Wang Y.C., Chen M.C.M., Tsai H.Y., Lin J., Chen S.T., Tsay G.J., Cheng S.L. Down-regulation of granulocyte-macrophage colony-stimulating factor by 3C-like proteinase in transfected A549 human lung carcinoma cells. BMC Immunol. 2011;12:16. doi: 10.1186/1471-2172-12-16. [DOI] [PMC free article] [PubMed] [Google Scholar]
- 57.De Alessandris S., Ferguson G.J., Dodd A.J., Juss J.K., Devaprasad A., Piper S., Wyatt O., Killick H., Corkill D.J., Cohen E.S., et al. Neutrophil GM-CSF receptor dynamics in acute lung injury. J. Leukoc. Biol. 2019;105:1183–1194. doi: 10.1002/JLB.3MA0918-347R. [DOI] [PMC free article] [PubMed] [Google Scholar]
- 58.Sturrock A., Vollbrecht T., Mir-Kasimov M., McManus M., Wilcoxen S.E., Paine R., 3rd Mechanisms of suppression of alveolar epithelial cell GM-CSF expression in the setting of hyperoxic stress. Am. J. Physiol. Lung Cell Mol. Physiol. 2010;298:L446–L453. doi: 10.1152/ajplung.00161.2009. [DOI] [PMC free article] [PubMed] [Google Scholar]
- 59.Herold S., Hoegner K., Vadász I., Gessler T., Wilhelm J., Mayer K., Morty R.E., Walmrath H.D., Seeger W., Lohmeyer J. Inhaled granulocyte/macrophage colony-stimulating factor as treatment of pneumonia-associated acute respiratory distress syndrome. Am. J. Respir. Crit. Care Med. 2014;189:609–611. doi: 10.1164/rccm.201311-2041LE. [DOI] [PubMed] [Google Scholar]
- 60.Overgaard C.E., Schlingmann B., Dorsainvil White S., Ward C., Fan X., Swarnakar S., Brown L.A.S., Guidot D.M., Koval M. The relative balance of GM-CSF and TGF-beta1 regulates lung epithelial barrier function. Am. J. Physiol. Lung Cell Mol. Physiol. 2015;308:L1212–L1223. doi: 10.1152/ajplung.00042.2014. [DOI] [PMC free article] [PubMed] [Google Scholar]
- 61.Sturrock A., Seedahmed E., Mir-Kasimov M., Boltax J., McManus M.L., Paine R., 3rd GM-CSF provides autocrine protection for murine alveolar epithelial cells from oxidant-induced mitochondrial injury. Am. J. Physiol. Lung Cell Mol. Physiol. 2012;302:L343–L351. doi: 10.1152/ajplung.00276.2011. [DOI] [PubMed] [Google Scholar]
- 62.Huang F.F., Barnes P.F., Feng Y., Donis R., Chroneos Z.C., Idell S., Allen T., Perez D.R., Whitsett J.A., Dunussi-Joannopoulos K., Shams H. GM-CSF in the lung protects against lethal influenza infection. Am. J. Respir. Crit. Care Med. 2011;184:259–268. doi: 10.1164/rccm.201012-2036OC. [DOI] [PMC free article] [PubMed] [Google Scholar]
- 63.Subramaniam R., Barnes P.F., Fletcher K., Boggaram V., Hillberry Z., Neuenschwander P., Shams H. Protecting against post-influenza bacterial pneumonia by increasing phagocyte recruitment and ROS production. J. Infect. Dis. 2014;209:1827–1836. doi: 10.1093/infdis/jit830. [DOI] [PubMed] [Google Scholar]
- 64.Zhou R., To K.K.W., Wong Y.C., Liu L., Zhou B., Li X., Huang H., Mo Y., Luk T.Y., Lau T.T.K., et al. Acute SARS-CoV-2 infection impairs dendritic cell and T cell responses. Immunity. 2020;53:864–877.e5. doi: 10.1016/j.immuni.2020.07.026. [DOI] [PMC free article] [PubMed] [Google Scholar]
- 65.Temesgen Z., Burger C.D., Baker J., Polk C., Libertin C.R., Kelley C.F., Marconi V.C., Orenstein R., Catterson V.M., Aronstein W.S., et al. Lenzilumab in hospitalised patients with COVID-19 pneumonia (LIVE-AIR): a phase 3, randomised, placebo-controlled trial. Lancet Respir. Med. 2022;10:237–246. doi: 10.1016/S2213-2600(21)00494-X. [DOI] [PMC free article] [PubMed] [Google Scholar]
- 66.Fisher B.A., Veenith T., Slade D., Gaskell C., Rowland M., Whitehouse T., Scriven J., Parekh D., Balasubramaniam M.S., Cooke G., et al. Namilumab or infliximab compared with standard of care in hospitalised patients with COVID-19 (CATALYST): a randomised, multicentre, multi-arm, multistage, open-label, adaptive, phase 2, proof-of-concept trial. Lancet Respir. Med. 2022;10:255–266. doi: 10.1016/S2213-2600(21)00460-4. [DOI] [PMC free article] [PubMed] [Google Scholar]
- 67.Cremer P.C., Abbate A., Hudock K., McWilliams C., Mehta J., Chang S.Y., Sheng C.C., Van Tassell B., Bonaventura A., Vecchié A., et al. Mavrilimumab in patients with severe COVID-19 pneumonia and systemic hyperinflammation (MASH-COVID): an investigator initiated, multicentre, double-blind, randomised, placebo-controlled trial. Lancet. Rheumatol. 2021;3:e410–e418. doi: 10.1016/S2665-9913(21)00070-9. [DOI] [PMC free article] [PubMed] [Google Scholar]
- 68.Presneill J.J., Harris T., Stewart A.G., Cade J.F., Wilson J.W. A randomized phase II trial of granulocyte-macrophage colony-stimulating factor therapy in severe sepsis with respiratory dysfunction. Am. J. Respir. Crit. Care Med. 2002;166:138–143. doi: 10.1164/rccm.2009005. [DOI] [PubMed] [Google Scholar]
- 69.Paine R., 3rd, Standiford T.J., Dechert R.E., Moss M., Martin G.S., Rosenberg A.L., Thannickal V.J., Burnham E.L., Brown M.B., Hyzy R.C. A randomized trial of recombinant human granulocyte-macrophage colony stimulating factor for patients with acute lung injury. Crit. Care Med. 2012;40:90–97. doi: 10.1097/CCM.0b013e31822d7bf0. [DOI] [PMC free article] [PubMed] [Google Scholar]
Associated Data
This section collects any data citations, data availability statements, or supplementary materials included in this article.
Supplementary Materials
and S2
Data Availability Statement
-
•
The sc-RNA and CITE-Seq data from the COVID-19 patients are publicly available online via singularity portal of the Flemish institute for Biotechnology (VIB) via the COVID-19 response link (https://www.single-cell.be/covid19/browser) and are publicly available as of the date of publication. De-identified individual participant data will be available upon approval of a reasonable proposal. The shared data can be used for the analyses mentioned in the approved proposal without restriction. Proposals should be directed to and will be fulfilled by the lead contact, Bart N. Lambrecht (bart.lambrecht@ugent.be).
-
•
Microscopy data reported in this paper will be shared by the lead contact upon request without restriction.
-
•
This paper does not report original code. Any additional information required to reanalyze the data reported in this paper is available from the lead contact upon request without restriction.