

Abstract
Background
This article reports the methods and findings for Aotearoa New Zealand's 2022 Report Card on Physical Activity for Children and Youth indicators, and on inequities within these indicators.
Methods
Grades were assigned to indicators using the Active Healthy Kids Global Alliance criteria depending on data availability, and inequities reported based on gender, ethnicity, disability status, area-level socioeconomic deprivation, urbanicity, and school year. Two additional indicators were included in this report card: Sleep, and Physical literacy.
Results
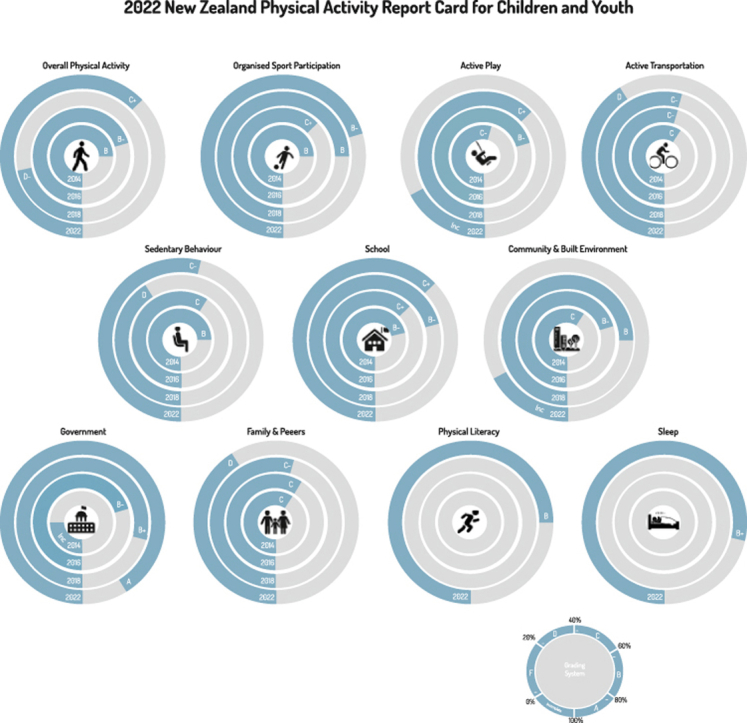
Grades were assigned to indicators as follows: Overall physical activity: C+, Organised sport and physical activity: B-, Physical literacy: B, Active transportation: D, Sedentary behaviours: C-, Sleep: B+, Whānau (family) and peers: D, School: C+, Government: A. Inequities across all socio-demographic variables were observed. An ‘inconclusive’ grade was assigned to the Active play, Physical fitness, and Community and Environment indicators due to insufficient data.
Conclusion
It is imperative that targeted, comprehensive, and population-specific approaches are implemented to support health-promoting physical activity behaviours and reduce inequities among children and youth in Aotearoa. There is a need to promote all dimensions of physical activity (overall activity, active play, recreation, organised sport, active transportation) and the reduction of screen time through policy, research, evidence-based social marketing campaigns, and urban design. Regular, nationally representative surveys that enable the consistent and regular measurement of key Report Card indicators are needed.
Graphical abstract
1. Introduction
Physical activity (PA) is essential for health, development, and wellbeing in children and youth, and offers a range of benefits associated with physical and mental health and wellbeing,1, 2, 3, 4, 5, 6, 7, 8, 9 social connections and support,10, 11, 12, 13, 14 cognition, academic achievement, and physical literacy.5,15, 16, 17, 18 Yet, many children and youth, globally and in Aotearoa New Zealand (hereafter Aotearoa), are insufficiently active.19 Beyond PA, integrating sedentary behaviours and sleep alongside PA as a part of 24-h movement behaviour guidelines is becoming increasingly common.20 Though the proportion of children meeting age-specific sleep recommendations in Aotearoa appears both stable and favorable,21 sedentary time is high and has increased over time22,23 which is concerning given the harmful impact of prolonged sedentary behaviour on health.2
Schools, active transportation (AT), organised sport and play have been considered as important parts in children and youth accumulating physical activity. Schools are widely recognised settings for PA promotion24 via the provision of sporting opportunities, physical education (PE), promoting PA during breaks in learning, and AT to and from school. For example, introduction of at least half an hour a day, on average, of PE within schools in Aotearoa would reduce both overall physical inactivity and inequities.25 AT (i.e., walking or wheeling to places) is associated with higher levels of health-promoting PA26, 27, 28, 29, 30 and improved health outcomes.31 It is worth noting that while AT can be accumulated across various settings, most evidence has explored rates of children's travel to and/or from school. Organised sport participation makes a considerable contribution to children and youth meeting PA recommendations,32 and has independent positive associations with wellbeing.3,33,34 Risky, outdoor play has been identified as a potential attraction to engage children in PA, potentially increasing PA35,36 and enhancing psychological well-being.37 Participation in sport, play, and AT can each help children to develop physical literacy, defined as the motivation, confidence, physical competence, knowledge, and understanding required by participants that allows them to value and take responsibility for engaging in physical activity and sport for life.38
A socio-ecological approach recognizes the impact that interconnected interpersonal, environmental, and policy factors have on PA.39 With respect to interpersonal factors, social support is an integral facilitator of PA in children and youth,11,40 with those whose parents41 and peers42 are physically active are more likely to be active themselves. The environments in which children and youth live, work and play can have significant impacts on their PA behaviours and health.43, 44, 45 Having appropriate infrastructure (e.g., footpaths, bike lanes, trails), availability of quality PA destinations (e.g., parks, playgrounds, facilities), easy access to places of importance, and safe places to be active are all important facilitators of PA in children and youth. Finally, government policies and strategic priorities play an important role in PA promotion.46,47
This article details methods and findings from the fourth Report Card for Physical Activity for Children and Youth in Aotearoa (hereafter ‘2022 Report Card’), with the previous report cards published in 2014,48 2016,49 and 201822 as part of the Active Healthy Kids Global Alliance's (AHKGA's) Global Matrix.50 Report Cards are useful for raising awareness and advocating for policies and environments that promote health and wellbeing for children and youth. The 2022 AHKGA Report Cards assign grades across ten indicators (overall PA, organised sport and PA, active play, AT, sedentary behaviours, physical fitness, family and peers, school, community and environment, government) using consistent benchmarking criteria where possible (Table 1). In addition, Aotearoa's 2022 Report Card includes two new indicators - physical literacy and sleep - which are not yet included as AHKGA indicators. A particular focus of Aotearoa's 2022 Report Card was on identifying inequalities in physical activity participation among children and youth, where possible, by stratifying grades based on a range of socio-demographic characteristics.”
Table 1.
Report Card grades and their interpretation.
| Grade | % Meeting criteria | Interpretation |
|---|---|---|
| A+ | 94–100 | We are succeeding with a large majority of children and youth |
| A | 87–93 | |
| A- | 80–86 | |
| B+ | 74–79 | We are succeeding with well over half of children and youth |
| B | 67–73 | |
| B- | 60–66 | |
| C+ | 54–59 | We are succeeding with about half of children and youth |
| C | 47–53 | |
| C- | 40–46 | |
| D+ | 34–39 | We are succeeding with less than half but some children and youth |
| D | 27–33 | |
| D- | 20–26 | |
| F | <20 | We are succeeding with very few children and youth |
| INC | Incomplete | Incomplete—insufficient or inadequate information to assign a grade |
2. Methods
Indicators and their benchmarking criteria are outlined in Supplement 1. We aimed to align criteria as closely as possible with the AHKGA criteria, but ultimately our criteria were dependent on data availability (Table 2, Supplement 2). Data sources from 2019 to March 2020 (signalling the arrival of COVID-19 to Aotearoa) were identified through previous report cards, networks, and academic and grey literature. Data sources used to derive grades included several national surveys detailed in Table 2, along with personal communication with stakeholders. Data were requested where not publicly available. Where possible, we explored differences by gender, ethnicity, disability status, and area-level socio-economic status, urbanicity, and age (using school year). Grades were determined based on the proportion meeting established benchmarking criteria and approved by the working group. Details on the measurement and categorisation of demographic characteristics are provided in Supplement 2.
Table 2.
Data sources used to assign grades.
| Source | Description | Indicator(s) |
|---|---|---|
| Sport New Zealand Ihi Aotearoa (Sport NZ) Active NZ Young People Survey - 201951 | - Survey (households adults assist where necessary) | - Overall physical activity |
| - ∼6000 young people – data weighted according to socio-demographic characteristics | - Organised sport and physical activity | |
| - January 2019–March 2020 | - Active transportation | |
| - Sedentary behaviours | ||
| - Family and peers∗ | ||
| - School | ||
| - Physical literacy | ||
| - Sleep | ||
| The NZ Health Survey - 2019/202052 | - Home interview | - Active transportation |
| - ∼5000 children annually | ||
| - July 2019–March 2020 | ||
| NZ Travel Survey - 2019/202053 | - Home interview/travel diary/travel logs (GPS) | - Active transportation |
| - ∼1900 households | ||
| NZ Secondary School Sport Census54 | - Reported by secondary school sports coordinators | - School |
Note. NZ = Aotearoa New Zealand; ∗ Active NZ Young People Survey data were merged with Active NZ Adult Survey.
3. Results
Indicator grades and the rationale for these are outlined below, and the report card cover is provided in Fig. 1. Table 3 shows the final grades, and grades for previous years’ report cards. Table 4 shows the proportion of children and youth meeting guidelines for physical activity, sleep, and sedentary behaviours by socio-demographic characteristics.
Fig. 1.

Front cover of the 2022 Aotearoa New Zealand physical activity report card.
Table 3.
Final grades for all indicators.
| Indicator | 2022 Grade | 2018 Grade | 2016 Grade | 2014 Grade |
|---|---|---|---|---|
| Overall physical activity | C+ | D- | B- | B |
| Sedentary behaviours | C- | D | C | B |
| Sleep | B+ | N/A | N/A | N/A |
| Organised sport and physical activity | B- | B | C+ | B |
| Physical literacy | B | N/A | N/A | N/A |
| School | C+ | B- | C+ | B- |
| Active Play | INC | C+ | B- | C- |
| Family/whānau and peers | D | C- | C | C |
| Community and environment | INC | B | B- | C |
| Active transportation | D | C- | C- | C |
| Government | A | B+ | B- | INC |
Note. INC = Inconclusive due to insufficient evidence available, grade not assigned; N/A = not applicable, grade not calculated.
Table 4.
Differences in indicators by socio-demographic characteristics for participants in the 2019/2020 Sport NZ Active NZ Young People survey.
| Characteristic | Category | Number (%) of participants | Overall physical activity |
Sedentary behaviours |
Sleep |
Organised sport and physical activity |
Physical literacy |
School |
||||||
|---|---|---|---|---|---|---|---|---|---|---|---|---|---|---|
| % | Grade | % | Grade | % | Grade | % | Grade | % | Grade | % | Grade | |||
| OVERALL | 58.1 | C+ | 42.9 | C- | B+ | 74.6 | 66.4 | B- | 69.9 | B | 59.0 | C+ | ||
| Gender | Girls | 2978 (49.8) | 54.5 | C+ | 43.3 | C- | B | 73.1 | 66.0 | B- | 68.8 | B | 58.2 | C+ |
| Boys | 2963 (50.0) | 61.6 | B- | 42.7 | C- | B+ | 76.3 | 66.9 | B- | 71.0 | B | 59.3 | C+ | |
| Another gender | 13 (0.2) | 61.5 | B- | 14.3 | F | D+ | 38.5 | 50.0 | C | 46.2 | C- | 35.7 | D+ | |
| Ethnicitya | Māori | 1373 (23.2) | 62.7 | B- | 38.3 | D+ | B | 73.1 | 70.6 | B | 71.2 | B | 64 | B- |
| European | 3328 (56.2) | 61.0 | B- | 46.4 | C- | B+ | 78.5 | 65.0 | B- | 71.2 | B | 56.8 | C+ | |
| Pasifika | 484 (8.2) | 51.2 | C | 40.8 | C- | B- | 60.5 | 73.4 | B | 71.5 | B | 66.7 | B- | |
| Asian | 639 (10.8) | 41.0 | C- | 38.7 | D+ | B | 69.4 | 61.3 | B- | 59.9 | C+ | 55.6 | C+ | |
| MELAAb | 66 (1.1) | 47.7 | C | 33.8 | D | B- | 66.7 | 65.2 | B- | 74.2 | B | 63.6 | B- | |
| Other ethnicities | 27 (0.5) | 55.6 | C+ | 44.4 | C- | A- | 80.8 | 42.3 | C- | 61.5 | B- | 22.2 | D- | |
| Disability statusc | Non-disabled | 5410 (90.9) | 58.3 | C+ | 43.6 | C- | B+ | 75.9 | 66.6 | B- | 70.5 | B | 59.0 | C+ |
| Disabled | 543 (9.1) | 53.2 | C | 27.8 | D | B- | 62.3 | 64.5 | B- | 55.7 | C+ | 58.6 | C+ | |
| Area-level socioeconomic deprivationd | Low deprivation | 2303 (38.7) | 61.5 | B- | 44.5 | C- | B+ | 77.4 | 65.5 | B- | 73.8 | B | 56.6 | C+ |
| Mid deprivation | 2192 (36.8) | 58.6 | C+ | 46.0 | C- | B+ | 74.8 | 64.9 | B- | 68.8 | B | 58.1 | C+ | |
| High deprivation | 1458 (24.5) | 51.9 | C | 35.9 | D+ | B | 69.9 | 70.2 | B | 65.4 | B- | 64.2 | B- | |
| Urbanicity | Main urban (≥30k people) | 3865 (65.0) | 56.4 | C+ | 42.1 | C- | B | 73.8 | 66.3 | B- | 69.1 | B | 59.0 | C+ |
| Secondary urban (≥1k people) | 947 (15.9) | 61.9 | B- | 44.4 | C- | B | 74.6 | 64.4 | B- | 69.8 | B | 57.5 | C+ | |
| Rural | 1135 (19.1) | 60.5 | B- | 45 | C- | B | 77.3 | 68.5 | B | 72.2 | B | 59.9 | C+ | |
| School year | 0-6 (∼5–10 years) | 2737 (46.0) | 59.9 | C+ | 61.1 | B- | A- | 81.4 | 69.4 | B | 70.2 | B | 63.9 | B- |
| 7-10 (∼11–14 years) | 2104 (35.3) | 61.7 | B- | 35.7 | D+ | B+ | 71.4 | 74.3 | B+ | 72.6 | B | 67.5 | B | |
| 11-13 (∼15–17 years) | 1113 (18.7) | 46.8 | C- | 11.9 | F | C- | 63.9 | 44.2 | C- | 63.9 | B- | 30.8 | D | |
Notes.
Participants could choose more than one ethnicity.
MELAA = Middle Eastern, Latin American, and African.
Classified using the Washington Short Set.
Classified using NZDep.
3.1. Overall physical activity (C+)
The overall physical activity grade was assigned drawing upon Active NZ Young People Survey data.51 Overall, 58.1% of children and youth participated in ≥420 min/week of moderate-to-vigorous physical activity (MVPA), with a smaller proportion of girls meeting the threshold than boys or children and youth of another gender. A higher proportion of children of Māori and European ethnicities participated in ≥420 min/week of MVPA than children of other ethnicities. Children and youth of Asian ethnicities had considerably lower levels of MVPA than other ethnic groups. A smaller proportion of children (school years 0–6; ∼5–10 years of age) and older youth (school years 11–13; ∼15–17 years of age) participated in ≥420 min/week of MVPA than children and youth in school years 7–10 (∼11–14 years of age). The proportion of children and youth participating in ≥420 min/week of MVPA did not differ based on disability. A higher proportion of children and youth residing in areas of lower socio-economic deprivation accumulated the recommended level of MVPA compared with children and youth residing in areas of higher deprivation. A smaller proportion of children and youth residing in main urban areas accumulated the recommended level of MVPA than children and youth residing in less urbanised areas.
3.2. Sedentary behaviours (C-)
The sedentary behaviours grade was assigned drawing upon Active NZ Young People Survey data.51 Overall, 42.9% of children and youth met the threshold of having <2hrs/day of screen time (including watching television; watching movies; on a computer, cellphone, tablet, or PlayStation or Xbox) outside of school or work, on a normal weekday or normal weekend day. A higher proportion of boys and girls met screen time recommendations than children and youth of another gender. A smaller proportion of disabled children and youth met screen time recommendations compared to non-disabled children and youth. A lower proportion of children and youth residing in higher socio-economic deprivation areas met the threshold than those residing in areas with lower levels deprivation. Sedentary behaviours did not vary noticeably based on urbanicity. The proportion of children and youth meeting sedentary behaviour recommendations was substantially lower with increasing age. A higher proportion of children and youth of European, Pasifika, and ’other’ ethnicities met sedentary behaviour recommendations than children of Māori, Asian, and Middle Eastern, Latin American, and African (MELAA) ethnicities.
3.3. Sleep (B+)
The sleep grade was assigned drawing upon Active NZ Young People Survey data.51 Overall, 74.6% met age specific sleep recommendations. A considerably smaller proportion of children and youth identifying as another gender met sleep recommendations compared to boys or girls. The proportion of children and youth meeting sleep recommendations varied considerably by ethnicity, and was highest among those identifying as ‘other’ ethnicities, followed by children of European, Māori, Asian, MELAA, and Pasifika ethnicities. More non-disabled children and youth met sleep recommendations compared with disabled children and youth. A lower proportion of children and youth from areas of high socio-economic deprivation met sleep recommendations than children and youth from areas of mid to low deprivation. Indication of a trend towards increased likelihood of meeting sleep recommendations with decreasing urbanicity was found. The proportion of children and youth who met sleep recommendations lowered with advancing school year.
3.4. Organised sport and physical activity (B-)
The organised sport and physical activity grade was assigned drawing upon Active NZ Young People Survey data.51 Overall, 66.4% had participated in organised sport (competition or tournament, or training with a coach/instructor, excluding participation at school) in the past 7 days. A similar proportion of girls and boys participated in organised sport, and considerably fewer children and youth identifying as another gender participated in organised sport. A higher proportion of Pasifika and Māori children and youth engaged in organised sport than children of MELAA, European, or Asian ethnicities. A considerably smaller proportion of children and youth of other ethnicities engaged in organised sport. A similar proportion of disabled and non-disabled children and youth engaged in organised sport. A higher proportion of children and youth residing in areas of higher socio-economic deprivation were engaged in organised sport than children and youth residing in areas of lower deprivation. A higher proportion residing in rural areas were engaged in organised sport than those residing in urban areas. A higher proportion of children in school years 7–10 participated in organised sport than those in years 0–6 and years 11–13.
3.5. Physical literacy (B)
The physical literacy grade was assigned drawing upon Active NZ Young People Survey data.51 The physical literacy grade was determined based on the proportion of children and youth who reported agreement (on average) to questions regarding each of the physical literacy components (motivation, confidence, competence, understanding, value, and engagement). Overall, 69.9% reported agreement with a similar proportion of girls and boys and considerably lower proportion of those identifying as another gender reporting agreement. A similar proportion of European, Māori, Pasifika, and MELAA children and youth reported agreement. A lower proportion of those identifying as Asian or ‘other’ ethnicities reported agreement than those from other ethnic groups. A higher proportion of non-disabled children and youth reported agreement compared to disabled children and youth. The proportion who reported agreement decreased slightly with increasing levels of socio-economic deprivation; however, there were few differences in physical literacy based on urbanicity. The proportion who reported agreement was lower among those in school years 11–13 compared with those in lower school years.
3.6. School (C+)
As of 2022, Aotearoa does not have guidelines regarding the amount of PE required,25 but PE is compulsory for students in Years 1 through 10 (ages ∼5–15 years). From year 11 onwards PE is optional, and the proportion of children and youth enrolled in PE or Health & PE as subjects declines considerably based on 2019 Ministry of Education data: 87.8% of Year 9–10 students, 42.8% of Year 11 students, 28.7% of Year 12 students, and 20.9% of Year 13 students.55 The school indicator grade was based on the average (55.0%) of the proportion of students meaningfully engaged in school sport according to the 2019 NZ Secondary School Sports Census (51.0%),54 and the proportion of children and youth who had been active in PE or class at school in the last seven days according to the Active NZ Young Peoples survey (59.0%). A smaller proportion identifying as non-binary had been active in PE or class at school in the last seven days. A higher proportion of children and youth of Pasifika, Māori, and MELAA ethnicities had been active in PE or class at school in the last seven days compared to European, Asian, and “Other” ethnicity children and youth. Activity in PE or class at school in the last seven days did not differ between disabled and non-disabled children and youth. A higher proportion of children and youth residing in high socio-economic deprivation areas had been active in PE or class at school in the last seven days. The proportion who had been active in PE or class at school in the last seven days did not differ based on urbanicity. The proportion who had been active in PE or class at school in the last seven days was highest among those in school years 7–10, followed by those in years 0–6, with a considerably smaller proportion of those in years 11–13 reporting that they had been active in PE or class at school in the last seven days.
3.7. Active play (INC)
An inconclusive grade was assigned for active play due to lack of sufficient data that align with the 2022 AHKGA criteria. Using the same criteria as used in Aotearoa's previous report card, 80.8% of children and youth reported engaging in physical activities (including sports) playing alone and/or playing or hanging out with friends or family in the past seven days, aligning with an A-grade.
3.8. Family/whānau and peers (D)
The family/whānau and peers grade was assigned drawing upon Active NZ Survey data.51 The family/whānau and peers grade was based on the proportion of household adults meeting PA recommendations (29.4%). This includes aerobic and muscle-strengthening recommendations,1 which goes beyond the AHKGA criteria, which focusses exclusively on aerobic PA recommendations.
3.9. Community and environment (INC)
Community and environment was assigned an inconclusive grade due to insufficient timely analyses available. The methods used for the previous report card has not been repeated since, and data for other benchmarking criteria (e.g. child and parent perceptions on community-level PA support) do not exist. Findings from a nationwide examination of access to key destinations (greenspace, blue space, PA facilities)56 offer some insight but were not directly related to the criteria.
3.10. Active transportation (D)
While AT can be accumulated between a range of settings, most evidence explored rates of travel to and/or from school. The overall grade for AT was determined based on the mean percentage of prevalence (31.3%) in AT to/from school derived from three national data sources between 2019 and 2020:
-
-
NZ Health Survey 2019/202052 - 42.4% of children and youth aged 5–14 years
-
-
NZ Household Travel Survey 2019/202053 - 22.6% of children and youth aged 5–17 years
-
-
Active NZ Young People Survey 2019/202051–29.0% of children and youth aged 8–14 years
A smaller proportion of girls (28.4%) used AT than boys (34.1%). A smaller proportion of children and youth of Pacific (24.8%) ethnicity used AT compared to those of European and other (32.2%), Asian (33.2%), or Māori (33.7%) ethnicities. AT did not differ based on disability, or socio-economic deprivation. A smaller proportion living in rural areas used AT than those living in urban areas (11.7% vs. 28.7%). Compared to children (school year: 0–10), youth (school year: 11–13) were less likely to use AT (29.9% [5–9 years] and 33.9% [10–14 years] vs. 21.7% [15–17 years]).
3.11. Government (A)
Annually NZ$2.55 billilon of funding (2019/2020) was invested in active recreation and sport across sectors in Aotearoa (local government, central government, participation, gambling, commercial, universities and philanthropy). The Local Government sector accounts for the largest expenditure, allocating 50% of funding. Where feasible most major (city, regional, and district) councils across the country provided evidence on investments made in child and youth active recreation and sport (2018–2021). A key agency and kaitiaki (guardian) of the Play, Active Recreation and Sport system in Aotearoa is Sport NZ. Sport NZ is a crown agency with a vision “to get Every Body Active”. Their leadership role, strategy and priority focus on children and youth is articulated in the Every Body Active 2020–2032 strategic direction, 2020–2024 strategic plan, Te Pākē o Ihi Aotearoa (2021–2032 Māori Outcomes framework), and Te Aho o Ihi Aotearoa (2021–2024 Māori Activation Plan). Sport NZ completes annual assessments and reporting on the performance of its investment into the sector, fund independent evaluations of all major initiatives to inform a reshape of the initiative and/or continuation/cessation of funding.57
4. Discussion
Encouraging lifelong participation in PA is essential for health and wellbeing.2 Some positives can be gleaned from our findings, particularly that more than half of children and youth meet PA recommendations. However, these results, and comparison with 2018 grades below demonstrate that much work is needed to address inequities with targeted and population-specific strategies that support PA participation for all children and youth in Aotearoa.
The grade for overall PA increased from D- in 2018 to C+, a change largely attributable to using the global PA recommendations that state children and youth should accumulate an average of 60 min of PA each day2 as opposed to earlier recommendations58 (including Aotearoa's) that state at least 60 min of PA should be accumulated each day.59 Inclusion of strength training recommendations for children and youth should be considered in future iterations of these report cards. With respect to sedentary behaviours, the grade improved slightly from a D to a C-.
In recognition of Aotearoa's recent adoption of guidelines that incorporate PA, sedentary behaviours, and sleep we included sleep in our report card for the first time which was assigned a B+ grade. More work is needed to better measure sedentary behaviours and understand the nuance of what constitutes and supports quality sleep for children and youth. Adoption of 24 h movement guidelines is commendable, but further work is needed to disseminate these guidelines and the ‘sit less, move more, and sleep well’ message,59 to the extent that Canada has done for all age groups.20,60 Moreover, evidence-based strategies that simultaneously promote PA, sleep and limiting sedentary behaviours whilst acknowledging these behaviours vary based on socio-demographic characteristics are needed.
The school indicator grade dropped from B- to C+. Schools play an important role in facilitating PA participation across a range of areas, including travel to and from school, PE, and sport. The AT grade continued a downward trend61 declining from C- to D. Less than a third of children and youth use AT to get to and from school, highlighting an opportunity for substantial improvement. Strategies to increase AT, such as reducing distance to school (e.g., through zoning policies and strategies to increase cycling rates), policies that influence socio-cultural norms and improve supporting infrastructure for children and youth to move safely around their neighborhoods are crucial.43,62, 63, 64
The organised sport grade declined from B to B-. Sport comprises a considerable portion of the PA accumulated by children and youth,32 and participating in sport has been linked with better wellbeing.34,65 Providing children and youth quality experiences that positively engages them as they age is crucial to improving physical literacy and promoting lifelong PA participation. Sport NZ has prioritized physical literacy in recent years, and unlike physical fitness, national data were available for physical literacy. It is positive that the responses of many children indicated high self-perceived physical literacy, but children and youth of Asian ethnicities, disabled children and youth, and older children and youth did not fare as well as others. Given the association between physical literacy and PA participation66,67 and that physical literacy encompasses a range of components, further research is warranted to understand which components may be contributing to these inequities to inform decision making regarding efforts to intervene to address PA inequities.
Assigning grades for the active play, family/whānau and peers, and community and environment indicators was hampered by the lack of suitable data. Active play is important for child and youth development, but the available data do not provide a clear indication of participation levels and therefore we reported an inconclusive grade. Further work to refine the measurement of active play and determine evidence-based thresholds for benchmarking criteria is needed. Close social networks play an important role in shaping PA behaviours of children and youth, but the available data do not provide a clear indication of existing levels of support from family and friends. Instead, we based our grade purely on the PA levels of household adults of children and youth, which is a relatively poor indicator. Future work to integrate appropriate measures and evidence-based thresholds for peer and family support pertaining to PA is needed. The community and environment (built, natural, and social) are critical determinants of PA behaviours of children and youth, but there was a paucity of up-to-date data to assess this indicator. Updated data procurement and analyses of relevant community and environment determinants of PA is needed. Since the 2018 report card22 there has been significant central and local government investment in PA and sport initiatives, with Sport NZ playing a key role. The government indicator improved from B+ to A. While there seems to be a disconnect between the improvement of this indicator others, time is needed for initiatives to demonstrate a population-wide effect.
4.1. Inequities
Differences based on ethnicity varied across indicators, though children and youth of Asian ethnicities appeared to fare less favorably compared to those of other ethnicities for several indicators. Numerous inequities were found for disabled children and youth. Inequities based on socioeconomic deprivation varied across indicators. Participants who were of ‘another gender’ tended to fare less favorably than boys and girls, though findings may be biased by a small number of these participants, highlighting the need for further research. Differences based on urbanicity were minimal, though those residing in main urban areas fared less favorably in relation to overall PA. Generally, the proportion of children and youth meeting most criteria tended to decrease with increasing age. Further investigation of inequities is warranted, especially inequities based on intersecting characteristics.
4.2. Limitations
Overall, data sources, data availability, and benchmarking criteria and thresholds have differed across time and countries. In some instances, differences are positive and reflect improvements in data quality (e.g. the introduction of the Active NZ Young People Survey) or criteria (e.g. new PA recommendations for children and youth1). Regardless, caution is warranted when making comparisons in grades between countries, and between time points for the Aotearoa Report Cards.
Though we stratified grades based on socio-demographic characteristics, there remains room for improvement. For example, though we examined differences based on urbanicity, geographical distribution of children and youth was not considered. Other important socio-demographic characteristics that PA inequities have been reported to exist based upon in the past, such as sexual orientation,68 are not measured in the datasets we used. The exclusion or lack of acknowledgement of children and youth intellectual disabilities within datasets has also been noted in a tangential piece of work, and we only looked at inequities based on single characteristics as opposed to intersecting characteristics which can provide greater insight.69 Moreover, our sample is not necessarily representative of the wider population of children and youth in Aotearoa, with those from certain groups (e.g. disabled children and youth) underrepresented. For example, the proportion of our sample considered to have a disability is far below previous estimates reported for children and youth,70 though different assessment methods for identifying disability status were used. A lack of high quality data for all children and youth in Aotearoa and particularly for those experiencing inequities is an ongoing issue.71 Although whenever possible we used weighted data to ensure our results were as representative as possible, this was not possible for all data sources. Thus, the current findings must be treated with caution, as there is the possibility of systemic error and variation over time in the metrics used as well as the sampling and recruitment processes applied within each of the data sources we used. Despite these limitations, taking steps to report on inequities and identifying limitations in the existing data sources provides an important starting point for a discussion as to how to address them.
Although this report card is for the 2022 time period, grades presented all pertain to data collected prior to the arrival of COVID-19 to Aotearoa in March 2020. Future work will explore shifts in PA that may have occurred during the current pandemic as well as changes specifically related to periods of lockdown and whether the inequities evident in the report card have persisted, reduced, or worsened.
5. Conclusion
The three key recommendations from the 2018 Report Card22 remain unchanged. We have added a fourth recommendation in the 2022 Report Card, which has highlighted a range of inequities across PA dimensions and sociodemographic characteristics.
-
1.
Develop and implement regular nationally representative surveys that enable the consistent and regular measurement of key Report Card indicators (and others).
-
2.
AT to school is an important contributor to health but rates are low. Investment in multi-sectoral approaches including urban planning, school and community-led initiatives and social marketing campaigns is recommended.
-
3.
Promote all dimensions of PA (overall activity, active play, recreation, organised sport, AT) and the reduction of screen time through policy, research, evidence-based social marketing campaigns, and urban design.
-
4.
It is imperative that targeted, comprehensive, and population-specific approaches are implemented to support health-promoting PA behaviours and reduce inequities among children and youth in Aotearoa.
Author contributions
The initial 2022 Report Card team comprised national experts in children's PA identified from previous report cards (MS, EI, EH, SM, SD, RM, KM-J). In addition, emerging PA researchers (OW & LC), an expert in Māori health and wellbeing (GK), and a PA academic expert and representative from Sport NZ (JR) were invited. Team members had individual responsibility for sourcing data and developing draft grades, with support from the wider team. The team met regularly via Zoom (due to COVID-19 related safety measures) to identify and discuss potential data sources and key contacts for locating information, and the development of draft grades. Oversight and guidance in terms of interpretation of findings, determining implications, and development of recommendations was provided by GK and JR.
Declaration of competing interest
Sandra Mandic is the founder and the director of the research consultancy AGILE Research Ltd. (www.agileresearch.nz) and Principal Advisor Transport Strategy at Wellington City Council (Wellington, New Zealand). Other authors have no conflicts of interest. The authors otherwise declare no conflict of interest.
Acknowledgements
The team would like to acknowledge the support of the following individuals in providing data and advice regarding data used in this report: Janette Brocklesby, Stefanie Ruckpaul, Bridgette Lynch, Jay Carlsen, and Hamish McEwen (Sport New Zealand Ihi Aotearoa), Kris Mayo, Megan Walker and Anna Kean (Nielsen), Jennifer McSaveney (Ministry of Transport), Mike Summerell (School Sport New Zealand), Jesse Wiki and the team at the GeoHealth Laboratory (University of Canterbury), and Hannah Quigan and Harriette Carr (Ministry of Health).
Footnotes
Supplementary data to this article can be found online at https://doi.org/10.1016/j.jesf.2022.10.009.
Contributor Information
Oliver W.A. Wilson, Email: oliver.wilson@vuw.ac.nz.
Erika Ikeda, Email: Erika.Ikeda@mrc-epid.cam.ac.uk.
Erica Hinckson, Email: erica.hinckson@aut.ac.nz.
Sandra Mandic, Email: sandy.mandic@aut.ac.nz.
Justin Richards, Email: justin.richards@vuw.ac.nz.
Scott Duncan, Email: scott.duncan@aut.ac.nz.
Geoff Kira, Email: G.Kira@massey.ac.nz.
Ralph Maddison, Email: ralph.maddison@deakin.edu.au.
Kim Meredith-Jones, Email: Kim.meredith-jones@otago.ac.nz.
Lana Chisholm, Email: lana.chisholm@aut.ac.nz.
Lisa Williams, Email: la.williams@auckland.ac.nz.
Melody Smith, Email: melody.smith@auckland.ac.nz.
Appendix A. Supplementary data
The following are the Supplementary data to this article:
References
- 1.World Health Organization . 2020. Global Recommendations on Physical Activity for Health. [PubMed] [Google Scholar]
- 2.Bull F.C., Al-Ansari S.S., Biddle S., et al. World Health Organization 2020 guidelines on physical activity and sedentary behaviour. Br J Sports Med. 2020;54(24):1451. doi: 10.1136/bjsports-2020-102955. [DOI] [PMC free article] [PubMed] [Google Scholar]
- 3.Wilson O.W.A., Whatman C., Walters S.R., et al. The Value of Sport: wellbeing benefits of sport participation during adolescence in Aotearoa New Zealand. Int J Environ Res Publ Health. 2022;19(4) doi: 10.3390/ijerph19148579. [DOI] [PMC free article] [PubMed] [Google Scholar]
- 4.Biddle S.J.H., Ciaccioni S., Thomas G., Vergeer I. Physical activity and mental health in children and adolescents: an updated review of reviews and an analysis of causality. Psychol Sport Exerc. 2019;42:146–155. doi: 10.1016/j.psychsport.2018.08.011. [DOI] [Google Scholar]
- 5.Lubans D., Richards J., Hillman C., et al. Physical activity for cognitive and mental health in youth: a systematic review of mechanisms. Pediatrics. 2016;138(3) doi: 10.1542/peds.2016-1642. [DOI] [PubMed] [Google Scholar]
- 6.McMahon E.M., Corcoran P., O'Regan G., et al. Physical activity in European adolescents and associations with anxiety, depression and well-being. Eur Child Adolesc Psychiatr. 2017;26(1):111–122. doi: 10.1007/s00787-016-0875-9. [DOI] [PubMed] [Google Scholar]
- 7.Panza M.J., Graupensperger S., Agans J.P., Doré I., Vella S.A., Evans M.B. Adolescent sport participation and symptoms of anxiety and depression: a systematic review and meta-analysis. J Sport Exerc Psychol. 2020:1–18. doi: 10.1123/jsep.2019-0235. [DOI] [PMC free article] [PubMed] [Google Scholar]
- 8.Rodriguez-Ayllon M., Cadenas-Sánchez C., Estévez-López F., et al. Role of physical activity and sedentary behavior in the mental Health of preschoolers, children and adolescents: a systematic review and meta-analysis. Sports Med. 2019;49(9):1383–1410. doi: 10.1007/s40279-019-01099-5. [DOI] [PubMed] [Google Scholar]
- 9.Lee J.E., Pope Z., Gao Z. The role of youth sports in promoting children's physical activity and preventing pediatric obesity: a systematic review. Behav Med. 2018;44(1):62–76. doi: 10.1080/08964289.2016.1193462. [DOI] [PubMed] [Google Scholar]
- 10.Macdonald-Wallis K., Jago R., Sterne J.A.C. Social network analysis of childhood and youth physical activity: a systematic review. Am J Prev Med. 2012;43(6):636–642. doi: 10.1016/j.amepre.2012.08.021. [DOI] [PubMed] [Google Scholar]
- 11.Beets M.W., Cardinal B.J., Alderman B.L. Parental social support and the physical activity-related behaviors of youth: a review. Health Educ Behav : the official publication of the Society for Public Health Education. 2010;37(5):621–644. doi: 10.1177/1090198110363884. [DOI] [PubMed] [Google Scholar]
- 12.Laird Y., Fawkner S., Kelly P., McNamee L., Niven A. The role of social support on physical activity behaviour in adolescent girls: a systematic review and meta-analysis. Int J Behav Nutr Phys Activ. 2016;13(1):79. doi: 10.1186/s12966-016-0405-7. [DOI] [PMC free article] [PubMed] [Google Scholar]
- 13.Draper C.E., Grobler L., Micklesfield L.K., Norris S.A. Impact of social norms and social support on diet, physical activity and sedentary behaviour of adolescents: a scoping review. Child Care Health Dev. 2015;41(5):654–667. doi: 10.1111/cch.12241. [DOI] [PubMed] [Google Scholar]
- 14.Mendonça G., Cheng L.A., Mélo E.N., de Farias Júnior J.C. Physical activity and social support in adolescents: a systematic review. Health Educ Res. 2014;29(5):822–839. doi: 10.1093/her/cyu017. [DOI] [PubMed] [Google Scholar]
- 15.Caldwell H.A.T., Di Cristofaro N.A., Cairney J., Bray S.R., MacDonald M.J., Timmons B.W. Physical literacy, physical activity, and health indicators in school-age children. Int J Environ Health Res Public Health. 2020;17(15) doi: 10.3390/ijerph17155367. [DOI] [PMC free article] [PubMed] [Google Scholar]
- 16.Belanger K., Barnes J.D., Longmuir P.E., et al. The relationship between physical literacy scores and adherence to Canadian physical activity and sedentary behaviour guidelines. BMC Publ Health. 2018;18(2):1042. doi: 10.1186/s12889-018-5897-4. [DOI] [PMC free article] [PubMed] [Google Scholar]
- 17.Donnelly J.E., Hillman C.H., Castelli D., et al. Physical activity, fitness, cognitive function, and academic achievement in children: a systematic review. Med Sci Sports Exerc. 2016;48(6):1197–1222. doi: 10.1249/MSS.0000000000000901. [DOI] [PMC free article] [PubMed] [Google Scholar]
- 18.Barbosa A., Whiting S., Simmonds P., Scotini Moreno R., Mendes R., Breda J. Physical activity and academic achievement: an umbrella review. Int J Environ Health Res Public Health. 2020;17(16):5972. doi: 10.3390/ijerph17165972. [DOI] [PMC free article] [PubMed] [Google Scholar]
- 19.Abarca-Gómez L., Abdeen Z.A., Hamid Z.A., et al. Worldwide trends in body-mass index, underweight, overweight, and obesity from 1975 to 2016: a pooled analysis of 2416 population-based measurement studies in 128·9 million children, adolescents, and adults. Lancet. 2017;390(10113):2627–2642. doi: 10.1016/S0140-6736(17)32129-3. [DOI] [PMC free article] [PubMed] [Google Scholar]
- 20.Tremblay M.S., Carson V., Chaput J.-P., et al. Canadian 24-hour movement guidelines for children and youth: an integration of physical activity, sedentary behaviour, and sleep. Appl Physiol Nutr Metabol. 2016;41(6):S311–S327. doi: 10.1139/apnm-2016-0151. [DOI] [PubMed] [Google Scholar]
- 21.Ministry of Health - Manatū Hauora . 2020. Annual Data Explorer 2019/2020: NZ Health Survey.https://minhealthnz.shinyapps.io/nz-health-survey-2019-20-annual-data-explorer . Published. [Google Scholar]
- 22.Smith M., Ikeda E., Hinckson E., et al. Results from New Zealand's 2018 report card on physical activity for children and youth. J Phys Activ Health. 2018;15(s2):S390–S392. doi: 10.1123/jpah.2018-0463. [DOI] [PubMed] [Google Scholar]
- 23.Mandic S., Bengoechea E.G., Coppell K.J., Spence J.C. Clustering of (un)healthy behaviors in adolescents from Dunedin, New Zealand. Am J Health Behav. 2017;41(3):266–275. doi: 10.5993/ajhb.41.3.6. [DOI] [PubMed] [Google Scholar]
- 24.World Health Organization . World Health Organization; 2021. Promoting Physical Activity through Schools: A Toolkit. [Google Scholar]
- 25.Mizdrak A., Shaw C., Lynch B., Richards J. The potential of school-based physical education to increase physical activity in Aotearoa New Zealand children and young people: a modelling study. NZ Med J. 2021;134(1531):23–35. Published 2021/03/27. [PubMed] [Google Scholar]
- 26.Denstel K.D., Broyles S.T., Larouche R., et al. Active school transport and weekday physical activity in 9-11-year-old children from 12 countries. Int J Obes Suppl. 2015;5(Suppl 2):S100–S106. doi: 10.1038/ijosup.2015.26. [DOI] [PMC free article] [PubMed] [Google Scholar]
- 27.Schoeppe S., Duncan M.J., Badland H., Oliver M., Curtis C. Associations of children's independent mobility and active travel with physical activity, sedentary behaviour and weight status: a systematic review. J Sci Med Sport. 2013;16(4):312–319. doi: 10.1016/j.jsams.2012.11.001. [DOI] [PubMed] [Google Scholar]
- 28.Kek C.C., García Bengoechea E., Spence J.C., Mandic S. The relationship between transport-to-school habits and physical activity in a sample of New Zealand adolescents. J Sport Health Sci. 2019;8(5):463–470. doi: 10.1016/j.jshs.2019.02.006. [DOI] [PMC free article] [PubMed] [Google Scholar]
- 29.Khan A., Mandic S., Uddin R. Association of active school commuting with physical activity and sedentary behaviour among adolescents: a global perspective from 80 countries. J Sci Med Sport. 2021;24(6):567–572. doi: 10.1016/j.jsams.2020.12.002. [DOI] [PubMed] [Google Scholar]
- 30.White B., Gb E., Spence J.C., Coppell K.J., Mandic S. Comparison of physical activity patterns across large, medium, and small urban areas and rural settings in the Otago Region, New Zealand. NZ Med J. 2021;134:51–65. [PubMed] [Google Scholar]
- 31.Henriques-Neto D., Peralta M., Garradas S., et al. Active commuting and physical fitness: a systematic review. Int J Environ Res Publ Health. 2020;17(8) doi: 10.3390/ijerph17082721. [DOI] [PMC free article] [PubMed] [Google Scholar]
- 32.Marques A., Ekelund U., Sardinha L.B. Associations between organized sports participation and objectively measured physical activity, sedentary time and weight status in youth. J Sci Med Sport. 2016;19(2):154–157. doi: 10.1016/j.jsams.2015.02.007. [DOI] [PMC free article] [PubMed] [Google Scholar]
- 33.Silva G., Andersen L.B., Aires L., Mota J., Oliveira J., Ribeiro J.C. Associations between sports participation, levels of moderate to vigorous physical activity and cardiorespiratory fitness in childrenand adolescents. J Sports Sci. 2013;31(12):1359–1367. doi: 10.1080/02640414.2013.781666. [DOI] [PubMed] [Google Scholar]
- 34.Eime R.M., Young J.A., Harvey J.T., Charity M.J., Payne W.R. A systematic review of the psychological and social benefits of participation in sport for children and adolescents: informing development of a conceptual model of health through sport. Int J Behav Nutr Phys Activ. 2013;10(1):98. doi: 10.1186/1479-5868-10-98. [DOI] [PMC free article] [PubMed] [Google Scholar]
- 35.Brussoni M., Gibbons R., Gray C., et al. What is the relationship between risky outdoor play and health in children? A systematic review. Int J Environ Res Publ Health. 2015;12(6):6423–6454. doi: 10.3390/ijerph120606423. [DOI] [PMC free article] [PubMed] [Google Scholar]
- 36.Gray C., Gibbons R., Larouche R., et al. What is the relationship between outdoor time and physical activity, sedentary behaviour, and physical fitness in children? A systematic review. Int J Environ Res Publ Health. 2015;12(6):6455–6474. doi: 10.3390/ijerph120606455. [DOI] [PMC free article] [PubMed] [Google Scholar]
- 37.Whitebread D. Free play and children's mental health. Lancet Child Adolesc Health. 2017;1(3):167–169. doi: 10.1016/S2352-4642(17)30092-5. [DOI] [PubMed] [Google Scholar]
- 38.Sport New Zealand Ihi Aotearoa . 2022. Physical Literacy Approach.https://sportnz.org.nz/resources/physical-literacy-approach/ . Published. [Google Scholar]
- 39.Sallis J.F., Owen N., Fisher E.B. In: Health Behavior and Health Education: Theory, Research, and Practice. fourth ed. Glanz K., Rimer B.K., Viswanath K., editors. John Wiley & Sons, Inc.; Hoboken, NJ: 2008. Ecological models of health behavior. [Google Scholar]
- 40.Biddle S.J.H., Atkin A.J., Cavill N., Foster C. Correlates of physical activity in youth: a review of quantitative systematic reviews. Int Rev Sport Exerc Psychol. 2011;4(1):25–49. doi: 10.1080/1750984X.2010.548528. [DOI] [Google Scholar]
- 41.Petersen T.L., Møller L.B., Brønd J.C., Jepsen R., Grøntved A. Association between parent and child physical activity: a systematic review. Int J Behav Nutr Phys Activ. 2020;17(1):67. doi: 10.1186/s12966-020-00966-z. [DOI] [PMC free article] [PubMed] [Google Scholar]
- 42.Macdonald-Wallis K., Jago R., Sterne J.A. Social network analysis of childhood and youth physical activity: a systematic review. Am J Prev Med. 2012;43(6):636–642. doi: 10.1016/j.amepre.2012.08.021. [DOI] [PubMed] [Google Scholar]
- 43.Ikeda E., Hinckson E., Witten K., Smith M. Associations of children's active school travel with perceptions of the physical environment and characteristics of the social environment: a systematic review. Health Place. 2018;54:118–131. doi: 10.1016/j.healthplace.2018.09.009. [DOI] [PubMed] [Google Scholar]
- 44.Smith M., Hosking J., Woodward A., et al. Systematic literature review of built environment effects on physical activity and active transport – an update and new findings on health equity. Int J Behav Nutr Phys Activ. 2017;14(1):158. doi: 10.1186/s12966-017-0613-9. [DOI] [PMC free article] [PubMed] [Google Scholar]
- 45.Smith M., Mavoa S., Ikeda E., et al. Associations between children's physical activity and neighborhood environments using GIS: a secondary analysis from a systematic scoping review. Int J Environ Res Publ Health. 2022;19(3):1033. doi: 10.3390/ijerph19031033. [DOI] [PMC free article] [PubMed] [Google Scholar]
- 46.World Health Organisation. Global Action Plan on Physical Activity 2018–2030: More Active People for a Healthier World. Geneva, Switzerland2018.
- 47.Reis R.S., Salvo D., Ogilvie D., Lambert E.V., Goenka S., Brownson R.C. Scaling up physical activity interventions worldwide: stepping up to larger and smarter approaches to get people moving. Lancet. 2016;388(10051):1337–1348. doi: 10.1016/S0140-6736(16)30728-0. [DOI] [PMC free article] [PubMed] [Google Scholar]
- 48.Maddison R., Dale L.P., Marsh S., LeBlanc A.G., Oliver M. Results from New Zealand's 2014 report card on physical activity for children and youth. J Phys Activ Health. 2014;11(Suppl 1):S83–S87. doi: 10.1123/jpah.2014-0180. [DOI] [PubMed] [Google Scholar]
- 49.Maddison R., Marsh S., Hinckson E., et al. Results from New Zealand's 2016 report card on physical activity for children and youth. J Phys Activ Health. 2016;13(11 Suppl 2):S225–S230. doi: 10.1123/jpah.2016-0323. [DOI] [PubMed] [Google Scholar]
- 50.Aubert S., Barnes J.D., Tremblay M. Evaluation of the process and outcomes of the Global Matrix 3.0 of physical activity grades for children and youth. J Exerc Sci Fit. 2020;18(2):80–88. doi: 10.1016/j.jesf.2020.01.002. [DOI] [PMC free article] [PubMed] [Google Scholar]
- 51.Sport New Zealand Ihi Aotearoa . The Nielsen Company; 2020. Active NZ and Active NZ Young People Technical Report for Data Collected in 2019. [Google Scholar]
- 52.Ministry of Health Manatū Hauora . Ministry of Health Manatū Hauora; Wellington: 2020. Methodology Report 2019/20: New Zealand Health Survey. [Google Scholar]
- 53.Ministry of Transport Te Manatū Waka . Ministry of Transport Te Manatū Waka; Wellington: 2020. New Zealand Household Travel Survey 2019-2020 Questionnaire. [Google Scholar]
- 54.School sport New Zealand. Census reports 2020. https://www.sporty.co.nz/nzsssc/Education/School-Sport-NZ-Census-Reports . Published.
- 55.Education Counts . 2022. School Subject Enrolment.https://www.educationcounts.govt.nz/statistics/subject-enrolment . Published. [Google Scholar]
- 56.Marek L., Hobbs M., Wiki J., Kingham S., Campbell M. The good, the bad, and the environment: developing an area-based measure of access to health-promoting and health-constraining environments in New Zealand. Int J Health Geogr. 2021;20(1):16. doi: 10.1186/s12942-021-00269-x. [DOI] [PMC free article] [PubMed] [Google Scholar]
- 57.Sport New Zealand Ihi Aotearoa. Every Body Active: Strategic Plan 2020-2024 and Strategic Direction. Wellington2020.
- 58.World Health Organization. Global Recommendations on Physical Activity for Health. Geneva2010. [PubMed]
- 59.Ministry of Health - Manatū Hauora . 2017. Sit Less, Move More, Sleep Well: Physical Activity Guidelines for Children and Young People. [Google Scholar]
- 60.Ross R., Chaput J.-P., Giangregorio L.M., et al. Canadian 24-hour movement guidelines for adults aged 18–64 years and adults aged 65 years or older: an integration of physical activity, sedentary behaviour, and sleep. Appl Physiol Nutr Metabol. 2020;45(10):S57–S102. doi: 10.1139/apnm-2020-0467. [DOI] [PubMed] [Google Scholar]
- 61.Smith M., Ikeda E., Duncan S., et al. Trends and measurement issues for active transportation in New Zealand's physical activity report cards for children and youth. J Transport Health. 2019;15 doi: 10.1016/j.jth.2019.100789. [DOI] [Google Scholar]
- 62.Ikeda E., Stewart T., Garrett N., et al. Built environment associates of active school travel in New Zealand children and youth: a systematic meta-analysis using individual participant data. J Transport Health. 2018;9:117–131. doi: 10.1016/j.jth.2018.04.007. [DOI] [Google Scholar]
- 63.Smith M., Ikeda E., Hawley G., et al. An integrated conceptual model of environmental needs for New Zealand children's active travel to school. J Transport Health. 2020;16 doi: 10.1016/j.jth.2019.100814. [DOI] [Google Scholar]
- 64.Mandic S, García Bengoechea E, Hopkins D, et al. Examining the transport to school patterns of New Zealand adolescents by home-to-school distance and settlement types. J. Transport Health. In Review.
- 65.Wilson O.W.A., Whatman C., Walters S.R., et al. Balance is Better”: the wellbeing benefits of participating in a breadth of sports across a variety of settings during adolescence. Int J Environ Res Publ Health. 2022;19(14) doi: 10.3390/ijerph19148597. [DOI] [PMC free article] [PubMed] [Google Scholar]
- 66.Belanger K., Barnes J.D., Longmuir P.E., et al. The relationship between physical literacy scores and adherence to Canadian physical activity and sedentary behaviour guidelines. BMC Publ Health. 2018;18(Suppl 2):1042. doi: 10.1186/s12889-018-5897-4. [DOI] [PMC free article] [PubMed] [Google Scholar]
- 67.Caldwell H.A.T., Di Cristofaro N.A., Cairney J., Bray S.R., MacDonald M.J., Timmons B.W. Physical literacy, physical activity, and health indicators in school-age children. Int J Environ Res Publ Health. 2020;17(15) doi: 10.3390/ijerph17155367. [DOI] [PMC free article] [PubMed] [Google Scholar]
- 68.Lucassen M.F.G., Guntupalli A.M., Clark T., et al. Body size and weight, and the nutrition and activity behaviours of sexual and gender minority youth: findings and implications from New Zealand. Publ Health Nutr. 2019;22(13):2346–2356. doi: 10.1017/S1368980019001149. [DOI] [PMC free article] [PubMed] [Google Scholar]
- 69.Owen K.B., Nau T., Reece L.J., et al. Fair play? Participation equity in organised sport and physical activity among children and adolescents in high income countries: a systematic review and meta-analysis. Int J Behav Nutr Phys Activ. 2022;19(1):27. doi: 10.1186/s12966-022-01263-7. [DOI] [PMC free article] [PubMed] [Google Scholar]
- 70.Ministry of Health Manatū Hauora Disability 2013. https://www.health.govt.nz/our-work/populations/maori-health/tatau-kahukura-maori-health-statistics/nga-mana-hauora-tutohu-health-status-indicators/disability . Published.
- 71.Wynd D. Child Poverty Action Group; 2015. ‘It Shouldn't Be This Hard’: Children, Poverty and Disability. [Google Scholar]
Associated Data
This section collects any data citations, data availability statements, or supplementary materials included in this article.