

Abstract
In August 2022, the European Commission asked EFSA to provide a statement on the available outcomes of the assessment of environmental fate and behaviour and ecotoxicology drawn in the context of the pesticides peer review for the renewal of approval of the active substance dimoxystrobin conducted in accordance with Commission Implementing Regulation (EC) No 844/2012. The current statement contains the conclusions of the assessments related to environmental fate and behaviour and ecotoxicology finalised following the pesticides peer review expert discussions held in January and June 2022. The concerns identified are presented.
Keywords: dimoxystrobin, pesticide, fungicide, peer review, environmental fate and behaviour, ecotoxicology assessment
Summary
Dimoxystrobin is an active substance covered by the third stage of the renewal programme for pesticides (‘AIR3’) in accordance with Commission Implementing Regulation (EU) No 844/2012.
An application for the renewal of approval of the active substance dimoxystrobin followed by the submission of the supplementary dossiers in July 2015 was made by BASF SE to the rapporteur Member State (RMS), Hungary, and the co‐rapporteur Member State (co‐RMS), Ireland.
An initial evaluation of the dossiers was provided by the RMS in the Renewal Assessment Report (RAR) which was submitted to EFSA in September 2017. Subsequently, EFSA initiated a peer review of the pesticides risk assessment on the RMS evaluation in line with the provisions of Commission Implementing Regulation (EU) No 844/2012.
Following the completion of a commenting period, including a public consultation on the RAR, EFSA requested the applicant to provide certain additional information under the stop the clock procedure in accordance with Article 13(3) of Regulation (EU) No 844/2012, which was evaluated by Hungary and incorporated into an updated RAR. Subsequently, in January 2022, meetings of experts from EFSA and Member States took place to discuss certain elements related to mammalian toxicology, environmental fate and behaviour and ecotoxicology. In addition, in June 2022, follow‐up meetings of experts from EFSA and Member States took place to further discuss elements related to mammalian toxicology and ecotoxicology.
In August 2022, prior to completion of the peer review process, EFSA was mandated by the European Commission to provide a statement on the available outcomes of the assessment of environmental fate and behaviour and ecotoxicology drawn in the context of the peer review of dimoxystrobin.
The present statement contains the finalised conclusions of the assessments related to environmental fate and behaviour and ecotoxicology following the pesticides peer review expert discussions in those areas held in January and June 2022.
The data available on environmental fate and behaviour were sufficient to carry out the required environmental exposure assessments at EU level for the representative uses. A critical area of concern with respect to point 3.10 of Annex II to Regulation (EC) No 1107/2009 was identified in relation to the potential for groundwater contamination by the relevant metabolites.
In the area of ecotoxicology, a high risk was identified for aquatic organisms leading to a critical area of concern. In addition, the risk assessment for honeybee larvae could not be finalised.
1. Introduction
Dimoxystrobin is an active substance covered by the third stage of the renewal programme for pesticides (‘AIR3’) in accordance with Commission Implementing Regulation (EU) No 844/2012 1 .
Commission Implementing Regulation (EU) No 844/2012, as amended by Commission Implementing Regulation (EU) No 2018/1659 2 (hereinafter referred to as ‘the Regulation’), lays down the provisions for the procedure of the renewal of the approval of active substances, submitted under Article 14 of Regulation (EC) No 1107/2009 3 . This regulates for the European Food Safety Authority (EFSA) the procedure for organising the consultation of Member States, the applicant(s) and the public on the initial evaluation provided by the rapporteur Member State (RMS) and/or co‐rapporteur Member State (co‐RMS) in the renewal assessment report (RAR), and the organisation of an expert consultation where appropriate.
In accordance with Article 13 of the Regulation, unless formally informed by the European Commission that a conclusion is not necessary, EFSA is required to adopt a conclusion on whether the active substance can be expected to meet the approval criteria provided for in Article 4 of Regulation (EC) No 1107/2009 within 5 months from the end of the period provided for the submission of written comments, subject to an extension of an additional 3 months where additional information is required to be submitted by the applicant(s) in accordance with Article 13(3). Furthermore, in accordance with Article 13(3a), where the information available in the dossier is not sufficient to conclude the assessment on whether the approval criteria for endocrine disruption are met, additional information can be requested to be submitted in a period of minimum 3 months, not exceeding 30 months, depending on the type of information requested.
In accordance with Article 1 of the Regulation, an application for the renewal of approval of the active substance dimoxystrobin followed by the submission of the supplementary dossiers in July 2015 was made by BASF SE to the rapporteur Member State (RMS), Hungary, and the co‐rapporteur Member State (co‐RMS), Ireland. The RMS provided its initial evaluation of the dossier on dimoxystrobin in the RAR, which was received by EFSA on 1 September 2017 (Hungary, 2017).
In accordance with Article 12 of the Regulation, EFSA distributed the RAR to the Member States and the applicant, BASF SE, for consultation and comments on 21 February 2019. EFSA also provided comments. In addition, EFSA conducted a public consultation on the RAR. EFSA collated and forwarded all comments received to the European Commission on 26 April 2019. At the same time, the collated comments were forwarded to the RMS for compilation and evaluation in the format of reporting table. In addition, the applicant was invited to respond to the comments received. The comments and the applicant's response were evaluated by the RMS in column 3 of the reporting table.
The need for expert consultation and the necessity for additional information to be submitted by the applicant in accordance with Article 13(3) of the Regulation were considered in a telephone conference between EFSA and the RMS on 17 July 2019. On the basis of the comments received, the applicant's response to the comments and the RMS's evaluation thereof, it was concluded that additional information should be requested from the applicant, and that EFSA should conduct an expert consultation in the areas of mammalian toxicology, environmental fate and behaviour and ecotoxicology, which took place in January 2022.
In addition, in June 2022, follow‐up meetings of experts from EFSA and Member States took place to further discuss elements related to mammalian toxicology and ecotoxicology.
Although the peer review process is not fully completed, with the assessment of the endocrine disruption properties according to point 3.8.2 of Annex II to Regulation (EC) No 1107/2009 remaining pending, all other aspects of the risk assessment are considered finalised. Likewise, the assessment concerning environmental fate and behaviour and ecotoxicology has been completed following the expert discussions in those areas. Subsequently, during the drafting of the EFSA Conclusion, EFSA informed the Commission that critical areas of concern have been identified for dimoxystrobin in those areas.
In this context, on 12 August 2022, prior to completion of the peer review process, EFSA was requested by the European Commission to provide a statement containing the available outcomes of the assessment related to environmental fate and behaviour and ecotoxicology. Given the critical concerns identified, a request in accordance with Commission Implementing Regulation (EU) No 2018/1659, to be able to conclude whether the approval criteria for endocrine disruption in line with the scientific criteria for the determination of endocrine‐disrupting properties, as laid down in Commission Regulation (EU) 2018/605 4 , are met, seems also not justified.
Based on that mandate, EFSA prepared a draft statement in September 2022 summarising the conclusions of the assessment of environmental fate and behaviour and ecotoxicology as finalised following the expert discussions held in January and June 2022 in the context of the peer review of the renewal of the approval of the active substance and the representative formulation, evaluated on the basis of the representative uses of dimoxystrobin as a fungicide on oilseed rape and sunflower, as proposed by the applicant.
The draft statement was circulated to all Member States for commenting via a written procedure. A list of the relevant end points for the active substance and the formulation is provided in Appendix B. In addition, the considerations as regards some of the cut‐off criteria for dimoxystrobin according to Annex II of Regulation (EC) No 1107/2009 are summarised in Appendix A.
A key supporting document to this statement is the peer review report (EFSA, 2022), which is a compilation of the documentation developed to evaluate and address all issues raised in the course of the peer review of the renewal of the active substance dimoxystrobin, from the initial commenting phase to the preparation of this statement. For reasons of completeness and transparency, the peer review report comprises all background documents, which were developed and finalised during the ongoing renewal process up to the production of the present statement and relate to all sections of the risk assessment, as follows:
the comments received on the RAR;
the reporting tables (22 July 2019);
the evaluation tables (September 2022);
the reports of the scientific consultation with Member State experts (where relevant);
the comments received on the assessment of the additional information (where relevant);
the comments received on the draft EFSA statement.
Given the importance of the RAR, including its revisions prepared up to the revision required following the expert consultations (Hungary, 2022), and the peer review report, both documents are considered as background documents to this statement and thus are made publicly available.
It is recommended that this statement and its background documents would not be accepted to support any registration outside the EU for which the applicant has not demonstrated that it has regulatory access to the information on which this statement is based.
1.1. Background and terms of reference as provided by the requestor
EFSA was mandated by the European Commission on 12 August 2022 to provide a statement containing the available outcomes of the assessment related to environmental fate and behaviour and ecotoxicology drawn in the context of the pesticides peer review for the renewal of approval of the active substance dimoxystrobin conducted in accordance with Commission Implementing Regulation (EU) No 844/2012. Given the critical concerns identified during the peer review, a request for additional information in accordance with Article 13(3a) of Regulation (EU) No 844/2012, to obtain information on endocrine disrupting properties, seems also not justified.
Although the peer review process is not yet fully completed, with the assessment of the endocrine disruption properties according to point 3.8.2 of Annex II to Regulation (EC) No 1107/2009 remaining pending, the assessment concerning environmental fate and behaviour and ecotoxicology has been finalised following the expert discussions held in January and June 2022 in those areas. During the drafting of the EFSA Conclusion the Commission was informed by EFSA that critical areas of concern have been identified for dimoxystrobin in those areas. The approval of dimoxystrobin expires on 31 January 2023 following several extensions in accordance with Article 17 of Regulation (EC) No 1107/2009. A further extension should be avoided if it is already clear that the approval criteria laid down in Regulation (EC) No 1107/2009 are not satisfied.
EFSA was requested to complete this mandate by 30 September 2022.
The active substance and the formulated product
Dimoxystrobin is an ISO common name for (2 E)‐2‐{2‐[(2,5‐dimethylphenoxy)methyl]phenyl}‐2‐(methoxyimino)‐N‐methylacetamide (IUPAC).
The representative formulated product for the evaluation was ‘BAS 540 01F’, a suspension concentrate (SC) containing 200 g/L dimoxystrobin and 200 g/L boscalid.
The representative uses evaluated were hydraulic foliar spray application on oilseed rape and sunflower as a fungicide against a broad range of pathogens. Full details of the good agricultural practices (GAPs) can be found in the list of end points in Appendix B.
Data were submitted to conclude that the uses of dimoxystrobin according to the representative uses proposed at EU level result in a sufficient fungicidal efficacy against the target pathogens, following the guidance document SANCO/2012/11251‐rev. 4 (European Commission, 2014b).
2. Assessment
2.1. Mammalian toxicity in relation to groundwater metabolites
The toxicological profile of the active substance dimoxystrobin and its metabolites was discussed at the Pesticides Peer Review Experts' Teleconference 70 in January 2022 and at the Pesticides Peer Review Experts' Teleconference 78 in June 2022. 5 The assessment of groundwater metabolites for their relevance was based on the following guidance document: European Commission, 2003.
Dimoxystrobin has harmonised classification according to Regulation (EC) No 1272/2008 6 as Carc. Cat. 2, H351 (‘Suspected of causing cancer’) and Repr. Cat. 2, H361d (‘Suspected of damaging the unborn child’). Metabolites 505M08 and 505M09 are unlikely to be genotoxic. Available data demonstrate that metabolites 505M08 and 505M09 do not share the carcinogenic properties of the parent compound; however, this is not the case for the reproductive toxicity properties of the parent. Consequently, they are considered as toxicologically relevant groundwater metabolites (see also Section 2.2). Metabolite 505M01 is considered unlikely to be mutagenic and clastogenic; however, aneugenicity has not been investigated (outstanding data gap). Data are missing to demonstrate that the metabolite 505M01 does not share the carcinogenicity and reproductive toxicity properties of the parent. Consequently, metabolite 505M01 has to be considered as toxicologically relevant groundwater metabolite (see also Section 2.2).
2.2. Environmental fate and behaviour
Dimoxystrobin was discussed at the Pesticides Peer Review Experts' Teleconference 71 in January 2022.
Dimoxystrobin test substance used in fate and behaviour studies included low amounts of Z‐isomer; however, the Z‐isomer remained at low levels in all environmental compartments. The sum of both isomers (E and Z) was considered for the environmental exposure assessment.
The rates of dissipation and degradation in the environmental matrices investigated were estimated using FOCUS (2006) kinetics guidance. In soil laboratory incubations under aerobic conditions in the dark, dimoxystrobin exhibited high persistence, forming the major (> 10% applied radioactivity (AR)) metabolite 505M09 (max. 13% AR, moderate to high persistence in soil) and metabolite 505M08 (> 10% of the initially measured dimoxystrobin in 0–10 cm soil layer in field studies, moderate to high persistence in soil). Mineralisation to carbon dioxide accounted for 15% AR after 119 days for the benzyl ring 14C radiolabel and for 25% AR after 122 days for the phenyl 14C radiolabel. The formation of unextractable residues accounted for 24% AR and 25% AR after 119 and 122 days for the benzyl and the phenyl 14C radiolabels, respectively. In anaerobic soil incubations, dimoxystrobin was essentially stable. In laboratory soil photolysis studies, dimoxystrobin degraded more rapidly than in the dark control forming the major metabolite 505M01 (max. 11% AR), which exhibited low to moderate persistence under aerobic dark conditions. Dimoxystrobin exhibited medium to low mobility in soil. Metabolites 505M08 and 505M09 exhibited very high to high mobility, and 505M01 exhibited very high soil mobility. It was concluded that the adsorption of dimoxystrobin and metabolite 505M01 was not pH dependent, while the adsorption of metabolites 505M08 and 505M09 was pH dependent, with adsorption decreasing in alkaline soils. In satisfactory field dissipation studies carried out at four sites in Germany, three in Spain, one in Sweden, one in Italy, one in France and one in the UK, dimoxystrobin exhibited medium to high persistence in soil. Sample analyses were carried out for dimoxystrobin, 505M01, 505M08 and 505M09. These three metabolites were only determined sporadically above the limit of quantification precluding the derivation of formation and decline kinetic endpoints. Field study DegT50 values for parent dimoxystrobin were derived following normalisation to FOCUS reference conditions (20°C and pF2 soil moisture) following the EFSA (2014) DegT50 guidance. The field data endpoints were not combined with laboratory values to derive modelling endpoints as following the DegT50 guidance the laboratory and field values were considered to represent different populations.
In a lysimeter study of 2‐year duration, the mean annual concentration of dimoxystrobin was < 0.1 μg/L. Metabolites 505M08 and 505M09 were found to reach a maximum annual average concentration of 2.35 μg/L and 2.0 μg/L, respectively. No other known metabolites were detected in any leachate sample.
In laboratory incubations in dark aerobic natural sediment water systems, dimoxystrobin exhibited high to very high persistence, forming the major metabolite 505M96 (max. 10% AR in water exhibiting moderate persistence). The unextractable sediment fraction (not extracted by acetonitrile/water) accounted for 6–11% AR at study end (100 days) for the phenyl and benzyl ring 14C radiolabel. Mineralisation of this radiolabel accounted for only 0.8–2.1% AR at the end of the study. The rate of decline of dimoxystrobin in a laboratory sterile aqueous photolysis experiment was faster (low persistence) relative to that which occurred in the aerobic sediment water incubations. No chromatographically resolved component (excluding dimoxystrobin) accounted for > 8% AR.
The necessary surface water and sediment exposure assessments (predicted environmental concentrations (PEC) calculations) were carried out for the metabolites 505M08, 505M09, 505M01 and 505M96, using the FOCUS (FOCUS, 2001) step 1 and step 2 approach (version 3.2 of the Steps 1–2 in FOCUS calculator). For the active substance dimoxystrobin, appropriate step 3 (FOCUS, 2001) and step 4 calculations were available. 7 The step 4 calculations appropriately followed the FOCUS (FOCUS, 2007) guidance, with no‐spray drift buffer zones of up to 20 m being implemented for the drainage scenarios (representing a 57–92.5% spray drift reduction), and combined no‐spray buffer zones with vegetative buffer strips of up to 20 m (reducing solute flux in run‐off by 80% and erosion run‐off of mass adsorbed to soil by 95%) being implemented for the run‐off scenarios. The SWAN tool (version 5.0.1) was appropriately used to implement these mitigation measures in the simulations. However, risk managers and others may wish to note that whilst run‐off mitigation is included in the step 4 calculations available, the FOCUS (FOCUS, 2007) report acknowledges that for substances with KFoc < 2,000 mL/g (i.e. dimoxystrobin), the general applicability and effectiveness of run‐off mitigation measures had been less clearly demonstrated in the available scientific literature, than for more strongly adsorbed compounds.
The necessary groundwater exposure assessments were appropriately carried out using FOCUS (European Commission, 2014a) scenarios and the models PEARL 4.4.4, PELMO 5.5.3 and MACRO 5.5.4 7 for dimoxystrobin and its metabolites. The potential for groundwater exposure from the representative uses by dimoxystrobin above the parametric drinking water limit of 0.1 μg/L was concluded to be low in geoclimatic situations that are represented by all six FOCUS groundwater scenarios.
For the representative use on oilseed rape (early and late triennial applications), the 80th percentile annual average recharge concentrations leaving the 1 m soil layer were estimated to be > 0.1 μg/L at all of the six scenarios for metabolites 505M08 and 505M09 in both acidic and alkaline soils, and in one of six scenarios for metabolite 505M01.
For the representative use on sunflowers (triennial application), the 80th percentile annual average recharge concentrations leaving the 1 m soil layer were estimated to be > 0.1 μg/L at both of the FOCUS sunflower scenarios for metabolite 505M08 in both acidic and alkaline soils and for metabolite 505M09 in alkaline soils, and in one of these two scenarios for metabolite 505M09 in acidic soils, while concentrations leaving the 1 m soil layer were estimated to be < 0.1 μg/L at both of the scenarios for metabolite 505M01.
It should be noted that though concentrations in groundwater were > 0.75 μg/L for metabolites 505M08 and 505M09 as they are concluded as relevant at Step 3 of the applicable guidance (see Sections 2.1 and 2.5), the only concentration that needed to be assessed against was 0.1 μg/L.
A critical area of concern is identified (see Section 3.1.2) as relevant groundwater metabolites (see Sections 2.1 and 2.5) have been indicated to be above the parametric drinking water limit of 0.1 μg/L in annual average recharge concentrations leaving the top 1 m soil layers in geoclimatic conditions represented by all the pertinent FOCUS groundwater scenarios and in a relevant lysimeter, in the context of all the representative uses assessed and the whole range of soil pH conditions.
The applicant provided appropriate information to address the effect of water treatment processes on the nature of the residues that might be present in surface water and groundwater, when surface water or groundwater are abstracted for drinking water, though it should be noted that for groundwater metabolites 505M01, 505M08 and 505M09, concentrations will legally need to be below 0.1 μg/L in groundwater.
The PEC in soil, surface water, sediment and groundwater covering the representative uses assessed can be found in Appendix B of this statement. A key to the wording used to describe the persistence and mobility of the compounds assessed can be found in Appendix C of this statement.
2.3. Ecotoxicology
The risk assessment was based on the following documents: European Commission (2002), SETAC (2001), EFSA (2009, 2013) and EFSA PPR Panel (2013).
The representative formulation, ‘BAS 540 01 F’, contains a second active substance (i.e. boscalid) in the same proportion. In some cases, different formulations than the representative one were used in the ecotoxicity tests (‘BAS 540 00F’; ‘BAS 505 01F’, a solo‐formulation; and ‘BAS 507 00F’, the old representative formulation, which contains epoxiconazole as second active substance in lower proportion). Based on all the available information, bridging between the formulations ‘BAS 540 01 F’ and ‘BAS 540 00 F’ is supported and both formulations can be considered comparable.
Several aspects pertaining to the risk assessment of dimoxystrobin were discussed at the Pesticide Peer Review Experts' Teleconference 72 (January 2022) and at the Pesticides Peer Review Experts' Teleconference 79 in June 2022.
Suitable acute and long‐term ecotoxicity studies were available with dimoxystrobin with birds 8 and mammals. 9 Acute studies with the representative formulation were also available for both groups. A low acute and long‐term risk to birds and mammals was identified for all representative uses.
An assessment of the major plant metabolites of dimoxystrobin (i.e. 505M01, 505M08, 505M09, 505M93, 505M95, 505M96), to which birds and wild mammals can be exposed, was available in the RAR and the risk was considered as low. In addition, the risk to birds and mammals resulting from the exposure to contaminated water and the risk due to secondary poisoning were also concluded as low for all representative uses.
Acute toxicity data with the active substance were available for fish (three species) and aquatic invertebrates (on the standard species Daphnia magna, on Asellus aquaticus, and with the marine species Americamysis bahia and Crassostrea virginica). The aquatic invertebrate endpoints for A. aquaticus and on A. bahia were discussed at the experts' meeting. 10
Chronic toxicity data with the active substance were available for fish, aquatic invertebrates and algae. No reliable data were available for macrophytes.
Acute toxicity data with fish and aquatic invertebrates as well as chronic data for algae were available with the representative formulation.
In addition, acute toxicity data with other formulations (‘BAS 505 01 F’ and ‘BAS 507 00 F’) were also available with additional fish species. The reliability of several acute fish studies was discussed during the experts' meeting. 11
The potential use of the fish acute toxicity data with formulations including a second active substance in a refinement at Tier 2 was also discussed at the experts' meeting. 12 It was agreed that data from formulation with another active substance should not be used in Tier 2 assessment since the presence of another active substance would add uncertainty to the calculation. Therefore, only data on the active substance and the solo‐formulation were considered at Tier 2, using the geomean approach; the species sensitivity distribution (SSD) approach was not considered acceptable for the refined risk assessment, since it includes data from formulation with two active substances.
Endpoints for the two chronic early‐life stage (ELS) fish studies and the two chronic fish modified exposure studies were discussed at the experts' meeting. 13 It was agreed that the endpoint of 8 μg/L from a standard ELS study on fathead minnow (revised to cover potential effect on growth) should be used in the risk assessment. Toxicokinetic–Toxicodynamic (TKTD) modelling, using the General Unified Threshold model of Survival (GUTS), was submitted for refining the chronic risk assessment for fish, and was discussed in the follow‐up experts' meeting. 14 The TKTD model was comprehensively reported and relied on a large experimental data set. However, the calibration and the interpretation of the validation of the model presented some deficiencies which decrease the overall reliability of the model application. In addition, GUTS model addresses lethal effects whereas the Tier 1 risk assessment was driven by sublethal effects; the calibration/validation of the model was carried out for rainbow trout whereas the sublethal effects were observed on the fathead minnow, and interspecies extrapolation is not recommended in the EFSA PPR Panel (2018). Therefore, the experts concluded that this modelling could not be used for refining the chronic fish risk assessment for dimoxystrobin.
For further refinement for aquatic invertebrates, a mesocosm study was also available with the solo formulation. The proposed endpoint from the mesocosm study was also discussed during the experts' meetings. 15 The experts agreed that an overall endpoint could not be derived for aquatic organisms due to several shortcomings (e.g. few species), especially vulnerable ones, with sufficient abundance; lack of pre‐exposure sampling for some taxa which makes it difficult to assess the effect; an effect class 3A was observed at the lowest concentration which makes it impossible to derive an ETO‐RAC (ecological threshold option – Regulatory Acceptable Concentration). Only a specific provisional ecological recovery option (ERO) – RAC could be derived for Daphnia, and the experts agreed not to use this endpoint in the risk assessment since it has not been demonstrated that the exposure in the mesocosm covers the predicted exposure profiles of the representative uses and that this endpoint might not be protective enough for molluscs (driving the Tier 1 risk assessment), crustaceans with long reproductive cycle and the most sensitive phytoplankton taxa.
Regarding sediment‐dwelling organisms, toxicity data were available with the active substance.
Based on the available Tier 1 data, a high acute risk for fish and aquatic invertebrates was identified at FOCUS Step 3 for all scenarios for the two representative uses.
Considering Tier 2 refinement (geomean), a high acute risk to fish was identified for all scenarios and representative uses using FOCUS Step 3 PECsw, except for scenario D5 on sunflower. At FOCUSsw Step 4, a high acute risk to fish remained for 2/6 scenarios (D2 and D4) for use on oilseed rape. Low acute risk was concluded for the remaining scenarios for the use on oilseed rape when considering risk mitigation measures (RMM) up to 20 m no‐spray buffer zone in combination with 20 m vegetated filter strip. For the use on sunflower, low acute risk to fish was concluded when considering RMM up to 20 m no‐spray buffer zone in combination with a 20 m vegetated filter strip.
An overview of the outcome of the risk assessment for aquatic organisms is presented in Table 1 below.
Table 1.
Overview of the outcome of the risk assessment for aquatic organisms
| FOCUSsw scenario | Acute fish (geomean) | Chronic fish | Invert acute (C. virginica) | Invert. chronic | Chironomus riparius | Algae |
|---|---|---|---|---|---|---|
| Oilseed rape – 1 or 2 applications | ||||||
| D2 | HR | HR | HR | HR | HR | HR |
| D3 | LR step 4 10 m + 10 m | LR | LR step 4 20 m + 20 m | LR | LR step 4 10 m + 10 m | LR |
| D4 | HR | HR | HR | LR | HR | HR |
| D5 | LR step 4 10 m + 10 m | LR | HR | LR | HR | LR |
| R1 | LR step 4 20 m + 20 m | LR step 4 10 m + 10 m | HR | LR step 4 10 m + 10 m | LR step 4 20 m + 20 m | LR step 4 10 m + 10 m |
| R3 | LR step 4 20 m + 20 m | LR step 4 10 m + 10 m | HR | LR step 4 10 m + 10 m | LR step 4 20 m + 20 m | LR step 4 10 m + 10 m |
| Sunflower | ||||||
| D5 | LR | LR | HR | LR | LR step 4 10 m + 10 m | LR |
| R1 | LR step 4 10 m + 10 m | LR step 4 10 m + 10 m | HR | LR | LR step 4 20 m + 20 m | LR step 4 10 m + 10 m |
| R3 | LR step 4 10 m + 10 m | LR step 4 10 m + 10 m | HR | LR | LR step 4 10 m + 10 m | LR step 4 10 m + 10 m |
| R4 | LR step 4 20 m + 20 m | LR step 4 10 m + 10 m | HR | LR step 4 10 m + 10 m | LR step 4 20 m + 20 m | LR step 4 10 m + 10 m |
HR: High risk remaining with the RMM; LR: Low risk concluded (FOCUS step 3).
LR step 4 10 m + 10 m: Low risk concluded at FOCUS step 4 with RMM of 10 m no‐spray buffer zone in combination with a 10 m vegetated filter strip.
LR step 4 20 m + 20 m: Low risk concluded at FOCUS step 4 with RMM 20 m no‐spray buffer zone in combination with a 20 m vegetated filter strip.
By using Tier 1 data, high chronic risk for fish was identified at FOCUS Step 3 for 4/6 scenarios for the representative use on oilseed rape and 3/4 scenarios for use on sunflower. At FOCUSsw Step 4, for the use in oilseed rape, a high chronic risk to fish remains with a 20‐m buffer zone combined with a 20‐m vegetated filter strip for 2/6 scenarios; low chronic risk to fish was concluded when considering a 10‐m no‐spray buffer zone in combination with a 10‐m vegetated filter strip for the two remaining scenarios. For the representative use on sunflower, low chronic risk was concluded when considering a 10‐m no‐spray buffer zone in combination with a 10‐m vegetated filter strip for all remaining scenarios.
For acute risk to aquatic invertebrates, based on the most sensitive species (C. Virginica, acute endpoint based on shell deposition), high risk was concluded for all relevant scenarios and uses (except for one scenario (D3) for the use on oilseed rape) at FOCUSsw Step 4 when considering a 20‐m no‐spray buffer zone in combination with a 20‐m vegetated filter strip (critical area of concern, see Section 3.1.2).
High chronic risk to aquatic invertebrates was identified at FOCUS Step 3 for 3/6 scenarios for the use on oilseed rape. By using FOCUSsw Step 4 exposure estimations, a high chronic risk remains for one scenario; low chronic risk to aquatic invertebrates was concluded when considering a 10‐m no‐spray buffer zone in combination with a 10‐m vegetated filter strip for two scenarios. For the use on sunflower, the chronic risk was high at FOCUS step 3 for 1/4 scenarios, for which a low risk was identified at FOCUSsw Step 4, with a 10‐m no‐spray buffer zone in combination with a 10‐m vegetated filter strip.
In addition, high chronic risk to sediment‐dwelling organisms was concluded at FOCUSsw Step 3 for all scenarios for both representative uses. Using the FOCUSsw Step 4 calculations that considered a 20‐m no‐spray buffer zone in combination with a 20‐m vegetated filter strip, high chronic risk to sediment‐dwelling organisms was identified for 3/6 scenarios for the use on oilseed rape. For the use on sunflower, low risk was concluded at FOCUSsw Step 4 for all scenarios when considering RMM up to 20 m no‐spray buffer zone combined with 20 m vegetated filter strip.
By using FOCUSsw Step 3 calculations, 4/6 and 3/4 scenarios showed a high risk to algae for the uses in oilseed rape and sunflower, respectively. At FOCUSsw Step 4, for the use on oilseed rape, the high risk remained for two scenarios (D2 and D4) even after considering a 20‐m no‐spray buffer zone in combination with a 20‐m vegetated filter strip, whereas a low risk was identified for the remaining scenarios when considering a 10‐m no‐spray buffer zone in combination with a 10‐m vegetated filter strip. For the use on sunflower, a low risk to algae could be concluded when considering a 10‐m no‐spray buffer zone in combination with a 10‐m vegetated filter strip.
To conclude on aquatic organisms, 1/6 scenarios show a low risk applying RMM of 20 m no‐spray buffer zone in combination with 20 m vegetated filter strip for the use on oilseed rape, whereas a high risk is identified for the remaining five scenarios; for the use on sunflower, a high risk is identified for all scenarios even considering RMM.
Several pertinent metabolites of dimoxystrobin have been identified in surface water (501 M01, 505M08, 505M09, 505M096). These pertinent aquatic metabolites were tested acutely for fish, invertebrates and algae. Low acute risk was concluded for all the pertinent aquatic metabolites by using FOCUS Step 1 PECsw for fish, aquatic invertebrates and algae for all uses. The metabolites 505M08, 505M09, 505M01, 505M96 were also identified as relevant in the sediment phase. However, no risk assessment for sediment dwellers was submitted (data gap, see Section 3.2).
Oral acute toxicity data on honeybees were available for dimoxystrobin and two formulated products (i.e. ‘BAS 540 01 F’ and ‘BAS 540 00 F’ 16 ). Acute contact toxicity data were available for the same formulations but not for the active substance (data gap, see Section 3.2). Furthermore, chronic studies for larvae and adults were available. The chronic toxicity study was conducted with the active substance whilst the 8‐day larval toxicity study was conducted with the representative formulation. Since this latest study does not cover the main developmental stages of honeybee larvae in line with the current recommendations, a data gap for a proper study with honeybee larvae was identified (i.e. a test with repeated dosing and longer test duration according to OECD Guidance No 239 is preferable; see also below paragraph for further information). 17 No information was available on bumblebees and solitary bees.
An acute risk assessment following the SANCO Guidance on Terrestrial ecotoxicology (European Commission, 2002) was available. Low acute risk to honeybees from oral and contact 18 exposure was concluded for both representative uses. Following the Tier 1 risk assessment according to the EFSA bee guidance (EFSA, 2013), the same conclusion could be reached for the acute scenario as assessed with the SANCO Guidance. Likewise, low chronic risk to adult honeybees could also be concluded for all representative uses, and the acute and chronic risk to adult bees from exposure to contaminated water was considered low as well.
A suitable assessment for sublethal effects (e.g. hypopharyngeal glands (HPGs)) was not available (data gap, see Section 3.2). An assessment to address the potential effects of plant metabolites occurring in pollen and nectar as a result of the representative uses was not available (data gap, see Section 3.2). An assessment of accumulative effects on bees was not available.
In addition to the Tier 1 ecotoxicity data for honeybees, a number of higher tier studies were also available. The available tunnel study considered ecotoxicological parameters related to the honeybee risk assessment (i.e. brood developmental observations) whilst the other two studies, residue studies under semi‐field and field conditions, 19 aimed at characterising the residue situation in pollen and nectar for oilseed rape and sunflowers. Those studies were discussed at the experts' meeting. 20
The information from the residue studies showed several deficiencies (i.e. the sampling method was not in line with the recommendations of the EFSA bee guidance (EFSA, 2013), the residue trials were not independent from each other, there were adverse environmental conditions that could have affected the residue decline etc.); therefore, it was concluded that the information provided could not be used to refine exposure parameters in the risk assessment equations.
In the tunnel study, high variability on the brood termination rate was observed. In addition, due to several shortcomings in terms of experimental set‐up and conditions, the study was considered unsuitable to fully address the risk to honeybee larvae. As a consequence of the data gap identified for Tier 1 data for honeybee larvae as indicated previously and the unsuitability of a refinement based on the available tunnel study, the risk assessment for honeybee larvae is considered as an issue that could not be finalised (see Section 3.1.1).
Standard and extended laboratory toxicity tests with the formulation ‘BAS 540 00 F’ were available for non‐target arthropods other than bees. By using the available data, low in‐ and off‐field risk could be concluded for all representative uses.
Based on the available laboratory data with dimoxystrobin, high chronic risk was identified for earthworms for all representative uses at Tier 1. Three field studies were available to refine the risk. The studies were discussed at the experts' meeting. 21 Two were considered only as supportive information due to several shortcomings identified (e.g. uncertain exposure, limited information in terms of pre‐application sampling and pesticide history, poor performance of the toxic reference), whilst the study conducted in line with the GAPs under assessment was considered reliable and relevant to refine the risk. Considering the information from all the studies, it was possible to conclude low risk for earthworms for both representative uses.
For other soil macro‐ and meso‐fauna (i.e. Folsomia candida and Hypoaspis aculeifer), low chronic risk was concluded for all representative uses at Tier1.
Low risk to soil organisms from the exposure to the soil metabolite 505M09 was concluded for all representative uses. For the other relevant soil metabolites (i.e. 501M01, 505M08), toxicity data were not available for all non‐target soil organism taxa–metabolite combination. However, considering that metabolite 505M09 represents the worst‐case metabolite in soil in terms of formed fraction and degradation time, low chronic risk to soil organisms could be concluded for all the other relevant soil metabolites for the representative uses under assessment.
Suitable ecotoxicity tests were available to conclude a low risk to soil microorganisms for the active substance as well as for all the relevant soil metabolites for all representative uses.
A low chronic risk to non‐target terrestrial plants and organisms involved in biological methods for sewage treatment was concluded for all the representative uses.
2.4. Particular conditions proposed for the representative uses evaluated (Table 2)
Table 2.
Risk mitigation measures proposed for the representative uses assessed
| Representative use | Oilseed rape |
|---|---|
| Foliar spray | |
| Risk to aquatic organisms | RMM of 20 m no‐spray buffer zone combined with a 20‐m vegetated buffer was sufficient for only 1/6 scenarios (a) |
D3.
2.5. Overview of the risk assessment of compounds listed in residue definitions triggering assessment of effects data for the environmental compartments (Tables 3, 4, 5–3, 4, 5)
Table 3.
Soil
| Compound (name and/or code) | Ecotoxicology |
|---|---|
| Dimoxystrobin | Low risk to soil organisms |
| 505M08 | Low risk to soil organisms |
| 505M09 | Low risk to soil organisms |
| 505M01 | Low risk to soil organisms |
Table 4.
Groundwater (a)
| Compound (name and/or code) |
> 0.1 μg/L at 1 m depth for the representative uses (b) Step 2 |
Biological (pesticidal) activity/relevance Step 3a. |
Hazard identified Steps 3b. and 3c. |
Consumer RA triggered Steps 4 and 5 |
Human health relevance |
|---|---|---|---|---|---|
| Dimoxystrobin | No | Yes | – | – |
Yes |
| 505M08 |
Yes Winter oilseed rape (early application): 1.253–2.640 μg/L 6/6 FOCUS scenarios (alkaline soils) Winter oilseed rape (late application): 1.283–2.733 μg/L 6/6 FOCUS scenarios (alkaline soils) Sunflower: 0.590–1.050 μg/L 2/2 FOCUS scenarios (alkaline soils) |
No |
Yes Parent dimoxystrobin is classified Repr. Cat. 2 |
No Toxicologically relevant groundwater metabolite (see Section 2.1) |
Yes |
| 505M09 |
Yes Winter oilseed rape (early application): 0.927–1.764 μg/L 6/6 FOCUS scenarios (alkaline soils) Winter oilseed rape (late application): 0.929–1.844 μg/L 6/6 FOCUS scenarios (alkaline soils) Sunflower: 0.270–0.684 μg/L 2/2 FOCUS scenarios (alkaline soils) |
No |
Yes Parent dimoxystrobin is classified Repr. Cat. 2 |
No Toxicologically relevant groundwater metabolite (see Section 2.1) |
Yes |
| 505M01 |
Yes Winter oilseed rape (late application): 0.111 μg/L 1/6 FOCUS scenarios |
No |
Yes Parent dimoxystrobin is classified Carc. Cat 2 and Repr. Cat. 2 Aneugenicity not investigated. |
No Toxicologically relevant groundwater metabolite (see Section 2.1) |
Yes |
Assessment according to European Commission guidance of the relevance of groundwater metabolites (2003).
FOCUS scenarios or relevant lysimeter.
Table 5.
Surface water and sediment
| Compound (name and/or code) | Ecotoxicology |
|---|---|
| Dimoxystrobin |
High acute risk to aquatic invertebrates for 5/6 scenarios for the uses on oilseed rape and all scenarios for the use on sunflower. High chronic risk to sediment‐dwelling organisms for 3/6 scenarios for the uses on oilseed rape. High acute risk and chronic risk to fish for 2/6 scenarios for the uses on oilseed rape. High risk to algae for 2/6 scenarios for the uses on oilseed rape. High chronic risk to aquatic invertebrates for 1/6 scenarios for the uses on oilseed rape. |
| 505M08 | Low risk to aquatic organisms, except sediment dwellers (data gap) |
| 505M09 | Low risk to aquatic organisms, except sediment dwellers (data gap) |
| 505M01 | Low risk to aquatic organisms, except sediment dwellers (data gap) |
| 505M96 | Low risk to aquatic organisms, except sediment dwellers (data gap) |
3. Conclusions
3.1. Concerns and related data gaps for the representative uses evaluated
3.1.1. Issues that could not be finalised
An issue is listed as ‘could not be finalised’ if there is not enough information available to perform an assessment, even at the lowest tier level, for one or more of the representative uses in line with the uniform principles in accordance with Article 29(6) of Regulation (EC) No 1107/2009 and as set out in Commission Regulation (EU) No 546/2011 22 and if the issue is of such importance that it could, when finalised, become a concern (which would also be listed as a critical area of concern if it is of relevance to all representative uses).
An issue is also listed as ‘could not be finalised’ if the available information is considered insufficient to conclude on whether the active substance can be expected to meet the approval criteria provided for in Article 4 of Regulation (EC) No 1107/2009.
The following issues or assessments that could not be finalised have been identified, together with the reasons including the associated data gaps where relevant, which are reported directly under the specific issue to which they are related:
-
1
The risk assessment to honeybee larvae could not be finalised due to the lack of reliable information (applicable for all the representative uses, see Section 2.3).
A chronic toxicity study with honeybee larvae in line with OECD Guidance No 239 is required (applicable for all the representative uses, see Section 2.3).
3.1.2. Critical areas of concern
An issue is listed as a critical area of concern if there is enough information available to perform an assessment for the representative uses in line with the uniform principles in accordance with Article 29(6) of Regulation (EC) No 1107/2009 and as set out in Commission Regulation (EU) No 546/2011, and if this assessment does not permit the conclusion that, for at least one of the representative uses, it may be expected that a plant protection product containing the active substance will not have any harmful effect on human or animal health or on groundwater, or any unacceptable influence on the environment.
An issue is also listed as a critical area of concern if the assessment at a higher tier level could not be finalised due to lack of information, and if the assessment performed at the lower tier level does not permit the conclusion that, for at least one of the representative uses, it may be expected that a plant protection product containing the active substance will not have any harmful effect on human or animal health or on groundwater, or any unacceptable influence on the environment.
An issue is also listed as a critical area of concern if, in the light of current scientific and technical knowledge using guidance documents available at the time of application, the active substance is not expected to meet the approval criteria provided for in Article 4 of Regulation (EC) No 1107/2009.
The following critical areas of concern are identified, together with any associated data gaps, where relevant, which are reported directly under the specific critical area of concern to which they are related:
-
2
High acute risk to aquatic invertebrates for 5/6 scenarios for the use on winter oilseed rape and all scenarios for the use on sunflower (see Section 2.3) when also considering the implementation of the assessed mitigation measures that reduced exposure (20 m no‐spray buffer zone +20 m vegetated filter strip). 23
-
3
High potential for groundwater contamination by groundwater relevant metabolites in geoclimatic conditions represented by all the relevant FOCUS groundwater scenarios for all the representative uses assessed (see Sections 2.1, 2.2 and 2.5).
3.1.3. Overview of the concerns identified for each representative use considered (Table 6)
Table 6.
Overview of concerns reflecting the issues not finalised, critical areas of concerns and the risks identified that may be applicable for some but not for all uses or risk assessment scenarios
| Representative use | Oilseed rape | Sunflower | |
| Foliar spray | Foliar spray | ||
| Risk to wild non‐target terrestrial vertebrates | Risk identified | ||
| Assessment not finalised | |||
| Risk to wild non‐target terrestrial organisms other than vertebrates | Risk identified | ||
| Assessment not finalised | X1 | X1 | |
| Risk to aquatic organisms | Risk identified | X2, (b) (5/6) | X2, (c) (4/4) |
| Assessment not finalised | |||
| Groundwater exposure to active substance | Legal parametric value breached | ||
| Assessment not finalised | |||
| Groundwater exposure to metabolites | Legal parametric value breached | X3 | X3 |
| Parametric value of 10 μg/L (a) breached | |||
| Assessment not finalised | |||
Value for non‐relevant metabolites prescribed in SANCO/221/2000‐rev. 10 final, European Commission, 2003.
High acute risk to aquatic invertebrates (5/6 scenarios); high acute and chronic risk to fish (2/6 scenarios); high risk to algae (2/6 scenarios), high risk to sediment‐dwelling organisms (3/6), high chronic risk to aquatic invertebrates (1/6 scenarios).
High acute risk to aquatic invertebrates (4/4 scenario).
(If a particular condition proposed to be taken into account to manage an identified risk, as listed in Section 2.4, has been evaluated as being effective, then ‘risk identified’ is not indicated in Table 6).
3.2. List of other outstanding issues
Remaining data gaps not leading to critical areas of concern or issues not finalised but considered necessary to comply with the data requirements, and which are relevant for some or all of the representative uses assessed at EU level. Although not critical, these data gaps may lead to uncertainties in the assessment and are considered relevant.
These data gaps refer only to the representative uses assessed and related to the environmental assessments:
The aneugenicity potential for metabolite 505M01 was not investigated (relevant for all representative uses, see Section 2.1).
No aquatic risk assessment for sediment dwellers was provided for the metabolites 505M08, 505M09, 505M01 and 505M96 (relevant for all representative uses, see Section 2.3).
Acute contact toxicity data with dimoxystrobin for bees were not available (relevant for all representative uses, see Section 2.3).
Further data were not available to address the risk to honeybees from sublethal effects (e.g. effects on HPG) and via exposure to metabolites formed in pollen and nectar (relevant for all representative uses, see Section 2.3).
Abbreviations
- a.s.
active substance
- AF
assessment factor
- AR
applied radioactivity
- BCF
bioconcentration factor
- bw
body weight
- CAS
Chemical Abstracts Service
- CIPAC
Collaborative International Pesticides Analytical Council Limited
- cm
centimetre
- d
day
- DAT
days after treatment
- DDD
daily dietary dose
- DT50
period required for 50% dissipation (define method of estimation)
- DT90
period required for 90% dissipation (define method of estimation)
- d.w.
dry weight
- EAS
oestrogen, androgen and steroidogenesis modalities
- EbC50
effective concentration (biomass)
- EC50
effective concentration
- ECHA
European Chemicals Agency
- EEC
European Economic Community
- EINECS
European Inventory of Existing Commercial Chemical Substances
- ELINCS
European List of New Chemical Substances
- ER50
emergence rate/effective rate, median
- ErC50
effective concentration (growth rate)
- ERO
ecological recovery option
- ETO
ecological threshold option
- ETR
exposure toxicity ratio
- ETRacute
exposure toxicity ratio for acute exposure
- ETRlarvae
exposure toxicity ratio for chronic exposure
- ETRlarvae
exposure toxicity ratio for larvae
- FAO
Food and Agriculture Organisation of the United Nations
- FOCUS
Forum for the Co‐ordination of Pesticide Fate Models and their Use
- g
gram
- h
hour(s)
- ha
hectare
- hL
hectolitre
- HQ
hazard quotient
- HQcontact
hazard quotient for contact exposure
- HR
hazard rate
- ISO
International Organization for Standardization
- IUPAC
International Union of Pure and Applied Chemistry
- Kdoc
organic carbon linear adsorption coefficient
- KFoc
Freundlich organic carbon adsorption coefficient
- kg
kilogram
- L
litre
- LC50
lethal concentration, median
- LD50
lethal dose, median; dosis letalis media
- LDD50
lethal dietary dose; median
- LOQ
limit of quantification
- m
metre
- M
mol
- mg
milligram
- mL
millilitre
- mm
millimetre (also used for mean measured concentrations)
- MWHC
maximum water‐holding capacity
- NOAEL
no observed adverse effect level
- NOEC
no observed effect concentration
- NOEL
no observed effect level
- OECD
Organisation for Economic Co‐operation and Development
- OM
organic matter content
- PEC
predicted environmental concentration
- PECsed
predicted environmental concentration in sediment
- PECsoil
predicted environmental concentration in soil
- PECsw
predicted environmental concentration in surface water
- pF2
pF value of 2 (suction pressure that defines field capacity soil moisture)
- pH
pH‐value
- PHI
preharvest interval
- Pow
partition coefficient between n‐octanol and water
- RAC
regulatory acceptable concentration
- RAR
Renewal Assessment Report
- S
svedberg, S (10−13 s)
- SFO
single first‐order
- SMILES
simplified molecular‐input line‐entry system
- SSD
species sensitivity distribution
- TER
toxicity exposure ratio
- TWA
time‐weighted average
- μg
microgram
Appendix A – Consideration of some cut‐off criteria for dimoxystrobin according to Annex II of Regulation (EC) No 1107/2009 of the European Parliament and of the Council
| Properties | Conclusion (a) | |
|---|---|---|
| CMR | Carcinogenicity (C) | Dimoxystrobin is classified as a Carc. Cat 2 (H351) (ECHA RAC, 2020). |
| Mutagenicity (M) |
Dimoxystrobin is not classified as Mutag. Cat 1A, B. Dimoxystrobin is not considered to be a mutagen according to point 3.6.2 of Annex II of Regulation (EC) No 1107/2009. |
|
| Toxic for Reproduction (R) | Dimoxystrobin is classified as Repr. Cat 2 (H361d) (ECHA RAC, 2020). | |
| POP | Persistence | Dimoxystrobin is not considered to be a persistent organic pollutant (POP) according to point 3.7.1 of Annex II of Regulation (EC) 1107/2009. |
| Bioaccumulation | ||
| Long‐range transport | ||
| PBT | Persistence | Dimoxystrobin not considered to be a persistent, bioaccumulative and toxic (PBT) substance according to point 3.7.2 of Annex II of Regulation (EC) 1107/2009. |
| Bioaccumulation | ||
| Toxicity | ||
| vPvB | Persistence | Dimoxystrobin not considered to be a very persistent, very bioaccumulative substance according to point 3.7.3 of Annex II of Regulation (EC) 1107/2009. |
| Bioaccumulation | ||
Origin of data to be included where applicable (e.g. EFSA, ECHA RAC, Regulation).
Appendix B – List of end points for the active substance and the representative formulations with regard to identity, assessment of mammalian toxicity in relation to groundwater metabolites, environmental fate and behaviour and ecotoxicology
Identity, Physical and Chemical Properties, Details of Uses, Further Information (Regulation (EU) N° 283/2013, Annex Part A, points 1.3 and 3.2)

Identity (Regulation (EU) N° 283/2013, Annex Part A, point 1)

Groundwater metabolites: Screening for biological activity (SANCO/221/2000‐rev.10‐final Step 3 a Stage 1)

Summary of representative uses evaluated, for which all risk assessments needed to be completed (dimoxystrobin)
(Regulation (EU) N° 284/2013, Annex Part A, points 3, 4)
| Crop and/or situation(a) | Member State or Country | Product name | F G or I(b) |
Pests or Group of pests controlled(c) |
Preparation | Application | Application rate per treatment | PHI (days)(m) | Remarks | ||||||
|---|---|---|---|---|---|---|---|---|---|---|---|---|---|---|---|
| Type (d–f) | Conc. a.s.(i) | Method kind (f–h) | Range of growth stages & season(j) | Number min–max(k) | Interval between application (min) | kg a.s/hL min–max(l) | Water L/ha min–max | kg a.s./ha min–max(l) | |||||||
|
Oilseed rape Brassica napus BRSNW |
EU |
BAS 540 01 F |
F |
Sclerotinia sclerotiorum, Alternaria brassicae, Erysiphe cruciferarum, Pyrenopeziza brassicae, Plenodomus maculans |
SC |
200 * g/l 200 ** g/l |
foliar spraying | BBCH 20–75 | 2 | 28 | 0.025–0.1 | 100–400 | 0.1 * 0.1 ** | *** |
no autumn application, spring application not before 1st February Application is restricted to every third year |
|
Sunflower Helianthus annuus HELAN |
CEU SEU |
BAS 540 01 F |
F |
Sclerotinia sclerotiorum, Alternaria helianthi, Plenodomus lindquistii, Botrytis cinerea, Diaporthe helianthi |
SC |
200 * g/l 200 ** g/l |
foliar spraying | BBCH 51–75 | 1 | – | 0.025–0.1 | 100–400 | 0.1 * 0.1 ** | 30 | Application is restricted to every third year |
dimoxystrobin.
boscalid.
defined by growth stage at latest application timing.
(a): For crops, the EU and Codex classifications (both) should be taken into account; where relevant, the use situation should be described (e.g. fumigation of a structure).
(b): Outdoor or field use (F), greenhouse application (G) or indoor application (I).
(c): e.g. biting and sucking insects, soil born insects, foliar fungi, weeds.
(d): e.g. wettable powder (WP), emulsifiable concentrate (EC), granule (GR).
(e): CropLife International Technical Monograph no 2, 6th Edition. Revised May 2008. Catalogue of pesticide.
(f): All abbreviations used must be explained.
(g): Method, e.g. high volume spraying, low volume spraying, spreading, dusting, drench.
(h): Kind, e.g. overall, broadcast, aerial spraying, row, individual plant, between the plant‐ type of equipment used must be indicated.
(i): g/kg or g/L. Normally the rate should be given for the active substance (according to ISO) and not for the variant in order to compare the rate for same active substances used in different variants (e.g. fluoroxypyr). In certain cases, where only one variant is synthesised, it is more appropriate to give the rate for the variant (e.g. benthiavalicarb‐isopropyl).
(j): Growth stage range from first to last treatment (BBCH Monograph, Growth Stages of Plants, 1997, Blackwell, ISBN 3‐8263‐3152‐4), including where relevant, information on season at time of application.
(k): Indicate the minimum and maximum number of applications possible under practical conditions of use.
(l): The values should be given in g or kg whatever gives the more manageable number (e.g. 200 kg/ha instead of 200,000 g/ha or 12.5 g/ha instead of 0.0125 kg/ha).
(m): PHI – minimum preharvest interval.
Impact on Human and Animal Health
Other toxicological studies (Regulation (EU) N°283/2013, Annex Part A, point 5.8)


Environmental fate and behaviour
Route of degradation (aerobic) in soil (Regulation (EU) N° 283/2013, Annex Part A, point 7.1.1.1)

Route of degradation (anaerobic) in soil (Regulation (EU) N° 283/2013, Annex Part A, point 7.1.1.2)

Route of degradation (photolysis) on soil (Regulation (EU) N° 283/2013, Annex Part A, point 7.1.1.3)

Rate of degradation in soil (aerobic) laboratory studies active substance (Regulation (EU) N° 283/2013, Annex Part A, point 7.1.2.1.1 and Regulation (EU) N° 284/2013, Annex Part A, point 9.1.1.1)
| Parent | Dark aerobic conditions | |||||||
|---|---|---|---|---|---|---|---|---|
| Soil type | org. C (%) | pH (CaCl2) | t. oC/% MWHC | Trigger DT50/DT90 (day) | Kinetic parameters | Modelling DT50 (day) 20°C, pF2 (a) | St. (χ2) trigger/modelling | Method of calculation trigger/modelling |
| Bruch West sandy loam (b) | 2.0 | 7.5 | 20/40 | 78.2/423.1 |
α: 1.869 β: 174.2 |
138.7 (b) |
2.2/ 2.3 |
FOMC/ DFOP (d) |
| Bruch West sandy loam (p) | 2.0 | 7.5 | 20/40 | 70.9/481.4 |
α: 1.331 β: 103.8 |
124.7 (b) |
1.2/ 2.4 |
FOMC/ DFOP (d) |
| Bruch West sandy loam average | 2.0 | 7.5 | 20/40 | 74.5 (c) /451.3 (c) | – | 131.5 (c) | – |
FOMC/ DFOP (d) |
| Lufa 2.2 sand/loamy sand (b) | 2.5 | 5.8 | 20/40 | 419.9/> 1,000 |
k1: 0.05724 k2: 0.00148 g: 0.069 |
331.8 |
1.2/ 1.5 |
DFOP/ SFO (d) |
| Minto loam (b) | 3.0 | 7.7 | 20/40 | 363/> 1,000 | k: 0.001909 | 279.5 | 2.0 | SFO (e) |
| Dinuba sandy loam (b) | 0.6 | 7.0 | 20/40 | 265.3/881.3 | k: 0.002613 | 187.8 | 1.3 | SFO (d) |
| Li 35b sandy loam (b) | 1.1 | 6.8 | 20/40 | 411.4/> 1,000 | k: 0.00169 | 325.5 | 1.6 | SFO (d) |
| Borstel loamy sand (b) | 1.2 | 4.6 | 20/40 | 306.2/> 1,000 | k: 0.002264 | 215.7 | 1.0 | SFO (e) |
| Geometric mean (if not pH dependent) | 233.2 | |||||||
| pH dependence | No | |||||||
Normalised using a Q10 of 2.58 and Walker equation coefficient of 0.7.
Derived from slow phase of bi‐phasic model (DT50slow = ln2/k2).
Geometric mean of studies with two labels of Bruch West soil (b), (p) – benzyl‐, phenyl‐label.
Parent–metabolite pathway fit.
Parent‐only fit.
Rate of degradation in soil (aerobic) laboratory studies transformation products (Regulation (EU) N° 283/2013, Annex Part A, point 7.1.2.1.2 and Regulation (EU) N° 284/2013, Annex Part A, point 9.1.1.1)
| 505M08 | Dark aerobic conditions | ||||||||
|---|---|---|---|---|---|---|---|---|---|
| Soil type | org. C (%) | pH (CaCl2) | t. oC/% MWHC | Trigger DT50/DT90 (day) | f. f. kf/kdp trigger/modelling | Kinetic parameters | DT50 (day) 20°C pF2/10kPa (a) | St. (χ2) trigger/modelling | Method of calculation trigger/modelling |
| Bruch West sandy loam (b) | 2.0 | 7.5 | 20/40 | 11.6/38.63 |
0.2835/ 0.2716 |
k: 0.0596 | 11.6 | 16.5/16.7 |
SFO (b) / SFO (i) |
| Bruch West sandy loam (p) | 2.0 | 7.5 | 20/40 | 55.8/185.5 | 0.1222/0.1135 | k: 0.01368 | 52.9 | 13.2/8.5 |
SFO (b) / SFO (i) |
| Bruch West sandy loam average | 2.0 | 7.5 | 20/40 | 24.3 (j) /80.7 (j) | 0.203 (k) /0.193 (k) | k: 0.0286 (j) | 24.7 (j) | – |
SFO (b) / SFO (i) |
| Lufa 2.2 sand/loamy sand (b) | 2.5 | 5.8 | 20/40 | 68.1/226.1 | 0.2226/0.3983 | k: 0.01019 | 26.1 |
9.1/ 12.4 |
SFO (i) / SFO (c) |
| Minto loam (b) | 3.0 | 7.7 | 20/40 | – (d) | (0.042) (e) | – (d) | – (d) | – (d) | SFO (c) |
| Dinuba sandy loam (b) | 0.6 | 7.0 | 20/40 | 27.7/91.92 | 0.373 | k: 0.02505 | 19.6 | 14.7 | SFO (c) |
| Li 35b sandy loam (b) | 1.1 | 6.8 | 20/40 | 60.7/201.7 | 0.2288 | k: 0.01142 | 48.0 | 13.1 | SFO (c) |
| Li 10 loamy sand (b) | 0.81 | 6.3 | 20/40 | 179.2/790.4 | – (f) |
k1: 0.1166 k2: 0.0026 g: 0.1984 |
247.4 (g) | 1.3 | DFOP |
| Lufa 2.2. sandy loam (b) | 1.6 | 5.4 | 20/40 | 64.1/294.3 | – (f) |
k1: 0.2761 k2: 0.007 g: 0.2174 |
73.5 (g) | 2.2 | DFOP |
| Lufa 5 M sandy loam (b) | 2.18 | 7.4 | 20/40 | > 1,000/> 1,000 | – (f) |
k1: 0.022 k2: 2.26 E‐14 g: 0.4186 |
133.1 (g) |
2.1/ 3.0 |
DFOP/ HS |
| Geometric mean (if not pH dependent) | 54.72 (h) | ||||||||
| Arithmetic mean | 0.247 (h) | ||||||||
| pH dependence | No | ||||||||
Normalised using a Q10 of 2.58 and Walker equation coefficient of 0.7.
FOMC kinetics for parent.
SFO kinetics for parent.
No reliable endpoints derived in kinetic evaluation.
Not taken into consideration for averaging of formation fractions.
Applied as parent.
Derived from slow rate of the respective bi‐phasic model (ln2/k2).
Results from Bruch West soil with two labels were averaged before calculating the overall mean.
DFOP kinetics for parent.
Geometric mean of studies with two labels of Bruch West soil (b), (p) – benzyl‐, phenyl‐label.
Arithmetic mean of studies with two labels of Bruch West soil (b), (p) – benzyl‐, phenyl‐label.
| 505M09 (BF 505–8) | Dark aerobic conditions | ||||||||
|---|---|---|---|---|---|---|---|---|---|
| Soil type | org.C (%) | pH (CaCl2) | t. oC/% MWHC | Trigger DT50/DT90 (day) | f. f. kf/kdp trigger/modelling | Kinetic parameters | DT50 (day) 20°C pF2/10 kPa(a) | St. (χ2) trigger/modelling | Method of calculation trigger/modelling |
| Bruch West sandy loam (b) | 2.0 | 7.5 | 20/40 | 54.6/181.46 |
0.4286/ 0.428 |
k: 0.01269 | 51.8 |
5.0/ 4.7 |
SFO(b)/ SFO(i) |
| Bruch West sandy loam (p) | 2.0 | 7.5 | 20/40 | 76.8/255 |
0.3661/ 0.3537 |
k: 0.009031 | 74.9 |
7.6/ 3.4 |
SFO(b)/ SFO(i) |
| Bruch West sandy loam average | 2.0 | 7.5 | 20/40 | 64.7(j)/215.1(j) | 0.397(k)/0.391(k) | k: 0.0107(j) | 62.3(j) | – |
SFO(b)/ SFO(i) |
| Lufa 2.2 sand/loamy sand (b) | 2.5 | 5.8 | 20/40 | 29.1/96.61 |
0.3234/ 0.6017 |
k: 0.02383 | 13.4 |
12.8/ 16.6 |
SFO(i)/ SFO(c) |
| Minto loam (b) | 3.0 | 7.7 | 20/40 | –(d) | (0.0722)(e) | –(d) | –(d) | –(d) | SFO(c) |
| Dinuba sandy loam (b) | 0.6 | 7.0 | 20/40 | 69.0/229.12 | 0.369 | k: 0.01005 | 48.8 | 9.1 | SFO(c) |
| Li 35b sandy loam (b) | 1.1 | 6.8 | 20/40 | 61.9/205.5 | 0.3033 | k: 0.01120 | 49.0 | 11.3 | SFO(c) |
| Li 10 loamy sa/nd (b) | 0.81 | 6.3 | 20/40 | 122.8/531.8 | –(f) |
k1: 0.003935 k2: 0.2426 g: 0.811 |
165.5(g) | 1.6 | DFOP |
| Lufa 2.2. sandy loam (b) | 1.6 | 5.4 | 20/40 | 65.5/358.8 | –(f) |
k1: 0.2085 k2: 0.005489 g: 0.284 |
93.7(g) | 2.5 | DFOP |
| Lufa 5 M sandy loam (b) | 2.18 | 7.4 | 20/40 | 159.5/592.8 | –(f) |
k1: 0.4865 k2: 0.003715 g: 0.0958 |
119.7(g) |
2.3/ 3.2 |
DFOP/ SFO |
| Geometric mean (if not pH dependent) | 62.47(h) | ||||||||
| Arithmetic mean | 0.347(h) | ||||||||
| pH dependence | No | ||||||||
Normalised using a Q10 of 2.58 and Walker equation coefficient of 0.7.
FOMC kinetics for parent.
SFO kinetics for parent.
No reliable endpoints derived in kinetic evaluation.
Not taken into consideration for averaging of formation fractions.
Applied as parent.
Derived from slow rate of the respective bi‐phasic model (ln2/k2).
Results from Bruch West soil with two labels were averaged before calculating the overall mean.
DFOP kinetics for parent.
Geometric mean of studies with two labels of Bruch West soil (b), (p) – benzyl‐, phenyl‐label.
Arithmetic mean of studies with two labels of Bruch West soil (b), (p) – benzyl‐, phenyl‐label.
| 505M01 (BF 505–4) | Dark aerobic conditions | ||||||||
|---|---|---|---|---|---|---|---|---|---|
| Soil type | org.C (%) | pH (CaCl2) | t. oC/% MWHC | Trigger DT50/DT90 (day) | f. f. kf/kdp trigger/modelling | Kinetic parameters |
DT50 (day) 20°C pF2/10 kPa(a) |
St. (χ2) trigger/modelling | Method of calculation trigger/modelling |
| Li 10 loamy sand (b) | 0.81 | 6.3 | 20/40 | 3.1/15.3 | –(b) |
k1: 0.5452 k2: 0.1195 g: 0.3759 |
3.4 |
2.1/ 9.0 |
DFOP/ SFO |
| Lufa 2.2. sandy loam (b) | 1.6 | 5.4 | 20/40 | 11.6/45.8 | –(b) |
k1: 0.10.89 k2: 0.04703 g: 0.1379 |
9.4 |
5.1/ 8.8 |
DFOP/ SFO |
| Lufa 5M sandy loam (b) | 2.18 | 7.4 | 20/40 | 1.2/35.07 | –(b) |
k1: 0.578316 k2: 0.03613 tb: 1.90956 |
14.4 | 9.3 | HS |
| Geometric mean (if not pH dependent) | 7.75 | ||||||||
| Arithmetic mean | – | ||||||||
| pH dependence | No | ||||||||
Normalised using a Q10 of 2.58 and Walker equation coefficient of 0.7.
Applied as parent.
Rate of degradation field soil dissipation studies (Regulation (EU) N° 283/2013, Annex Part A, point 7.1.2.2.1 and Regulation (EU) N° 284/2013, Annex Part A, point 9.1.1.2.1).
| Parent | Aerobic conditions | |||||||||
|---|---|---|---|---|---|---|---|---|---|---|
| Soil type (indicate if bare or cropped soil was use/d) | Study – Soil | pH(CaCl2) | Org. C (%) | DT50 (day) | DT90 (day) | Kinetic parameters | St. (χ2) (a) | Fast DT50 (dnorm) 20°C/pF2 | Slow DT50 (dnorm) 20°C/pF2 | Method of calculation (a) |
| Loamy sand (bare soil) | 1999/11287‐ALO/03/98 | 7.5 | 0.7 |
2.4 |
526.5 |
k1: 0.2914 k2: 0.00273 tb: 3.005 |
5.2/ – |
– (b) |
HS/ – |
|
| Sandy loam (bare soil) | 1999/11287 ‐ ALO/04/98 | 7.6 | 0.9 | 5.4 | 793.7 |
k1: 0.1287 k2:0.00186 tb: 6.527 |
9.2/ – |
– (b) |
HS/ – |
|
| Loamy sand (bare soil) | 1999/11287 ‐HUS/09/98 | 5.8 | 1.3 | 91.5 | > 1000 |
k1: 0.00758 k2: 2.3 E‐14 tb: 118.6 |
8.8/12.5 | 79.8 | HS/SFO | |
| Loamy sand (bare soil) | 2000/1000122 ‐ D05/03/97 | 6.3 | 1.08 | 29.3 | > 1000 | k1: 0.05682 k2: 0.00029 g: 0.613 | 1.9/5.9 | 8.3 (c) | 346.2 (d) | DFOP/HS |
| Loamy sand (bare soil) | 2000/1000122 ‐ DU3/04/97 | 5.3 | 0.63 | 63.0 | > 1000 |
k1: 0.01428 k2: 3.07 E‐13 g: 0.843 |
4.8/7.5 | 62.0 | DFOP/SFO | |
| Silty clay loam (bare soil) | 2000/1000122 ‐ DU2/03/97 | 6.4 | 1.29 | 25.1 | > 1,000 | k1: 0.04073 k2: 0.000619 g: 0.776 | 6.7/7.0 | 6.5 (c) | 158.7 (d) | DFOP/DFOP |
| Loam (bare soil, sand cover) | 2014/1289366 ‐ 01 (ES) | 7.3 | 0.93 | 18.5 (f) | 611.7 (f) |
k1: 0.03753 (f) k2: 0.00178 (f) tb: 3.4 (f) |
25.2/33.0 | 101.9 (e) | HS/FOMC | |
| Sandy loam (bare soil, sand cover) | 2014/1289366 ‐ 02 (IT) | 7.6 | 0.45 | 36.7 (f) | 946.6 (f) |
k1: 0.04145 (f) k2: 0.001424 (f) g: 0.615 (f) |
6.0/6.3 | 15.3 (c) | 279.7 (d) | DFOP/DFOP |
| Silt loam (bare soil, sand cover) | 2014/1289366 ‐ 03 (UK) | 6.6 | 1.64 | 62.7 (f) | 625.1 (f) |
k1: 1458 (f) k2: 0.008903 (f) g: 0.241 (f) |
15.2/15.8 | 65.6 | DFOP/SFO | |
| Sandy loam (bare soil, sand cover) | 2014/1289366 ‐ 04 (DE) | 5.9 | 2.07 | 184.7 (f) | > 1,000 (f) |
k1: 0.02567 (f) |
4.5/6.6 | 126.6 | DFOP/SFO | |
| Silt loam (bare soil, sand cover) | 2014/1289366 ‐ 05 (FR) | 4.9 | 0.81 | 14.0 (f) | 283.2 (f) |
k1: 0.09157 (f) k2: 0.00427 (f) g: 0.665 (f) |
4.5/9.9 | 47.4 (e) | DFOP/FOMC | |
| Geometric mean (if not pH dependent) | 38.0 (n = 9) | 113.2 (n = 9) | ||||||||
| pH dependence | No | |||||||||
First value applies to trigger DT50, second value applies to modelling DT50.
No normalised DT50 derived due to experimental conditions not suitable for normalisation.
DegT50 calculated from fast rate (ln2/k1)
DegT50 calculated from slow rate (ln2/k1).
DegT50 was calculated as DT90/3.32.
Best‐fit endpoints should not be used as triggers for additional work due to exclusion of surface loss processes.
Dimoxystrobin metabolites appeared in amounts > LOQ only sporadically under field conditions
Combined laboratory and field kinetic endpoints for modelling (when not from different populations)*

Soil accumulation (Regulation (EU) N° 283/2013, Annex Part A, point 7.1.2.2.2 and Regulation (EU) N° 284/2013, Annex Part A, point 9.1.1.2.2)

Rate of degradation in soil (anaerobic) laboratory studies active substance (Regulation (EU) N° 283/2013, Annex Part A, point 7.1.2.1.3 and Regulation (EU) N° 284/2013, Annex Part A, point 9.1.1.1)
| Parent | Dark anaerobic conditions | ||||||
|---|---|---|---|---|---|---|---|
| Soil type | org. C (%) | pH (a) | t. oC/% MWHC | DT50/DT90 (day) |
DT50 (day) 20°C (b) |
St. (χ2) | Method of calculation |
| Bruch West sandy loam (p) | 2.0 | 7.5 | 20/flooded | not calc. parent stable | not calc. | – | – |
| Geometric mean (if not pH dependent) | – | ||||||
Measured in calcium chloride solution.
Normalised using a Q10 of 2.58.
Aerobic soil metabolites do not appear in significant amounts under field conditions in soil; data on anaerobic degradation rate of metabolites not considered necessary.
Rate of degradation on soil (photolysis) laboratory active substance (Regulation (EU) N° 283/2013, Annex Part A, point 7.1.1.3)
| Parent | Soil photolysis | |||||
|---|---|---|---|---|---|---|
| Soil type | pH (a) | t. oC/% MWHC | DT50/DT90 (d) | St. (χ2) | Method of calculation | |
| Limburgerhof sandy loam | 7.5 | 22/~34 | 33.8 | 112.2 | 3.5 | First‐order test system days (cont. irradiation); extrapolated |
Measured in calcium chloride solution.
Soil adsorption active substance (Regulation (EU) N° 283/2013, Annex Part A, point 7.1.3.1.1 and Regulation (EU) N° 284/2013, Annex Part A, point 9.1.2.1)
| Parent | |||||||
| Soil Type | OC (%) | pHCaCl2 (pHH2O) | Kd (mL/g) | Kdoc (mL/g) | KF (mL/g) | KFoc (mL/g) | 1/n |
| Indirect method | |||||||
| Silt loam (Nierswalder) | 1.85 | 5.7 (6.5) | 9.14 | 493.8 | 0.99 | ||
| Loam (Fiorentino) | 1.00 | 7.4 (8.2) | 5.94 | 593.9 | 0.95 | ||
| Loamy sand (Li10) | 0.95 | 6.2 (6.9) | 3.33 | 350.6 | 0.94 | ||
| Sand (Lufa 2.1) | 0.60 | 5.6 (6.5) | 1.82 | 303.6 | 0.93 | ||
| Sandy loam (Lufa 2.3) | 0.99 | 6.7 (7.4) | 3.45 | 348.1 | 0.94 | ||
| Indirect method | |||||||
| Sandy loam (Bruch West) | 1.8 | 7.5 (8.0) (a) | 3.52 | 195.8 | 0.902 | ||
| Indirect method | |||||||
| Loamy sand (Borstel) | 1.2 | 4.6 (5.6) | 6.76 | 563 | 0.940 | ||
| Geometric mean (if not pH dependent) | 382.5 | ||||||
| Arithmetic mean (if not pH dependent) | 0.942 | ||||||
| pH dependence | No | ||||||
estimated using pH water = 0.953*pH‐CaCl2 + 0.853 European Commission ( 2014a ).
Soil adsorption transformation products (Regulation (EU) N° 283/2013, Annex Part A, point 7.1.3.1.2 and Regulation (EU) N° 284/2013, Annex Part A, point 9.1.2.1)
| Metabolite 505M08 (BF 505–7) | |||||||
|---|---|---|---|---|---|---|---|
| Soil Type | OC (%) | pHCaCl2 (pHH2O) | Kd (mL/g) | Kdoc (mL/g) | KF (mL/g) | KFoc (mL/g) | 1/n |
| Indirect method | |||||||
| Sand/loamy sand (Lufa 2.2) | 2.5 | 5.8 (6.4) | 0.499 | 20.0 | 0.95 | ||
| Loamy sand (Bruch West) | 1.5 | 7.5 (8.0) | 0.057 | 3.8 | 1.22 | ||
| Loamy sand (Li35b) | 1.1 | 6.5 (7.0) | 0.086 | 7.8 | 0.99 | ||
| Silty loamy sand (USA 538‐31‐2) | 0.5 | 5.2 (5.8) | 0.665 | 133.0 | 0.95 | ||
| Indirect (one soil, Niersw. Wild.) and Direct method (four soils) | |||||||
| Silt loam (Niersw. Wild.) | 1.9 | 5.7 (6.5) | 0.750 | 40.6 | 0.96 | ||
| Loam (Fiorentino) | 1.0 | 7.4 (8.2) | 0.080 | 8.3 | 1.00 | ||
| Loamy sand (Li 10) | 1.0 | 6.2 (6.9) | 0.090 | 9.6 | 1.00 | ||
| Sand (Lufa 2.1) | 0.6 | 5.6 (6.5) | 0.130 | 22.0 | 1.00 | ||
| Sandy loam (Lufa 2.3) | 1.0 | 6.7 (7.4) | 0.060 | 6.0 | 0.99 | ||
| Direct method | |||||||
| Silt loam (Niersw. Wild.) | 2.01 | 5.6 (6.2) | 0.49 | 24.2 | 0.91 | ||
| Loam (PioggioRenatico) | 0.82 | 7.5 (8.3) | 0.17 | 20.2 | 0.96 | ||
| Loamy sand (Li 10) | 0.89 | 6.1 (6 9) | 0.14 | 15.7 | 0.93 | ||
| Sand (Lufa 2.1) | 0.72 | 5.6 (6.2) | 0.26 | 35.6 | 0.93 | ||
| Sandy loam (Lufa 2.3) | 0.66 | 5.3 (6 3) | 0.12 | 17.6 | 0.96 | ||
|
Geometric mean (if not pH dependent) Soils with pH (water) > 6.5 Soils with pH (water) ≤ 6.5 |
8.92 32.2 |
||
|
Arithmetic mean (if not pH dependent) Soils with pH (water) > 6.5 Soils with pH (water) ≤ 6.5 |
1.01 0.952 |
| pH dependence | Yes |
| Metabolite 505M09 (BF 505–8) | |||||||
| Soil Type | OC (%) | pHCaCl2 (pHH2O) | Kd (mL/g) | Kdoc (mL/g) | KF (mL/g) | KFoc (mL/g) | 1/n |
| Indirect method | |||||||
| Sand/loamy sand (Lufa 2.2) | 2.5 | 5.8 (6.4)(a) | 1.111 | 44.4 | 0.92 | ||
| Loamy sand (Bruch West) | 1.5 | 7.5 (8)(a) | 0.135 | 9.0 | 0.81 | ||
| Loamy sand (Li35b) | 1.1 | 6.5 (7)(a) | 0.142 | 12.9 | 0.812 | ||
| Silty loamy sand (USA 538‐31‐2) | 0.5 | 5.2 (5.8)(a) | 0.595 | 119.0 | 0.892 | ||
| Direct method | |||||||
| Silt loam (Niersw. Wild.) | 1.9 | 5.7 (6.5) | 1.170 | 63.22 | 0.95 | ||
| Loam (Fiorentino) | 1.0 | 7.4 (8.2) | 0.200 | 20.37 | 0.94 | ||
| Loamy sand (Li 10) | 1.0 | 6.2 (6.9) | 0.180 | 19.07 | 0.96 | ||
| Sand (Lufa 2.1) | 0.6 | 5.6 (6.5) | 0.280 | 45.85 | 1.00 | ||
| Sandy loam (Lufa 2.3) | 0.99 | 6.7 (7.4) | 0.160 | 16.56 | 0.92 | ||
| Direct method | |||||||
| Sand (Lufa 2.1) | 0.72 | 5.6 (6.2) | 0.470 | 65.217 | 0.973 | ||
| Sandy loam (Lufa 2.3) | 0.66 | 5.3 (6.3) | 0.165 | 24.988 | 0.938 | ||
| Loamy sand (Li 10) | 0.89 | 6.1 (6.9) | 0.235 | 26.387 | 0.955 | ||
| Silt loam (Niersw. Wild.) | 2.01 | 5.6 (6.2) | 0.682 | 33.923 | 0.943 | ||
| Loam (PioggioRenatico) | 0.82 | 7.5 (8.3) | 0.195 | 23.750 | 0.921 | ||
|
Geometric mean (if not pH dependent) Soils with pH (water) > 6.5 Soils with pH (water) ≤ 6.5 |
17.32 50.58 |
||||||
|
Arithmetic mean (if not pH dependent) Soils with pH (water) > 6.5 Soils with pH (water) ≤ 6.5 |
0.903 0.945 |
||||||
| pH dependence | Yes | ||||||
Estimated as proposed by FOCUS (2000, 2014) pH water = 0.953*pH‐CaCl2 + 0.85.
| Metabolite 505M01 (BF 505–4) | |||||||
|---|---|---|---|---|---|---|---|
| Soil Type | OC (%) | pHCaCl2 (pHH2O) | Kd (mL/g) | Kdoc (mL/g) | KF (mL/g) | KFoc (mL/g) | 1/n |
| Direct method | |||||||
| Silt loam (Niersw. Wild.) | 1.85 | 5.7 (6.5) | 0.150 | 8.4 | 0.99 | ||
| Loam (Fiorentino) | 1.0 | 7.4 (8.2) | 0.230 | 23.4 | 0.91 | ||
| Loamy sand (Li 10) | 0.95 | 6.2 (6.9) | 0.050 | 5.5 | 0.98 | ||
| Sand (Lufa 2.1) | 0.6 | 5.6 (6.5) | 0.040 | 6.6 | 0.93 | ||
| Sandy loam (Lufa 2.3) | 0.99 | 6.7 (7.4) | 0.100 | 10.0 | 1.00 | ||
| Direct method | |||||||
| Sand (Lufa 2.1) | 0.72 | 5.6 (6.2) | 0.031 | 4.322 | 0.973 | ||
| Sandy loam (Lufa 2.3) | 0.66 | 5.3 (6.3) | 0.019 | 2.862 | 0.877 | ||
| Loamy sand (Li 10) | 0.89 | 6.1 (6.9) | 0.040 | 4.525 | 1.017 | ||
| Silt loam (Niersw. Wild.) | 2.01 | 5.6 (6.2) | 0.156 | 7.758 | 0.998 | ||
| Loam (Fiorentino) | 0.82 | 7.5 (8.3) | 0.105 | 12.784 | 0.954 | ||
| Geometric mean (if not pH dependent) | 7.24 | ||||||
| Arithmetic mean (if not pH dependent) | 0.963 | ||||||
| pH dependence | No | ||||||
Mobility in soil column leaching active substance (Regulation (EU) N° 283/2013, Annex Part A, point 7.1.4.1.1 and Regulation (EU) N° 284/2013, Annex Part A, point 9.1.2.1)

Mobility in soil column leaching transformation products (Regulation (EU) N° 283/2013, Annex Part A, point 7.1.4.1.2 and Regulation (EU) N° 284/2013, Annex Part A, point 9.1.2.1)

Lysimeter/field leaching studies (Regulation (EU) N° 283/2013, Annex Part A, points 7.1.4.2/7.1.4.3 and Regulation (EU) N° 284/2013, Annex Part A, points 9.1.2.2/9.1.2.3)


Hydrolytic degradation (Regulation (EU) N° 283/2013, Annex Part A, point 7.2.1.1)

Aqueous photochemical degradation (Regulation (EU) N° 283/2013, Annex Part A, points 7.2.1.2/7.2.1.3)

‘Ready biodegradability’ (Regulation (EU) N° 283/2013, Annex Part A, point 7.2.2.1)

Aerobic mineralisation in surface water (Regulation (EU) N° 283/2013, Annex Part A, point 7.2.2.2 and Regulation (EU) N° 284/2013, Annex Part A, point 9.2.1)
| Parent | Compound stable under applied experimental conditions, no significant degradation was observed | |||||||||
|---|---|---|---|---|---|---|---|---|---|---|
| System identifier (indicates fresh, estuarine or marine) | pH water phase | pH sed (a) | t. oC (b) | DT50/DT90 whole sys. (suspended sediment test) | St. (χ2) | DT50/DT90 Water (pelagic test) | St. (χ2) | Method of calculation | ||
| At study temp | Normalised to – oC (c) | At study temp | Normalised to – oC (c) | |||||||
| Fresh water (high conc.*) | 8.99 | 7.5 | 20 | n.c. | n.p. | – | n.c. | n.p. | – | – |
| Fresh water (low conc.*) | 8.99 | 7.5 | 20 | n.c. | n.p. | – | n.c. | n.p. | – | – |
n.p.: not performed; n.c.: not calculated.
The test was performed in lake water and sediment at two different dimoxystrobin concentrations (10 μg/L and 90 μg/L).
Measured in calcium chloride solution.
Temperature of incubation = temperature that the environmental media were collected or std. temperature of 20°C.
Normalised using a Q10 of 2.58 to the temperature of the environmental media at the point of sampling. (note temp of × should be stated).
| Metabolites 505M08 & 09 | Max in total system < 1% after 59 days | |||||||||
|---|---|---|---|---|---|---|---|---|---|---|
| System identifier (indicates fresh, estuarine or marine) | pH water phase | pH sed(a) | t. oC(b) | DT50/DT90 whole sys. (suspended sediment test) | St. (χ2) | DT50/DT90 Water (pelagic test) | St. (χ2) | Method of calculation | ||
| At study temp | Normalised to – oC(c) | At study temp | Normalised to – oC(c) | |||||||
| Fresh water (high conc.*) | 8.99 | 7.5 | 20 | n.c. | n.p. | – | n.c. | n.p. | ||
| Fresh water (low conc.*) | 8.99 | 7.5 | 20 | n.c. | n.p. | – | n.c. | n.p. | ||
n.p.: not performed; n.c.: not calculated.
The test was performed in lake water and sediment at two different dimoxystrobin concentrations (10 μg/L and 90 μg/L).
Measured in calcium chloride solution.
Temperature of incubation = temperature that the environmental media were collected or std. temperature of 20°C.
Normalised using a Q10 of 2.58 to the temperature of the environmental media at the point of sampling. (note temp of × should be stated).
Mineralisation and non‐extractable residues (for parent dosed experiments)
| System identifier (indicate fresh, estuarine or marine) | pH water phase | pH sed | Mineralisation max % after 35 and 59 days (end of the study) | Non‐extractable residues. Max % after d (suspended sediment test) | Non‐extractable residues. Max % after d (end of the study) (suspended sediment test) |
|---|---|---|---|---|---|
| Fresh water (high conc.*) | 8.99 | 7.5 | 0.1–0.5% (35, 59 d) | – | – |
| Fresh water (low conc.*) | 8.99 | 7.5 | 0.7% (59 d) | – | – |
The test was performed in lake water and sediment at two different dimoxystrobin concentrations (10 μg/L and 90 μg/L).
Water/sediment study (Regulation (EU) N° 283/2013, Annex Part A, point 7.2.2.3 and Regulation (EU) N° 284/2013, Annex Part A, point 9.2.2)
| Parent |
Distribution max 89–93% in water after 0 d; max. sed. dark: 58–62% after 100 d |
|||||||||
|---|---|---|---|---|---|---|---|---|---|---|
| Water/sediment system | pH water phase | pH sed (a) | t. oC | DT50/DT90 whole sys. | St. (χ2) | DT50/DT90 water | St. (χ2) | DT50/DT90 sed | St. (χ2) | Method of calculation |
| Trigger endpoints | ||||||||||
| Kellmetschweiher (dark, lab.) | 8.5 | 7.5 | 20 | 834.5/> 1,000 | 0.5 | 25.3/213.9 | 2.4 | n.c. | – | HS/DFOP/− |
| Bergh. Altrhein (dark, lab.) | 8.2 | 7.6 | 20 | 297.6/988.7 | 1.5 | 13.6/126.9 | 3.0 | n.c. | – | SFO/DFOP/− |
| Modelling endpoints | ||||||||||
| Kellmetschweiher (dark, lab.) | 8.5 | 7.5 | 20 | 525.6 | 1.0 | – | – | – | – | SFO/−/− |
| Bergh. Altrhein (dark, lab.) | 8.2 | 7.6 | 20 | 297.6 | 1.5 | – | – | – | – | SFO/−/− |
| Geometric mean at 20°C | 395.5(b) | n.c. | n.c. | |||||||
n.c.: not calculated; not rep.: not reported.
Measured in calcium chloride solution.
Geometric mean of modelling endpoints, laboratory systems, n = 2.
| Metabolite 505M08 |
Distribution: max. water (dark) 2.9%; max. water (irrad.) 3.6% max. sediment (dark) 0%, max. sediment (irrad.) 0.8% no reliable derivation of degradation rates possible |
|||||||||
|---|---|---|---|---|---|---|---|---|---|---|
| Water/sediment system | pH water phase | pH sed | t. o C | DT50/DT90 whole sys. | St. (χ2) | DT50/DT90 water | St. (χ2) | DT50/DT90 sed | St. (χ2) | Method of calculation |
| n.c. | n.c. | n.c. | ||||||||
| Geometric mean at 20°C | ||||||||||
n.c.: not calculated.
| Metabolite 505M09 |
Distribution: max. water (dark) 5.2%; max. water (irrad.) 5.3% max. sediment (dark) 0%, max. sediment (irrad.) 1.2% no reliable derivation of degradation rates possible |
|||||||||
|---|---|---|---|---|---|---|---|---|---|---|
| Water/sediment system | pH water phase | pH sed | t. oC | DT50/DT90 whole sys. |
St. (χ2) |
DT50/DT90 water |
St. (χ2) |
DT50/DT90 sed |
St. (χ2) |
Method of calculation |
| n.c. | n.c. | n.c. | ||||||||
| Geometric mean at 20°C | ||||||||||
n.c.: not calculated.
| Metabolite 505M01 |
Distribution: max. water (irrad.) 3.2% max. sediment (irrad.) 0.4% |
|||||||||
|---|---|---|---|---|---|---|---|---|---|---|
| Water/sediment system | pH water phase | pH sed(a) | t. oC | DT50/DT90 whole sys. |
St. (χ2) |
DT50/DT90 water |
St. (χ2) |
DT50/DT90 sed |
St. (χ2) |
Method of calculation |
| Kellmetschweiher (irradiated) | 8.8 | not rep. | (b) | 31.2/103.6 | 4.4 | n.c. | n.c. | SFO | ||
| Geometric mean at 20oC(b) | ||||||||||
not rep.: not reported; n.c.: not calculated.
Measured in calcium chloride solution.
Mean water temp. during incub. period 18.1°C (min 8.6°C, max. 28.5°C).
| Metabolite 505M96 |
Distribution:max. water (irrad.) 9.6% max. sediment (irrad.) 0% |
|||||||||
|---|---|---|---|---|---|---|---|---|---|---|
| Water/sediment system | pH water phase | pH sed(a) | t. oC | DT50/DT90 whole sys. |
St. (χ2) |
DT50/DT90 water |
St. (χ2) |
DT50/DT90 sed |
St. (χ2) |
Method of calculation |
| Kellmetschweiher (irradiated) | 8.8 | not rep. | (b) | 43.4/144.2 | 4.2 | n.c. | n.c. | SFO | ||
| Geometric mean at 20oC(b) | ||||||||||
not rep.: not reported; n.c.: not calculated.
Measured in calcium chloride solution.
Mean water temp. during incub. period 18.1°C (min 8.6°C, max. 28.5°C).
Mineralisation and non‐extractable residues (from parent dosed experiments)
| Water/sediment system | pH water phase | pH sed | Mineralisation % after 100/120 d. (end of the study). | Non‐extractable residues in sed. max % after 100/120 d (end of the study) | Non‐extractable residues in sed. max % after 100/120 d (end of the study) |
|---|---|---|---|---|---|
| Kellmetschweiher (dark, lab.) | 8.5 | 7.5 | 0.8% at 100 d | 6% after 100 d | 6% after 100 d |
| Bergh. Altrhein (dark, lab.) | 8.2 | 7.6 | 2.1% at 100 d | 11% after 100 d | 11% after 100 d |
Fate and behaviour in air (Regulation (EU) N° 283/2013, Annex Part A, point 7.3.1)

Residues requiring further assessment (Regulation (EU) N° 283/2013, Annex Part A, point 7.4.1)


Definition of the residue for monitoring (Regulation (EU) N° 283/2013, Annex Part A, point 7.4.2)

Monitoring data, if available (Regulation (EU) N° 283/2013, Annex Part A, point 7.5

PEC soil (Regulation (EU) N° 284/2013, Annex Part A, points 9.1.3/9.3.1)


Parent – Winter oilseed rape
| PEC(s) (mg/kg) |
Single application Actual |
Single application Time‐weighted average |
Multiple application Actual |
Multiple application Time‐weighted average |
|---|---|---|---|---|
| Initial | Not reported (a) | 0.048 | ||
| Short term 24 h | Not reported (a) | Not reported (a) | 0.048 | 0.048 |
| 2d | Not reported (a) | Not reported (a) | 0.048 | 0.048 |
| 4d | Not reported (a) | Not reported (a) | 0.047 | 0.048 |
| Long term 7d | Not reported (a) | Not reported (a) | 0.046 | 0.047 |
| 28d | Not reported (a) | Not reported (a) | 0.039 | 0.044 |
| 50d | Not reported (a) | Not reported (a) | 0.033 | 0.040 |
| 100d | Not reported (a) | Not reported (a) | 0.023 | 0.034 |
| Plateau concentration | 0.006 mg/kg (ESCAPE) | |||
Only values for the multiple application are reported as worst case.
Parent – Sunflower
|
PEC(s) (mg/kg) |
Single application Actual |
Single application Time‐weighted average |
Multiple application Actual |
Multiple application Time‐weighted average |
|---|---|---|---|---|
| Initial | 0.033 | Not applicable | ||
| Short term 24 h | 0.033 | 0.033 | Not applicable | Not applicable |
| 2d | 0.033 | 0.033 | Not applicable | Not applicable |
| 4d | 0.032 | 0.033 | Not applicable | Not applicable |
| Long term 7d | 0.032 | 0.033 | Not applicable | Not applicable |
| 28d | 0.027 | 0.030 | Not applicable | Not applicable |
| 50d | 0.023 | 0.027 | Not applicable | Not applicable |
| 100d | 0.016 | 0.023 | Not applicable | Not applicable |
| Plateau concentration | 0.004 mg/kg (ESCAPE) | |||
505M01 – Winter oilseed rape
| PEC(s) (mg/kg) |
Single application Actual |
Single application Time‐weighted average |
Multiple application Actual |
Multiple application Time‐weighted average |
|---|---|---|---|---|
| Initial | Not reported (a) | 0.005 | ||
| Short term 24 h | Not reported (a) | Not reported (a) | Not reported (b) | Not reported (b) |
| 2d | Not reported (a) | Not reported (a) | Not reported (b) | Not reported (b) |
| 4d | Not reported (a) | Not reported (a) | Not reported (b) | Not reported (b) |
| Long term 7d | Not reported (a) | Not reported (a) | Not reported (b) | Not reported (b) |
| 28d | Not reported (a) | Not reported (a) | Not reported (b) | Not reported (b) |
| 50d | Not reported (a) | Not reported (a) | Not reported (b) | Not reported (b) |
| 100d | Not reported (a) | Not reported (a) | Not reported (b) | Not reported (b) |
| Plateau concentration | Not applicable |
Only values for the multiple application are reported as worst case.
Only initial values are reported as worst‐case estimates of short‐term and long‐term exposure.
505M01 – Sunflower
| PEC(s) (mg/kg) |
Single application Actual |
Single application Time‐weighted average |
Multiple application Actual |
Multiple application Time‐weighted average |
|---|---|---|---|---|
| Initial | 0.005 | Not applicable | ||
| Short term 24 h | Not reported (a) | Not reported (a) | Not applicable | Not applicable |
| 2d | Not reported (a) | Not reported (a) | Not applicable | Not applicable |
| 4d | Not reported (a) | Not reported (a) | Not applicable | Not applicable |
| Long term 7d | Not reported (a) | Not reported (a) | Not applicable | Not applicable |
| 28d | Not reported (a) | Not reported (a) | Not applicable | Not applicable |
| 50d | Not reported (a) | Not reported (a) | Not applicable | Not applicable |
| 100d | Not reported (a) | Not reported (a) | Not applicable | Not applicable |
| Plateau concentration | Not applicable |
Only initial values are reported as worst‐case estimates of short‐term and long‐term exposure.
505M08 – Winter oilseed rape
| PEC(s) (mg/kg) |
Single application Actual |
Single application Time‐weighted average |
Multiple application Actual |
Multiple application Time‐weighted average |
|---|---|---|---|---|
| Initial | Not reported (a) | 0.008 | ||
| Short term 24 h | Not reported (a) | Not reported (a) | Not reported (b) | Not reported (b) |
| 2d | Not reported (a) | Not reported (a) | Not reported (b) | Not reported (b) |
| 4d | Not reported (a) | Not reported (a) | Not reported (b) | Not reported (b) |
| Long term 7d | Not reported (a) | Not reported (a) | Not reported (b) | Not reported (b) |
| 28d | Not reported (a) | Not reported (a) | Not reported (b) | Not reported (b) |
| 50d | Not reported (a) | Not reported (a) | Not reported (b) | Not reported (b) |
| 100d | Not reported (a) | Not reported (a) | Not reported (b) | Not reported (b) |
| Plateau concentration | 0.004 mg/kg (ESCAPE) | |||
Only values for the multiple application are reported as worst case.
Only initial values are reported as worst‐case estimates of short‐term and long‐term exposure.
505M08 – Sunflower
|
PEC(s) (mg/kg) |
Single application Actual |
Single application Time‐weighted average |
Multiple application Actual |
Multiple application Time‐weighted average |
|---|---|---|---|---|
| Initial | 0.005 | Not applicable | ||
| Short term 24 h | Not reported (a) | Not reported (a) | Not applicable | Not applicable |
| 2d | Not reported (a) | Not reported (a) | Not applicable | Not applicable |
| 4d | Not reported (a) | Not reported (a) | Not applicable | Not applicable |
| Long term 7d | Not reported (a) | Not reported (a) | Not applicable | Not applicable |
| 28d | Not reported (a) | Not reported (a) | Not applicable | Not applicable |
| 50d | Not reported (a) | Not reported (a) | Not applicable | Not applicable |
| 100d | Not reported (a) | Not reported (a) | Not applicable | Not applicable |
| Plateau concentration | 0.003 mg/kg (ESCAPE) | |||
Only initial values are reported as worst‐case estimates of short‐term and long‐term exposure.
505M09 – Winter oilseed rape
|
PEC(s) (mg/kg) |
Single application Actual |
Single application Time‐weighted average |
Multiple application Actual |
Multiple application Time‐weighted average |
|---|---|---|---|---|
| Initial | Not reported (a) | 0.008 | ||
| Short term 24 h | Not reported (a) | Not reported (a) | Not reported (b) | Not reported (b) |
| 2d | Not reported (a) | Not reported (a) | Not reported (b) | Not reported (b) |
| 4d | Not reported (a) | Not reported (a) | Not reported (b) | Not reported (b) |
| Long term 7d | Not reported (a) | Not reported (a) | Not reported (b) | Not reported (b) |
| 28d | Not reported (a) | Not reported (a) | Not reported (b) | Not reported (b) |
| 50d | Not reported (a) | Not reported (a) | Not reported (b) | Not reported (b) |
| 100d | Not reported (a) | Not reported (a) | Not reported (b) | Not reported (b) |
| Plateau concentration | 0.001 mg/kg (ESCAPE) | |||
Only values for the multiple application are reported as worst case.
Only initial values are reported as worst‐case estimates of short‐term and long‐term exposure.
505M09 – Sunflower
|
PEC(s) (mg/kg) |
Single application Actual |
Single application Time‐weighted average |
Multiple application Actual |
Multiple application Time‐weighted average |
|---|---|---|---|---|
| Initial | 0.005 | Not applicable | ||
| Short term 24 h | Not reported (a) | Not reported (a) | Not applicable | Not applicable |
| 2d | Not reported (a) | Not reported (a) | Not applicable | Not applicable |
| 4d | Not reported (a) | Not reported (a) | Not applicable | Not applicable |
| Long term 7d | Not reported (a) | Not reported (a) | Not applicable | Not applicable |
| 28d | Not reported (a) | Not reported (a) | Not applicable | Not applicable |
| 50d | Not reported (a) | Not reported (a) | Not applicable | Not applicable |
| 100d | Not reported (a) | Not reported (a) | Not applicable | Not applicable |
| Plateau concentration | < 0.001 mg/kg (ESCAPE) | |||
Only initial values are reported as worst‐case estimates of short‐term and long‐term exposure.
PEC ground water (Regulation (EU) N° 284/2013, Annex Part A, point 9.2.4.1)


PEC(gw) – FOCUS modelling results (80th percentile annual average concentration at 1 m) triennial application
| PEARL 4.4.4/Winter oilseed rape 2 × 100 g a.i./ha | Scenario | Parent (μg/L) | Metabolite (μg/L) | ||||
|---|---|---|---|---|---|---|---|
| 505M01 | 505M08 (Kfoc = 8.93 ml/g) | 505M08 (Kfoc = 32.2 ml/g) | 505M09 (Kfoc = 17.32 ml/g) | 505M09 (Kfoc = 50.58 ml/g) | |||
| Early application | |||||||
| Chateaudun | 0.001 | 0.010 | 2.018 | 0.621 | 1.129 | 0.431 | |
| Hamburg | 0.011 | 0.091 | 2.640 | 1.127 | 1.701 | 0.823 | |
| Kremsmunster | 0.007 | 0.030 | 1.760 | 0.735 | 1.160 | 0.533 | |
| Okehampton | 0.011 | 0.054 | 1.499 | 0.773 | 1.097 | 0.607 | |
| Piacenza | 0.004 | 0.025 | 0.979 | 0.496 | 0.741 | 0.371 | |
| Porto | 0.003 | 0.044 | 1.259 | 0.532 | 0.849 | 0.399 | |
| Late application | |||||||
| Chateaudun | 0.001 | 0.011 | 2.034 | 0.640 | 1.149 | 0.428 | |
| Hamburg | 0.011 | 0.101 | 2.727 | 1.144 | 1.742 | 0.849 | |
| Kremsmunster | 0.007 | 0.033 | 1.774 | 0.752 | 1.195 | 0.549 | |
| Okehampton | 0.010 | 0.056 | 1.511 | 0.786 | 1.107 | 0.615 | |
| Piacenza | 0.003 | 0.028 | 1.011 | 0.497 | 0.750 | 0.375 | |
| Porto | 0.003 | 0.051 | 1.373 | 0.578 | 0.920 | 0.433 | |
| PELMO 5.5.3/Winter oilseed rape 2 × 100 g a.i./ha | Scenario | Parent (μg/L) | Metabolite (μg/L) | ||||
|---|---|---|---|---|---|---|---|
| 505M01 | 505M08 (Kfoc = 8.93 ml/g) | 505M08 (Kfoc = 32.2 ml/g) | 505M09 (Kfoc = 17.32 ml/g) | 505M09 (Kfoc = 50.58 ml/g) | |||
| Early application | |||||||
| Chateaudun | 0.001 | 0.013 | 1.847 | 0.592 | 1.089 | 0.404 | |
| Hamburg | 0.009 | 0.101 | 2.588 | 1.169 | 1.764 | 0.854 | |
| Kremsmunster | 0.007 | 0.039 | 1.902 | 0.834 | 1.299 | 0.606 | |
| Okehampton | 0.014 | 0.075 | 1.630 | 0.876 | 1.220 | 0.694 | |
| Piacenza | 0.004 | 0.045 | 1.253 | 0.601 | 0.927 | 0.459 | |
| Porto | 0.006 | 0.075 | 1.302 | 0.677 | 0.936 | 0.514 | |
| Late application | |||||||
| Chateaudun | < 0.001 | 0.013 | 1.822 | 0.599 | 1.095 | 0.403 | |
| Hamburg | 0.009 | 0.111 | 2.733 | 1.228 | 1.844 | 0.870 | |
| Kremsmunster | 0.007 | 0.043 | 1.914 | 0.857 | 1.312 | 0.616 | |
| Okehampton | 0.013 | 0.078 | 1.638 | 0.890 | 1.251 | 0.708 | |
| Piacenza | 0.003 | 0.050 | 1.283 | 0.623 | 0.929 | 0.460 | |
| Porto | 0.005 | 0.087 | 1.379 | 0.689 | 0.983 | 0.515 | |
| MACRO 5.5.4/Winter oilseed rape 2 × 100 g a.i./ha | Scenario | Parent (μg/L) | Metabolite (μg/L) | ||||
|---|---|---|---|---|---|---|---|
| 505M01 | 505M08 (Kfoc = 8.93 ml/g) | 505M08 (Kfoc = 32.2 ml/g) | 505M09 (Kfoc = 17.32 ml/g) | 505M09 (Kfoc = 50.58 ml/g) | |||
| Chateaudun (early appl.) | 0.001 | 0.015 | 1.480 | 0.447 | 0.857 | 0.299 | |
| Chateaudun (late appl.) | 0.001 | 0.016 | 1.570 | 0.458 | 0.896 | 0.310 | |
| PEARL 4.4.4/Sunflower 100 g a.i./ha | Scenario | Parent (μg/L) | Metabolite (μg/L) | ||||
|---|---|---|---|---|---|---|---|
| 505M01 | 505M08 (Kfoc = 8.93 ml/g) | 505M08 (Kfoc = 32.2 ml/g) | 505M09 (Kfoc = 17.32 ml/g) | 505M09 (Kfoc = 50.58 ml/g) | |||
| Piacenza | 0.004 | 0.024 | 1.050 | 0.438 | 0.684 | 0.340 | |
| Sevilla | < 0.001 | 0.006 | 0.541 | 0.112 | 0.234 | 0.069 | |
| PELMO 5.5.3/Sunflower 100 g a.i./ha | Scenario | Parent (μg/L) | Metabolite (μg/L) | ||||
|---|---|---|---|---|---|---|---|
| 505M01 | 505M08 (Kfoc = 8.93 ml/g) | 505M08 (Kfoc = 32.2 ml/g) | 505M09 (Kfoc = 17.32 ml/g) | 505M09 (Kfoc = 50.58 ml/g) | |||
| Piacenza | 0.007 | 0.031 | 0.885 | 0.427 | 0.604 | 0.340 | |
| Sevilla | < 0.001 | 0.009 | 0.590 | 0.129 | 0.270 | 0.062 | |
|
MACRO 5.5.4/maize 100 g a.i./ha |
Scenario | Parent (μg/L) | Metabolite (μg/L) | ||||
|---|---|---|---|---|---|---|---|
| 505M01 | 505M08 (Kfoc = 8.93 ml/g) | 505M08 (Kfoc = 32.2 ml/g) | 505M09 (Kfoc = 17.32 ml/g) | 505M09 (Kfoc = 50.58 ml/g) | |||
| Chateaudun | 0.001 | 0.018 | 0.813 | 0.308 | 0.507 | 0.205 | |
| PEC (gw) From lysimeter/field studies |
| – |
PEC surface water and PEC sediment (Regulation (EU) N° 284/2013, Annex Part A, points 9.2.5/9.3.1)


|
FOCUS STEP 1 Scenario |
Day after overall maximum | PECSW (μg/L) | PECSED (μg/kg) | ||
|---|---|---|---|---|---|
| Actual | TWA | Actual | TWA | ||
| Twofold application to winter oilseed rape | 0 h | 45.989 | – | 173.23 | – |
| 24 h | 45.289 | 45.639 | Not reported (a) | Not reported (a) | |
| 2 d | 45.210 | 45.444 | Not reported (a) | Not reported (a) | |
| 4 d | 45.051 | 45.287 | Not reported (a) | Not reported (a) | |
| 7 d | 44.815 | 45.135 | Not reported (a) | Not reported (a) | |
| 14 d | 44.269 | 44.838 | Not reported (a) | Not reported (a) | |
| 21 d | 43.729 | 44.553 | Not reported (a) | Not reported (a) | |
| 28 d | 43.196 | 44.284 | Not reported (a) | Not reported (a) | |
| 42 d | 42.149 | 43.746 | Not reported (a) | Not reported (a) | |
Only initial values are reported as worst‐case estimates of short‐term and long‐term exposure.
|
FOCUS STEP 2 Scenario |
Day after overall maximum | PECSW (μg/L) | PECSED (μg/kg) | ||
|---|---|---|---|---|---|
| Actual | TWA | Actual | TWA | ||
|
Northern EU Twofold application to winter oilseed rape, early application (October–February) |
0 h | 7.141 | – | 26.76 | – |
| 24 h | 6.996 | 7.069 | Not reported (a) | Not reported (a) | |
| 2 d | 6.984 | 7.030 | Not reported (a) | Not reported (a) | |
| 4 d | 6.960 | 7.001 | Not reported (a) | Not reported (a) | |
| 7 d | 6.923 | 6.975 | Not reported (a) | Not reported (a) | |
| 14 d | 6.839 | 6.928 | Not reported (a) | Not reported (a) | |
| 21 d | 6.755 | 6.884 | Not reported (a) | Not reported (a) | |
| 28 d | 6.673 | 6.842 | Not reported (a) | Not reported (a) | |
| 42 d | 6.511 | 6.759 | Not reported (a) | Not reported (a) | |
|
Southern EU Twofold application to winter oilseed rape, early application (October–February) |
0 h | 5.948 | – | 22.21 | – |
| 24 h | 5.805 | 5.877 | Not reported (a) | Not reported (a) | |
| 2 d | 5.795 | 5.839 | Not reported (a) | Not reported (a) | |
| 4 d | 5.775 | 5.812 | Not reported (a) | Not reported (a) | |
| 7 d | 5.745 | 5.790 | Not reported (a) | Not reported (a) | |
| 14 d | 5.675 | 5.750 | Not reported (a) | Not reported (a) | |
| 21 d | 5.605 | 5.713 | Not reported (a) | Not reported (a) | |
| 28 d | 5.537 | 5.678 | Not reported (a) | Not reported (a) | |
| 42 d | 5.403 | 5.608 | Not reported (a) | Not reported (a) | |
Only initial values are reported as worst‐case estimates of short‐term and long‐term exposure.
|
FOCUS STEP 2 Scenario |
Day after overall maximum | PECSW (μg/L) | PECSED (μg/kg) | ||
|---|---|---|---|---|---|
| Actual | TWA | Actual | TWA | ||
|
Northern EU Twofold application to winter oilseed rape, late application (March–May) |
0 h | 3.562 | – | 13.09 | – |
| 24 h | 3.423 | 3.493 | Not reported (a) | Not reported (a) | |
| 2 d | 3.417 | 3.457 | Not reported (a) | Not reported (a) | |
| 4 d | 3.406 | 3.434 | Not reported (a) | Not reported (a) | |
| 7 d | 3.388 | 3.418 | Not reported (a) | Not reported (a) | |
| 14 d | 3.346 | 3.392 | Not reported (a) | Not reported (a) | |
| 21 d | 3.306 | 3.370 | Not reported (a) | Not reported (a) | |
| 28 d | 3.265 | 3.349 | Not reported (a) | Not reported (a) | |
| 42 d | 3.186 | 3.308 | Not reported (a) | Not reported (a) | |
|
Southern EU Twofold application to winter oilseed rape, late application (March–May) |
0 h | 5.948 | – | 22.21 | – |
| 24 h | 5.805 | 5.877 | Not reported (a) | Not reported (a) | |
| 2 d | 5.795 | 5.839 | Not reported (a) | Not reported (a) | |
| 4 d | 5.775 | 5.812 | Not reported (a) | Not reported (a) | |
| 7 d | 5.745 | 5.790 | Not reported (a) | Not reported (a) | |
| 14 d | 5.675 | 5.750 | Not reported (a) | Not reported (a) | |
| 21 d | 5.605 | 5.713 | Not reported (a) | Not reported (a) | |
| 28 d | 5.537 | 5.678 | Not reported (a) | Not reported (a) | |
| 42 d | 5.403 | 5.608 | Not reported (a) | Not reported (a) | |
Only initial values are reported as worst‐case estimates of short‐term and long‐term exposure.
|
FOCUS STEP 1 Scenario |
Day after overall maximum | PECSW (μg/L) | PECSED (μg/kg) | ||
|---|---|---|---|---|---|
| Actual | TWA | Actual | TWA | ||
|
Single application to sunflowers |
0 h | 22.995 | – | 86.61 | – |
| 24 h | 22.644 | 22.820 | Not reported (a) | Not reported (a) | |
| 2 d | 22.605 | 22.722 | Not reported (a) | Not reported (a) | |
| 4 d | 22.526 | 22.644 | Not reported (a) | Not reported (a) | |
| 7 d | 22.408 | 22.568 | Not reported (a) | Not reported (a) | |
| 14 d | 22.134 | 22.419 | Not reported (a) | Not reported (a) | |
| 21 d | 21.864 | 22.279 | Not reported (a) | Not reported (a) | |
| 28 d | 21.598 | 22.142 | Not reported (a) | Not reported (a) | |
| 42 d | 21.074 | 21.873 | Not reported (a) | Not reported (a) | |
Only initial values are reported as worst‐case estimates of short‐term and long‐term exposure.
|
FOCUS STEP 2 Scenario |
Day after overall maximum | PECSW (μg/L) | PECSED (μg/kg) | ||
|---|---|---|---|---|---|
| Actual | TWA | Actual | TWA | ||
|
Northern EU Single application to sunflowers (March–May) |
0 h | 1.759 | – | 6.42 | – |
| 24 h | 1.679 | 1.719 | Not reported (a) | Not reported (a) | |
| 2 d | 1.677 | 1.699 | Not reported (a) | Not reported (a) | |
| 4 d | 1.671 | 1.686 | Not reported (a) | Not reported (a) | |
| 7 d | 1.662 | 1.678 | Not reported (a) | Not reported (a) | |
| 14 d | 1.642 | 1.665 | Not reported (a) | Not reported (a) | |
| 21 d | 1.622 | 1.654 | Not reported (a) | Not reported (a) | |
| 28 d | 1.602 | 1.643 | Not reported (a) | Not reported (a) | |
| 42 d | 1.563 | 1.623 | Not reported (a) | Not reported (a) | |
|
Southern EU Single application to sunflowers (March–May) |
0 h | 2.837 | – | 10.54 | – |
| 24 h | 2.755 | 2.796 | Not reported (a) | Not reported (a) | |
| 2 d | 2.750 | 2.774 | Not reported (a) | Not reported (a) | |
| 4 d | 2.741 | 2.760 | Not reported (a) | Not reported (a) | |
| 7 d | 2.726 | 2.749 | Not reported (a) | Not reported (a) | |
| 14 d | 2.693 | 2.729 | Not reported (a) | Not reported (a) | |
| 21 d | 2.660 | 2.712 | Not reported (a) | Not reported (a) | |
| 28 d | 2.628 | 2.695 | Not reported (a) | Not reported (a) | |
| 42 d | 2.564 | 2.662 | Not reported (a) | Not reported (a) | |
Only initial values are reported as worst‐case estimates of short‐term and long‐term exposure.
|
FOCUS STEP 2 Scenario |
Day after overall maximum | PECSW (μg/L) | PECSED (μg/kg) | ||
|---|---|---|---|---|---|
| Actual | TWA | Actual | TWA | ||
|
Northern EU Single application to sunflowers (June–September) |
0 h | 1.759 | – | 6.42 | – |
| 24 h | 1.679 | 1.719 | Not reported (a) | Not reported (a) | |
| 2 d | 1.677 | 1.699 | Not reported (a) | Not reported (a) | |
| 4 d | 1.671 | 1.686 | Not reported (a) | Not reported (a) | |
| 7 d | 1.662 | 1.678 | Not reported (a) | Not reported (a) | |
| 14 d | 1.642 | 1.665 | Not reported (a) | Not reported (a) | |
| 21 d | 1.622 | 1.654 | Not reported (a) | Not reported (a) | |
| 28 d | 1.602 | 1.643 | Not reported (a) | Not reported (a) | |
| 42 d | 1.563 | 1.623 | Not reported (a) | Not reported (a) | |
|
Southern EU Single application to sunflowers (June–September) |
0 h | 2.298 | – | 8.48 | – |
| 24 h | 2.217 | 2.258 | Not reported (a) | Not reported (a) | |
| 2 d | 2.213 | 2.237 | Not reported (a) | Not reported (a) | |
| 4 d | 2.206 | 2.223 | Not reported (a) | Not reported (a) | |
| 7 d | 2.194 | 2.213 | Not reported (a) | Not reported (a) | |
| 14 d | 2.167 | 2.197 | Not reported (a) | Not reported (a) | |
| 21 d | 2.141 | 2.183 | Not reported (a) | Not reported (a) | |
| 28 d | 2.115 | 2.169 | Not reported (a) | Not reported (a) | |
| 42 d | 2.064 | 2.142 | Not reported (a) | Not reported (a) | |
Only initial values are reported as worst‐case estimates of short‐term and long‐term exposure.
|
FOCUS STEP 3 and STEP 4 Scenario |
Water body | Day after overall maximum |
PECSW (μg/L) STEP 3 |
PECSW (μg/kg) STEP 4 10 m buffer (Drift + Runoff mitigation) |
PECSW (μg/kg) STEP 4 20 m buffer (Drift + Runoff mitigation) |
|||
|---|---|---|---|---|---|---|---|---|
| Actual | TWA | Actual | TWA | Actual | TWA | |||
| Single application to winter oilseed rape (early application) | D2, ditch | 0 h | 3.805 | – | 3.805 | – | 3.805 | – |
| 24 h | 0.641 | 3.376 | 0.641 | 3.376 | 0.641 | 3.376 | ||
| 2 d | 0.483 | 3.118 | 0.483 | 3.118 | 0.483 | 3.118 | ||
| 4 d | 0.417 | 2.743 | 0.417 | 2.743 | 0.417 | 2.743 | ||
| 7 d | 0.388 | 2.576 | 0.387 | 2.576 | 0.387 | 2.576 | ||
| 14 d | 0.335 | 2.291 | 0.334 | 2.291 | 0.334 | 2.291 | ||
| 21d | 0.301 | 2.204 | 0.300 | 2.203 | 0.299 | 2.203 | ||
| 28 d | 0.275 | 2.131 | 0.273 | 2.130 | 0.273 | 2.130 | ||
| 42 d | 0.238 | 2.069 | 0.235 | 2.068 | 0.235 | 2.068 | ||
| Single application to winter oilseed rape (early application) | D2, stream | 0 h | 2.671 | – | 2.671 | – | 2.671 | – |
| 24 h | 0.221 | 2.106 | 0.221 | 2.106 | 0.221 | 2.106 | ||
| 2 d | 0.199 | 1.833 | 0.199 | 1.833 | 0.199 | 1.833 | ||
| 4 d | 0.186 | 1.498 | 0.186 | 1.498 | 0.186 | 1.498 | ||
| 7 d | 0.184 | 1.292 | 0.184 | 1.292 | 0.184 | 1.292 | ||
| 14 d | 0.178 | 1.112 | 0.178 | 1.112 | 0.178 | 1.112 | ||
| 21 d | 0.174 | 1.052 | 0.174 | 1.051 | 0.174 | 1.051 | ||
| 28 d | 0.164 | 1.034 | 0.164 | 1.034 | 0.163 | 1.034 | ||
| 42 d | 0.132 | 0.982 | 0.131 | 0.982 | 0.131 | 0.982 | ||
| Single application to winter oilseed rape (early application) | D3, ditch | 0 h | 0.631 | – | 0.091 | – | 0.047 | – |
| 24 h | 0.114 | 0.391 | 0.016 | 0.056 | 0.008 | 0.029 | ||
| 2 d | 0.006 | 0.213 | 0.001 | 0.031 | 0.000 | 0.016 | ||
| 4 d | 0.001 | 0.107 | 0.000 | 0.015 | 0.000 | 0.008 | ||
| 7 d | 0.000 | 0.062 | 0.000 | 0.009 | 0.000 | 0.005 | ||
| 14 d | 0.000 | 0.031 | 0.000 | 0.004 | 0.000 | 0.002 | ||
| 21 d | 0.000 | 0.021 | 0.000 | 0.003 | 0.000 | 0.002 | ||
| 28 d | 0.000 | 0.015 | 0.000 | 0.002 | 0.000 | 0.001 | ||
| 42 d | 0.000 | 0.010 | 0.000 | 0.001 | 0.000 | 0.001 | ||
| Single application to winter oilseed rape (early application) | D4, pond | 0 h | 0.444 | – | 0.443 | – | 0.442 | – |
| 24 h | 0.444 | 0.444 | 0.443 | 0.443 | 0.442 | 0.442 | ||
| 2 d | 0.442 | 0.444 | 0.441 | 0.443 | 0.441 | 0.442 | ||
| 4 d | 0.438 | 0.443 | 0.437 | 0.442 | 0.437 | 0.442 | ||
| 7 d | 0.431 | 0.442 | 0.430 | 0.441 | 0.429 | 0.441 | ||
| 14 d | 0.411 | 0.438 | 0.410 | 0.437 | 0.409 | 0.436 | ||
| 21d | 0.391 | 0.431 | 0.390 | 0.430 | 0.390 | 0.430 | ||
| 28 d | 0.366 | 0.424 | 0.366 | 0.423 | 0.365 | 0.422 | ||
| 42 d | 0.326 | 0.407 | 0.325 | 0.406 | 0.325 | 0.406 | ||
| Single application to winter oilseed rape (early application) | D4, stream | 0 h | 0.494 | – | 0.455 | – | 0.455 | – |
| 24 h | 0.002 | 0.407 | 0.364 | 0.407 | 0.364 | 0.407 | ||
| 2 d | 0.002 | 0.376 | 0.322 | 0.376 | 0.322 | 0.376 | ||
| 4 d | 0.002 | 0.362 | 0.270 | 0.362 | 0.270 | 0.362 | ||
| 7 d | 0.002 | 0.341 | 0.309 | 0.341 | 0.309 | 0.341 | ||
| 14 d | 0.002 | 0.325 | 0.216 | 0.325 | 0.216 | 0.325 | ||
| 21 d | 0.002 | 0.293 | 0.112 | 0.293 | 0.112 | 0.293 | ||
| 28 d | 0.002 | 0.250 | 0.064 | 0.250 | 0.064 | 0.250 | ||
| 42 d | 0.003 | 0.186 | 0.040 | 0.186 | 0.040 | 0.186 | ||
| Single application to winter oilseed rape (early application) | D5, pond | 0 h | 0.244 | – | 0.243 | – | 0.242 | – |
| 24 h | 0.243 | 0.243 | 0.242 | 0.243 | 0.242 | 0.242 | ||
| 2 d | 0.242 | 0.243 | 0.242 | 0.243 | 0.241 | 0.242 | ||
| 4 d | 0.240 | 0.243 | 0.239 | 0.242 | 0.239 | 0.242 | ||
| 7 d | 0.236 | 0.242 | 0.235 | 0.241 | 0.235 | 0.241 | ||
| 14 d | 0.227 | 0.238 | 0.226 | 0.238 | 0.226 | 0.237 | ||
| 21 d | 0.219 | 0.234 | 0.218 | 0.234 | 0.217 | 0.233 | ||
| 28 d | 0.211 | 0.230 | 0.211 | 0.230 | 0.210 | 0.229 | ||
| 42 d | 0.197 | 0.223 | 0.196 | 0.222 | 0.196 | 0.222 | ||
| Single application to winter oilseed rape (early application) | D5, stream | 0 h | 0.505 | – | 0.189 | – | 0.189 | – |
| 24 h | 0.044 | 0.153 | 0.146 | 0.153 | 0.146 | 0.153 | ||
| 2 d | 0.042 | 0.149 | 0.103 | 0.149 | 0.103 | 0.149 | ||
| 4 d | 0.038 | 0.142 | 0.124 | 0.142 | 0.124 | 0.142 | ||
| 7 d | 0.034 | 0.129 | 0.072 | 0.129 | 0.072 | 0.129 | ||
| 14 d | 0.037 | 0.104 | 0.055 | 0.104 | 0.055 | 0.104 | ||
| 21d | 0.033 | 0.083 | 0.038 | 0.083 | 0.038 | 0.083 | ||
| 28 d | 0.031 | 0.070 | 0.042 | 0.070 | 0.042 | 0.070 | ||
| 42 d | 0.026 | 0.058 | 0.032 | 0.058 | 0.032 | 0.058 | ||
| Single application to winter oilseed rape (early application) | R1, pond | 0 h | 0.040 | – | 0.019 | – | 0.011 | – |
| 24 h | 0.039 | 0.039 | 0.018 | 0.019 | 0.010 | 0.011 | ||
| 2 d | 0.039 | 0.039 | 0.018 | 0.018 | 0.010 | 0.010 | ||
| 4 d | 0.038 | 0.039 | 0.018 | 0.018 | 0.010 | 0.010 | ||
| 7 d | 0.037 | 0.038 | 0.017 | 0.018 | 0.010 | 0.010 | ||
| 14 d | 0.034 | 0.037 | 0.016 | 0.017 | 0.009 | 0.010 | ||
| 21 d | 0.032 | 0.036 | 0.015 | 0.017 | 0.009 | 0.010 | ||
| 28 d | 0.030 | 0.034 | 0.014 | 0.016 | 0.008 | 0.009 | ||
| 42 d | 0.027 | 0.032 | 0.013 | 0.015 | 0.007 | 0.009 | ||
| Single application to winter oilseed rape (early application) | R1 stream | 0 h | 0.892 | – | 0.390 | – | 0.201 | – |
| 24 h | 0.001 | 0.285 | 0.000 | 0.124 | 0.000 | 0.063 | ||
| 2 d | 0.000 | 0.143 | 0.000 | 0.062 | 0.000 | 0.032 | ||
| 4 d | 0.000 | 0.072 | 0.000 | 0.031 | 0.000 | 0.016 | ||
| 7 d | 0.000 | 0.041 | 0.000 | 0.018 | 0.000 | 0.009 | ||
| 14 d | 0.000 | 0.023 | 0.000 | 0.009 | 0.000 | 0.005 | ||
| 21 d | 0.000 | 0.015 | 0.000 | 0.006 | 0.000 | 0.003 | ||
| 28 d | 0.000 | 0.012 | 0.000 | 0.005 | 0.000 | 0.002 | ||
| 42 d | 0.000 | 0.008 | 0.000 | 0.003 | 0.000 | 0.002 | ||
| Single application to winter oilseed rape (early application) | R3, stream | 0 h | 0.989 | – | 0.437 | – | 0.227 | – |
| 24 h | 0.005 | 0.475 | 0.002 | 0.207 | 0.001 | 0.107 | ||
| 2 d | 0.001 | 0.240 | 0.001 | 0.105 | 0.000 | 0.054 | ||
| 4 d | 0.000 | 0.120 | 0.000 | 0.052 | 0.000 | 0.027 | ||
| 7 d | 0.000 | 0.069 | 0.000 | 0.030 | 0.000 | 0.015 | ||
| 14 d | 0.000 | 0.050 | 0.000 | 0.018 | 0.000 | 0.009 | ||
| 21d | 0.000 | 0.033 | 0.000 | 0.012 | 0.000 | 0.006 | ||
| 28 d | 0.000 | 0.025 | 0.000 | 0.009 | 0.000 | 0.005 | ||
| 42 d | 0.000 | 0.017 | 0.000 | 0.006 | 0.000 | 0.003 | ||
|
FOCUS STEP 3 and STEP 4 Scenario |
Water body | Day after overall maximum |
PECSW (μg/L) STEP 3 |
PECSW (μg/kg) STEP 4 10 m buffer (Drift + Run‐off mitigation) |
PECSW (μg/kg) STEP 4 20 m buffer (Drift + Run‐off mitigation) |
|||
| Actual | TWA | Actual | TWA | Actual | TWA | |||
| Twofold application to winter oilseed rape (early application) | D2, ditch | 0 h | 8.174 | – | 8.174 | – | 8.174 | – |
| 24 h | 5.914 | 7.138 | 5.914 | 7.138 | 5.914 | 7.138 | ||
| 2 d | 4.271 | 6.157 | 4.271 | 6.157 | 4.271 | 6.157 | ||
| 4 d | 3.491 | 4.979 | 3.491 | 4.979 | 3.491 | 4.979 | ||
| 7 d | 3.216 | 4.287 | 3.216 | 4.287 | 3.216 | 4.287 | ||
| 14 d | 2.772 | 3.838 | 2.771 | 3.837 | 2.771 | 3.837 | ||
| 21d | 4.397 | 3.554 | 4.397 | 3.554 | 4.397 | 3.554 | ||
| 28 d | 3.504 | 3.616 | 3.503 | 3.616 | 3.503 | 3.616 | ||
| 42 d | 2.724 | 3.475 | 2.723 | 3.474 | 2.723 | 3.474 | ||
| Twofold application to winter oilseed rape (early application) | D2, stream | 0 h | 5.129 | – | 5.129 | – | 5.129 | – |
| 24 h | 3.445 | 4.385 | 3.445 | 4.385 | 3.445 | 4.385 | ||
| 2 d | 2.388 | 3.475 | 2.388 | 3.475 | 2.388 | 3.475 | ||
| 4 d | 1.363 | 2.607 | 1.363 | 2.607 | 1.363 | 2.607 | ||
| 7 d | 1.341 | 2.177 | 1.341 | 2.177 | 1.341 | 2.177 | ||
| 14 d | 1.265 | 2.071 | 1.264 | 2.071 | 1.264 | 2.071 | ||
| 21 d | 1.533 | 1.914 | 1.533 | 1.914 | 1.533 | 1.914 | ||
| 28 d | 1.478 | 1.820 | 1.478 | 1.820 | 1.478 | 1.820 | ||
| 42 d | 1.241 | 1.657 | 1.241 | 1.657 | 1.241 | 1.657 | ||
| Twofold application to winter oilseed rape (early application) | D3, ditch | 0 h | 0.552 | – | 0.074 | – | 0.038 | – |
| 24 h | 0.172 | 0.388 | 0.023 | 0.052 | 0.012 | 0.027 | ||
| 2 d | 0.013 | 0.225 | 0.002 | 0.030 | 0.001 | 0.015 | ||
| 4 d | 0.001 | 0.114 | 0.000 | 0.015 | 0.000 | 0.008 | ||
| 7 d | 0.000 | 0.066 | 0.000 | 0.009 | 0.000 | 0.004 | ||
| 14 d | 0.000 | 0.033 | 0.000 | 0.004 | 0.000 | 0.002 | ||
| 21 d | 0.000 | 0.022 | 0.000 | 0.003 | 0.000 | 0.002 | ||
| 28 d | 0.000 | 0.016 | 0.000 | 0.002 | 0.000 | 0.001 | ||
| 42 d | 0.000 | 0.020 | 0.000 | 0.003 | 0.000 | 0.001 | ||
| Twofold application to winter oilseed rape (early application) | D4, pond | 0 h | 0.917 | – | 0.915 | – | 0.914 | – |
| 24 h | 0.916 | 0.916 | 0.914 | 0.915 | 0.913 | 0.914 | ||
| 2 d | 0.913 | 0.916 | 0.911 | 0.914 | 0.911 | 0.914 | ||
| 4 d | 0.905 | 0.915 | 0.903 | 0.914 | 0.903 | 0.913 | ||
| 7 d | 0.889 | 0.914 | 0.888 | 0.912 | 0.887 | 0.911 | ||
| 14 d | 0.848 | 0.905 | 0.847 | 0.903 | 0.846 | 0.902 | ||
| 21d | 0.807 | 0.891 | 0.806 | 0.889 | 0.805 | 0.888 | ||
| 28 d | 0.757 | 0.875 | 0.755 | 0.874 | 0.755 | 0.873 | ||
| 42 d | 0.673 | 0.841 | 0.672 | 0.839 | 0.671 | 0.839 | ||
| Twofold application to winter oilseed rape (early application) | D4, stream | 0 h | 0.947 | – | 0.947 | – | 0.947 | – |
| 24 h | 0.766 | 0.851 | 0.766 | 0.851 | 0.766 | 0.851 | ||
| 2 d | 0.682 | 0.790 | 0.682 | 0.790 | 0.682 | 0.790 | ||
| 4 d | 0.575 | 0.759 | 0.575 | 0.759 | 0.575 | 0.759 | ||
| 7 d | 0.642 | 0.718 | 0.642 | 0.718 | 0.642 | 0.718 | ||
| 14 d | 0.427 | 0.678 | 0.427 | 0.678 | 0.427 | 0.678 | ||
| 21 d | 0.223 | 0.605 | 0.223 | 0.605 | 0.223 | 0.605 | ||
| 28 d | 0.131 | 0.514 | 0.131 | 0.514 | 0.131 | 0.514 | ||
| 42 d | 0.080 | 0.382 | 0.080 | 0.382 | 0.080 | 0.382 | ||
| Twofold application to winter oilseed rape (early application) | D5, pond | 0 h | 0.513 | – | 0.512 | – | 0.511 | – |
| 24 h | 0.512 | 0.513 | 0.511 | 0.512 | 0.510 | 0.511 | ||
| 2 d | 0.510 | 0.513 | 0.509 | 0.511 | 0.508 | 0.511 | ||
| 4 d | 0.506 | 0.512 | 0.504 | 0.510 | 0.503 | 0.510 | ||
| 7 d | 0.497 | 0.509 | 0.496 | 0.508 | 0.495 | 0.507 | ||
| 14 d | 0.478 | 0.502 | 0.477 | 0.501 | 0.476 | 0.500 | ||
| 21 d | 0.461 | 0.494 | 0.460 | 0.493 | 0.459 | 0.492 | ||
| 28 d | 0.446 | 0.486 | 0.445 | 0.485 | 0.443 | 0.484 | ||
| 42 d | 0.416 | 0.470 | 0.415 | 0.469 | 0.414 | 0.468 | ||
| Twofold application to winter oilseed rape (early application) | D5, stream | 0 h | 0.512 | – | 0.397 | – | 0.397 | – |
| 24 h | 0.067 | 0.320 | 0.321 | 0.320 | 0.321 | 0.320 | ||
| 2 d | 0.065 | 0.313 | 0.241 | 0.313 | 0.241 | 0.313 | ||
| 4 d | 0.061 | 0.298 | 0.180 | 0.298 | 0.180 | 0.298 | ||
| 7 d | 0.054 | 0.270 | 0.118 | 0.270 | 0.118 | 0.270 | ||
| 14 d | 0.058 | 0.218 | 0.072 | 0.218 | 0.072 | 0.218 | ||
| 21d | 0.072 | 0.176 | 0.051 | 0.176 | 0.051 | 0.176 | ||
| 28 d | 0.069 | 0.148 | 0.038 | 0.148 | 0.038 | 0.148 | ||
| 42 d | 0.038 | 0.123 | 0.067 | 0.123 | 0.067 | 0.123 | ||
| Twofold application to winter oilseed rape (early application) | R1, pond | 0 h | 0.083 | – | 0.037 | – | 0.020 | – |
| 24 h | 0.081 | 0.082 | 0.037 | 0.037 | 0.020 | 0.020 | ||
| 2 d | 0.081 | 0.082 | 0.036 | 0.037 | 0.020 | 0.020 | ||
| 4 d | 0.079 | 0.081 | 0.036 | 0.036 | 0.019 | 0.020 | ||
| 7 d | 0.077 | 0.079 | 0.035 | 0.036 | 0.019 | 0.020 | ||
| 14 d | 0.072 | 0.077 | 0.032 | 0.035 | 0.018 | 0.019 | ||
| 21 d | 0.068 | 0.075 | 0.031 | 0.034 | 0.017 | 0.018 | ||
| 28 d | 0.064 | 0.072 | 0.029 | 0.033 | 0.016 | 0.018 | ||
| 42 d | 0.057 | 0.068 | 0.026 | 0.031 | 0.014 | 0.017 | ||
| Twofold application to winter oilseed rape (early application) | R1 stream | 0 h | 1.634 | – | 0.715 | – | 0.369 | – |
| 24 h | 0.001 | 0.523 | 0.000 | 0.226 | 0.000 | 0.116 | ||
| 2 d | 0.000 | 0.262 | 0.000 | 0.113 | 0.000 | 0.058 | ||
| 4 d | 0.000 | 0.131 | 0.000 | 0.057 | 0.000 | 0.029 | ||
| 7 d | 0.000 | 0.077 | 0.000 | 0.034 | 0.000 | 0.017 | ||
| 14 d | 0.000 | 0.053 | 0.000 | 0.023 | 0.000 | 0.012 | ||
| 21 d | 0.000 | 0.035 | 0.000 | 0.015 | 0.000 | 0.008 | ||
| 28 d | 0.000 | 0.033 | 0.000 | 0.014 | 0.000 | 0.007 | ||
| 42 d | 0.000 | 0.031 | 0.000 | 0.013 | 0.000 | 0.007 | ||
| Twofold application to winter oilseed rape (early application) | R3, stream | 0 h | 0.989 | – | 0.437 | – | 0.227 | – |
| 24 h | 0.005 | 0.569 | 0.002 | 0.262 | 0.001 | 0.137 | ||
| 2 d | 0.001 | 0.294 | 0.001 | 0.135 | 0.000 | 0.071 | ||
| 4 d | 0.000 | 0.148 | 0.000 | 0.068 | 0.000 | 0.036 | ||
| 7 d | 0.000 | 0.085 | 0.000 | 0.039 | 0.000 | 0.020 | ||
| 14 d | 0.000 | 0.048 | 0.000 | 0.021 | 0.000 | 0.011 | ||
| 21d | 0.000 | 0.032 | 0.000 | 0.014 | 0.000 | 0.007 | ||
| 28 d | 0.000 | 0.024 | 0.000 | 0.011 | 0.000 | 0.006 | ||
| 42 d | 0.000 | 0.026 | 0.000 | 0.012 | 0.000 | 0.006 |
|
FOCUS STEP 3 and STEP 4 Scenario |
Water body | Day after overall maximum | PECSW (μg/L) STEP 3 |
PECSW (μg/kg) STEP 4 10 m buffer (Drift + Run‐off mitigation) |
PECSW (μg/kg) STEP 4 20 m buffer (Drift + Run‐off mitigation) |
|||
|---|---|---|---|---|---|---|---|---|
| Actual | TWA | Actual | TWA | Actual | TWA | |||
| Single application to winter oilseed rape (late application) | D2, ditch | 0 h | 2.060 | – | 2.060 | – | 2.060 | – |
| 24 h | 0.501 | 1.440 | 0.500 | 1.440 | 0.500 | 1.440 | ||
| 2 d | 1.516 | 1.297 | 1.516 | 1.297 | 1.516 | 1.297 | ||
| 4 d | 0.390 | 1.142 | 0.389 | 1.142 | 0.389 | 1.142 | ||
| 7 d | 0.347 | 1.156 | 0.346 | 1.155 | 0.346 | 1.155 | ||
| 14 d | 0.905 | 1.120 | 0.904 | 1.120 | 0.904 | 1.120 | ||
| 21d | 1.369 | 1.051 | 1.369 | 1.051 | 1.369 | 1.051 | ||
| 28 d | 0.971 | 1.009 | 0.971 | 1.009 | 0.971 | 1.009 | ||
| 42 d | 0.755 | 0.918 | 0.754 | 0.918 | 0.754 | 0.918 | ||
| Single application to winter oilseed rape (late application) | D2, stream | 0 h | 1.289 | – | 1.289 | – | 1.289 | – |
| 24 h | 0.143 | 0.828 | 0.143 | 0.828 | 0.143 | 0.828 | ||
| 2 d | 0.834 | 0.759 | 0.834 | 0.759 | 0.834 | 0.759 | ||
| 4 d | 0.146 | 0.675 | 0.146 | 0.675 | 0.146 | 0.675 | ||
| 7 d | 0.224 | 0.662 | 0.224 | 0.662 | 0.224 | 0.662 | ||
| 14 d | 0.454 | 0.656 | 0.454 | 0.656 | 0.454 | 0.656 | ||
| 21 d | 0.782 | 0.615 | 0.782 | 0.615 | 0.782 | 0.615 | ||
| 28 d | 0.616 | 0.585 | 0.616 | 0.585 | 0.616 | 0.585 | ||
| 42 d | 0.456 | 0.536 | 0.456 | 0.536 | 0.456 | 0.536 | ||
| Single application to winter oilseed rape (late application) | D3, ditch | 0 h | 0.635 | – | 0.091 | – | 0.047 | – |
| 24 h | 0.394 | 0.527 | 0.057 | 0.076 | 0.029 | 0.039 | ||
| 2 d | 0.101 | 0.377 | 0.015 | 0.054 | 0.008 | 0.028 | ||
| 4 d | 0.006 | 0.204 | 0.001 | 0.029 | 0.000 | 0.015 | ||
| 7 d | 0.001 | 0.118 | 0.000 | 0.017 | 0.000 | 0.009 | ||
| 14 d | 0.000 | 0.059 | 0.000 | 0.009 | 0.000 | 0.004 | ||
| 21 d | 0.000 | 0.040 | 0.000 | 0.006 | 0.000 | 0.003 | ||
| 28 d | 0.000 | 0.030 | 0.000 | 0.004 | 0.000 | 0.002 | ||
| 42 d | 0.000 | 0.020 | 0.000 | 0.003 | 0.000 | 0.001 | ||
| Single application to winter oilseed rape (late application) | D4, pond | 0 h | 0.309 | – | 0.307 | – | 0.306 | – |
| 24 h | 0.309 | 0.309 | 0.307 | 0.307 | 0.306 | 0.306 | ||
| 2 d | 0.308 | 0.309 | 0.306 | 0.307 | 0.305 | 0.306 | ||
| 4 d | 0.305 | 0.309 | 0.303 | 0.307 | 0.302 | 0.306 | ||
| 7 d | 0.299 | 0.308 | 0.298 | 0.306 | 0.297 | 0.305 | ||
| 14 d | 0.285 | 0.305 | 0.284 | 0.303 | 0.283 | 0.302 | ||
| 21d | 0.272 | 0.300 | 0.270 | 0.299 | 0.269 | 0.298 | ||
| 28 d | 0.255 | 0.295 | 0.253 | 0.293 | 0.253 | 0.292 | ||
| 42 d | 0.227 | 0.283 | 0.226 | 0.282 | 0.225 | 0.281 | ||
| Single application to winter oilseed rape (late application) | D4, stream | 0 h | 0.534 | – | 0.309 | – | 0.309 | – |
| 24 h | 0.001 | 0.275 | 0.245 | 0.275 | 0.245 | 0.275 | ||
| 2 d | 0.000 | 0.254 | 0.216 | 0.254 | 0.216 | 0.254 | ||
| 4 d | 0.000 | 0.244 | 0.180 | 0.244 | 0.180 | 0.244 | ||
| 7 d | 0.000 | 0.229 | 0.213 | 0.229 | 0.213 | 0.229 | ||
| 14 d | 0.000 | 0.222 | 0.155 | 0.222 | 0.155 | 0.222 | ||
| 21 d | 0.000 | 0.202 | 0.079 | 0.202 | 0.079 | 0.202 | ||
| 28 d | 0.000 | 0.173 | 0.045 | 0.173 | 0.045 | 0.173 | ||
| 42 d | 0.000 | 0.129 | 0.029 | 0.129 | 0.029 | 0.129 | ||
| Single application to winter oilseed rape (late application) | D5, pond | 0 h | 0.201 | – | 0.200 | – | 0.199 | – |
| 24 h | 0.201 | 0.201 | 0.200 | 0.200 | 0.199 | 0.199 | ||
| 2 d | 0.200 | 0.201 | 0.199 | 0.200 | 0.198 | 0.199 | ||
| 4 d | 0.199 | 0.201 | 0.198 | 0.199 | 0.197 | 0.199 | ||
| 7 d | 0.197 | 0.200 | 0.196 | 0.199 | 0.195 | 0.198 | ||
| 14 d | 0.191 | 0.198 | 0.190 | 0.197 | 0.189 | 0.196 | ||
| 21 d | 0.186 | 0.196 | 0.184 | 0.195 | 0.184 | 0.194 | ||
| 28 d | 0.180 | 0.193 | 0.179 | 0.192 | 0.179 | 0.192 | ||
| 42 d | 0.177 | 0.189 | 0.176 | 0.188 | 0.176 | 0.187 | ||
| Single application to winter oilseed rape (late application) | D5, stream | 0 h | 0.591 | – | 0.198 | – | 0.198 | – |
| 24 h | 0.005 | 0.226 | 0.163 | 0.164 | 0.163 | 0.164 | ||
| 2 d | 0.001 | 0.158 | 0.125 | 0.158 | 0.125 | 0.158 | ||
| 4 d | 0.000 | 0.142 | 0.141 | 0.142 | 0.141 | 0.142 | ||
| 7 d | 0.000 | 0.–35 | 0.095 | 0.135 | 0.095 | 0.135 | ||
| 14 d | 0.000 | 0.112 | 0.077 | 0.112 | 0.077 | 0.112 | ||
| 21d | 0.000 | 0.098 | 0.059 | 0.098 | 0.059 | 0.098 | ||
| 28 d | 0.000 | 0.089 | 0.066 | 0.089 | 0.066 | 0.089 | ||
| 42 d | 0.000 | 0.080 | 0.052 | 0.080 | 0.052 | 0.080 | ||
| Single application to winter oilseed rape (late application) | R1, pond | 0 h | 0.129 | – | 0.055 | – | 0.029 | – |
| 24 h | 0.127 | 0.128 | 0.055 | 0.055 | 0.029 | 0.029 | ||
| 2 d | 0.126 | 0.127 | 0.054 | 0.055 | 0.029 | 0.029 | ||
| 4 d | 0.123 | 0.126 | 0.053 | 0.054 | 0.028 | 0.029 | ||
| 7 d | 0.120 | 0.124 | 0.051 | 0.053 | 0.027 | 0.028 | ||
| 14 d | 0.112 | 0.120 | 0.048 | 0.052 | 0.025 | 0.027 | ||
| 21 d | 0.105 | 0.116 | 0.045 | 0.050 | 0.024 | 0.026 | ||
| 28 d | 0.101 | 0.113 | 0.043 | 0.049 | 0.023 | 0.026 | ||
| 42 d | 0.091 | 0.113 | 0.039 | 0.049 | 0.021 | 0.026 | ||
| Single application to winter oilseed rape (late application) | R1 stream | 0 h | 1.247 | – | 0.566 | – | 0.296 | – |
| 24 h | 0.002 | 0.668 | 0.001 | 0.303 | 0.001 | 0.159 | ||
| 2 d | 0.001 | 0.335 | 0.000 | 0.152 | 0.000 | 0.080 | ||
| 4 d | 0.005 | 0.168 | 0.000 | 0.076 | 0.000 | 0.040 | ||
| 7 d | 0.001 | 0.142 | 0.001 | 0.064 | 0.000 | 0.033 | ||
| 14 d | 0.105 | 0.097 | 0.004 | 0.044 | 0.002 | 0.023 | ||
| 21 d | 0.000 | 0.078 | 0.000 | 0.035 | 0.000 | 0.018 | ||
| 28 d | 0.000 | 0.060 | 0.000 | 0.026 | 0.000 | 0.014 | ||
| 42 d | 0.000 | 0.045 | 0.000 | 0.020 | 0.000 | 0.011 | ||
| Single application to winter oilseed rape (late application) | R3, stream | 0 h | 0.589 | – | 0.191 | – | 0.100 | – |
| 24 h | 0.002 | 0.341 | 0.072 | 0.157 | 0.039 | 0.083 | ||
| 2 d | 0.000 | 0.276 | 0.032 | 0.127 | 0.017 | 0.067 | ||
| 4 d | 0.000 | 0.171 | 0.000 | 0.079 | 0.000 | 0.042 | ||
| 7 d | 0.000 | 0.098 | 0.000 | 0.045 | 0.000 | 0.024 | ||
| 14 d | 0.000 | 0.058 | 0.000 | 0.027 | 0.000 | 0.014 | ||
| 21d | 0.000 | 0.038 | 0.000 | 0.018 | 0.000 | 0.009 | ||
| 28 d | 0.000 | 0.029 | 0.000 | 0.013 | 0.000 | 0.007 | ||
| 42 d | 0.000 | 0.019 | 0.003 | 0.009 | 0.002 | 0.005 |
|
FOCUS STEP 3 and STEP 4 Scenario |
Water body | Day after overall maximum | PECSW (μg/L) STEP 3 |
PECSW (μg/kg) STEP 4 10 m buffer (Drift + Runoff mitigation) |
PECSW (μg/kg) STEP 4 20 m buffer (Drift + Runoff mitigation) |
|||
|---|---|---|---|---|---|---|---|---|
| Actual | TWA | Actual | TWA | Actual | TWA | |||
| Twofold application to winter oilseed rape (late application) | D2, ditch | 0 h | 6.392 | – | 6.392 | – | 6.392 | – |
| 24 h | 1.690 | 4.102 | 1.689 | 4.102 | 1.689 | 4.102 | ||
| 2 d | 1.459 | 3.309 | 1.457 | 3.309 | 1.457 | 3.309 | ||
| 4 d | 1.236 | 3.257 | 1.233 | 3.257 | 1.232 | 3.257 | ||
| 7 d | 1.121 | 3.022 | 1.115 | 3.022 | 1.115 | 3.022 | ||
| 14 d | 0.947 | 2.855 | 0.938 | 2.855 | 0.937 | 2.855 | ||
| 21d | 0.833 | 2.718 | 0.821 | 2.718 | 0.820 | 2.718 | ||
| 28 d | 0.750 | 2.688 | 0.736 | 2.687 | 0.735 | 2.687 | ||
| 42 d | 2.169 | 2.496 | 2.168 | 2.496 | 2.168 | 2.496 | ||
| Twofold application to winter oilseed rape (late application) | D2, stream | 0 h | 3.995 | – | 3.995 | – | 3.995 | – |
| 24 h | 0.328 | 2.237 | 0.328 | 2.237 | 0.328 | 2.237 | ||
| 2 d | 0.299 | 1.980 | 0.299 | 1.980 | 0.299 | 1.980 | ||
| 4 d | 0.296 | 1.784 | 0.296 | 1.784 | 0.296 | 1.784 | ||
| 7 d | 0.300 | 1.760 | 0.299 | 1.760 | 0.299 | 1.760 | ||
| 14 d | 0.296 | 1.601 | 0.293 | 1.601 | 0.293 | 1.601 | ||
| 21 d | 0.279 | 1.562 | 0.275 | 1.562 | 0.274 | 1.562 | ||
| 28 d | 0.253 | 1.518 | 0.248 | 1.518 | 0.247 | 1.518 | ||
| 42 d | 0.969 | 1.430 | 0.969 | 1.430 | 0.969 | 1.430 | ||
| Twofold application to winter oilseed rape (late application) | D3, ditch | 0 h | 0.555 | – | 0.075 | – | 0.038 | – |
| 24 h | 0.344 | 0.461 | 0.046 | 0.062 | 0.024 | 0.032 | ||
| 2 d | 0.089 | 0.330 | 0.012 | 0.044 | 0.006 | 0.023 | ||
| 4 d | 0.005 | 0.178 | 0.001 | 0.024 | 0.000 | 0.012 | ||
| 7 d | 0.001 | 0.103 | 0.000 | 0.014 | 0.000 | 0.007 | ||
| 14 d | 0.000 | 0.052 | 0.000 | 0.007 | 0.000 | 0.004 | ||
| 21 d | 0.000 | 0.035 | 0.000 | 0.005 | 0.000 | 0.002 | ||
| 28 d | 0.000 | 0.026 | 0.000 | 0.003 | 0.000 | 0.002 | ||
| 42 d | 0.000 | 0.031 | 0.000 | 0.004 | 0.000 | 0.002 | ||
| Twofold application to winter oilseed rape (late application) | D4, pond | 0 h | 0.705 | – | 0.702 | – | 0.701 | – |
| 24 h | 0.704 | 0.705 | 0.701 | 0.702 | 0.700 | 0.701 | ||
| 2 d | 0.702 | 0.704 | 0.699 | 0.702 | 0.698 | 0.700 | ||
| 4 d | 0.696 | 0.704 | 0.693 | 0.701 | 0.692 | 0.700 | ||
| 7 d | 0.684 | 0.702 | 0.681 | 0.700 | 0.680 | 0.698 | ||
| 14 d | 0.652 | 0.695 | 0.649 | 0.693 | 0.648 | 0.691 | ||
| 21d | 0.621 | 0.685 | 0.618 | 0.682 | 0.617 | 0.681 | ||
| 28 d | 0.582 | 0.673 | 0.580 | 0.670 | 0.579 | 0.669 | ||
| 42 d | 0.518 | 0.646 | 0.516 | 0.644 | 0.515 | 0.643 | ||
| Twofold application to winter oilseed rape (late application) | D4, stream | 0 h | 0.714 | – | 0.714 | – | 0.714 | – |
| 24 h | 0.572 | 0.639 | 0.572 | 0.639 | 0.572 | 0.639 | ||
| 2 d | 0.507 | 0.591 | 0.507 | 0.591 | 0.507 | 0.591 | ||
| 4 d | 0.427 | 0.567 | 0.427 | 0.567 | 0.427 | 0.567 | ||
| 7 d | 0.498 | 0.536 | 0.498 | 0.536 | 0.498 | 0.536 | ||
| 14 d | 0.338 | 0.515 | 0.338 | 0.515 | 0.338 | 0.515 | ||
| 21 d | 0.173 | 0.463 | 0.173 | 0.463 | 0.173 | 0.463 | ||
| 28 d | 0.101 | 0.394 | 0.101 | 0.394 | 0.101 | 0.394 | ||
| 42 d | 0.064 | 0.293 | 0.064 | 0.293 | 0.064 | 0.293 | ||
| Twofold application to winter oilseed rape (late application) | D5, pond | 0 h | 0.434 | – | 0.432 | – | 0.431 | – |
| 24 h | 0.433 | 0.434 | 0.431 | 0.432 | 0.430 | 0.431 | ||
| 2 d | 0.432 | 0.434 | 0.430 | 0.432 | 0.429 | 0.431 | ||
| 4 d | 0.429 | 0.433 | 0.427 | 0.431 | 0.426 | 0.430 | ||
| 7 d | 0.423 | 0.432 | 0.421 | 0.430 | 0.420 | 0.429 | ||
| 14 d | 0.409 | 0.427 | 0.407 | 0.425 | 0.406 | 0.424 | ||
| 21 d | 0.396 | 0.421 | 0.394 | 0.419 | 0.393 | 0.418 | ||
| 28 d | 0.384 | 0.415 | 0.382 | 0.413 | 0.381 | 0.412 | ||
| 42 d | 0.369 | 0.404 | 0.368 | 0.402 | 0.367 | 0.401 | ||
| Twofold application to winter oilseed rape (late application) | D5, stream | 0 h | 0.530 | – | 0.356 | – | 0.356 | – |
| 24 h | 0.037 | 0.291 | 0.289 | 0.291 | 0.289 | 0.291 | ||
| 2 d | 0.030 | 0.279 | 0.220 | 0.279 | 0.220 | 0.279 | ||
| 4 d | 0.011 | 0.251 | 0.248 | 0.251 | 0.248 | 0.251 | ||
| 7 d | 0.001 | 0.236 | 0.165 | 0.236 | 0.165 | 0.236 | ||
| 14 d | 0.000 | 0.196 | 0.131 | 0.196 | 0.131 | 0.196 | ||
| 21d | 0.000 | 0.170 | 0.101 | 0.170 | 0.101 | 0.170 | ||
| 28 d | 0.000 | 0.154 | 0.111 | 0.154 | 0.111 | 0.154 | ||
| 42 d | 0.000 | 0.137 | 0.090 | 0.137 | 0.090 | 0.137 | ||
| Twofold application to winter oilseed rape (late application) | R1, pond | 0 h | 0.203 | – | 0.087 | – | 0.046 | – |
| 24 h | 0.199 | 0.201 | 0.085 | 0.086 | 0.045 | 0.046 | ||
| 2 d | 0.196 | 0.199 | 0.084 | 0.086 | 0.044 | 0.045 | ||
| 4 d | 0.192 | 0.197 | 0.082 | 0.084 | 0.043 | 0.045 | ||
| 7 d | 0.185 | 0.193 | 0.080 | 0.083 | 0.042 | 0.044 | ||
| 14 d | 0.173 | 0.186 | 0.074 | 0.080 | 0.039 | 0.042 | ||
| 21 d | 0.161 | 0.180 | 0.069 | 0.077 | 0.037 | 0.041 | ||
| 28 d | 0.162 | 0.176 | 0.070 | 0.076 | 0.037 | 0.040 | ||
| 42 d | 0.156 | 0.169 | 0.067 | 0.072 | 0.035 | 0.038 | ||
| Twofold application to winter oilseed rape (late application) | R1 stream | 0 h | 1.259 | – | 0.573 | – | 0.300 | – |
| 24 h | 0.003 | 1.024 | 0.001 | 0.467 | 0.001 | 0.245 | ||
| 2 d | 0.001 | 0.516 | 0.001 | 0.236 | 0.000 | 0.124 | ||
| 4 d | 0.000 | 0.259 | 0.000 | 0.118 | 0.000 | 0.062 | ||
| 7 d | 0.000 | 0.148 | 0.000 | 0.068 | 0.000 | 0.035 | ||
| 14 d | 0.000 | 0.074 | 0.000 | 0.034 | 0.000 | 0.018 | ||
| 21 d | 0.000 | 0.057 | 0.000 | 0.026 | 0.000 | 0.013 | ||
| 28 d | 0.000 | 0.057 | 0.000 | 0.025 | 0.000 | 0.013 | ||
| 42 d | 0.000 | 0.051 | 0.000 | 0.022 | 0.000 | 0.012 | ||
| Twofold application to winter oilseed rape (late application) | R3, stream | 0 h | 1.510 | – | 0.688 | – | 0.361 | – |
| 24 h | 0.016 | 1.013 | 0.007 | 0.466 | 0.004 | 0.245 | ||
| 2 d | 0.003 | 0.520 | 0.002 | 0.239 | 0.001 | 0.126 | ||
| 4 d | 0.001 | 0.261 | 0.000 | 0.120 | 0.000 | 0.063 | ||
| 7 d | 0.000 | 0.173 | 0.000 | 0.077 | 0.000 | 0.040 | ||
| 14 d | 0.000 | 0.097 | 0.000 | 0.040 | 0.000 | 0.021 | ||
| 21d | 0.000 | 0.065 | 0.000 | 0.028 | 0.000 | 0.015 | ||
| 28 d | 0.000 | 0.050 | 0.000 | 0.021 | 0.000 | 0.011 | ||
| 42 d | 0.000 | 0.044 | 0.000 | 0.017 | 0.000 | 0.009 | ||
|
FOCUS STEP 3 and STEP 4 Scenario |
Water body | Day after overall maximum | PECSW (μg/L) STEP 3 |
PECSW (μg/kg) STEP 4 10 m buffer (Drift + Runoff mitigation) |
PECSW (μg/kg) STEP 4 20 m buffer (Drift + Runoff mitigation) |
|||
|---|---|---|---|---|---|---|---|---|
| Actual | TWA | Actual | TWA | Actual | TWA | |||
| Single application to sunflower | D5, pond | 0 h | 0.193 | – | 0.191 | – | 0.190 | – |
| 24 h | 0.192 | 0.193 | 0.191 | 0.191 | 0.190 | 0.190 | ||
| 2 d | 0.192 | 0.193 | 0.190 | 0.191 | 0.189 | 0.190 | ||
| 4 d | 0.189 | 0.192 | 0.188 | 0.191 | 0.187 | 0.190 | ||
| 7 d | 0.186 | 0.191 | 0.184 | 0.189 | 0.183 | 0.189 | ||
| 14 d | 0.178 | 0.188 | 0.177 | 0.186 | 0.176 | 0.185 | ||
| 21 d | 0.171 | 0.184 | 0.170 | 0.183 | 0.169 | 0.182 | ||
| 28 d | 0.166 | 0.181 | 0.164 | 0.180 | 0.163 | 0.179 | ||
| 42 d | 0.155 | 0.175 | 0.154 | 0.174 | 0.153 | 0.173 | ||
| Single application to sunflower | D5, stream | 0 h | 0.513 | – | 0.229 | – | 0.229 | – |
| 24 h | 0.004 | 0.196 | 0.185 | 0.187 | 0.185 | 0.187 | ||
| 2 d | 0.001 | 0.181 | 0.131 | 0.181 | 0.131 | 0.181 | ||
| 4 d | 0.000 | 0.157 | 0.149 | 0.157 | 0.149 | 0.157 | ||
| 7 d | 0.000 | 0.144 | 0.080 | 0.144 | 0.080 | 0.144 | ||
| 14 d | 0.000 | 0.107 | 0.048 | 0.107 | 0.048 | 0.107 | ||
| 21d | 0.000 | 0.084 | 0.027 | 0.084 | 0.027 | 0.084 | ||
| 28 d | 0.000 | 0.071 | 0.029 | 0.071 | 0.029 | 0.071 | ||
| 42 d | 0.000 | 0.056 | 0.020 | 0.056 | 0.020 | 0.056 | ||
| Single application to sunflower | R1, pond | 0 h | 0.278 | – | 0.117 | – | 0.061 | – |
| 24 h | 0.274 | 0.276 | 0.116 | 0.116 | 0.060 | 0.060 | ||
| 2 d | 0.271 | 0.274 | 0.114 | 0.116 | 0.059 | 0.060 | ||
| 4 d | 0.265 | 0.271 | 0.112 | 0.114 | 0.058 | 0.059 | ||
| 7 d | 0.256 | 0.267 | 0.108 | 0.113 | 0.056 | 0.058 | ||
| 14 d | 0.239 | 0.261 | 0.101 | 0.110 | 0.052 | 0.057 | ||
| 21 d | 0.223 | 0.258 | 0.094 | 0.109 | 0.049 | 0.056 | ||
| 28 d | 0.210 | 0.252 | 0.088 | 0.106 | 0.046 | 0.055 | ||
| 42 d | 0.185 | 0.239 | 0.078 | 0.101 | 0.040 | 0.052 | ||
| Single application to sunflower | R1 stream | 0 h | 1.167 | – | 0.528 | – | 0.276 | – |
| 24 h | 0.002 | 0.836 | 0.001 | 0.382 | 0.001 | 0.201 | ||
| 2 d | 0.001 | 0.512 | 0.000 | 0.231 | 0.000 | 0.120 | ||
| 4 d | 0.780 | 0.345 | 0.306 | 0.154 | 0.151 | 0.080 | ||
| 7 d | 0.006 | 0.279 | 0.003 | 0.125 | 0.001 | 0.065 | ||
| 14 d | 0.000 | 0.145 | 0.000 | 0.064 | 0.000 | 0.033 | ||
| 21 d | 0.000 | 0.116 | 0.000 | 0.051 | 0.000 | 0.027 | ||
| 28 d | 0.000 | 0.087 | 0.000 | 0.038 | 0.000 | 0.020 | ||
| 42 d | 0.000 | 0.058 | 0.000 | 0.026 | 0.000 | 0.013 | ||
| Single application to sunflower | R3, stream | 0 h | 0.865 | – | 0.394 | – | 0.207 | – |
| 24 h | 0.010 | 0.716 | 0.005 | 0.329 | 0.002 | 0.173 | ||
| 2 d | 0.003 | 0.383 | 0.001 | 0.176 | 0.001 | 0.093 | ||
| 4 d | 0.001 | 0.192 | 0.000 | 0.088 | 0.000 | 0.047 | ||
| 7 d | 0.628 | 0.110 | 0.286 | 0.051 | 0.150 | 0.027 | ||
| 14 d | 0.000 | 0.095 | 0.000 | 0.044 | 0.000 | 0.023 | ||
| 21d | 0.001 | 0.080 | 0.000 | 0.037 | 0.000 | 0.019 | ||
| 28 d | 0.001 | 0.068 | 0.000 | 0.031 | 0.000 | 0.017 | ||
| 42 d | 0.000 | 0.050 | 0.000 | 0.023 | 0.000 | 0.012 | ||
| Single application to sunflower | R4, stream | 0 h | 1.283 | – | 0.584 | – | 0.306 | – |
| 24 h | 0.003 | 1.009 | 0.009 | 0.460 | 0.005 | 0.241 | ||
| 2 d | 0.001 | 0.508 | 0.001 | 0.231 | 0.000 | 0.121 | ||
| 4 d | 0.000 | 0.255 | 0.000 | 0.116 | 0.000 | 0.061 | ||
| 7 d | 0.000 | 0.146 | 0.000 | 0.066 | 0.000 | 0.035 | ||
| 14 d | 0.000 | 0.112 | 0.000 | 0.051 | 0.000 | 0.027 | ||
| 21d | 0.187 | 0.089 | 0.085 | 0.040 | 0.045 | 0.021 | ||
| 28 d | 0.000 | 0.075 | 0.001 | 0.034 | 0.000 | 0.018 | ||
| 42 d | 0.000 | 0.051 | 0.000 | 0.023 | 0.000 | 0.012 | ||
|
FOCUS STEP 3 Scenario |
Waterbody | Maximum PECSED (μg/kg) STEP 3 (a) |
|---|---|---|
| Single application to winter oilseed rape (early application) | D2, ditch | 9.626 |
| D2, stream | 5.288 | |
| D3, ditch | 0.183 | |
| D4, pond | 1.895 | |
| D4, stream | 0.712 | |
| D5, pond | 1.515 | |
| D5, stream | 0.336 | |
| R1, pond | 0.162 | |
| R1, stream | 0.185 | |
| R3, stream | 0.271 |
Only maximum values at STEP 3 are reported as worst‐case estimates of short‐term and long‐term exposure.
|
FOCUS STEP 3 Scenario |
Waterbody | Maximum PECSED (μg/kg) STEP 3 (a) |
|---|---|---|
| Twofold application to winter oilseed rape (early application) | D2, ditch | 17.850 |
| D2, stream | 9.660 | |
| D3, ditch | 0.203 | |
| D4, pond | 3.818 | |
| D4, stream | 1.437 | |
| D5, pond | 3.132 | |
| D5, stream | 0.698 | |
| R1, pond | 0.390 | |
| R1, stream | 0.509 | |
| R3, stream | 0.310 |
Only maximum values at STEP 3 are reported as worst‐case estimates of short‐term and long‐term exposure.
|
FOCUS STEP 3 Scenario |
Waterbody | Maximum PECSED (μg/kg) STEP 3 (a) |
|---|---|---|
| Single application to winter oilseed rape (late application) | D2, ditch | 5.623 |
| D2, stream | 3.067 | |
| D3, ditch | 0.267 | |
| D4, pond | 1.352 | |
| D4, stream | 0.501 | |
| D5, pond | 1.597 | |
| D5, stream | 0.345 | |
| R1, pond | 0.519 | |
| R1, stream | 0.481 | |
| R3, stream | 0.273 |
Only maximum values at STEP 3 are reported as worst‐case estimates of short‐term and long‐term exposure.
|
FOCUS STEP 3 Scenario |
Waterbody | Maximum PECSED (μg/kg) STEP 3 (a) |
|---|---|---|
| Twofold application to winter oilseed rape (late application) | D2, ditch | 12.550 |
| D2, stream | 7.234 | |
| D3, ditch | 0.268 | |
| D4, pond | 2.984 | |
| D4, stream | 1.119 | |
| D5, pond | 3.016 | |
| D5, stream | 0.657 | |
| R1, pond | 0.776 | |
| R1, stream | 0.758 | |
| R3, stream | 0.617 |
Only maximum values at STEP 3 are reported as worst‐case estimates of short‐term and long‐term exposure.
|
FOCUS STEP 3 Scenario |
Waterbody | Maximum PECSED (μg/kg) STEP 3 (a) |
|---|---|---|
| Single application to sunflower | D5, pond | 1.298 |
| D5, stream | 0.271 | |
| R1, pond | 0.965 | |
| R1, stream | 0.972 | |
| R3, stream | 0.553 | |
| R4, stream | 0.511 |
Only maximum values at STEP 3 are reported as worst‐case estimates of short‐term and long‐term exposure.
| FOCUS STEP 1 | Single application | Twofold application | ||
|---|---|---|---|---|
| Max. PECSW (μg/L) (a) | Max. PECSED (μg/kg) (a) | Max. PECSW (μg/L) (a) | Max. PECSED (μg/kg) (a) | |
| Winter oilseed rape | 5.69 | 0.41 | 11.38 | 0.82 |
| Sunflowers | 5.69 | 0.41 | Not applicable | Not applicable |
: Only initial values are reported as worst‐case estimates of short‐term and long‐term exposure.
| FOCUS STEP 2 | Single application | Twofold application | ||
|---|---|---|---|---|
| Max. PECSW (μg/L) (a) | Max. PECSED (μg/kg) (a) | Max. PECSW (μg/L) (a) | Max. PECSED (μg/kg) (a) | |
| Northern EU | ||||
| Winter oilseed rape, early application (October–February) | 0.65 | 0.05 | 0.81 | 0.06 |
| Winter oilseed rape, late application (March–May) | 0.27 | 0.02 | 0.35 | 0.03 |
| Sunflowers (March–May) | 0.23 | 0.02 | Not applicable | Not applicable |
| Sunflowers (June–September) | 0.23 | 0.02 | Not applicable | Not applicable |
| Southern EU | ||||
| Winter oilseed rape, early application (October–February) | 0.52 | 0.04 | 0.65 | 0.05 |
| Winter oilseed rape, late application (March–May) | 0.52 | 0.04 | 0.65 | 0.05 |
| Sunflowers (March–May) | 0.44 | 0.03 | Not applicable | Not applicable |
| Sunflowers (June–September) | 0.34 | 0.02 | Not applicable | Not applicable |
: Only initial values are reported as worst‐case estimates of short‐term and long‐term exposure.
| FOCUS STEP 1 | Single application | Twofold application | ||
|---|---|---|---|---|
| Max. PECSW (μg/L) (a) | Max. PECSED (μg/kg) (a) | Max. PECSW (μg/L) (a) | Max. PECSED (μg/kg) (a) | |
| Winter oilseed rape | 6.84 | 0.61 | 13.68 | 1.22 |
| Sunflowers | 6.84 | 0.61 | Not applicable | Not applicable |
Only initial values are reported as worst‐case estimates of short‐term and long‐term exposure.
| FOCUS STEP 2 | Single application | Twofold application | ||
|---|---|---|---|---|
| Max. PECSW (μg/L) (a) | Max. PECSED (μg/kg) (a) | Max. PECSW (μg/L) (a) | Max. PECSED (μg/kg) (a) | |
| Northern EU | ||||
| Winter oilseed rape, early application (October–February) | 1.02 | 0.09 | 1.77 | 0.16 |
| Winter oilseed rape, late application (March–May) | 0.43 | 0.04 | 0.75 | 0.07 |
| Sunflowers (March–May) | 0.37 | 0.03 | Not applicable | Not applicable |
| Sunflowers (June–September) | 0.37 | 0.03 | Not applicable | Not applicable |
| Southern EU | ||||
| Winter oilseed rape, early application (October–February) | 0.82 | 0.07 | 1.43 | 0.13 |
| Winter oilseed rape, late application (March–May) | 0.82 | 0.07 | 1.43 | 0.13 |
| Sunflowers (March–May) | 0.69 | 0.06 | Not applicable | Not applicable |
| Sunflowers (June–September) | 0.53 | 0.05 | Not applicable | Not applicable |
Only initial values are reported as worst‐case estimates of short‐term and long‐term exposure.
| FOCUS STEP 1 | Single application | Twofold application | ||
|---|---|---|---|---|
| Max. PECSW (μg/L) (a) | Max. PECSED (μg/kg) (a) | Max. PECSW (μg/L) (a) | Max. PECSED (μg/kg) (a) | |
| Winter oilseed rape | 7.46 | 1.29 | 14.93 | 2.58 |
| Sunflowers | 7.46 | 1.29 | Not applicable | Not applicable |
Only initial values are reported as worst‐case estimates of short‐term and long‐term exposure.
| FOCUS STEP 2 | Single application | Twofold application | ||
|---|---|---|---|---|
| Max. PECSW (μg/L) (a) | Max. PECSED (μg/kg) (a) | Max. PECSW (μg/L) (a) | Max. PECSED (μg/kg) (a) | |
| Northern EU | ||||
| Winter oilseed rape, early application (October–February) | 1.13 | 0.20 | 2.00 | 0.35 |
| Winter oilseed rape, late application (March–May) | 0.49 | 0.08 | 0.87 | 0.15 |
| Sunflowers (March–May) | 0.42 | 0.07 | Not applicable | Not applicable |
| Sunflowers (June–September) | 0.42 | 0.07 | Not applicable | Not applicable |
| Southern EU | ||||
| Winter oilseed rape, early application (October–February) | 0.92 | 0.16 | 1.62 | 0.28 |
| Winter oilseed rape, late application (March–May) | 0.92 | 0.16 | 1.62 | 0.28 |
| Sunflowers (March–May) | 0.78 | 0.13 | Not applicable | Not applicable |
| Sunflowers (June–September) | 0.60 | 0.10 | Not applicable | Not applicable |
Only initial values are reported as worst‐case estimates of short‐term and long‐term exposure.
| FOCUS STEP 1 | Single application | Twofold application | ||
|---|---|---|---|---|
| Max. PECSW (μg/L) (a) | Max. PECSED (μg/kg) (a) | Max. PECSW (μg/L) (a) | Max. PECSED (μg/kg) (a) | |
| Winter oilseed rape | 2.22 | 0.00 | 4.44 | 0.00 |
| Sunflowers | 2.22 | 0.00 | Not applicable | Not applicable |
Only initial values are reported as worst‐case estimates of short‐term and long‐term exposure.
| FOCUS STEP 2 | Single application | Twofold application | ||
|---|---|---|---|---|
| Max. PECSW (μg/L) (a) | Max. PECSED (μg/kg) (a) | Max. PECSW (μg/L) (a) | Max. PECSED (μg/kg) (a) | |
| Northern EU | ||||
| Winter oilseed rape, early application (October–February) | 0.38 | 0.00 | 0.69 | 0.00 |
| Winter oilseed rape, late application (March–May) | 0.19 | 0.00 | 0.34 | 0.00 |
| Sunflowers (March–May) | 0.16 | 0.00 | Not applicable | Not applicable |
| Sunflowers (June–September) | 0.16 | 0.00 | Not applicable | Not applicable |
| Southern EU | ||||
| Winter oilseed rape, early application (October–February) | 0.31 | 0.00 | 0.57 | 0.00 |
| Winter oilseed rape, late application (March–May) | 0.31 | 0.00 | 0.57 | 0.00 |
| Sunflowers (March–May) | 0.27 | 0.00 | Not applicable | Not applicable |
| Sunflowers (June–September) | 0.22 | 0.00 | Not applicable | Not applicable |
Only initial values are reported as worst‐case estimates of short‐term and long‐term exposure.
Estimation of concentrations from other routes of exposure (Regulation (EU) N° 284/2013, Annex Part A, point 9.4)

Ecotoxicology
Effects on birds and other terrestrial vertebrates (Regulation (EU) N° 283/2013, Annex Part A, point 8.1 and Regulation (EU) N° 284/2013, Annex Part A, point 10.1)
| Species | Test substance | Timescale | End point | Toxicity (mg/kg bw per day) |
|---|---|---|---|---|
| Birds | ||||
| Colinus virginianus | Dimoxystrobin | Acute | LD50 | > 2,000 |
| LD50 extrapolated | 3,776 | |||
| Colinus virginianus | BAS 540 01 F | Acute | LD50 | > 2,000 |
| Colinus virginianus | Dimoxystrobin | Short term | LC50 | > 1,043 |
| Anas platyrhynchos | Dimoxystrobin | Short term | LC50 | > 232 |
| Colinus virginianus | Dimoxystrobin | Long term | NOAEL | 77 |
| Anas platyrhynchos | Dimoxystrobin | Long term | NOAEL | 36 |
| Mammals | ||||
| Rattus | Dimoxystrobin | Acute | LD50 | > 5,000 |
| Rattus | BAS 540 01 F | Acute | LD50 | > 300 |
| Rattus | Dimoxystrobin | Long term (two generation) | NOAEL | 12 |
|
Endocrine‐disrupting properties (Annex Part A, points 8.1.5). Specific information on the ED properties of dimoxystrobin for non‐target organisms is not available. A preliminary assessment of the available XETA test in line with OECD TG 248 was available. For details, please refer to the ED assessment in Vol 1. Additional higher tier studies (Annex Part A, points 10.1.1.2): A number of residue decline studies were submitted for the refinement of the birds & mammals section. Further information can be found in Vol 3 B9 CP (Section B.9.2.2.1). Terrestrial vertebrate wildlife (birds, mammals, reptile and amphibians) (Annex Part A, points 8.1.4, 10.1.3): See information in Vol 3 B9 CA, B.9.1.4. |
Toxicity/exposure ratios for terrestrial vertebrates (Regulation (EU) N° 284/2013, Part A, Annex point 10.1)
Oilseed rape at 100 g a.s./ha × 2 applications; interval of 28 d
Sunflower at 100 g a.s./ha × 1 application
| Growth stage | Indicator or focal species | Timescale | DDD (mg/kg bw per day) | TER | Trigger |
|---|---|---|---|---|---|
| Screening Step (Birds) | |||||
| Oilseed rape | Small omnivorous bird | Acute | 17.47 | 216.2 | 10 |
| Oilseed rape | Small omnivorous bird | Long term | 3.78 | 9.5 | 5 |
| Sunflower | Small omnivorous bird | Acute | 15.88 | 237.8 | 10 |
| Sunflower | Small omnivorous bird | Long term | 3.43 | 10.5 | 5 |
| Screening Step (Birds) 0.56 kg formulation/ha using a measured LD50 for BAS 540 01 F | |||||
| Oilseed rape | Small omnivorous bird | Acute | 97.82 | > 20.4 | 10 |
| Sunflower | Small omnivorous bird | Acute | 88.93 | > 22.5 | 10 |
| Screening Step (Mammals) | |||||
| Oilseed rape | Small herbivorous mammal | Acute | 13.02 | > 383.9 | 10 |
| Oilseed rape | Small herbivorous mammal | Long term | 2.82 | 4.26 | 5 |
| Sunflower | Small herbivorous mammal | Acute | 11.84 | > 422.3 | 10 |
| Sunflower | Small herbivorous mammal | Long term | 2.56 | 4.69 | 5 |
| Tier 1 (Mammals) – long term | |||||
| Oilseed rape BBCH 10–29 | Small omnivorous mammal ‘mouse’ | Long term | 0.46 | 26.09 | 5 |
| Oilseed rape BBCH ≥20 | Small insectivorous mammal ‘shrew’ | Long term | 0.11 | 109.1 | 5 |
| Oilseed rape BBCH 30–39 | Small omnivorous mammal ‘mouse’ | Long term | 0.13 | 92.31 | 5 |
| Oilseed rape BBCH ≥40 | Small herbivorous mammal ‘vole’ | Long term | 1.06 | 11.32 | 5 |
| Oilseed rape BBCH ≥40 | Small omnivorous mammal ‘mouse’ | Long term | 0.11 | 109.1 | 5 |
| Oilseed rape All season | Large herbivorous mammal ‘lagomorph’ | Long term | 0.83 | 14.46 | 5 |
| Sunflower BBCH ≥20 | Small insectivorous mammal ‘shrew’ | Long term | 0.1 | 120 | 5 |
| Sunflower BBCH ≥40 | Large herbivorous mammal ‘lagomorph’ | Long term | 0.19 | 63.16 | 5 |
| Sunflower BBCH ≥40 | Small herbivorous mammal ‘vole’ | Long term | 0.96 | 12.5 | 5 |
| Sunflower BBCH ≥40 | Small omnivorous mammal ‘mouse’ | Long term | 0.1 | 120 | 5 |
Higher tier (Mammals): Not required.
| Risk from bioaccumulation and food chain behaviour | ||||
|---|---|---|---|---|
| Indicator or focal species | Time scale | DDD (mg/kg bw per day) | TER | Trigger |
| Earthworm‐eating birds | Long‐term | 0.394 | 91.4 | 5 |
| Earthworm‐eating mammals | Long‐term | 0.481 | 25.0 | 5 |
| Fish‐eating birds | Long‐term | 0.116 | 310.3 | 5 |
| Fish‐eating mammals | Long‐term | 0.104 | 115.4 | 5 |
|
Risk from consumption of contaminated water Puddle scenario, Screening step TER calculations are not needed, since the ratio ‘application rate (g a.s./ha)/relevant endpoint’ is below the trigger of 50 (Koc = 382.5) Birds (oilseed rape): ratio acute = 0.05, ratio (long term) = 5.11 Mammals (oilseed rape): ratio acute = < 0.04, ratio (long term) = 15.3 |
| Scenario | Indicator or focal species | Timescale | DDD (mg/kg bw per day) | TER | Trigger |
|---|---|---|---|---|---|
| Puddle scenario | Birds | Acute | – | – | 10 |
| Puddle scenario | Mammals | Acute | – | – | 10 |
| Puddle scenario | Birds | Long term | – | – | 5 |
| Puddle scenario | Mammals | Long term | – | – | 5 |
Toxicity data for all aquatic tested species (Regulation (EU) N° 283/2013, Annex Part A, points 8.2 and Regulation (EU) N° 284/2013 Annex Part A, point 10.2)
| Group | Test substance | Timescale (test type) | End point | Toxicity1 (mg/L) |
|---|---|---|---|---|
| Laboratory tests | ||||
| Fish | ||||
| Oncorhynchus mykiss | dimoxystrobin | Acute 96 h (static) | Mortality, LC50 | 0.0434 (mm) |
| O. mykiss | dimoxystrobin | Acute 96 h (flow‐through) | Mortality, LC50 | 0.0465 (nom) |
| O. mykiss | BAS 540 01 F2 | Acute 96 h (static) | Mortality, LC50 |
0.0512(nom, as) 0.288(nom, pr) |
| O. mykiss | BAS 540 00 F3,7 | Acute 96 h (static) | Mortality, LC50 |
0.0402(nom, as) 0.220(nom, pr) |
| O. mykiss | 505M01 | Acute 96 h (static) | Mortality, LC50 | > 100 (nom) |
| O. mykiss | 505M08 | Acute 96 h (static) | Mortality, LC50 | > 100 (nom) |
| O. mykiss | 505M09 | Acute 96 h (static) | Mortality, LC50 | > 100 (nom) |
| O. mykiss | 505M96 | Acute 96 h (static) | Mortality, LC50 | > 100 (nom) |
| O. mykiss | Dimoxystrobin | Chronic 28 d (flow‐through) | Mortality and sub‐lethal effects (toxic symptoms), NOEC | 0.010(nom) |
| Pimephales promelas (ELS study) | Dimoxystrobin | Chronic 36 d (flow‐through) | Mortality, and sublethal effects (wet weight), NOEC | 0.008 (nom) |
| Cyprinodon variegatus | Dimoxystrobin | Acute 96 h (flow‐through) | Mortality, LC50 | 0.167 (mm) |
| Cyprinus carpio | BAS 507 00 F4 | Acute 96 h (static) | Mortality, LC50 | 0.0392 (mm, as) |
| Danio rerio | BAS 507 00 F | Acute 96 h (static) | Mortality, LC50 |
0.0259(nom, as) 0.210(nom, pr) |
| Lepomis macrochirus | Dimoxystrobin | Acute 96 h (flow‐through) | Mortality, LC50 | 0.0546 (nom) |
| L. macrochirus | BAS 507 00 F | Acute 96 h (static) | Mortality, LC50 | 0.0646(mm, as) |
| Leuciscus idus melanotus | BAS 505 01 F5 | Acute 96 h (static) | Mortality, LC50 |
0.0238 (nom, as) 0.147(nom, pr) |
| O. mykiss | BAS 507 00 F | Acute 96 h (static) | Mortality, LC50 |
> 0.0181 < 0.0264 0.02196 (nom, as) > 0.147 < 0.215 0.1786 (nom, pr) |
| O. mykiss | BAS 505 01 F | Acute 96 h (static) | Mortality, LC50 |
> 0.0238 < 0.0347 0.02886 (nom, as) > 0.147 < 0.215 0.1786 (nom, pr) |
| Pimephales promelas | BAS 507 00 F | Acute 96 h (static) | Mortality, LC50 |
0.0185(nom, as) 0.15(nom, pr) |
| O. mykiss (modified ELS with variable exposure) | Dimoxystrobin |
Chronic 69 d (flow‐through) Pulsed exposure study |
Mortality, NOEC |
0.012(nom) (based on peak conc.) |
| L. idus melanotus (ELS study in outdoor microcosms, including sediment) | BAS 505 01 F | 66 d (flow‐through) | Mortality, NOEC |
0.015(nom, as) 0.092(nom, pr) |
| Aquatic invertebrates | ||||
| Daphnia magna | Dimoxystrobin | Acute 48 h (static) | Immobility, EC50 | 0.0394 (nom) |
| D. magna | 505M01 | Acute 48 h (static) | Immobility, EC50 | > 100 (nom) |
| D. magna | 505M08 | Acute 48 h (static) | Immobility, EC50 | > 100 (nom) |
| D. magna | 505M09 | Acute 48 h (static) | Immobility, EC50 | > 100 (nom) |
| D. magna | 505M96 | Acute 48 h (static) | Immobility, EC50 | > 100 (nom) |
| D. magna | BAS 540 01 F | Acute 48 h (static) | Immobility, EC50 |
0.044(nom, as) 0.243 (nom, pr) |
| D. magna | BAS 540 00 F | Acute 48 h (static) | Immobility, EC50 |
0.038(nom, as) 0.21 (nom, pr) |
| D. magna | Dimoxystrobin | Chronic 21 d (semi‐static) | Reproduction, NOEC | 0.0125 (nom) |
| Asellus aquaticus | Dimoxystrobin | Acute 96 h (static) | Mortality, LC50 | 0.269 (nom) |
| Americamysis bahia (former name: Mysidopsis bahia) | Dimoxystrobin | Acute 96 h (flow‐through) | Mortality, LC50 | 0.0272 (nom) |
| Crassostrea virginica | Dimoxystrobin | Acute 96 h (flow‐through) |
Shell growth and toxic symptoms, EC50 Mortality, LC50 |
0.00892 (nom) > 0.025 (nom) |
| Sediment‐dwelling organisms | ||||
| Chironomus riparius (spiked water study) | Dimoxystrobin | Chronic 28 d (flow‐through) | Emergence rate, NOEC | 0.0044 (mm) |
| Algae | ||||
| Pseudokirchneriella subcapitata | Dimoxystrobin | 96 h (static) |
Growth rate, ErC50 ErC10 Biomass, EbC50 EbC10 |
0.153(nom) 0.0133(nom) 0.017(nom) 0.0035(nom) |
| P. subcapitata | 505M01 | 72 h (static) |
Growth rate, ErC50 Biomass, EbC50 |
> 100 (nom) > 100(nom) |
| P. subcapitata | 505M08 | 72 h (static) |
Growth rate, ErC50 ErC10 Biomass, EbC50 EbC10 |
> 100 (nom) > 100(nom) > 100(nom) 47.5(nom) |
| P. subcapitata | 505M09 | 72 h (static) |
Growth rate, ErC50 ErC10 Biomass, EbC50 EbC10 |
> 100 (nom) > 100(nom) > 100(nom) > 100(nom) |
| P. subcapitata | 505M96 | 72 h (static) |
Growth rate, ErC50 ErC10 Biomass, EbC50 EbC10 |
43.6 (nom) 14.5(nom) 21.5(nom) 12.4(nom) |
| P. subcapitata | BAS 540 01 F | 72 h (static) |
Growth rate, ErC50 Biomass, EyC50 |
0.093(nom, as) (0.519(nom, pr)) 0.019(nom, as) (0.106(nom, pr)) |
| P. subcapitata | BAS 540 00 F | 72 h (static) |
Growth rate, ErC50 Biomass, EbC50 |
0.047(nom, as) (0.264(nom, pr)) 0.013(nom, as) (0.07(nom, pr)) |
| Navicula pelliculosa | Dimoxystrobin | 72 h (static) |
Growth rate, ErC50 ErC10 Biomass, EbC50 |
0.0078 (mm) 0.0008(nom) 0.0025(mm) |
| Anabaena flos‐aquae | Dimoxystrobin | 72 h (static) |
Growth rate, ErC50 ErC10 Biomass, EbC50 |
> 2.06(mm) 0.543(mm) 0.96(mm) |
| Skeletonema costatum | Dimoxystrobin | 120 h (static) |
Growth rate, ErC50 Biomass, EbC50 |
> 4.31(mm) > 4.31(mm) |
| Macrophytes | ||||
| Lemna gibba | Dimoxystrobin | 14 d (static) | EC50 | No reliable data available, not required |
| Mesocosm | ||||
| Outdoor mesocosm | BAS 505 01 F9 | approx. 5 months, single application |
NOEAEC (D. Longispina) |
0.0017(nom, as) 0.01(nom, pr) |
| NOEC | n.d. | |||
| Bioconcentration | ||||
| O. mykiss (bioconcentration study) | Dimoxystrobin | 35 d exposure and 14 d depuration period (flow‐through) |
BCFSSL (wholefish) |
106 |
|
Further testing on aquatic organisms Potential endocrine‐disrupting properties (Annex Part A, point 8.2.3) The available information in the data set provided very limited information for the EAS‐modalities since ED‐mediated parameters were not investigated in those studies but only sensitive parameters. Further information is required to finalise the ED assessment. For the T‐modality only preliminary results of the XETA (OECD TG 248) were available. The results of this test were negative for thyroid activity. Therefore, dimoxystrobin does not meet the ED criteria for the T‐modality for non‐target organisms since the T‐mediated endocrine activity was sufficiently investigated and was negative. For details, please refer to the ED assessment in Vol 1. | ||||
(nom) nominal concentration; (mm) mean measured concentration; n.d.: not determined
Study was conducted with the formulated product BAS 540 01 F (suspension concentrate formulation containing 200 g dimoxystrobin/L and 200 g boscalid/L, nominally; new representative formulated product).
Study was conducted with the formulation BAS 540 00 F (a minor change formulation of BAS 540 01 F, which differs only in the preservative used).
Study was conducted with the formulated product BAS 507 00 F (suspension concentrate formulation containing 133 g dimoxystrobin/L and 50 g epoxiconazole/L, nominally; former representative formulated product during Annex I inclusion process for dimoxystrobin). Epoxiconazole does not have significant influence on toxicity (dimoxystrobin being the single driver with > 99.5% TU) within the formulation BAS 507 00 F.
Study was conducted with the solo‐formulation BAS 505 01 F (containing 167 g dimoxystrobin/L, nominally).
Interpolated value (geometric mean) with corresponding LC0 (>) and LC100 (<)
Study is not considered fully reliable due to some deviations with respect to the recommendations of the test guideline.
Study is not considered fully reliable because it cannot be excluded that the sensitive life stages were not exposed adequately.
This endpoint is not considered protective of species with a longer reproductive cycle.
Bioconcentration in fish (Annex Part A, point 8.2.2.3)
| Active substance | Metabolite 505M01 | Metabolite 505M08 | Metabolite 505M09 | Metabolite 505M96 | |
|---|---|---|---|---|---|
| logPO/W | 3.59 | 0.79 | 0.64 (pH 7) | 0.87 (pH 7) | No data available |
|
Steady‐state bioconcentration factor (BCF) 1 (total wet weight/normalised to 6% lipid content) |
106 | No BCF study required | No BCF study required | No BCF study required | No BCF study required |
|
Uptake/depuration kinetics BCF (total wet weight/normalised to 5% lipid content) |
|||||
| Annex VI Trigger for the bioconcentration factor | |||||
| Clearance time (days) (CT50) | 0.5 | ||||
| (CT90) | 1.6 | ||||
| Level and nature of residues (%) in organisms after the 14 day depuration phase | < 2.5% | ||||
|
Higher tier study Not provided, not required | |||||
Based on total 14C or on specific compounds.
PEC/RAC ratios for the most sensitive aquatic organisms (Regulation (EU) N° 284/2013, Annex Part A, point 10.2)
FOCUS sw steps 1–3 – PEC/RAC ratios for dimoxystrobin – winter oilseed rape at 100 g a.s./ha one or two applications
| Scenario | PECsw global max (μg/L)3 | Fish acute | Fish chronic | Aquatic invertebrates acute | Aquatic invertebrates chronic | Algae | Higher plant | Sed. dweller chronic | Higher tier, Geomean | Higher tier, pulse exposure test | Microcosm/Mesocosm |
|---|---|---|---|---|---|---|---|---|---|---|---|
| O. mykiss | P. promelas | C. virginica | D. magna | N. pelliculosa | L. gibba | C. riparius | Fish, acute (4 species) | Fish, chronic, O. mykiss | D. longispina | ||
| LC50 | NOEC | EC50 | NOEC | ErC50 | ErC50 | NOEC | geomean LC50 | NOEC | NOEAEC | ||
| 46.5 μg/L | 8 μg/L | 8.92 μg/L | 12.5 μg/L | 7.8 μg/L | No reliable data available | 4.42 μg/L | 56.4 μg/L | 12 μg/L1 | 1.7 μg/L2 | ||
| AF | 100 | 10 | 100 | 10 | 10 | 10 | 10 | 100 | – | – | |
| RAC (μg/L) | 0.465 | 0.8 | 0.0892 | 1.25 | 0.78 | – | 0.442 | 0.564 | – | – | |
| FOCUS Step 1 | 45.99 | 98.903 | 57.488 | 515.583 | 36.792 | 58.962 | 104.050 | 81.543 | |||
| FOCUS Step 2 | |||||||||||
| North/South Europe | 7.14 | 15.355 | 8.925 | 80.045 | 5.712 | 9.154 | 16.154 | 12.660 | |||
| FOCUS Step 3 | |||||||||||
| D2/ditch | 8.174 | 17.578 | 10.218 | 91.637 | 6.539 | 10.479 | 18.493 | 14.493 | |||
| D2/stream | 5.129 | 11.030 | 6.411 | 57.500 | 4.103 | 6.576 | 11.604 | 9.094 | |||
| D3/ditch | 0.635 | 1.366 | 0.794 | 7.119 | 0.508 | 0.814 | 1.437 | 1.126 | |||
| D4/pond | 0.917 | 1.972 | 1.146 | 10.280 | 0.734 | 1.176 | 2.075 | 1.626 | |||
| D4/stream | 0.947 | 2.037 | 1.184 | 10.617 | 0.758 | 1.214 | 2.143 | 1.679 | |||
| D5/pond | 0.513 | 1.103 | 0.641 | 5.751 | 0.410 | 0.658 | 1.161 | 0.910 | |||
| D5/stream | 0.591 | 1.271 | 0.739 | 6.625 | 0.473 | 0.758 | 1. 337 | 1.048 | |||
| R1/pond | 0.203 | 0.437 | 0.254 | 2.276 | 0.162 | 0.260 | 0.459 | 0.360 | |||
| R1/stream | 1.634 | 3.514 | 2.043 | 18.318 | 1.307 | 2.095 | 3.697 | 2.897 | |||
| R3/stream | 1.510 | 3.247 | 1.888 | 16.928 | 1.208 | 1.936 | 3.416 | 2.677 |
AF: Assessment factor; PEC: Predicted environmental concentration; RAC: Regulatory acceptable concentration; PEC/RAC ratios above the relevant trigger of 1 are shown in bold.
Study is not considered fully reliable because it cannot be excluded that the sensitive life stages were not exposed adequately.
As this endpoint may not provide a suitable protection level for species with a longer reproductive cycle it is not considered further; no overall ETO‐NOEC is available.
For winter oilseed rape, only the worst‐case PEC values are presented, either resulting from calculations for single or multiple, early or late applications.
FOCUSsw Steps 1–3 – PEC/RAC ratios for dimoxystrobin – sunflower at 100 g a.s./ha with one application
| Scenario | PECsw global max (μg/L)3 | Fish acute | Fish chronic | Aquatic invertebrates acute | Aquatic invertebrates chronic | Algae | Higher plant | Sed. dweller chronic | Higher tier, Geomean | Higher tier, pulse exposure test | Microcosm/Mesocosm |
|---|---|---|---|---|---|---|---|---|---|---|---|
| O. mykiss | P. promelas | C. virginica | D. magna | N. pelliculosa | L. gibba | C. riparius | Fish, acute (4 species) | Fish, chronic, O. mykiss | D. longispina | ||
| LC50 | NOEC | EC50 | NOEC | ErC50 | ErC50 | NOEC | geomean LC50 | NOEC | NOEAEC | ||
| 46.5 μg/L | 8 μg/L | 8.92 μg/L | 12.5 μg/L | 7.8 μg/L | No reliable data available | 4.42 μg/L | 56.4 μg/L | 12 μg/L1 | 1.7 μg/L2 | ||
| AF | 100 | 10 | 100 | 10 | 10 | 10 | 10 | 100 | – | – | |
| RAC (μg/L) | 0.465 | 0.8 | 0.0892 | 1.25 | 0.78 | – | 0.442 | 0.564 | – | – | |
| FOCUS Step 1 | 22.99 | 49.441 | 28.738 | 257.735 | 18.392 | 29.474 | 52.014 | 40.762 | |||
| FOCUS Step 2 | |||||||||||
| North/South Europe | 2.84 | 6.108 | 3.550 | 31.839 | 2.272 | 3.641 | 6.425 | 5.035 | |||
| FOCUS Step 3 | |||||||||||
| D5/pond | 0.193 | 0.415 | 0.241 | 2.164 | 0.154 | 0.247 | 0.437 | 0.342 | |||
| D5/stream | 0.513 | 1.103 | 0.641 | 5.751 | 0.410 | 0.658 | 1.161 | 0.910 | |||
| R1/pond | 0.278 | 0.598 | 0.348 | 3.117 | 0.222 | 0.356 | 0.629 | 0.493 | |||
| R1/stream | 1.167 | 2.510 | 1.459 | 13.083 | 0.934 | 1.496 | 2.640 | 2.069 | |||
| R3/stream | 0.865 | 1.860 | 1.081 | 9.697 | 0.692 | 1.109 | 1.957 | 1.534 | |||
| R4/stream | 1.283 | 2.759 | 1.604 | 14.383 | 1.026 | 1.645 | 2.903 | 2.275 |
AF: Assessment factor; PEC: Predicted environmental concentration; RAC: Regulatory acceptable concentration; PEC/RAC ratios above the relevant trigger of 1 are shown in bold.
Study is not considered fully reliable because it cannot be excluded that the sensitive life stages were not exposed adequately.
As this endpoint may not provide a suitable protection level for species with a longer reproductive cycle it is not considered further; no overall ETO‐NOEC is available.
FOCUS sw Step 4 – PEC/RAC ratios for dimoxystrobin – winter oilseed rape at 100 g a.s./ha with one or two applications
| Scenario | PECsw global max (μg/L)3 | Fish acute | Fish chronic | Aquatic invertebrates acute | Aquatic invertebrates chronic | Algae | Higher plant | Sed. dweller chronic | Higher tier, Geomean | Higher tier, pulse exposure test | Microcosm/Mesocosm |
|---|---|---|---|---|---|---|---|---|---|---|---|
| O. mykiss | P. promelas | C. virginica | D. magna | N. pelliculosa | L. gibba | C. riparius | Fish, acute (4 species) | Fish, chronic, O. mykiss | D. longispina | ||
| LC50 | NOEC | EC50 | NOEC | ErC50 | ErC50 | NOEC | geomean LC50 | NOEC | NOEAEC | ||
| 46.5 μg/L | 8 μg/L | 8.92 μg/L | 12.5 μg/L | 7.8 μg/L | No reliable data available | 4.42 μg/L | 56.4 μg/L | 12 μg/L1 | 1.7 μg/L2 | ||
| AF | 100 | 10 | 100 | 10 | 10 | 10 | 10 | 100 | – | – | |
| RAC (μg/L) | 0.465 | 0.8 | 0.0892 | 1.25 | 0.78 | – | 0.442 | 0.564 | – | – | |
| Nozzle reduction | FOCUS Step 4 | risk mitigation 10 m buffer zone and 10 m vegetated filter strip | |||||||||
| None | D2/ditch | 8.174 | 17.578 | 10.218 | 91.637 | 6.539 | 10.479 | 18.493 | 14.493 | ||
| D2/stream | 5.129 | 11.030 | 6.411 | 57.500 | 4.103 | 6.576 | 11.604 | 9.094 | |||
| D3/ditch | 0.091 | 0.196 | 0.114 | 1.020 | 0.073 | 0.117 | 0.206 | 0.161 | |||
| D4/pond | 0.915 | 1.968 | 1.144 | 10.258 | 0.732 | 1.173 | 2.070 | 1.622 | |||
| D4/stream | 0.947 | 2.037 | 1.184 | 10.617 | 0.758 | 1.214 | 2.143 | 1.679 | |||
| D5/pond | 0.512 | 1.101 | 0.640 | 5.740 | 0.410 | 0.656 | 1.158 | 0.908 | |||
| D5/stream | 0.397 | 0.854 | 0.496 | 4.451 | 0.318 | 0.509 | 0.898 | 0.704 | |||
| R1/pond | 0.087 | 0.187 | 0.109 | 0.975 | 0.070 | 0.112 | 0.197 | 0.154 | |||
| R1/stream | 0.715 | 1.538 | 0.894 | 8.016 | 0.572 | 0.917 | 1.618 | 1.268 | |||
| R3/stream | 0.688 | 1.480 | 0.860 | 7.713 | 0.550 | 0.882 | 1.557 | 1.220 | |||
| Nozzle reduction | FOCUS Step 4 | risk mitigation 20 m buffer zone and 20 m vegetated filter strip | |||||||||
| None | D2/ditch | 8.174 | 17.578 | 10.218 | 91.637 | 6.539 | 10.479 | 18.493 | 14.493 | ||
| D2/stream | 5.129 | 11.030 | 6.411 | 57.500 | 4.103 | 6.576 | 11.604 | 9.094 | |||
| D3/ditch | 0.047 | 0.101 | 0.059 | 0.527 | 0.038 | 0.060 | 0.106 | 0.083 | |||
| D4/pond | 0.914 | 1.966 | 1.143 | 10.247 | 0.731 | 1.172 | 2.068 | 1.621 | |||
| D4/stream | 0.947 | 2.037 | 1.184 | 10.617 | 0.758 | 1.214 | 2.143 | 1.679 | |||
| D5/pond | 0.511 | 1.099 | 0.639 | 5.729 | 0.409 | 0.655 | 1.156 | 0.906 | |||
| D5/stream | 0.397 | 0.854 | 0.496 | 4.451 | 0.318 | 0.509 | 0.898 | 0.704 | |||
| R1/pond | 0.046 | 0.099 | 0.058 | 0.516 | 0.037 | 0.059 | 0.104 | 0.082 | |||
| R1/stream | 0.369 | 0.794 | 0.461 | 4.137 | 0.295 | 0.473 | 0.835 | 0.654 | |||
| R3/stream | 0.361 | 0.776 | 0.451 | 4.047 | 0.289 | 0.463 | 0.817 | 0.640 | |||
AF: Assessment factor; PEC: Predicted environmental concentration; RAC: Regulatory acceptable concentration; PEC/RAC ratios above the relevant trigger of 1 are shown in bold.
Study is not considered fully reliable because it cannot be excluded that the sensitive life stages were not exposed adequately.
As this endpoint may not provide a suitable protection level for species with a longer reproductive cycle it is not considered further; no overall ETO‐NOEC is available.
For winter oilseed rape, only the worst‐case PEC values are presented, either resulting from calculations for single or multiple, early or late applications.
FOCUSsw Step 4 – PEC/RAC ratios for dimoxystrobin – sunflower at 100 g a.s./ha with one application
| Scenario | PECsw global max (μg/L)3 | Fish acute | Fish chronic | Aquatic invertebrates acute | Aquatic invertebrates chronic | Algae | Higher plant | Sed. dweller chronic | Higher tier, Geomean | Higher tier, pulse exposure test | Microcosm/Mesocosm | |
|---|---|---|---|---|---|---|---|---|---|---|---|---|
| O. mykiss | P. promelas | C. virginica | D. magna | N. pelliculosa | L. gibba | C. riparius | Fish, acute (4 species) | Fish, chronic, O. mykiss | D. longispina | |||
| LC50 | NOEC | EC50 | NOEC | ErC50 | ErC50 | NOEC | geomean LC50 | NOEC | NOEAEC | |||
| 46.5 μg/L | 8 μg/L | 8.92 μg/L | 12.5 μg/L | 7.8 μg/L | No reliable data available | 4.42 μg/L | 56.4 μg/L | 12 μg/L1 | 1.7 μg/L2 | |||
| AF | 100 | 10 | 100 | 10 | 10 | 10 | 10 | 100 | – | – | ||
| RAC (μg/L) | 0.465 | 0.8 | 0.0892 | 1.25 | 0.78 | – | 0.442 | 0.564 | – | – | ||
| Nozzle reduction | FOCUS Step 4 | risk mitigation 10 m buffer zone and 10 m vegetated filter strip | ||||||||||
| None | D5/pond | 0.191 | 0.411 | 0.239 | 2.141 | 0.153 | 0.245 | 0.432 | 0.339 | |||
| D5/stream | 0.229 | 0.492 | 0.286 | 2.567 | 0.183 | 0.294 | 0.518 | 0.406 | ||||
| R1/pond | 0,117 | 0.252 | 0.146 | 1.312 | 0.094 | 0.150 | 0.265 | 0.207 | ||||
| R1/stream | 0.528 | 1.135 | 0.660 | 5.919 | 0.422 | 0.677 | 1.195 | 0.936 | ||||
| R3/stream | 0.394 | 0.847 | 0.493 | 4.417 | 0.315 | 0.505 | 0.891 | 0.699 | ||||
| R4/stream | 0.584 | 1.256 | 0.730 | 6.547 | 0.467 | 0.749 | 1.321 | 1.035 | ||||
| Nozzle reduction | FOCUS Step 4 | risk mitigation 20 m buffer zone and 20 m vegetated filter strip | ||||||||||
| None | D5/pond | 0.190 | 0.409 | 0.238 | 2.130 | 0.152 | 0.244 | 0.430 | 0.337 | |||
| D5/stream | 0.229 | 0.492 | 0.286 | 2.567 | 0.183 | 0.294 | 0.518 | 0.406 | ||||
| R1/pond | 0.061 | 0.131 | 0.076 | 0.684 | 0.049 | 0.078 | 0.138 | 0.108 | ||||
| R1/stream | 0.276 | 0.594 | 0.345 | 3.094 | 0.221 | 0.354 | 0.624 | 0.489 | ||||
| R3/stream | 0.207 | 0.445 | 0.259 | 2.321 | 0.166 | 0.265 | 0.468 | 0.367 | ||||
| R4/stream | 0.306 | 0.658 | 0.382 | 3.430 | 0.245 | 0.392 | 0.692 | 0.542 | ||||
AF: Assessment factor; PEC: Predicted environmental concentration; RAC: Regulatory acceptable concentration; PEC/RAC ratios above the relevant trigger of 1 are shown in bold.
Study is not considered fully reliable because it cannot be excluded that the sensitive life stages were not exposed adequately.
As this endpoint may not provide a suitable protection level for species with a longer reproductive cycle it is not considered further; no overall ETO‐NOEC is available.
FOCUS sw Steps 1–2 – PEC/RAC ratios for 505M01 – winter oilseed rape at 100 g a.s./ha with one or two applications
| Scenario | PECsw global max (μg/L)1 | Fish acute | Fish chronic | Aquatic invertebrates acute | Aquatic invertebrates chronic | Algae | Higher plant | Sed. dweller chronic |
|---|---|---|---|---|---|---|---|---|
| O. mykiss | O. mykiss | D. magna | D. magna | P. subcapitata | L. gibba | C. riparius | ||
| LC50 | NOEC | EC50 | NOEC | ErC50 | ErC50 | NOEC | ||
| > 100,000 μg/L | – | > 100,000 μg/L | – | > 100,000 μg/L | – | – | ||
| AF | 100 | 100 | 10 | |||||
| RAC | > 1,000 | > 1,000 | > 10,000 | |||||
| FOCUS Step 1 | 11.38 | < 0.011 | < 0.011 | < 0.001 | ||||
| FOCUS Step 2 | ||||||||
| North/South Europe | – | – | – | – |
For winter oilseed rape, only the worst‐case PEC values are presented, either resulting from calculations for single or multiple, early or late applications.
FOCUS sw Steps 1–2 – PEC/RAC ratios for 505M08 – winter oilseed rape at 100 g a.s./ha with one or two applications
| Scenario | PECsw global max (μg/L)1 | Fish acute | Fish chronic | Aquatic invertebrates acute | Aquatic invertebrates chronic | Algae | Higher plant | Sed. dweller chronic |
|---|---|---|---|---|---|---|---|---|
| O. mykiss | O. mykiss | D. magna | D. magna | P. subcapitata | L. gibba | C. riparius | ||
| LC50 | NOEC | EC50 | NOEC | ErC50 | ErC50 | NOEC | ||
| > 100,000 μg/L | – | > 100,000 μg/L | – | > 100,000 μg/L | – | – | ||
| AF | 100 | 100 | 10 | |||||
| RAC | > 1,000 | > 1,000 | > 10,000 | |||||
| FOCUS Step 1 | 13.68 | < 0.014 | < 0.014 | < 0.001 | ||||
| FOCUS Step 2 | ||||||||
| North/South EU | – | – | – | – |
For winter oilseed rape, only the worst‐case PEC values are presented, either resulting from calculations for single or multiple, early or late applications.
FOCUS sw Steps 1–2 – PEC/RAC ratios for 505M09 – winter oilseed rape at 100 g a.s./ha with one or two applications
| Scenario | PECsw global max (μg/L)1 | Fish acute | Fish chronic | Aquatic invertebrates acute | Aquatic invertebrates chronic | Algae | Higher plant | Sed. dweller chronic |
|---|---|---|---|---|---|---|---|---|
| O. mykiss | O. mykiss | D. magna | D. magna | P. subcapitata | L. gibba | C. riparius | ||
| LC50 | NOEC | EC50 | NOEC | ErC50 | ErC50 | NOEC | ||
| > 100,000 μg/L | – | > 100,000 μg/L | – | > 100,000 μg/L | – | – | ||
| AF | 100 | 100 | 10 | |||||
| RAC | > 1,000 | > 1,000 | > 10,000 | |||||
| FOCUS Step 1 | 14.93 | < 0.015 | < 0.015 | < 0.002 | ||||
| FOCUS Step 2 | ||||||||
| North/South Europe | – | – | – | – |
For winter oilseed rape, only the worst‐case PEC values are presented, either resulting from calculations for single or multiple, early or late applications.
FOCUS sw Steps 1–2 – PEC/RAC ratios for 505M096 – winter oilseed rape at 100 g a.s./ha one or two applications
| Scenario | PECsw global max (μg/L)1 | Fish acute | Fish chronic | Aquatic invertebrates acute | Aquatic invertebrates chronic | Algae | Higher plant | Sed. dweller chronic |
|---|---|---|---|---|---|---|---|---|
| O. mykiss | O. mykiss | D. magna | D. magna | P. subcapitata | L. gibba | C. riparius | ||
| LC50 | NOEC | EC50 | NOEC | ErC50 | ErC50 | NOEC | ||
| > 100,000 μg/L | – | > 100,000 μg/L | – | 43,600 μg/L | – | – | ||
| AF | 100 | 100 | 10 | |||||
| RAC | > 1,000 | > 1,000 | 4,360 | |||||
| FOCUS Step 1 | 4.44 | < 0.004 | < 0.004 | 0.001 | ||||
| FOCUS Step 2 | ||||||||
| North/South Europe | – | – | – | – |
For winter oilseed rape, only the worst‐case PEC values are presented, either resulting from calculations for single or multiple, early or late applications.
FOCUS sw Steps 1–2 – PEC/RAC ratios for 505M01 – sunflower at 100 g a.s./ha with one application
| Scenario | PECsw global max (μg/L) | Fish acute | Fish chronic | Aquatic invertebrates acute | Aquatic invertebrates chronic | Algae | Higher plant | Sed. dweller chronic |
|---|---|---|---|---|---|---|---|---|
| O. mykiss | O. mykiss | D. magna | D. magna | P. subcapitata | L. gibba | C. riparius | ||
| LC50 | NOEC | EC50 | NOEC | ErC50 | ErC50 | NOEC | ||
| > 100,000 μg/L | – | > 100,000 μg/L | – | > 100,000 μg/L | – | – | ||
| AF | 100 | 100 | 10 | |||||
| RAC | > 1,000 | > 1,000 | > 10,000 | |||||
| FOCUS Step 1 | 5.69 | < 0.006 | < 0.006 | < 0.001 | ||||
| FOCUS Step 2 | ||||||||
| North/South Europe | – | – | – | – |
FOCUS sw Steps 1–2 – PEC/RAC for 505M08 – sunflower at 100 g a.s./ha one application
| Scenario | PECsw global max (μg/L) | Fish acute | Fish chronic | Aquatic invertebrates acute | Aquatic invertebrates chronic | Algae | Higher plant | Sed. dweller chronic |
|---|---|---|---|---|---|---|---|---|
| O. mykiss | O. mykiss | D. magna | D. magna | P. subcapitata | L. gibba | C. riparius | ||
| LC50 | NOEC | EC50 | NOEC | ErC50 | ErC50 | NOEC | ||
| > 100,000 μg/L | – | > 100,000 μg/L | – | > 100,000 μg/L | – | – | ||
| AF | 100 | 100 | 10 | |||||
| RAC | > 1,000 | > 1,000 | > 10,000 | |||||
| FOCUS Step 1 | 6.84 | < 0.007 | < 0.007 | < 0.001 | ||||
| FOCUS Step 2 | ||||||||
| North/South Europe | – | – | – | – |
FOCUS sw Steps 1–2 – PEC/RAC for 505M09 – sunflower at 100 g a.s./ha with one application
| Scenario | PECsw global max (μg/L) | Fish acute | Fish chronic | Aquatic invertebrates acute | Aquatic invertebrates chronic | Algae | Higher plant | Sed. dweller chronic |
|---|---|---|---|---|---|---|---|---|
| O. mykiss | O. mykiss | D. magna | D. magna | P. subcapitata | L. gibba | C. riparius | ||
| LC50 | NOEC | EC50 | NOEC | ErC50 | ErC50 | NOEC | ||
| > 100,000 μg/L | – | > 100,000 μg/L | – | > 100,000 μg/L | – | – | ||
| AF | 100 | 100 | 10 | |||||
| RAC | > 1,000 | > 1,000 | > 10,000 | |||||
| FOCUS Step 1 | 7.46 | < 0.007 | < 0.007 | < 0.001 | ||||
| FOCUS Step 2 | ||||||||
| North/South Europe | – | – | – | – |
FOCUS sw Steps 1–2 – PEC/RAC ratios for 505M096 – sunflower at 100 g a.s./ha with one application
| Scenario | PECsw global max (μg/L) | Fish acute | Fish chronic | Aquatic invertebrates acute | Aquatic invertebrates chronic | Algae | Higher plant | Sed. dweller chronic |
|---|---|---|---|---|---|---|---|---|
| O. mykiss | O. mykiss | D. magna | D. magna | P. subcapitata | L. gibba | C. riparius | ||
| LC50 | NOEC | EC50 | NOEC | ErC50 | ErC50 | NOEC | ||
| > 100,000 μg/L | – | > 100,000 μg/L | – | 43,600 μg/L | – | – | ||
| AF | 100 | 100 | 10 | |||||
| RAC | > 1,000 | > 1,000 | > 4,360 | |||||
| FOCUS Step 1 | 2.22 | < 0.002 | < 0.002 | 0.001 | ||||
| FOCUS Step 2 | ||||||||
| North/South Europe | – | – | – | – |
Effects on bees (Regulation (EU) N° 283/2013, Annex Part A, point 8.3.1 and Regulation (EU) N° 284/2013 Annex Part A, point 10.3.1)
| Species | Test substance | Timescale/type of endpoint | End point | Toxicity |
|---|---|---|---|---|
| Apis mellifera L. | Dimoxystrobin | Acute |
Oral toxicity 48 h (LD50) |
> 79.4 μg/bee |
| Contact toxicity 48 h (LD50) | no data available, required | |||
| BAS 540 00 F | Acute |
Oral toxicity 48 h (LD50) |
> 342.28 μg product/bee (> 61.23 μg dimoxystrobin/bee) |
|
| Contact toxicity 72 h (LD50) |
> 279.5 μg product/bee (> 50 μg dimoxystrobin/bee) |
|||
| BAS 540 01 F | Acute |
Oral toxicity 48 h (LD50) |
> 333.1 μg product/bee (> 59.75 μg dimoxystrobin/bee) |
|
| Contact toxicity 48 h (LD50) |
> 278.5 μg product/bee (> 50 μg dimoxystrobin/bee) |
|||
| Dimoxystrobin | Chronic | 10 d‐LDD50 1 | 83.3 μg/bee/day | |
| NOEL for HPG | no data, required | |||
| BAS 540 01 F | Semichronic |
8 d‐NOED 2 larvae (with dietary exposure on day 4) |
33.48 μg product/larvae (6 μg dimoxystrobin/larvae) |
|
| Dimoxystrobin | Semichronic |
22 d‐NOED larvae (repeated dietary exposure) |
no data available, required |
Study is considered reliable although some deviations were noted with respect to the recommendations of the current test guidelines.
Study is a short‐term study with single exposure.
| Potential for accumulative toxicity: no data |
| Higher tier data with honeybees |
| A semifield tunnel study conducted with BAS 540 01 F and two residue field studies were available. For further information, please see RAR Vol 3 CP 9, Sections B.9.5.1.6 and B.9.5.1.7. |
Risk assessment for dimoxystrobin includes application in winter oilseed rape (2 × 0.5 L BAS 540 01 F/ha, with an application interval of 28 d) and sunflower (1 × 0.5 L BAS 540 01 F/ha)
(The risk assessment was performed according to SANCO/10329/2002 rev 2 final)
| Species | Test substance | Risk quotient | HQ/ETR | Trigger |
|---|---|---|---|---|
| Honeybees | Dimoxystrobin | HQoral | < 1.26 | 50 |
| Honeybees | BAS 540 01 F | HQoral | < 1.68 1 | 50 |
| Honeybees | dimoxystrobin | HQcontact | no data available, required | 50 |
| Honeybees | BAS 540 01 F | HQcontact | < 2.00 1 | 50 |
For the calculation of the HQ values, the maximum single application rate of 500 mL/ha was multiplied by the product density of 1.118 g/cm3. For acute contact, the endpoint obtained in the study with the product was considered for risk assessment purposes as it was expressed in terms of a.s. equivalent.
The following risk assessment was carried out according to EFSA Bee GD (2013).
Risk assessment for bees from contact and oral dietary exposure – winter oilseed rape (2 × 0.5 L BAS 540 01 F/ha, with an application interval of 28 d) and sunflower (1 × 0.5 L BAS 540 01 F/ha)
| Species | Test substance | Scenario | Risk quotient | HQ/ETR | Trigger |
|---|---|---|---|---|---|
| Screening level assessment | |||||
| Apis mellifera | Dimoxystrobin | Not relevant | ETRacute adult oral | < 0.01 | 0.2 |
| Apis mellifera | Dimoxystrobin | Not relevant | HQcontact | No data available, required | 42 |
| Apis mellifera | BAS 540 01 F | Not relevant | ETRacute adult oral | < 0.01 | 0.2 |
| Apis mellifera | BAS 540 01 F | Not relevant | HQcontact | < 2 | 42 |
| Apis mellifera | Dimoxystrobin | Not relevant | ETRchronic adult oral | 0.009 | 0.03 |
| Apis mellifera | BAS 540 01 F | Not relevant | ETRlarvae | No study on repeated exposure is available, required | 0.2 |
Risk assessment for honeybees from consumption of contaminated water
| Species | Test substance | Risk quotient | ETR | Trigger |
|---|---|---|---|---|
| Screening level risk assessment from exposure to residues in guttation fluid (water solubility = 0.003 μg/μL 1 ) | ||||
| Apis mellifera | Dimoxystrobin | ETRacute adult oral | < 0.0004 | 0.2 |
| Apis mellifera | Dimoxystrobin | ETRchronic adult oral | 0.0004 | 0.03 |
| Apis mellifera | Dimoxystrobin | ETRlarvae | No data available, required | 0.2 |
| Risk assessment from exposure to residues in surface water (FOCUS Step 3; D2 ditch PECsw of 8.174 μg/L 2 ) | ||||
| Apis mellifera | Dimoxystrobin | ETRacute adult oral | < 0.0001 | 0.2 |
| Apis mellifera | Dimoxystrobin | ETRchronic adult oral | < 0.0001 | 0.03 |
| Apis mellifera | Dimoxystrobin | ETRlarvae | No data available, required | 0.2 |
Water solubility: 3.324 mg dimoxystrobin/L (20°C)
Worst‐case PECsw (FOCUSsw Step 3; D2 ditch) resulting from calculations for application with 100 g a.s./ha in oilseed rape.
Effects on other arthropod species (Regulation (EU) N° 283/2013, Annex Part A, point 8.3.2 and Regulation (EU) N° 284/2013 Annex Part A, point 10.3.2)
Laboratory tests with standard sensitive species
| Species | Test Substance | End point | Toxicity |
|---|---|---|---|
| Typhlodromus pyri | Preparation (BAS 540 00 F) |
Mortality, LR50 Reproduction, ER50 |
> 1.0 L/ha > 1.0 L/ha |
| Aphidius rhopalosiphi | Preparation (BAS 540 00 F) |
Mortality, LR50 Reproduction, ER50 |
> 1.0 L/ha > 0.03 L/ha |
| Additional species | |||
| Chrysoperla carnea | Preparation (BAS 540 00 F) |
Mortality, LR50 Reproduction, ER50 |
> 1.0 L/ha > 1.0 L/ha |
| Poecilus cupreus | Preparation (BAS 540 00 F) |
Mortality, LR50 Food consumption, ER50 |
> 1.0 L/ha > 1.0 L/ha |
First‐tier risk assessment for BAS 540 01 F – winter oilseed rape at 0.5 L product/ha with two applications (covers intended use of BAS 540 01 F in sunflower)
| Test substance | Species | Effect (LR50 g/ha) | HQ in‐field | HQ off‐field 1 | Trigger |
|---|---|---|---|---|---|
| BAS 540 00 F | Typhlodromus pyri | > 1.0 | < 0.85 | < 0.02 | 2 |
| BAS 540 00 F | Aphidius rhopalosiphi | > 1.0 | < 0.85 | < 0.02 | 2 |
indicates distance assumed to calculate the drift rate: 1 m
Extended laboratory tests, aged residue tests
| Species | Life stage | Test substance, substrate | Time scale | Dose (g/ha)1,2 | End point | % effect3 | ER50 |
|---|---|---|---|---|---|---|---|
| Aphidius rhopalosiphi | Adults | BAS 540 00 F, natural substrate, 3‐D | 13 d |
0.07 0.5 1.0 (ini) |
Mortality, reproduction |
8.28 −10.56 17.16 |
> 1.0 > 1.0 |
n.d.: not determined; DAT: days after treatment.
indicates whether initial or aged residues.
for preparations indicate whether dose is expressed in units of a.s. or preparation.
adverse effects; positive values indicate a decrease; negative values indicate an increase.
Risk assessment for BAS 540 01 F – winter oilseed rape at 0.5 L product/ha with two applications (covers intended use of BAS 540 01 F in sunflower) based on extended lab test or aged residue tests
| Species | L/ER50 (g/ha) | In‐field rate | Off‐field rate1 | Trigger |
|---|---|---|---|---|
| A. rhopalosiphi, 3D |
LR50 > 1.0 ER50 > 1.0 |
0.85 L/ha | 0.1 L/ha |
Endpoint > PER acceptable risk |
At 1 m distance.
| Semi‐field tests: Not provided, not required |
| Field studies: Not provided, not required |
| Additional specific test: Not provided, not required |
Effects on non‐target soil meso‐ and macro fauna; effects on soil nitrogen transformation (Regulation (EU) N° 283/2013, Annex Part A, points 8.4, 8.5, and Regulation (EU) N° 284/2013 Annex Part A, points 10.4, 10.5)
| Test organism | Test substance | Application method of test a.s./OM | Timescale | End point | Toxicity |
|---|---|---|---|---|---|
| Earthworms | |||||
| Eisenia fetida | Dimoxystrobin |
Mixed into soil 10% peat |
Chronic | Growth, reproduction, behaviour |
NOEC 0.05 mg/kg d.w. soil (reproduction) EC10 0.048 mg/kg d.w. soil (reproduction) NOECCORR 0.025 mg/kg d.w. soil (reproduction) |
| Eisenia fetida | BAS 540 01 F | Mixed into soil | Chronic | Growth, reproduction, behaviour | no data available, required |
| Eisenia fetida | 505M01 |
Mixed into soil 5% peat |
Chronic | Growth, reproduction, behaviour | NOEC < 15.625 mg/kg d.w. soil 1 |
| Eisenia fetida | 505M08 |
Mixed into soil 10% peat |
Chronic | Growth, reproduction, behaviour | NOEC 250 mg/kg d.w. soil (reproduction) |
| Eisenia fetida | 505M09 |
Mixed into soil 10% peat |
Chronic | Growth, reproduction, behaviour | NOEC 250 mg/kg d.w. soil (reproduction) |
| Other soil macroorganisms | |||||
| Folsomia candida | Dimoxystrobin |
Mixed into soil 5% peat |
Chronic |
Mortality, reproduction |
NOEC 1,000 mg/kg d.w. soil (reproduction) NOECCORR 500 mg/kg d.w. soil (reproduction) |
| Folsomia candida | BAS 540 00 F |
Mixed into soil 10% peat |
Chronic |
Mortality, reproduction |
NOEC 250 mg product/kg d.w. soil (mortality) NOEC 44.8 mg dimoxystrobin/kg d.w. soil (mortality) NOECCORR 22.4 mg dimoxystrobin/kg d.w. soil |
| Folsomia candida | 505M09 |
Mixed into soil 5% peat |
Chronic |
Mortality, reproduction |
NOEC 1,000 mg/kg d.w. soil (reproduction) |
| Hypoaspis aculeifer | dimoxystrobin |
Mixed into soil 5% peat |
Chronic |
Mortality, reproduction |
NOEC 1,000 mg/kg d.w. soil (reproduction) NOECCORR 500 mg/kg d.w. soil (reproduction) |
| Hypoaspis aculeifer | BAS 540 01 F |
Mixed into soil 5% peat |
Chronic |
Mortality, reproduction |
NOEC 1,000 mg product/kg d.w. soil (reproduction) NOEC 179 mg dimoxystrobin/kg/kg d.w. soil (reproduction) NOECCORR 89.5 mg dimoxystrobin/kg/kg d.w. soil (reproduction) |
| Hypoaspis aculeifer | 505M09 |
Mixed into soil 5% peat |
Chronic |
Mortality, reproduction |
NOEC 1,000 mg/kg d.w. soil (reproduction) |
The study is valid since all validity criteria are met; however, effects on reproduction were seen at the lowest tested concentration; therefore, a proper NOEC from this study could not be derived and the risk assessment to earthworms is considered only illustrative related to this metabolite.
Higher tier testing (e.g. modelling or field studies)
Several field studies with earthworms were available. For further information, please see RAR Vol 3 CP 9, Section B.9.7.1.2.
| Nitrogen transformation | dimoxystrobin | < 25% effects after 28 days at 0.72 mg/kg dry soil |
| 505M01 | < 25% effects after 28 days at 100 g/ha, corresponding to 0.133 mg/kg dry soil | |
| 505M08 | < 25% effects after 28 days at 40 g/ha, corresponding to 0.053 mg/kg dry soil | |
| 505M09 | < 25% effects after 28 days at 200 g/ha, corresponding to 0.266 mg/kg dry soil1 | |
| BAS 540 01 F |
< 25% effects after 70 days at 37.2 mg/kg dry soil, 6.7 mg dimoxystrobin/kg dry soil1 |
Study is considered reliable although some deviations were noted with respect to the recommendations of the current test guidelines.
Toxicity/exposure ratios for soil organisms
| Test organism | Test substance | Time scale | Soil PEC1 | TER | Trigger |
|---|---|---|---|---|---|
| In winter oilseed rape 2 × 100 g a.s./ha/year; in sunflower 1 × 100 g a.s./ha/year2 | |||||
| Eisenia fetida | dimoxystrobin | chronic | 0.054 | 0.46 3 | 5 |
| Eisenia fetida | 505M01 | chronic | 0.0049 | < 3,1894 | 5 |
| Eisenia fetida | 505M08 | chronic | 0.0118 | 21,186 | 5 |
| Eisenia fetida | 505M09 | chronic | 0.0082 | 30,488 | 5 |
| Folsomia candida | dimoxystrobin | chronic | 0.054 | 9,2593 | 5 |
| Folsomia candida | 505M09 | chronic | 0.0082 | 121951 | 5 |
| Folsomia candida | dimoxystrobin in BAS 540 00 F | chronic | 0.054 | 4153 | 5 |
| Hypoaspis aculeifer | dimoxystrobin | chronic | 0.054 | 9,2593 | 5 |
| Hypoaspis aculeifer | 505M09 | chronic | 0.0082 | 12,1951 | 5 |
| Hypoaspis aculeifer | dimoxystrobin in BAS 540 01 F | chronic | 0.054 | 1,6573 | 5 |
Values in bold fall below the trigger value.
PECsoil,accu was used.
Worst‐case use pattern of BAS 540 01 F; only the worst‐case PECsoil values are presented and used for TER calculations.
Toxicity endpoints of the a.s. are re‐adjusted by a soil factor of 2, since the log Pow for the substance is > 2.
Risk assessment considered only orientative since a proper NOEC could not be derived from the study.
Effects on terrestrial non‐target higher plants (Regulation (EU) N° 283/2013, Annex Part A, point 8.6 and Regulation (EU) N° 284/2013 Annex Part A, point 10.6)
Screening data
| Species | Test substance | ER50 vegetative vigour | ER50 seedling emergence | Exposure1 | Risk acceptable | Trigger |
|---|---|---|---|---|---|---|
| Cabbage, carrot, oat, onion, pea, sunflower | BAS 540 00 F | > 1.0 L/ha | No data available | 0.5 L/ha | Yes | < 50% effect at highest application rate |
Laboratory dose–response tests
| Species | Test substance | ER50 (g/ha) vegetative vigour | ER50 (g/ha) emergence |
Exposure1 (g/ha) |
TER | Trigger |
|---|---|---|---|---|---|---|
| Buckwheat, carrot, corn, cucumber, lettuce, oat, onion, ryegrass, soybean, tomato | BAS 540 01 F | > 2.0 L/ha | > 1.0 L/ha | 0.5 L/ha | Yes | < 50% effect at highest application rate |
maximum single application rate
.
Extended laboratory studies: not provided, not required.
Semi‐field and field test: not provided, not required.
Effects on biological methods for sewage treatment (Regulation (EU) N° 283/2013, Annex Part A, point 8.8)
| Test type/organism | End point |
|---|---|
| Activated sludge | No significant inhibition of respiration was measured. EC50 was determined to be > 1,000 mg a.s./L (nominal) |
Monitoring data (Regulation (EU) N° 283/2013, Annex Part A, point 8.9 and Regulation (EU) N° 284/2013, Annex Part A, point 10.8)
|
Available monitoring data concerning adverse effect of the a.s. No data available |
|
Available monitoring data concerning effect of the PPP. No data available |
Definition of the residue for monitoring (Regulation (EU) N° 283/2013, Annex Part A, point 7.4.2) Ecotoxicologically relevant compounds 1
| Compartment | |
|---|---|
| Soil | Dimoxystrobin |
| Water | Dimoxystrobin |
| Sediment | Dimoxystrobin |
Metabolites are considered relevant when, based on the risk assessment, they pose a risk comparable or higher than the parent
Classification and labelling with regard to ecotoxicological data (Regulation (EU) N° 283/2013, Annex Part A, Section 10)

Appendix C – Wording EFSA used in Section 2.2 of this statement, in relation to DT and Koc ‘classes’ exhibited by each compound assessed 24
| Wording | DT50 normalised to 20°C for laboratory incubations or not normalised DT50 for field studies (SFO equivalent, when biphasic, the DT90 was divided by 3.32 to estimate the DT50 when deciding on the wording to use) |
|---|---|
| Very low persistence | < 1 day |
| Low persistence | 1 to < 10 days |
| Moderate persistence | 10 to < 60 days |
| Medium persistence | 60 to < 100 days |
| High persistence | 100 days to < 1 year |
| Very high persistence | A year or more |
Note these classes and descriptions are unrelated to any persistence class associated with the active substance cut‐off criteria in Annex II of Regulation (EC) No 1107/2009. For consideration made in relation to Annex II, see Appendix A.
| Wording | Koc (either KFoc or Kdoc) mL/g |
|---|---|
| Very high mobility | 0–50 |
| High mobility | 51–150 |
| Medium mobility | 151–500 |
| Low mobility | 501–2,000 |
| Slight mobility | 2,001–5,000 |
| Immobile | > 5,000 |
Based on McCall et al. (1980).
Appendix D – Used compound codes
| Code/trivial name (a) | IUPAC name/SMILES notation/InChiKey (b) | Structural formula (c) |
|---|---|---|
| dimoxystrobin |
(2E)‐2‐{2‐[(2,5‐dimethylphenoxy)methyl]phenyl}‐2‐(methoxyimino)‐N‐methylacetamide CNC(=O)\C(=N\OC)c1ccccc1COc1cc(C)ccc1C WXUZAHCNPWONDH‐DYTRJAOYSA‐N |

|
|
505M01 BF 505‐4 M505F001 |
(2E)‐2‐[2‐(hydroxymethyl)phenyl]‐2‐(methoxyimino)‐N‐methylacetamide OCc1ccccc1/C(=N\OC)C(=O)NC XJIRPXWWLNGHSS‐JLHYYAGUSA‐N |

|
|
505M08 BF 505‐7 M505F008 |
2‐({2‐[(1 E)‐N‐methoxy‐2‐(methylamino)‐2‐oxoethanimidoyl]phenyl}methoxy)‐4‐methylbenzoic acid CNC(=O)\C(=N\OC)c1ccccc1COc1cc(C)ccc1C(=O)O VVBFFEYXSJKVET‐HEHNFIMWSA‐N |

|
|
505M09 BF 505‐8 M505F009 |
3‐({2‐[(1 E)‐N‐methoxy‐2‐(methylamino)‐2‐oxoethanimidoyl]phenyl}methoxy)‐4‐methylbenzoic acid CNC(=O)\C(=N\OC)c1ccccc1COc1cc(ccc1C)C(=O)O RKECPZYSBKSRJM‐HEHNFIMWSA‐N |

|
| 505M93 | Structure undefined, a unique name/SMILES/InChiKey cannot be allocated |

|
| 505M95 | Structure undefined, a unique name/SMILES/InChiKey cannot be allocated |

|
|
505M96 M505F096 |
(4 E)‐1‐hydroxy‐4‐(methoxyimino)‐2‐methyl‐1,4‐dihydroisoquinolin‐3(2H)‐one O=C1\C(=N\OC)c2ccccc2C(O)N1C RVPXDOSJHGHSKY‐FMIVXFBMSA‐N |
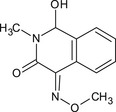
|
The metabolite name in bold is the name used in the conclusion.
ACD/Name 2021.1.3 ACD/Labs 2021.1.3 (File Version N15E41, Build 123232, 07 Jul 2021).
ACD/ChemSketch 2021.1.3 ACD/Labs 2021.1.3 (File Version C25H41, Build 123835, 28 Aug 2021).
Suggested citation: EFSA (European Food Safety Authority) 2022. Statement concerning the assessment of environmental fate and behaviour and ecotoxicology in the context of the pesticides peer review of the active substance dimoxystrobin. EFSA Journal 2022;20(11):7634, 90 pp. 10.2903/j.efsa.2022.7634
Requestor European Commission
Question number EFSA‐Q‐2022‐00542
Declarations of interest If you wish to access the declaration of interests of any expert contributing to an EFSA scientific assessment, please contact interestmanagement@efsa.europa.eu.
Approved: 5 October 2022
Notes
Commission Implementing Regulation (EU) No 844/2012 of 18 September 2012 setting out the provisions necessary for the implementation of the renewal procedure for active substances, as provided for in Regulation (EC) No 1107/2009 of the European Parliament and of the Council concerning the placing of plant protection products on the market. OJ L 252, 19.9.2012, pp. 26–32.
Commission Implementing Regulation (EU) No 2018/1659 of 7 November 2018 amending Implementing Regulation (EU) No 844/2012 in view of the scientific criteria for the determination of endocrine disrupting properties introduced by Regulation (EU) 2018/605.
Regulation (EC) No 1107/2009 of 21 October 2009 of the European Parliament and of the Council concerning the placing of plant protection products on the market and repealing Council Directives 79/117/EEC and 91/414/EEC. OJ L 309, 24.11.2009, pp. 1–50.
Commission Regulation (EU) 2018/605 of 19 April 2018 amending Annex II to Regulation (EC) No 1107/2009 by setting out scientific criteria for the determination of endocrine‐disrupting properties. OJ L 101, 20.4.2018, pp. 33–36.
For the metabolites see experts' consultation point 2.9 in the Peer Review Meeting Report from the Pesticides Peer Review Experts' Teleconference 70 in January 2022 and experts' consultation point 2.1 in the Peer Review Meeting Report from the Pesticides Peer Review Experts' Teleconference 78 in June 2022.
Regulation (EC) No 1272/2008 of the European Parliament and of the Council of 16 December 2008 on classification, labelling and packaging of substances and mixtures, amending and repealing Directives 67/548/EEC and 1999/45/EC, and amending Regulation (EC) No 1907/2006. OJ L 353, 31.12.2008, pp. 1–1355.
Simulations utilised the agreed Q10 of 2.58 (following EFSA, 2008) and Walker equation coefficient of 0.7.
See experts' consultation 5.1 in the Report of Pesticides Peer Review Experts' Teleconference 72 (EFSA, 2022).
See experts' consultation 5.2 in the Report of Pesticides Peer Review Experts' Teleconference 72 (EFSA, 2022).
See experts' consultation 5.6 in the Report of Pesticides Peer Review Experts' Teleconference 72 (EFSA, 2022).
See experts' consultation 5.4 in the Report of Pesticides Peer Review Experts' Teleconference 72 (EFSA, 2022).
See experts' consultation 5.8 in the Report of Pesticides Peer Review Experts' Teleconference 72 (EFSA, 2022).
See experts' consultation 5.5 in the Report of Pesticides Peer Review Experts' Teleconference 72 (EFSA, 2022).
See expert consultation in the Report of Pesticide Peer Review Expert's Teleconference 79 (EFSA, 2022).
See experts' consultation 5.7 in the Report of Pesticides Peer Review Experts' Teleconference 72 (EFSA, 2022) and expert consultation in the Report of Pesticide Peer Review Expert's Teleconference 79 (EFSA, 2022).
Ecotoxicity endpoints for bees obtained from both formulations are similar and are in the same range. The formulations are comparable based on existing information.
A further consideration to the risk to honey bee larvae is given below taking into account the available tunnel study.
The endpoint obtained from the product study but expressed as a.s. equivalent was used for risk assessment purposes.
One of the residue studies was conducted under semi‐field conditions, while the other study was a field study.
See experts' consultation 5.9 in the Report of Pesticides Peer Review Experts' Teleconference 72 (EFSA, 2022) for the detailed discussion on higher tier testing with honey bees.
See experts' consultation 5.10 in the Report of Pesticides Peer Review Experts' Teleconference 72 (EFSA, 2022) for the detailed discussion on higher tier testing with earthworms.
Commission Regulation (EU) No 546/2011 of 10 June 2011 implementing Regulation (EC) No 1107/2009 of the European Parliament and of the Council as regards uniform principles for evaluation and authorisation of plant protection products. OJ L 155, 11.6.2011, pp. 127–175.
With these risk mitigation measures, the exposure reduction is just below the limit of 95% (92.5%) for spray drift that is recommended by the FOCUS Landscape and mitigation guidance (FOCUS, 2007). Whilst theoretically there is a small margin, it is unlikely that with the absolute 95% drift reduction (i.e. with a 30‐m no‐spray buffer zone resulting in 94.94% drift reduction; also using 50% drift reducing nozzle +10 m buffer zone is essentially the same) any additional scenario would pass, nevertheless the risk assessment to absolutely confirm the situation is not available from the peer review. Nonetheless, it is unlikely that the critical area of concern would change.
For laboratory soil incubations normalisation was also to field capacity soil moisture (pF2/10kPa). For laboratory sediment water system incubations, the whole system DT values were used.
References
- ECHA (European Chemicals Agency) , 2020. Committee for Risk Assessment (RAC) Opinion proposing harmonised classification and labelling at EU level of dimoxystrobin (ISO); (2 E)‐2‐{2‐[(2,5‐dimethylphenoxy)methyl]phenyl}‐2‐(methoxyimino)‐N‐methylacetamide; (E)‐2‐(methoxyimino)‐N‐methyl‐2‐[α‐(2,5‐xylyloxy)‐otolyl]acetamide. CLH‐O‐0000006865‐62‐01/F. Adopted 8 October 2020. Available at: www.echa.europa.eu
- EFSA (European Food Safety Authority) , 2008. Opinion on a request from EFSA related to the default Q10 value used to describe the temperature effect on transformation rates of pesticides in soil. EFSA Journal 2008;6(1):622, 32 pp. 10.2903/j.efsa.2008.622 [DOI] [Google Scholar]
- EFSA (European Food Safety Authority) , 2009. Guidance on Risk Assessment for Birds and Mammals on request from EFSA. EFSA Journal 2009;7(12):1438, 358 pp. 10.2903/j.efsa.2009.1438 [DOI] [Google Scholar]
- EFSA (European Food Safety Authority) , 2013. EFSA Guidance Document on the risk assessment of plant protection products on bees (Apis mellifera, Bombus spp. and solitary bees). EFSA Journal 2013;11(7):3295, 268 pp. 10.2903/j.efsa.2013.3295 [DOI] [PMC free article] [PubMed] [Google Scholar]
- EFSA (European Food Safety Authority) , 2014. EFSA Guidance Document for evaluating laboratory and field dissipation studies to obtain DegT50 values of active substances of plant protection products and transformation products of these active substances in soil. EFSA Journal 2014;12(5):3662, 37 pp. 10.2903/j.efsa.2014.3662 [DOI] [Google Scholar]
- EFSA (European Food Safety Authority) , 2022. Peer review report to the statement concerning the assessment of environmental fate and behaviour and ecotoxicology in the context of the pesticides peer review of the active substance dimoxystrobin. Available online: www.efsa.europa.eu [DOI] [PMC free article] [PubMed]
- EFSA PPR Panel (EFSA Panel on Plant Protection Products and their Residues) , 2013. Guidance on tiered risk assessment for plant protection products for aquatic organisms in edge‐of‐field surface waters. EFSA Journal 2013;11(7):3290, 186 pp. 10.2903/j.efsa.2013.3290 [DOI] [Google Scholar]
- EFSA PPR Panel (EFSA Panel on Plant Protection Products and their Residues) , 2018. Scientific Opinion on the state of the art of Toxicokinetic/Toxicodynamic (TKTD) effect models for regulatory risk assessment of pesticides for aquatic organisms. EFSA Journal 2018;16(8):5377, 188 pp. 10.2903/j.efsa.2018.5377 [DOI] [PMC free article] [PubMed] [Google Scholar]
- European Commission , 2002. Guidance Document on Terrestrial Ecotoxicology Under Council Directive 91/414/EEC. SANCO/10329/2002‐rev. 2 final, 17 October 2002.
- European Commission , 2003. Guidance Document on Assessment of the Relevance of Metabolites in Groundwater of Substances Regulated under Council Directive 91/414/EEC. SANCO/221/2000‐rev. 10‐final, 25 February 2003.
- European Commission , 2014a. Assessing potential for movement of active substances and their metabolites to ground water in the EU. Report of the FOCUS Workgroup. EC Document Reference SANCO/13144/2010‐v. 3, 613 pp., as outlined in Generic guidance for tier 1 FOCUS groundwater assessment, v. 2.2 May 2014.
- European Commission , 2014b. Guidance document on the renewal of approval of active substances to be assessed in compliance with Regulation (EU) No 844/2012. SANCO/2012/11251‐rev. 4, 12 December 2014.
- FOCUS (Forum for the Co‐ordination of Pesticide Fate Models and their Use) , 2001. FOCUS surface water scenarios in the EU evaluation process under 91/414/EEC. Report of the FOCUS Working Group on Surface Water Scenarios. EC Document Reference SANCO/4802/2001‐rev. 2, 245 pp., as updated by Generic guidance for FOCUS surface water scenarios, v. 1.3 December 2014.
- FOCUS (Forum for the Co‐ordination of Pesticide Fate Models and their Use) , 2006. Guidance document on estimating persistence and degradation kinetics from environmental fate studies on pesticides in EU Registration Report of the FOCUS Work Group on Degradation Kinetics. EC Document Reference SANCO/10058/2005‐v. 2.0, 434 pp., as updated by the Generic guidance for Estimating Persistence and Degradation Kinetics from Environmental Fate Studies on Pesticides in EU Registration, v. 1.1 December 2014.
- FOCUS (Forum for the Co‐ordination of Pesticide Fate Models and their Use) , 2007. Landscape and mitigation factors in aquatic risk assessment. Volume 1. Extended summary and recommendations. Report of the FOCUS Working Group on Landscape and Mitigation Factors in Ecological Risk Assessment. EC Document Reference SANCO/10422/2005 v. 2.0, 169 pp.
- Hungary , 2017. Renewal Assessment Report (RAR) on the active substance dimoxystrobin prepared by the rapporteur Member State Hungary, in the framework of Commission Implementing Regulation (EU) No 844/2012, August 2017. Available online: www.efsa.europa.eu
- Hungary , 2022. Revised Renewal Assessment Report (RAR) on dimoxystrobin prepared by the rapporteur Member State Hungary in the framework of Commission Implementing Regulation (EU) No 844/2012, July 2022. Available online: www.efsa.europa.eu
- McCall PJ, Laskowski DA, Swann RL and Dishburger HJ, 1980. Measurements of sorption coefficients of organic chemicals and their use in environmental fate analysis. In: Test Protocols for Environmental Fate and Movement of Toxicants. In: Proceedings of the 94th Annual Meeting of the American Association of Official Analytical Chemists (AOAC). Oct 21–22, Washington, D.C. pp. 89–109.
- SETAC (Society of Environmental Toxicology and Chemistry) , Candolfi MP, Barrett KL, Campbell PJ, Forster R, Grandy N, Huet MC, Lewis G, Oomen PA, Schmuck R and Vogt H (eds), 2001. Guidance document on regulatory testing and risk assessment procedures for plant protection products with non‐target arthropods. ESCORT 2 workshop.