

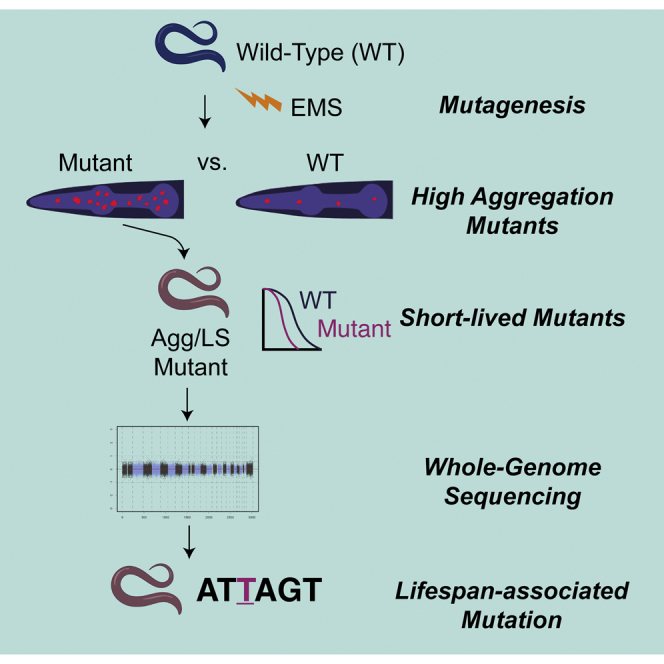
Summary
Genetic screens are widely used to identify genes that control specific biological functions. In Caenorhabditis elegans, forward genetic screens rely on the isolation of reproductively active mutants that can self-propagate clonal populations. Screens that target post-reproductive phenotypes, such as lifespan, are thus challenging. We combine microfluidic technologies and image processing to perform high-throughput automated screening for short-lived mutants using protein aggregation as a marker for aging. We take advantage of microfluidics for maintaining a reproductively active adult mutagenized population and for performing serial high-throughput analysis and sorting of animals with increased protein aggregation, using fluorescently-labeled PAB-1 as a readout. We demonstrate that lifespan mutants can be identified by screening for accelerated protein aggregation through quantitative analysis of fluorescently labeled aggregates while avoiding conditional sterilization or manual separation of parental and progeny populations. We also show that aged wildtypes and premature aggregation mutants differ in aggregate morphology, suggesting aggregate growth is time-dependent.
Subject areas: Cellular physiology, Genetics, Molecular genetics, Bioengineering
Graphical abstract
Highlights
-
•
Protein aggregation is used as a marker to identify short-lived Caenorhabditis elegans mutants
-
•
Image processing enables quantitative analysis of protein aggregation
-
•
Microfluidic systems are used to isolate animals late in reproduction
Cellular physiology; Genetics; Molecular genetics; Bioengineering
Introduction
The process by which organisms undergo structural and functional decline with age is regulated by a complex network of genetic and environmental factors.1 Obtaining a greater understanding of the aging process becomes increasingly relevant to human health by the year as a greater fraction of the world population reaches old age.2 A key step in understanding the biological mechanisms that regulate aging is to identify the genetic pathways at play. The nematode C. elegans has been crucial for the identification of genetic pathways that modulate longevity1 by searching for lifespan-regulating genes.3,4,5,6,7,8,9 Approaches for genetic screening that rely on novel phenotypes or the development of new tools provide an opportunity to probe an unexplored genotype-phenotype landscape and identify yet uncharacterized genes that regulate the aging process.
Several technical advantages make C. elegans an optimal model system to perform large-scale genetic screens of aging regulators, such as its short lifespan, genetic tractability, fast life cycle, and ease of culture.10 C. elegans is amenable to both forward and reverse genetic screens, which rely on random mutagenesis or targeted gene silencing, respectively. Large-scale reverse genetic RNA interference (RNAi) screens can be carried out by feeding C. elegans populations a library of dsRNA-expressing bacteria.11 RNAi screens for longevity genes have revealed important pathways, such as those associated with metabolism and mitochondrial function, but require handling and monitoring large numbers of populations throughout their entire lifespan.4,5,12 These screens are typically carried out in animals sterilized through genetic changes or exposure to 5-fluorodexoyuridine (FUdR), to circumvent the need to separate adults from their progeny.4,5 Although RNAi screens only allow for the assessment of the effects of gene silencing, forward genetic screens depend on random mutagenesis and can result in strong and diverse functional mutations. The first forward genetic screen for lifespan mutants relied on a temperature-sensitive mutant that is sterile at 25°C,7 and thus allows monitoring population survival without progeny. Recently, a forward genetic screen for maximum population lifespan screened populations derived from individually mutagenized animals using conditionally sterile animals.9 As with RNAi, these approaches require measurement of lifespan for clonal populations of each mutant to be analyzed,7 and are thus highly labor-intensive.
Traditional forward genetic screens rely on isolation of individuals from a mutagenized population, after which clonal populations can be generated and analyzed to validate the phenotype.13,14 Because it is necessary to isolate putative mutants that are still reproductively active, this approach is not suitable to screen for lifespan-altering mutations. Alternative approaches have used correlates or predictors of aging as screening phenotypes. One study focused on the identification of animals with normal locomotion rates at the beginning of adulthood but reduced locomotion in the very late reproductive stages.15 Recently, a screen of animals in the late reproductive stage was performed by searching for individuals with increased levels of intestinal autofluorescence from lipofuscin,16which is considered a marker of aging.17 The mutagenized population of animals was kept synchronized until the late reproductive stages by blocking embryonic development using FUdR. When worms were no longer exposed to FuDR, they resumed reproduction and allowed for progeny collection. Reproduction and FUdR exposure are known to drive changes in longevity under some conditions,18,19,20 and thus screening animals that can naturally reproduce could lead to the identification of aging genetic pathways that have thus far been elusive. However, separating mutagenized parents from their progeny makes genetic screens at late reproductive stage prohibitively labor-intensive, and has thus not been possible before.
One characteristic displayed by aging individuals is increased levels of protein aggregation because of a decline in proteostasis.21,22 Screens have used increased aggregation levels in aggregating PolyQ disease models to search for genes that regulate proteostasis.23,24 However, protein aggregation has not been used so far as a marker for aging. One protein that has shown increased aggregation with age is the Poly(A)-binding protein PAB-1.25 Unlike PolyQ, PAB-1 is expressed and aggregates naturally in wildtype C. elegans. Because PAB-1 is a stress-granule protein, aggregates are observed in conditions of increased stress.25 In addition, aggregation has been observed to greatly increase with age, and most drastically immediately following the reproductive period.25 We thus hypothesized that by screening randomly mutagenized animals for increased PAB-1 aggregation in the late reproductive stages, mutants with an accelerated rate of aging could be identified. Although this approach could also yield mutants with altered stress-granule formation, quantification of lifespan of putative mutants would enable the isolation of true aging mutants. Moreover, mutants with altered sensitivity to stress, which could also be screened for by measuring PAB-1 aggregation, would likely not be as easily identified in the absence of exogenous stress. In this work, we developed a new screening approach that uses protein aggregation to isolate short-lived C. elegans mutants exhibiting increased protein aggregation. We screened mutagenized animals at the late reproductive stage by integrating microfluidic systems for progeny removal and animal sorting, with quantitative image analysis and automated scoring of protein aggregation levels. From the individual animals sorted as positive for high levels of aggregation, we obtained a set of mutant strains with elevated aggregation in the late reproductive stages. We assayed the lifespan of each aggregation mutant and identified mutants with a significant reduction in lifespan. We have generated new mutant strains that exhibit reduced lifespan and increases in PAB-1 protein aggregation. We also demonstrate a new approach toward forward genetic screening for aging genes, while avoiding inhibition of reproduction, which is applicable to other aging correlates or late onset phenotypes.
Results
Quantitative image analysis of PAB-1 protein aggregation as a marker for aging
To reliably analyze the association between PAB-1 aggregation and aging, and use it as a readout for genetic screening, we developed image processing algorithms that measure PAB-1 protein aggregates from fluorescence microscopy images in C. elegans. We used a previously developed transgenic line,25 where tagRFP:PAB-1 fusion protein is expressed throughout the pharynx. Previous work has shown that differences in aggregation levels between young and old animals are larger in the anterior section of the pharynx, which includes the first pharyngeal bulb,25 and we thus selected this region for quantification of aggregates. Each pharynx image was split into an anterior and posterior section by an intensity-based segmentation followed by identification of the two largest objects, which represented the anterior and posterior bulb (Figure S1). Identification of the anterior bulb was based on image orientation. Throughout this study, imaging was performed either on a straight channel of a microfluidic device, or on agarose pads on glass slides. For on-chip images, the worm orientation is consistent in the imaging channel, ensuring the anterior pharynx is the top object. In this case, the anterior and posterior regions are split by vertically bisecting the image at the midpoint between the two centroids. When images are acquired on a glass slide, varying orientations make distinction of the anterior and posterior bulb more challenging. In this case, we applied a similar horizontal or vertical image split at the midpoint of the centroids. The split image was then displayed to the user, who then provides input to specify which image contained the anterior pharynx. Aggregate quantification was thus restricted to objects identified within the cropped anterior pharynx image.
In young animals, PAB-1 is expressed broadly at a high intensity throughout the pharyngeal muscle tissue. Protein aggregates were distinguishable from diffuse localization by their relative higher intensity, sharp boundaries, and small size relative to that of the pharyngeal muscle. They are also distinct from the narrow fluorescence accumulation observed in the middle of pharynxes (potentially localized to pharyngeal epithelium, Figure S2). To quantify PAB-1 aggregates with these characteristics, we developed an algorithm (called Screening Algorithm) that binarizes images following a standard deviation (SD) filtering step (Figure 1). Because young, old, and mutant worms expressed PAB-1 at varying levels, it was necessary to account for differences in overall intensity between images. We controlled for these differences by scaling each image by the mean intensity of the pixels contained within the anterior object identified during the pharyngeal splitting step before the SD filter. Pharynxes also exhibited spatial differences in baseline intensity. To account for this variability, we then applied a step-wise segmentation process to identify objects of varying intensity, while discarding large, non-aggregate objects. At each step, the stringency of the segmentation threshold was increased and objects above a certain size were removed. The results of each step are combined in a binary image, which is then post-processed to remove long objects that appear in pharynx edges. As the threshold becomes more stringent, identified objects become smaller, and thus objects missed in early steps are captured in later thresholding steps.
Figure 1.

Quantitative analysis of tagRFP::PAB-1
Screening Algorithm image analysis flow: intensity-based scaling followed by stepwise aggregate identification and post-processing. SD of raw image acquired and scaled by the mean intensity of the anterior pharynx region. Image binaries acquired in a series of ten steps with an increasing threshold stringency. Step 1 is the least stringent threshold. In each step, objects above a defined size are removed. Objects that are missed in the initial step are added in subsequent steps, as they shrink below the aggregate threshold size. Images from each of the step are combined in an OR statement. Post-processing subtracts long objects to remove pharynx edges.
We validated the performance of this algorithm by comparing values calculated for total aggregate area and intensity to those identified through manual annotation. Our analysis of acquired PAB-1 aggregation images recapitulated previously observed trends in natural aggregation with age25 and on knock-down of the proteostasis regulator heat-shock factor 1 (hsf-1) (Figure S3). We thus determined that this algorithm could identify animals with high levels of aggregation, and thus used it for genetic screening, as described below. However, we found that the algorithm greatly underestimated the aggregation levels in images with high levels of diffuse protein, while performing better with images with low levels of diffuse protein (i.e., images from older animals) (Figure S4A). This trend was confirmed by plotting the total aggregate intensity determined by the algorithm versus the actual total intensity determined from the manual creation of ground truth binaries (Figure S4B).
To address these challenges, we next trained a supervised machine learning model (called Validation algorithm) to consistently identify aggregates with a large range of sizes and intensities. We created a training dataset consisting of a sample of raw images and hand-drawn ground truth binaries. We defined the aggregate borders as the sharpest dividing line between the bright object interior and the baseline diffuse protein level. We extracted fourteen features from each raw image, using morphological operators designed to emphasize aggregates in images (Table S1). The ground truth binary, the raw image (labeled Feature 1), and the thirteen other image features were used to train our classification models (Figure 2A).
Figure 2.

SVM and decision tree algorithms developed and trained to identify the presence of protein aggregates of PAB-1 in pharynx
Validation algorithm (A) Ground truth binary images. Features extracted from raw images to train pixel classification algorithms. Decision tree algorithm more accurately identifies large, dim objects, whereas SVM algorithm more accurately identifies small, dim objects.
(B) Pixels in raw images are classified using both SVM and decision tree algorithm, two algorithms combined using OR statement. Validation ground truths constructed from 16 raw images.
(C) Total aggregates area and (D) total aggregates intensity plotted for ground truth vs. algorithm classification(R2 = 0.76 and R2 = 0.84, respectively).
To ensure model robustness, we included images of pharynxes with different baseline intensities, and with aggregates of different sizes, shapes, and intensities. As would be expected, bright aggregates present in a dim intensity background are easily identified. However, aggregates that are only slightly brighter than the surrounding diffuse fluorescent intensity were detected at a lower frequency. Because each aggregate type exhibits different characteristics, we tailored two classification models to identify different aggregate types. By incorporating the results from both, this approach allows detection of a wide range of protein aggregate sizes and intensities. We trained a support vector machine (SVM) algorithm, which specialized in small and dim aggregates. We also trained a decision tree algorithm which was able to identify large aggregates present in dim images (Figures 2A and 2B). Bright aggregates were identifiable by both algorithms. The information from both algorithms was integrated by an OR statement, composing our classification algorithm.
To validate the performance of our classification algorithm, we constructed a validation set consisting of sixteen images and their corresponding ground truth labels generated by manual annotation. We quantified the performance of the algorithm by determining total aggregate area and total aggregate intensity. Although some individual data points had a higher error, the algorithm-quantified aggregation levels in individual animals exhibited a strong correlation to the manually-annotated values (Figures 2C and 2D), which are also error-prone. To further assess the ability of this compound algorithm to measure protein aggregates, we imaged aging C. elegans populations at multiple days in wildtype and hsf-1(−) mutants, both previously shown to exhibit increased PAB-1 aggregation. The compound algorithm was able to recapitulate previously identified trends (Figure 3), further validating its applicability.25 These results indicate that the compound classification algorithm can reliably distinguish between the true levels of aggregate area and intensity throughout diverse images. As shown in Figure 3, this analysis reveals that age increases overall levels of PAB-1 aggregation, particularly at Day 7 once reproduction has stopped, when organismal fitness sharply decreases. In addition, significant levels of population heterogeneity are observed, in particular for the hsf-1(−) mutants, pointing toward protein aggregation being subject to stochastic processes.
Figure 3.

Increased levels of protein aggregation observed with age and in heat shock factor hsf-1(−) mutants
Increase in total aggregate area (A) and intensity (B) observed from Day 3 to Day 7 of adulthood. Increase in total protein aggregation area (C) and intensity (D) observed in hsf-1(sy411) mutant relative to wildtype transgenic strain ∗p<0.01, ∗∗p<0.001, ∗∗∗p<1 × 10⁻⁴ using Mann-Whitney U Test.
Automated genetic screening for increased protein aggregation in reproductively active adults
Following the development of algorithms for identification of aggregation mutants, we performed a high-throughput forward genetic screen for increased PAB-1 protein aggregation. Previous studies indicate that PAB-1 experiences a spike in aggregation following the end of reproduction, and that mutations causing lifespan extension would produce a delayed onset of PAB-1 aggregation.25 We hypothesized that mutants that undergo aging at a faster rate would display increases in aggregation earlier in life. We observed an increase in aggregation beginning at Days 5 and 7 of adulthood in wildtype worms (see Figures 3A and 3B). With the goal of identifying animals with an early increase in age-induced protein aggregation, we chose to screen for increased PAB-1 protein aggregation at Day 3 of adulthood. Because animals start reproduction at Day 1 of adulthood, it is necessary to inhibit reproduction or to separate adults from progeny. In adult-based phenotypic analysis, inhibition of reproduction is typically performed through exposure to FUdR or starting with mutants that exhibit conditional sterility. We circumvent the need for inhibition of reproduction by the use of microfluidics approaches to separate randomly-mutagenized parent populations from their progeny. To achieve this, we utilized a microfluidic filtering chip we previously developed for long-term C. elegans imaging studies.26 The device consists of a microfluidic chamber surrounded by evacuation channels that allow embryos and larvae to exit the device while maintaining the synchronized adult population within (Figure 4). The device also has an attached array of channels for on-chip imaging, but this section was not used for the purposes of this study. A mixed population of parent worms and progeny (ranging from embryonic to fourth larval stage) was loaded to the filtration chamber. Progeny were then removed by flowing buffer through the chamber, leaving a population composed almost entirely of Day 3 adults. Following the filtration step, we used a microfluidic worm sorting platform previously developed for automated phenotypic screening in young adult worms (Day 1 of adulthood).27 To screen larger Day 3 worms (70–80 μm versus 50–60 μm in diameter), we developed a scaled-up design (Figures 4 andS5). We also adapted an imaging and screening software previously used for automated screening of synaptic patterning mutants.27 Before screening, the filtered adult population was exposed to 100 μM tetramisole for immobilization. Animals were then introduced into the worm sorting device, where individual animals are trapped, imaged, and sorted through pneumatically-operated on-chip valves. Control of the microfluidic system was performed with a programmable custom pneumatic box for fluid flow and valve operation. Putative mutants of interest are collected in one outlet for further analysis.
Figure 4.

Process for semi-automatic forward genetic screening for protein aggregation mutants
(A) Initial parent (P0) generation of worms exposed to 100 mM EMS (Step 1). The population of second-generation progeny (F2) is grown to Day 3 of adulthood, where they undergo filtration to remove third-generation embryos and larvae (F3), producing a clean population of Day 3 adults (Step 2). Adult F2s undergo automated imaging and genetic screening in the microfluidic sorting chip (Step 3). Aggregation levels are quantified on-chip and animals with high levels of aggregation are isolated for follow-up analysis.
(B) Microfluidic system for filtration of progeny of Day 3 adults.
(C) Microfluidic worm-sorting chip for screening based on PAB-1 protein aggregation.
Animals were loaded, detected, imaged, and sorted in a high-throughput manner and without need for user interference. When worms were present in the field of view, they were identified through the baseline level of autofluorescence of a loaded animal, which triggers the closing of the inlet channel, as done in our prior work.27 Worms are randomly loaded into the imaging channel in one of two orientations: head-first or tail-first. Worm orientation was assessed through a mean intensity threshold, with head-first animals displaying a much higher mean intensity than tail-first animals, with the latter being automatically discarded. Aggregation levels were then quantified on-chip through construction of an image binary using the Screening Algorithm. Animals were sorted as putative mutants if quantitative measurements exceeded a set threshold, which was set as the 99th percentile of C. elegans aggregation levels in Day 3 wildtype adult populations. During the first portion of a screen, this value was set based on preliminary wildtype aggregation data of Day 3 adults. After 50 adults were screened, this value was reset based on a running calculation of aggregation data from the ongoing screen. Worms that were determined to exceed the aggregation threshold were sorted as positive and isolated for self-propagation. In a pilot screen, we processed 1902 F2 animals, and 60 were isolated as potential mutants. Of those, we recovered a total of 27 viable putative mutant strains that were subjected to further analysis. Some potential mutant worms were not recovered because of early ending of reproduction, mutations causing sterility, or being lost in transition out of the device.
Identification of true increased aggregation and lifespan mutants
Once we isolated putative mutants from the genetic screen, we sought to verify the increased aggregation phenotype in clonal populations. Given the observed heterogeneity in aging populations, large datasets are required to confirm differences between wildtype and mutant populations. To minimize the number of large datasets that needed to be acquired, we performed this process in two steps. First, we acquired a small image dataset from each potential mutant and wildtype, and quantified both total aggregate area and total aggregate intensity. We then calculated a two-sample Z score for each parameter and used this metric to rank strains (Table S2). The putative mutant lines with the ten highest z-scores for each aggregation metric (area and intensity) were then selected for acquisition of a second, larger set of aggregation data (Figures 5A, 5B, S6A and S6B). From these analyses, we identified five strains that exhibited significantly higher aggregation levels than wildtype in either metric (Figures 5A and 5B).
Figure 5.

Increased protein aggregation mutants yield lifespan mutants
(A) Total aggregate area, and (B) total aggregate intensity for increased protein aggregation mutants.
(C) Mutants 3 and 9 also exhibit reduced lifespan. ∗∗∗p<1E-4 using Mann-Whitney U Test for aggregation with Bonferroni correction, and logrank test for lifespan. Lifespan quantified at 25°C.
(D) Number of animals for each step in the screening process.
Although finding mutants with increased levels of protein aggregation is of value, our overall goal is to identify mutants that carry a reduction in lifespan as well as an increase in aggregation. For each of the five verified aggregation mutants, we conducted a lifelong survival assay and identified two mutants with a reduced lifespan (Figures 5C and 5D). Some mutants showed greatly increased aggregation but did not exhibit a corresponding decrease in lifespan (Figures S6C and S6D). In fact, the aggregation mutant with the highest Z score that we identified (Mutant 1), did not cause any lifespan alteration. It is thus not uncommon for mutants with strongly increased levels of PAB-1 aggregation to not carry a corresponding reduction in population lifespan. This could be a result of the screen yielding mutants with reduced resistance to stress or altered stress-granule formation, independent of aging rates. Alternatively, because the reporter is expressed only in the pharynx, it is possible we are observing pharyngeal-specific increases in aggregation that do not represent the state of the entire organism. Previously published data has lent evidence toward a reduced level of protein aggregation of the pharyngeal reporter being correlated with an extended lifespan.25 To further explore the potential association between reduced longevity and increased tagRFP:PAB-1 aggregation, we also examined PAB-1 aggregation in known reduced lifespan mutants. We selected kat-1 and jkk-1 through an unbiased search for reduced lifespan mutants in WormBase, to avoid targeting a specific known lifespan pathway. Unlike hsf-1 mutants, which exhibit reduced lifespan and increased aggregation,25 we observed no significant increase in aggregation in shortened lifespan kat-1 mutants and only a slight aggregation increase in jkk-1 mutants (Figure S7). These results suggests that although protein aggregation increases during aging,22 mutations that affect lifespan do not always impact PAB-1 aggregation. One possibility is that this reflects tissue-specific differences in aging.28,29 Because the reporter under study uses a pharynx-specific promoter, it is possible that protein aggregation in other tissues does not match the aggregation in the pharynx. For instance, aggregation could be increased in other tissues in kat-1 and jkk-1 mutants. Likewise, the identified mutants with increased protein aggregation could exhibit accelerated aging only in the pharynx and thus show no significant reduction in lifespan.
Analysis of health and aggregate characteristics in isolated mutants
To assess changes in healthspan, in the pharynx in particular, we evaluated the pumping rate, pharyngeal morphology, and thrashing rate of the wildtype, kat-1, M3, and M9 mutants. In all mutants, pharyngeal pumping declines faster than wildtype. M3 exhibits a sharp decrease in pumping rate at Day 9, whereas kat-1 and M9 are less affected (Figure 6A). Another indicator of pharynx health is based on morphology. Aged worms show structural changes that include the appearance of vacuole-like pits, bacterial plugging of the pharynx, and bending of the pharyngeal isthmus.30 We used a structural index to evaluate this decline: 1-least deteriorated, 2-somewhat deteriorated, and 3-most deteriorated (Figures 6B and S8). Our results indicate that morphological changes are observed starting at Day 6 of adulthood for all mutants, by Day 9 only strain M3 showed any significant difference, and by Day 12 all strains (including the wildtype) showed similar structural decline. We also measured thrashing rate in animals swimming in liquid and observed a significant decline for M3 and M9, starting at Day 3 (Figure 6C). Notably, kat-1 did not exhibit a lower thrashing frequency than wildtype until Day 9, suggesting it does not exhibit accelerated locomotion decline although it is short-lived. As mentioned earlier, although pharyngeal morphology changed quickly for kat-1, pharyngeal pumping did not, suggesting a reduced aging rate in muscle-function, which could be linked to the lack of increased aggregation. We also confirmed the reduced lifespan of the tagRFP:PAB-1 – expressing kat-1mutant (Figure 6D), and corroborated this phenotype for mutants M3 and M9. Notably, strain M3 has the shortest lifespan and also exhibits the most drastic reduction in healthspan. We thus selected M3 as our top candidate for genotyping.
Figure 6.

Identified short-lived mutants exhibit accelerated aging
(A) Pumping rates for strain M3 shows a sharp decrease after Day 6 of adulthood. Strains kat-1(−) and M9 show a similar trend by Day 12.
(B) Movement in liquid, measured as the thrashing frequency shows an early decline by day 3 of adulthood in mutant animals.
(C) A structural index of 1 (least deteriorated) to 3 (most deteriorated) shows that the mutant strains have an early onset of structural decline in the pharynx respect to the wildtype strain with the earliest difference observed at day 6 of adulthood.
(D) Lifespan at 20°C for strains M3 and M9 is diminished, with strain M3 showing the shortest lifespan of the mutant strains. ANOVA single factor followed by t-test with Bonferroni correction, p < 0.01 (∗∗), p < 0.001 (∗∗∗), error bars are SEM Mean lifespans are wildtype = 18.7 days; kat-1(−) = 13.1 days; M3 = 8.9 days; M9 = 13.6 days.
We next aimed to assess whether the mechanisms driving aggregation in the identified mutants could be different, by analyzing aggregate morphology. Prior work found a significant increase in mean size with age, but this effect was not induced by rapid heat stress25which is expected to lead to small stress granules. To test if our identified lifespan mutants produced a similar increase in aggregate size, we examined the areas of a random sample of 100 aggregates from the wildtype and the five identified mutant strains at Day 3 of adulthood. We found that none of the mutants, regardless of any decrease in lifespan, exhibited a significant increase in mean aggregate area (Figure 7A). In contrast, we observed a significant increase in mean aggregate area for older wildtype worms (Day 7 of adulthood) as compared to late-reproductive worms (Day 3 of adulthood) (Figure 7B). We hypothesize that this increase in mean aggregate size is caused by the gradual growth of initially small aggregates through accumulation of aggregate protein over time. In contrast, in younger mutants, there is less time for aggregates to accumulate, though the propensity for PAB-1 to aggregate is high. Of interest, we found that hsf-1(−) mutants on Day 3 of adulthood did produce a significant increase in mean aggregate size, albeit less drastic than for naturally aging worms (Figure 7B). Potentially, this could indicate that some aggregation mutants can produce larger aggregates earlier in life, in which case it would be unlikely for the mutants identified from the screen to carry a loss-of-function in hsf-1. Another possibility is that the increased aggregation in the identified mutants corresponds to a heightened propensity to form stress granules, rather than accelerated formation of aging-associated aggregates. Stress granules are typically small objects of 0.1–2 μm,31which corresponds to the average aggregate size in the identified mutants. Nonetheless, lifespan could also be tied to the process of stress granule formation (or dissociation), and thus small aggregates could also serve as a proxy for the identification of altered aging rates even if only as a correlative metric.
Figure 7.

Aggregate size in mutants and aged wildtypes
(A) Average area of a sample of 100 random PAB-1 aggregates from wildtype and each mutant with an increase in total aggregate area. No significant difference in size observed for any mutant.
(B) Average area of a sample of 100 PAB-1 aggregates obtained from wildtype animals at Day 3, wildtype animals at Day 7, and hsf-1(−) mutants at Day 3 of adulthood. Aged and hsf-1(sy411) animals exhibit larger aggregates (∗∗p<0.01 using Mann-Whitney U Test, Bonferroni correction for (A)).
To further explore the nature of the aggregates, we carried out fluorescence recovery after photobleaching (FRAP) to determine the mobility of the components within the observed aggregates, as stress granules are dynamic whereas aging-associated aggregates are not. We studied the mobility in the largest aggregates for wildtype, M3, and M9 mutants at Day 7 of adulthood and quantified the fraction of immobile aggregates. Aggregates with little to no recovery within the first 30 s were defined as immobile aggregates (Figure 8A). Both the M3 and M9 mutants showed a higher proportion of immobile aggregates (Figures 8B and 8C), expected for older animals. These findings suggest that although Day 3 adults exhibit aggregate distributions similar to wildtype in terms of size, by Day 7 the aggregates appear to be associated with accelerated aging.
Figure 8.

Short-lived mutants exhibit immobile aggregates
(A) Representative images of tagRFP:PAB-1 aggregates in the pharynx pre-, post- and 30s post-bleaching. White circle indicates area targeted for bleaching. Fluorescence fails to recover within the first 30s after bleaching. Scale bars are 1μm.
(B) The fraction of aggregates assayed in each strain that are mobile or immobile for day 7 adults. Mutant strains had a higher fraction of immobile aggregates when compared to wildtype.
(C) Mean RFI of immobile aggregates for each strain. Immobile aggregates fail to recover fluorescence over time. Bars indicate std. error.
Identification of lifespan-altering mutation points to an uncharacterized gene
To identify the mutation associated with lifespan change, we followed a sibling subtraction method.32 We first backcrossed the isolated mutants to reduce the number of non-causative mutations. Mutant lines that maintained high aggregation at Day 3 of adulthood were selected for subsequent rounds of backcrossing. After three rounds of backcrossing, we confirmed a reduced lifespan of M3(x3) (Figure S9), suggesting aggregation and lifespan phenotypes are in fact linked for this mutant. The mean lifespan for the wildtype was 19.3 and 14.6 days for M3(x3). The sibling subtraction approach was performed using five sibling strains for each pool (wildtype and homozygous mutant), as well as by sequencing the parent strain. This analysis revealed a candidate list of ten mutations (Table S3). Of these, only one was annotated to carry a change with a high putative impact: a T>G change that results in a lost start site in gene R01H2.8 in Chromosome III. This gene has been thus far uncharacterized and has no reported phenotypes. Seven other mutations of a predicted moderate effect were also found in Ch III, suggesting these are potentially linked. Of these, one mutation affects hsp-110. RNAi-based silencing of hsp-110 has been reported to reduce the lifespan of age-1 mutants by 12%, but not that of wildtypes.33 The remaining two mutations are also of moderate effect, both adjacent in the ttn-1 gene. Our top candidate hit is thus R01H2.8, but its causative effect is to be corroborated in future work, with hsp-110 as our next candidate.
Discussion
In this study, we employed image analysis and machine learning-based classification techniques to accurately quantify aggregation levels of the tagRFP:PAB-1 reporter in diverse C. elegans populations. The largest challenge in accurately quantifying aggregation is defining the presence of an aggregate. We define protein aggregates visually as sharp puncta of fluorescence that are brighter than the broad level of protein expression in the pharynx. From these visual identification criteria, we were able to define image filtering operations that could identify the presence of protein aggregates based on the object's size and intensity, and the pharyngeal background intensity. Although manual annotation is prone to subjective classification bias, the algorithms developed here can consistently identify aggregates in diverse image types. Being fast, accurate, and consistent, these methods enabled the identification of general increases in aggregation, as well as rapid, automated, on-chip quantification and sorting based on aggregation levels in mutagenized worm populations. Compounding the results of two machine learning techniques improved quantification of protein aggregation levels in dimmer regions of the pharynx, where aggregate identification is more challenging, and enabled identification of aggregates of different intensities and in images with a wide range of diffuse protein intensities and object sizes. To analyze the performance of our algorithms, we chose to calculate the areas and intensities determined from the classification algorithm (predicted) vs. the visually constructed ground truth (actual) for our validation data, because our goal was to use these metrics to differentiate between strains of baseline (wildtype) and increased aggregation. Although we have trained our algorithm specifically for the PAB-1 protein, this method can be adapted to the quantification of other aggregating proteins.
In this study, we used PAB-1 aggregation as a proxy phenotype to detect lifespan mutants. Previous work reported trends of increased protein aggregation following the reproductive period, based on categorical classification of aggregation levels. Our analysis recapitulated this trend, and in addition enabled quantifying differences in protein aggregation beyond what was identifiable in categorical datasets. Using microfluidic technology, screening for increases in protein aggregation in a systematic manner without need for human decision making or operational interference was made possible. Moreover, in this work we developed a new method for identifying aging phenotypes in the late reproductive stage while circumventing the need for genetic or chemical sterilization, which could be a confounding factor on aggregation or the aging process.34 This method of screening opens up the possibility of searching for mutants that exhibit phenotypes late in life, without the need of temporary sterilization. In this pilot screen, we processed 1902 F2 animals, but we envision that scaling up to perform saturated screens is possible. Our throughput was approximately 100 animals/hr, and the limiting factor was the speed of image processing and the number of animals that fit in the filtration chamber. Future optimization to increase the filtration chamber output and faster image processing through the use of GPUs or optimized algorithms should enable improving throughput. Specifically for identification of lifespan mutants, this work shows that aggregation alone does not always correlate with longevity. Although we observed a sufficiently high rate of mutant identification, there are improvements that could be made to increase the rate at which lifespan mutants are identified, such as the simultaneous use of multiple markers of aging. We have shown that screening for aging phenotypes during the late reproductive period can effectively identify mutants with an altered lifespan. With the use of new or existing software for phenotype quantification, our method can be applied to other phenotypes related to aging. By conducting similar screens, the genetic networks that connect other phenotypes with the overall decline with age can be identified.
Screening of approximately two thousand animals yielded two lifespan mutants, a rate of 0.1%, while resulting in an aggregation mutant rate of 0.25%. Although we focused on the top ten highest aggregating mutants out of the 27 potential mutants recovered from the screen, it is possible that more aggregation or lifespan mutants could be identified on further study of the remaining putative mutants. Amongst those studied, several strains cause an alteration in aggregation levels but not in lifespan. PAB-1 protein forms stress granules in response to heat shock,25 so it is possible that some of the identified mutations cause an alteration in heat shock response as opposed to an alteration in protein insolubility. However, heat and other stress responses have been associated with lifespan, though the correlation is not perfect.33,35 Stressors can have opposing effects on lifespan: low levels can extend lifespan through hormesis,36 whereas high levels can be detrimental or even lethal.35 Likely, the association between aggregation and lifespan is dependent on environmental factors and exposure to stress, which could be explored in future work.
In this study, we have developed a method for identifying mutants with a reduction in lifespan by screening for mutants that undergo an increase in protein aggregation during the late reproductive stage. We developed a semi-automated pipeline that makes use of microfluidic lab-on-a-chip technologies to maintain age-synchronized parental worm populations which undergo automated aggregation quantification and on-chip sorting. This approach enables an otherwise unfeasible search that would require manual sorting of animals based on visual phenotypic classification. These experiments are highly intensive and require hours of manual labor to conduct. For PAB-1 protein aggregation and other high-resolution phenotypes, phenotypic quantification can be even more time consuming. Through further investigation of identified aggregation and aging mutants, we aim to identify genes and pathways which regulate C. elegans aging and proteostasis networks. Through increased understanding of the genetics of aging obtained through screening, there is potential to better understand how natural aging affects human health, and how humans can live longer and higher quality lives through advances in science and medicine.
Limitations of the study
In this work, we have developed software for assessing the level of aggregation within individual objects. As described in the results section, the Validation Algorithm can robustly identify differences in aggregation between populations, and in many instances can distinguish between small total aggregation differences within individual animals. However, our algorithm is more limited in its ability to determine the true size of aggregates. We trained the classification algorithms using manually-annotated images, and although we pre-defined the characteristics of an aggregate, this could result in biased and inconsistent labeling. For instance, it was extremely difficult to consistently identify the exact location of the aggregate borders. In summary, this algorithm can be used to measure relative aggregation levels, rather than to quantify the exact amounts of aggregated protein. In addition, we performed our genetic screen with the less accurate Screening Algorithm, which could raise concerns of missed mutants with elevated aggregation. These concerns are rebutted by the high positive hit rate of recovered true aggregation mutants: Out of 27 recovered mutant lines, five were determined to be true aggregation mutants. Smooth operation of the device required both functional optimization and practice. It was also necessary to account for disruptions in the operation of the device, most commonly because of clogging from small pieces of debris in the inlet media. For these instances, we incorporated an automated high-pressure flush cycle to dislodge the obstructing object. If these cycles were unsuccessful at dislodging the debris, a manual dislodge was necessary. In addition, this approach could also yield stress mutants, as well as mutations that directly affect the propensity of PAB-1 or tagRFP to aggregate, rather than modulating organismal proteostasis or longevity pathways. Future genotypic analysis will enable addressing this question. Finally, one limitation of this approach is that relying on noisy phenotypes can make genotyping difficult. We used tagRFP:PAB-1 aggregation as a phenotypic readout for backcrossing and pooling for whole genome sequencing. We were unfortunately unable to recover a mutant with increased aggregation after three rounds of backcrossing for M9. This likely occurred because of the small progeny population sizes analyzed for protein aggregation (n ∼20). Hence, we suggest that phenotype calling be performed on larger sample sizes when using heterogeneous phenotypes, such as the one presented here. An alternative would be to use lifespan in the backcrossing steps, which would significantly extend the genotyping process and is susceptible to multiple modes of failure.
STAR★Methods
Key resources table
| REAGENT or RESOURCE | SOURCE | IDENTIFIER |
|---|---|---|
| Bacterial and virus strains | ||
| E. coli: Strain OP50 | CGC | RRID:WB-STRAIN:WBStrain00041969 |
| Chemicals, peptides, and recombinant proteins | ||
| Ethyl methanesulfonate 99% | Fisher Scientific | AAA1293806 |
| SU-8 Photoresist | Kayaku Advanced Materials | Y111077 0500L1GL |
| 1-methoxy-2-propanol acetate | VWR (Avantor Performance Materials US) | JT6343-5 |
| 1H,1H,2H,2H-Perfluorooctyltrichlorosilane | Fisher Scientific | AAL1660609 |
| Sylgard 184 Kit | Ellsworth Adhesives | 184 SIL ELAST KIT 3.9KG |
| Critical commercial assays | ||
| Qiagen DNeasy Blood and Tissue Kit | Qiagen | 69504 |
| Experimental models: Organisms/strains | ||
| C. elegans: Strain DCD214 [myo-2p::tagRFP::pab-1] | CGC | RRID:WB-STRAIN: WBStrain00005606 |
| C. elegans: Strain PS3551 [hsf-1(sy411)] | CGC | RRID:WB-STRAIN: WBStrain00030901 |
| C. elegans: Strain KU2 [jkk1(km2)] | CGC | RRID:WB-STRAIN: WBStrain00024034 |
| C. elegans: Strain VS24 [kat-1(tm1037)] | CGC | RRID:WB-STRAIN: WBStrain00040200 |
| Software and algorithms | ||
| ImageJ | NIH | RRID: SCR_003070 |
| OASIS 2 | Han et al.41 | https://sbi.postech.ac.kr/oasis/ |
| AutoCAD | AutoDesk | https://www.autodesk.com/products/autocad/overview |
| Trimmomatic version 0.39 | Bolger et al.42 | RRID:SCR_011848 |
| Picard (2.27.4), | Broad Institute | https://broadinstitute.github.io/picard/ |
| GATK (Genome Analysis Toolkit, version 4.2.6.1) | Broad Institute | https://gatk.broadinstitute.org/hc/en-us |
| Microfluidic Imaging and Screening Software | This publication | github.com/asanmiguel/AggregationScreening |
| Aggregation Image Analysis Software | This publication | github.com/asanmiguel/AggregationScreening |
Resource availability
Lead contact
Further information and requests for resources and reagents should be directed to and will be fulfilled by the lead contact, Adriana San Miguel (asanmig@ncsu.edu).
Materials availability
Mutant strains are available upon request.
Experimental model and subject details
Caenorhabditis elegans
All animals used in experiments are hermaphrodites, with the exception of creating crossed strains, for which male animals are used. All experiments including genetic screening, except where specified differently, are conducted on the third day of adulthood, defined as 48–72 hours following the end of the fourth larval stage of development.
All animals used in this study are derived from the strain DCD214 [myo-2p::tagRFP::pab-1] (RRID:WB-STRAIN:WBStrain00005606) which was obtained from the Caenorhabditis Genetics Center (CGC). Crossed strains are generated by mating the DCD214 strain with PS3551 [hsf-1(sy411)], KU2 [jkk1(km2)], and VS24 [kat-1(tm1037)], each also obtained from the CGC. Mutants were obtained through random mutagenesis by exposing animals to the mutagen EMS and by screening for animals with elevated aggregation levels of the reporter tagRFP::PAB-1.
Method details
Worm culture and growth
Worms were cultured on NGM plates according to standard protocols37 on lawns of E. coli strain OP50. Worms were grown at 20°C, except for lifespan experiments, where they were grown at 20°C until Day 1 of adulthood, and then transferred to 25°C. Day 1 is defined as the first 24 hours following the conclusion of the L4 larval stage.
Image acquisition
Three different imaging settings were used for image acquisition. Setting A was used for the acquisition of all screening images, and the first round of aggregation data (Table S1). Setting B was used for acquisition of the hsf-1(−)data sets (Figures 2C and 2D). Setting C was used to acquire the wildtype aging, jkk-1(−), and kat-1(−)data set, and the second round of aggregation data (Figures 2A, 2B, 4, and S7). Image sets were scaled to the size and intensity of Setting B to account for differences between the settings as follows: Images acquired using Setting A were resized by a factor of 0.635 using the MATLAB “imresize” function to account for the change in magnification. The pixel intensity of images acquired using Setting C was multiplied by a factor of 0.5 to account for differences in mean image intensity. Images were acquired with each setting as follows:
Setting A
Images were acquired using a Leica DMi8 microscope and an Orca Flash 4.0 v3 CMOS camera. Fluorescent TagRFP protein was visualized at 630 nm wavelength and excited at a wavelength of 560 nm from a Lumencor Spectra X Light Engine, and filtered using a Leica TXR filter cube. Images were acquired at a magnification of 63x. During on-chip screening, images were acquired through immobilization of worms exposed to tetramisole in microfluidic channels. For initial aggregation assays, images were acquired by placing worms on pads made from 2% agarose dissolved in water between two glass slides, and were immobilized using 2 mM tetramisole dissolved in M9 buffer. Image z-stacks of 70 1-μm steps were acquired at an exposure time of 60 ms and were saved as a maximum intensity projection in a .tiff format. Image acquisition was controlled via a MATLAB custom graphical user interface.
Setting B
Images were acquired using a Leica DMi8 microscope and an Orca Fusion C14440 CMOS camera. Fluorescent TagRFP protein was visualized at 630 nm wavelength and excited at a wavelength of 560 nm from a Lumencor Spectra X Light Engine, and filtered using a Leica TXR filter cube. Images were acquired at a magnification of 40x. Images were acquired by placing worms on pads made from 2% agarose dissolved in water between two glass slides and were immobilized using 2 mM tetramisole dissolved in M9 buffer. Image z-stacks of 100 1-μm steps were acquired at an exposure time of 60 ms and were saved as a maximum intensity projection in a .tiff format. Image acquisition was controlled via a MATLAB custom graphical user interface.
Setting C
Images were acquired using a Leica DMi8 microscope and an Orca D2 CCD camera. Fluorescent TagRFP protein was visualized at 630 nm wavelength induced through excitation of samples from light at a wavelength of 560 nm from a Leica EL6000 metal halide external light source and filtered using a TXR filter cube. Images were acquired at a magnification of 40x. Images were acquired by placing worms on pads made from 2% agarose dissolved in water between two glass slides and were immobilized using 2 mM tetramisole dissolved in M9 buffer. Image z-stacks of 70 1-μm steps were acquired at an exposure time of 60 ms and were saved as a maximum intensity projection in a .tiff format. Image acquisition was controlled via a MATLAB custom graphical user interface.
Image processing
TIFF images were imported into MATLAB 16-bit integer arrays. Images that displayed blurred edges or asymmetric fluorescent protein localization were excluded from analysis. Images were split into anterior and posterior portions, and all image processing was performed on the anterior images (Figure S1). All images were processed through code developed in MATLAB. Image binary ground truths were created by manually drawing over aggregate objects using Fiji ImageJ analysis software.
Microfluidic device fabrication and operation
Silicone master molds were fabricated in a cleanroom using SU-8 photoresist26,27,38 spin-coated on silicon wafers. Master molds with multiple-layered features were fabricated through UV photolithography using an MA6 contact aligner, and unexposed photoresist was dissolved using 1-methoxy-2-propanol acetate. SU-8 mold features were exposed to vaporized silane following the development step. Device 1 refers to the device used for progeny filtration, and Device 2 refers to the device used for worm imaging and sorting. Microfluidic devices were fabricated using a mixture of SYLGARD 184 polydimethylsiloxane (PDMS) elastomer and crosslinker. A thin layer at the base of Device 2 was fabricated at a ratio of 20:1 elastomer base to crosslinker, while the remainder of Device 2 and all of Device 1 were fabricated using a 10:1 ratio. Mixtures of elastomer base and crosslinker were degassed in a vacuum-sealed chamber prior to molding to remove gas bubbles. Devices were cured by baking at 70°C overnight, and then plasma bonded to glass slides using a plasma cleaner. Devices were operated using a controllable pneumatic pressure box built in-house and operated using MATLAB GUI software.
Genetic screening
Random mutagenesis was performed on a population of wild-type worms by exposure to ethyl methanesulfonate (EMS) using standard protocols.39 Worms were grown to the F2 generation following mutagenesis at temperatures ranging from 15 to 25°C to stagger population growth. Worms were then age-synchronized using bleach solution (via standard protocols) and grown at 20°C until the population reaches Day 3 of adulthood. Worms are washed from the plates using M9 buffer and loaded into the culture chamber of Device 1 (Figure 4). Flow was induced to flush progeny out of the device, leaving a population of exclusively Day 3 adults for screening. Adult worms were then partially immobilized using tetramisole (∼100 μM) and loaded into the inlet of Device 2 for on-chip imaging (Figure S5). Valve channels were filled with a 1:1 mixture of water and glycerol and operated using the pneumatic pressure box. A MATLAB graphical user interface was configured to control the device and perform automated screening. All code is available at Github (github.comasanmiguel/AggregationScreening). As worms were loaded into the imaging channel of Device 2, the real-time detection of fluorescent light triggered the closing of the inlet valve. Z-stacks of immobilized were then acquired and compressed to a maximum projection image. Aggregation level was then quantified on-chip using code developed in MATLAB. Worms were sorted as potential mutants based on exceeding either a user-set total intensity value or total large intensity value (total intensity of objects that exceed a user-specified area). The threshold was set either by direct user input based on acquired experimental data, or by using the calculated 99th percentile of data previously acquired in the ongoing screen. Sorted worms were diverted to one of two outlets by on-chip valves based on the measured aggregation level. Worms that exceeded the defined threshold were sent to a collection tube from where they were placed on individual growth plates where they produce putative mutant populations. Worms not sorted as putative mutants were discarded.
Lifespan analysis
Worms were age-synchronized and grown at 20°C until reaching Day 1 of adulthood. Approximately 50 to 200 worms from each population were then counted and picked to a new plate and placed at 20 or 25°C (as stated in each figure). For each subsequent day, the number of living, dead, and censored worms were counted. Living worms are defined as worms that responded to a gentle touch from a platinum wire and dead worms are defined as those that did not respond to the same stimulus. Worms were censored if they were not visible (i.e. crawled off the plate or under the agar) or displayed signs of internal hatching. Signs of internal hatching include internal growth of larvae (“bag of worms”) as well as worms that undergo apparent rupture. Worms were picked to new plates daily during the egg-laying phase. Following egg-laying, worms were picked to new plates when plates begin to dry or in rare cases where small fungal contaminants appeared. In some instances, lifespan analysis was carried out in plates supplemented with FUdR (5′-fluorodeoxyuridine). In this case, worms at the L4 stage were transferred to a 150 μm FUdR plate and placed at 20°C. Worms were transferred to new 150 μm FUdR plates as necessary, and then to a non-FUdR plate once the reproductive window had passed.
Analysis of pumping rates
Pharyngeal pumping was measured by counting the number of pharyngeal contractions in the terminal bulb over a period of 20 seconds. This was performed on NGM plates with lawns of OP50 bacteria using a Leica M165 FC microscope. Measurements were taken for 10 animals per strain on days 1, 3, 6, 9, and 12 of adulthood.
Locomotion assay
On days 1, 3, 6, 9, and 12 of adulthood, 10 animals per strain were picked from NGM plates and transferred to 24-well plates containing 1 mL of M9 solution in each well. Animals were left to acclimate for 1 minute, and then 20 sec videos were recorded using a Lumenera Infinity 3 camera mounted on a Leica M165 FC microscope. The number of thrashes were then counted through user inspection.
Analysis of pharynx morphology
On days 1, 3, 6, 9, 12 of adulthood, 10 animals for each strain were mounted on 2% agarose pads and paralyzed with 1mM tetramisole in M9 buffer. Bright field images were collected of the animal’s head focusing on the pharynx using a Hamamatsu Orca Flash 4.0 16-bit digital CMOS camera connected to a Leica DMi8 microscope at 63x magnification. Each image was presented to group-blind respondents who scored the structure as 1—least, 2—somewhat, or 3—most deteriorated. Five respondents’ scores for each animal were averaged to give a single morphological deterioration score.
FRAP analysis
Animals were age-synchronized and grown to day 7 of adulthood at 20°C. Worms were then anesthetized on agarose pads using a combination of tetramisole and 0.1μm polystyrene beads. Agarose pads were prepared using 50uL of a 2% agarose solution. A 10 mM aqueous tetramisole solution was mixed in equal part with a 2.6% solution of .1μm polystyrene beads (Polybead, Cat# 00876-15, Lot# 714719) to reach final concentrations of 5mM and 1.3% respectively. A 5μL drop of this solution was added onto the agarose pad and spread before picking 20–25 worms into the drop. FRAP analysis was performed using a 561nm laser, a 40x objective (1.1 N.A., Water Immersion, C-Apo) and a Zeiss LSM 880 Confocal with Airyscan (CMIF, NCSU). Images were collected for 40 time points, with 5 second intervals. Image collection settings: 0.6% laser power, 3μm pinhole, Gain of 800. Bleaching occurred between the 3rd and 4th time point. Bleach settings: 75% laser power, 20 bleach iterations. Relative fluorescence intensity (RFI) was calculated as described previously(21): RFI=(Tt/Ct)/(T0/C0). Mobile aggregates were defined as aggregates with an RFI greater than 0.05 at 30s post-bleaching.
Mutation identification
To identify the causative mutation (del3) in mutant M3, we used the sibling subtraction method(32). We first performed three rounds of backcrossing, where the M3 mutant was crossed with the parent DCD214 strain. 16 F2 individuals from the cross were placed in individual plates and allowed to self-fertilize. F3 progeny from each plate was then bleached to age-synchronize the populations, and allowed to grow until day 3 of adulthood. We then performed imaging to quantify aggregation in the pharynx using traditional agarose pads and tetramisole immobilization. The population with the highest levels of aggregation was selected for subsequent crossing rounds. Progeny of the third outcrossing was used for whole genome sequencing by pooling populations that displayed a homozygous wildtype phenotype and a homozygous mutant phenotype, based on aggregate area and intensity metrics extracted from our segmentation pipeline. We then performed whole genome sequencing on the parent strain (DCD214), a pooled sample of 5 populations with a wildtype phenotype, and a pooled sample of 5 populations with a mutant phenotype. DNA was extracted using the Qiagen DNeasy Blood and Tissue Kit. 2 plates of recently starved worms were washed and transferred into 5 mL of M9. Worms were left to settle on ice for 1 hr, and again for 15 minutes after removing the supernatant and replenishing with M9. Worms were then stored at −80°C overnight. Samples were thawed and the supernatant removed. 180 μL of ATL buffer were added, and then 3 cycles of freeze/thaw at −20°C/37°C were performed. After vortexing for 15 s, 20 μL of Proteinase K were added. The sample was then shaken at 56°C for 1 hr. If no worms were observed, the next step was performed, otherwise incubation was extended. 4μL of RNAse (100 mg/ml) were added and incubated at room temperature for 30 min. Next, 200 μL of AL buffer were added, followed by vortexing, and incubation with shaking at 56°C for 10 min 200 μL of pure ethanol were added. After vortexing, the sample was centrifuged at 14,000 rpm for 2 min, and then transferred to a column. After centrifuging at 10,000 rpm for 1 min, the spin column was transferred to a collection tube. Then 500 μL of AW1 were added and centrifuged at 10,000 rpm for 1 min. The spin column was then transferred to a new collection tube where 500 μL of AW2 were added and centrifuged at 14,800 rpm for 3 min. The column was then transferred to a microcentrifuge tube, where 100 μL of elution buffer AE were added, incubated at room temperature for 1 min, and then centrifuged at 10,000 rpm for 1 min.
Sequencing was performed on an Illumina NovaSeq platform. Bioinformatic analysis was carried out as done before40 and described next. We used Trimmomatic version 0.39 to remove adapters and low quality trailing and leading bases. We next used the Burrows-Wheeler Aligner to align the reads to the C. elegans genome (ce11). We filtered out non-aligned pairs on Galaxy (usegalaxy.org) with the Filter Sam tool. We then used Picard tools (2.27.4) to create a sequence dictionary for the reference genome (ce11), which was added to the aligned SAM file. We used Picard to sort the SAM file by coordinate and then to add read group names (provided as sample names) and to convert the file to BAM. We marked duplicates with Picard and then used BamTools to index the file. We then performed variant discovery with GATK (Genome Analysis Toolkit, version 4.2.6.1). We used the GATK Haplotypecaller for each sample to obtain a gVCF file (genomic variant call format). We then combined the three gVCF files using GATK CombineGVCFs. Then we performed GATK GenotypeGVCFs on the combined file. Next, we added variant annotations and effect predictions using the SnpEff Tool, using WBcel235.105 as annotation file. The data was then converted to a table using GATK VariantsToTable in a tab (tab-delimited) file. The table provides annotation information and allelic depth for each sample. Using this information, we then calculated the frequency of the alternative/reference variant according the allelic depth. We filtered out variants according to the following rule (frequency in DCD214 < 0.2, frequency in wildtype pool <0.2, frequency in mutant pool >0.8). We also only kept variants that resulted in HIGH or MODERATE effects. This resulted in a list of 10 variants (Table S3), of which only one is predicted to have a HIGH functional effect. This variant is a T>G change in position 7069104 of Chromosome III, which results in a lost start site, and is thus our top candidate. This mutation (del3), corresponds to gene R01H2.8. We also identified a missense mutation (Gly235Asp) in hsp-110, which has been reported to extend lifespan upon RNAi silencing.33
Quantification and statistical analysis
P-values for assays of total aggregation and mean aggregate size were determined using the Mann-Whitney U statistical test with Bonferroni correction if multiple comparisons were performed. Mutant lifespan data was compared to wild-type data using the log-rank statistical test to determine P-values, and to identify worms with reduced lifespan using the OASIS 2 tool.41 A significant test result was defined as that with a p-value below 0.05. Analysis of pharyngeal pumping, structure index, and locomotion was carried out with 1-factor ANOVA followed by t-test with Bonferroni correction.
Acknowledgments
C. elegans strains were provided by the CGC, which is funded by NIH Office of Research Infrastructure Programs (P40 OD010440). This work was supported in part by the U.S. National Institutes of Health (NIH) grants R00AG046911 and R21AG059099. We thank Braveen Joseph and David Fay for useful consultation on the sibling subtraction approach. We thank Rodrigo Mayorga Castelan for help with optimization of DNA extraction protocols.
Author contributions
D.F.M. performed experiments, developed image analysis algorithms, microfluidic devices, screening pipeline, and analyzed images. J.H. measured health metrics. J.D.L. carried out FRAP analysis. J.P.C. carried out backcrosses and lifespan analysis. A.S.M. supervised the study. D.F.M. and A.S.M. conceptualized the work. A.S.M. carried out bioinformatics analysis and secured funding. All authors contributed to figures and manuscript writing.
Declaration of interests
The authors declare no competing interests.
Published: November 18, 2022
Footnotes
Supplemental information can be found online at https://doi.org/10.1016/j.isci.2022.105460.
Supplemental information
List includes mutations classified as moderate or high impact, filtered according to the following allele frequencies: parent line DCD214 < 0.2, mutant pool > 0.8, wildtype pool < 0.2.
Data and code availability
All data reported in this paper will be shared by the lead contact upon request.
All original code has been deposited at Github and is publicly available as of the date of publication. DOIs are listed in the key resources table.
Any additional information required to reanalyze the data reported in this paper is available from the lead contact upon request.
References
- 1.Uno M., Nishida E. Lifespan-regulating genes in C. elegans. NPJ Aging Mech. Dis. 2016;2:16010. doi: 10.1038/npjamd.2016.10. [DOI] [PMC free article] [PubMed] [Google Scholar]
- 2.Keyfitz N., Flieger W. University of Chicago Press; 1990. World Population Growth and Aging. [Google Scholar]
- 3.Kenyon C., Chang J., Gensch E., Rudner A., Tabtiang R. A C. elegans mutant that lives twice as long as wild type. Nature. 1993;366:461–464. doi: 10.1038/366461a0. [DOI] [PubMed] [Google Scholar]
- 4.Hamilton B., Dong Y., Shindo M., Liu W., Odell I., Ruvkun G., Lee S.S. A Systematic RNAi Screen for Longevity Genes in C. elegans. Genes. Dev. 2005;19:1544–1555. doi: 10.1101/gad.1308205. [DOI] [PMC free article] [PubMed] [Google Scholar]
- 5.Lee S.S., Lee R.Y.N., Fraser A.G., Kamath R.S., Ahringer J., Ruvkun G. A systematic RNAi screen identifies a critical role for mitochondria in C. elegans longevity. Nat. Genet. 2003;33:40–48. doi: 10.1038/ng1056. [DOI] [PubMed] [Google Scholar]
- 6.Yanos M.E., Bennett C.F., Kaeberlein M., Kaeberlein M. Genome-wide RNAi longevity screens in Caenorhabditis elegans. Curr. Genom. 2012;13:508–518. doi: 10.2174/138920212803251391. [DOI] [PMC free article] [PubMed] [Google Scholar]
- 7.Klass M.R. A method for the isolation of longevity mutants in the nematode Caenorhabditis elegans and initial results. Mech. Ageing Dev. 1983;22:279–286. doi: 10.1016/0047-6374(83)90082-9. [DOI] [PubMed] [Google Scholar]
- 8.Friedman D.B., Johnson T.E. Three mutants that extend both mean and maximum life span of the nematode, Caenorhabditis elegans, define the age-1 gene. J. Gerontol. 1988;43:B102–B109. doi: 10.1093/geronj/43.4.B102. [DOI] [PubMed] [Google Scholar]
- 9.Derisbourg M.J., Wester L.E., Baddi R., Denzel M.S. Mutagenesis screen uncovers lifespan extension through integrated stress response inhibition without reduced mRNA translation. Nat. Commun. 2021;12:1678. doi: 10.1038/s41467-021-21743-x. [DOI] [PMC free article] [PubMed] [Google Scholar]
- 10.Corsi A.K., Wightman B., Chalfie M. A Transparent window into biology: a primer on Caenorhabditis elegans. WormBook. 2015;200:387–407. doi: 10.1895/wormbook.1.177.1. [DOI] [PMC free article] [PubMed] [Google Scholar]
- 11.AhringerJ. (ed.), Reverse genetics. WormBook. 10.1895/wormbook.1.47.1
- 12.Hansen M., Hsu A.L., Dillin A., Kenyon C. New genes tied to endocrine, metabolic, and dietary regulation of lifespan from a Caenorhabditis elegans genomic RNAi screen. PLoS Genet. 2005;1:119–128. doi: 10.1371/journal.pgen.0010017. [DOI] [PMC free article] [PubMed] [Google Scholar]
- 13.Jorgensen E.M., Mango S.E. The art and design of genetic screens: Caenorhabditis elegans. Nat. Rev. Genet. 2002;3:356–369. doi: 10.1038/nrg794. [DOI] [PubMed] [Google Scholar]
- 14.Lehner B., Tischler J., Fraser A.G. RNAi screens in Caenorhabditis elegans in a 96-well liquid format and their application to the systematic identification of genetic interactions. Nat. Protoc. 2006;1:1617–1620. doi: 10.1038/nprot.2006.245. [DOI] [PubMed] [Google Scholar]
- 15.Kawamura K., Maruyama I.N. Forward genetic screen for Caenorhabditis elegans mutants with a shortened locomotor healthspan. G3. 2019;9:2415–2423. doi: 10.1534/G3.119.400241. [DOI] [PMC free article] [PubMed] [Google Scholar]
- 16.Berdichevsky A., Nedelcu S., Boulias K., Bishop N.A., Guarente L., Horvitz H.R. 3-Ketoacyl thiolase delays aging of Caenorhabditis elegans and is required for lifespan extension mediated by sir-2.1. Proc. Natl. Acad. Sci. USA. 2010;107:18927–18932. doi: 10.1073/pnas.1013854107. [DOI] [PMC free article] [PubMed] [Google Scholar]
- 17.Pincus Z., Mazer T.C., Slack F.J. Autofluorescence as a measure of senescence in C. elegans: look to red, not blue or green. Aging. 2016;8:889–898. doi: 10.18632/aging.100936. [DOI] [PMC free article] [PubMed] [Google Scholar]
- 18.Anderson E.N., Corkins M.E., Li J.-C., Singh K., Parsons S., Tucey T.M., Sorkaç A., Huang H., Dimitriadi M., Sinclair D.A., et al. C. elegans lifespan extension by osmotic stress requires FUdR, base excision repair, FOXO, and sirtuins. Mech. Ageing Dev. 2016;154:30–42. doi: 10.1016/j.mad.2016.01.004. [DOI] [PMC free article] [PubMed] [Google Scholar]
- 19.Van Raamsdonk J.M., Hekimi S. FUdR causes a twofold increase in the lifespan of the mitochondrial mutant gas-1. Mech. Ageing Dev. 2011;132:519–521. doi: 10.1016/j.mad.2011.08.006. [DOI] [PMC free article] [PubMed] [Google Scholar]
- 20.Aitlhadj L., Stürzenbaum S.R. The use of FUdR can cause prolonged longevity in mutant nematodes. Mech. Ageing Dev. 2010;131:364–365. doi: 10.1016/j.mad.2010.03.002. [DOI] [PubMed] [Google Scholar]
- 21.David D.C., Ollikainen N., Trinidad J.C., Cary M.P., Burlingame A.L., Kenyon C. Widespread protein aggregation as an inherent part of aging in C. elegans. PLoS Biol. 2010;8:e1000450. doi: 10.1371/journal.pbio.1000450. [DOI] [PMC free article] [PubMed] [Google Scholar]
- 22.Walther D.M., Kasturi P., Zheng M., Pinkert S., Vecchi G., Ciryam P., Morimoto R.I., Dobson C.M., Vendruscolo M., Mann M., et al. Widespread proteome remodeling and aggregation in aging C. elegans. Cell. 2015;161:919–932. doi: 10.1016/j.cell.2015.03.032. [DOI] [PMC free article] [PubMed] [Google Scholar]
- 23.Mondal S., Hegarty E., Martin C., Gökçe S.K., Ghorashian N., Ben-Yakar A. Large-scale microfluidics providing high-resolution and high-throughput screening of Caenorhabditis elegans poly-glutamine aggregation model. Nat. Commun. 2016;7:13023. doi: 10.1038/ncomms13023. [DOI] [PMC free article] [PubMed] [Google Scholar]
- 24.van Ham T.J., Holmberg M.A., van der Goot A.T., Teuling E., Garcia-Arencibia M., Kim H.e., Du D., Thijssen K.L., Wiersma M., Burggraaff R., et al. Identification of MOAG-4/SERF as a regulator of age-related proteotoxicity. Cell. 2010;142:601–612. doi: 10.1016/j.cell.2010.07.020. [DOI] [PubMed] [Google Scholar]
- 25.Lechler M.C., Crawford E.D., Groh N., Widmaier K., Jung R., Kirstein J., Trinidad J.C., Burlingame A.L., David D.C. Reduced insulin/IGF-1 signaling restores the dynamic properties of key stress granule proteins during aging. Cell Rep. 2017;18:454–467. doi: 10.1016/j.celrep.2016.12.033. [DOI] [PMC free article] [PubMed] [Google Scholar]
- 26.Saberi-Bosari S., Huayta J., San-Miguel A. A microfluidic platform for lifelong high-resolution and high throughput imaging of subtle aging phenotypes in C. elegans. Lab. Chip. 2018;18:3090–3100. doi: 10.1039/C8LC00655E. [DOI] [PMC free article] [PubMed] [Google Scholar]
- 27.San-Miguel A., Kurshan P.T., Crane M.M., Zhao Y., McGrath P.T., Shen K., Lu H. Deep phenotyping unveils hidden traits and genetic relations in subtle mutants. Nat. Commun. 2016;7:12990. doi: 10.1038/ncomms12990. [DOI] [PMC free article] [PubMed] [Google Scholar]
- 28.Chang J.T., Hansen M. Age-associated and tissue-specific decline in autophagic activity in the nematode C. elegans. Autophagy. 2018;14:1276–1277. doi: 10.1080/15548627.2018.1445914. [DOI] [PMC free article] [PubMed] [Google Scholar]
- 29.Wang X., Jiang Q., Song Y., He Z., Zhang H., Song M., Zhang X., Dai Y., Karalay O., Dieterich C., et al. Ageing induces tissue-specific transcriptomic changes in Caenorhabditis elegans. EMBO J. 2022;41:e109633. doi: 10.15252/embj.2021109633. [DOI] [PMC free article] [PubMed] [Google Scholar]
- 30.Chow D.K., Glenn C.F., Johnston J.L., Goldberg I.G., Wolkow C.A. Sarcopenia in the Caenorhabditis elegans pharynx correlates with muscle contraction rate over lifespan. Exp. Gerontol. 2006;41:252–260. doi: 10.1016/j.exger.2005.12.004. [DOI] [PMC free article] [PubMed] [Google Scholar]
- 31.Anderson P., Kedersha N. Stress granules. Curr. Biol. 2009;19:R397–R398. doi: 10.1016/j.cub.2009.03.013. [DOI] [PubMed] [Google Scholar]
- 32.Joseph B.B., Blouin N.A., Fay D.S. Use of a sibling subtraction method for identifying causal mutations in Caenorhabditis elegans by whole-genome sequencing. G3. 2018;8:669–678. doi: 10.1534/g3.117.300135. [DOI] [PMC free article] [PubMed] [Google Scholar]
- 33.Morley J.F., Morimoto R.I. Regulation of longevity in Caenorhabditis elegans by heat shock factor and molecular chaperones. Mol. Biol. Cell. 2004;15:657–664. doi: 10.1091/mbc.e03-07-0532. [DOI] [PMC free article] [PubMed] [Google Scholar]
- 34.Wang H., Zhao Y., Zhang Z. Age-dependent effects of floxuridine (FUdR) on senescent pathology and mortality in the nematode Caenorhabditis elegans. Biochem. Biophys. Res. Commun. 2019;509:694–699. doi: 10.1016/j.bbrc.2018.12.161. [DOI] [PubMed] [Google Scholar]
- 35.Zhou K.I., Pincus Z., Slack F.J. Longevity and stress in Caenorhabditis elegans. Aging. 2011;3:733–753. doi: 10.18632/aging.100367. [DOI] [PMC free article] [PubMed] [Google Scholar]
- 36.Cypser J.R., Tedesco P., Johnson T.E. Hormesis and aging in Caenorhabditis elegans. Exp. Gerontol. 2006;41:935–939. doi: 10.1016/j.exger.2006.09.004. [DOI] [PMC free article] [PubMed] [Google Scholar]
- 37.Stiernagle T. Maintenance of C. elegans. WormBook. 2006;2:51–67. doi: 10.1895/wormbook.1.101.1. [DOI] [PMC free article] [PubMed] [Google Scholar]
- 38.Crane M.M., Stirman J.N., Ou C.-Y., Kurshan P.T., Rehg J.M., Shen K., Lu H. Autonomous screening of C. elegans identifies genes implicated in synaptogenesis. Nat. Methods. 2012;9:977–980. doi: 10.1038/nmeth.2141. [DOI] [PMC free article] [PubMed] [Google Scholar]
- 39.Kutscher L.M., Shaham S. Forward and reverse mutagenesis in C. elegans. WormBook. 2014:1–26. doi: 10.1895/wormbook.1.167.1. [DOI] [PMC free article] [PubMed] [Google Scholar]
- 40.Remmelzwaal S., Geisler F., Stucchi R., van der Horst S., Pasolli M., Kroll J.R., Jarosinska O.D., Akhmanova A., Richardson C.A., Altelaar M., et al. BBLN-1 is essential for intermediate filament organization and apical membrane morphology. Curr. Biol. 2021;31:2334–2346.e9. doi: 10.1016/j.cub.2021.03.069. [DOI] [PubMed] [Google Scholar]
- 41.Han S.K., Lee D., Lee H., Kim D., Son H.G., Yang J.S., Lee S.J.V., Kim S. OASIS 2: online application for survival analysis 2 with features for the analysis of maximal lifespan and healthspan in aging research. Oncotarget. 2016;7:56147–56152. doi: 10.18632/oncotarget.11269. [DOI] [PMC free article] [PubMed] [Google Scholar]
- 42.Bolger A.M., Lohse M., Usadel B. Trimmomatic: a flexible trimmer for Illumina sequence data. Bioinformatics. 2014;30:2114–2120. doi: 10.1093/bioinformatics/btu170. [DOI] [PMC free article] [PubMed] [Google Scholar]
Associated Data
This section collects any data citations, data availability statements, or supplementary materials included in this article.
Supplementary Materials
List includes mutations classified as moderate or high impact, filtered according to the following allele frequencies: parent line DCD214 < 0.2, mutant pool > 0.8, wildtype pool < 0.2.
Data Availability Statement
All data reported in this paper will be shared by the lead contact upon request.
All original code has been deposited at Github and is publicly available as of the date of publication. DOIs are listed in the key resources table.
Any additional information required to reanalyze the data reported in this paper is available from the lead contact upon request.