

ABSTRACT
Background
Acute kidney injury (AKI) is associated with short- and long-term complications but the consequences of the AKI-to-CKD transition are still poorly understood. We aimed to evaluate the association between the AKI-to-CKD transition and the long-term risk of infection.
Methods
This retrospective study included patients admitted in a tertiary hospital with community-acquired AKI in 2013 and 2014 who had their estimated glomerular filtration rate (eGFR) assessed at 3 months (±2 weeks) after serum creatinine peaked in the AKI episode. Key exclusion criteria were baseline CKD or confounding factors (active neoplasia, primary immunodeficiency, human immunodeficiency virus, immunosuppressive drugs). The association between the AKI-to-CKD transition (defined as an eGFR <60 ml/min/1.73 m2 at 3 months) and long-term infections (defined using clinical features, blood/urine analysis, cultures and imaging) was assessed during a follow-up of 9 months (range 2–56).
Results
Among the 1731 patients admitted with AKI, 367 (21%) were included in the present analysis (64% male, 71 ± 15 years). Three months after AKI, 159 (43%) developed AKI-to-CKD transition. Baseline and post-AKI eGFR were independent predictors of AKI-to-CKD transition [hazard ratio (HR) 0.97, P = .044 and HR 0.96, P < .001, respectively].
During follow-up, 153 (42%) patients developed an infection. Factors associated with infection were older age, cognitive impairment, lower post-AKI eGFR, eGFR loss from baseline to 3 months and AKI-to-CKD transition. Adjusted Cox regression showed that baseline eGFR, 3-month eGFR, eGFR loss and AKI-to-CKD transition were independent predictors of the long-term risk of infection.
Conclusions
The AKI-to-CKD transition independently predicts the long-term risk of infection following an episode of AKI.
Keywords: acute kidney injury, chronic kidney disease, infections, outcomes, persistent kidney damage
Graphical Abstract
Graphical Abstract.

INTRODUCTION
Acute kidney injury (AKI) is present in up to 15% of hospitalized patients and is associated with adverse health outcomes [1]. Hospital-acquired AKI is associated to an increased risk of death during admission [2]. Moreover, patients with AKI present an increased risk of short- and long-term complications after discharge, such as mortality, cardiovascular events, cancer, readmission, chronic kidney disease (CKD) and end-stage renal disease [3, 4].
Persistent renal dysfunction is one of the causes of the increased risk of complications after AKI [5, 6]. However, strategies to detect patients at high risk for complications and to modify the natural history after AKI have so far been unsuccessful [3].
In this regard, the incidence of non-cardiac and non-kidney events after AKI has been poorly studied. Patients with CKD, especially those with advanced CKD, are at high-risk for infection and death from infection [7]. AKI-associated immunodeficiency has recently increased the attention of the scientific community; however, there are still deep gaps in the knowledge about this condition and its consequences [8]. From a clinical point of view, the NARA‑AKI cohort study demonstrated the significant and independent association between AKI and long-term risk of infection in a 4-year prospective follow-up [9]. However, there is scarce information on the link between the AKI-to-CKD transition and the risk of infection in real-world studies. The aim of the present study was to assess the association between the AKI-to-CKD transition and the long-term risk of infection.
MATERIALS AND METHODS
This is a retrospective study including all patients admitted with AKI to the Hospital Universitario de la Princesa, Madrid in 2013 and 2014. Patients were selected from the hospital electronic records initially using the International Classification of Diseases, Tenth Revision codes (N12, N17), but they were only included after checking that they met Kidney Disease: Improving Global Outcomes criteria for AKI [10] and was community-acquired AKI (CA-AKI). Baseline estimated glomerular filtration rate (eGFR) was defined as the previous renal function assessment before admission, not >6 months. Exclusion criteria were the de novo development of AKI during admission, pre-existent CKD (eGFR <60 ml/min/1.73 m2 in the previous 3 months) [11], death during admission (Figure 1), hospitalization during the previous 3 months, active neoplasia, primary immunodeficiency, human immunodeficiency virus or the use of immunosuppressive drugs and lack of renal function assessment 3 months after AKI (Figure 1).
FIGURE 1:

Flow chart.
Patients were evaluated at admission for the hospitalization associated with AKI, after an AKI episode, 3 months after peak serum creatinine in the AKI episode and during follow-up. At admission, baseline demographic data (age and sex) and comorbidities were collected. Registered comorbidities included diabetes mellitus, hypertension, dyslipidaemia, CKD, history of coronary disease, heart failure, stroke, peripheral vascular disease, neoplasia and cognitive impairment [12–15]. Renal function was assessed as eGFR using the creatinine-based Chronic Kidney Disease Epidemiology Collaboration (CKD-EPI) equation [16].
During hospitalization, kidney function and AKI severity were assessed using the Acute Kidney Injury Network (AKIN) scale [10]. Peak serum creatinine and nadir eGFR values were determined for the AKI episode and this represented the starting point of the 3 months after which the presence of the AKI-to-CKD transition was assessed. AKIN classifies severity into three stages based on the increase in creatinine over baseline levels, with stage 1 being the mildest and stage 3 the most severe [10]. After the AKI episode, serum creatinine and eGFR were also collected.
Among patients discharged alive, we registered a new eGFR 3 months ± 2 weeks after the peak serum creatinine was reached in the AKI episode. We assessed the incidence of AKI-to-CKD transition defined as eGFR <60 ml/min/1.73 m2 at 3 months after the peak serum creatinine in AKI (Figure 2). Additionally, eGFR loss was calculated as the difference between eGFR 3 months after AKI and baseline eGFR.
FIGURE 2:

Study design.
The cohort was followed for 9 months (range 2–56) and infectious events were recorded from 3 months after AKI onwards. Follow-up did not include the coronavirus disease 2019 pandemic period. Infections were registered using the integral electronic records of Madrid (Horus) and considered when clinical or microbiological data were suggestive of infection. Horus registers all events (outpatient and inpatient) that require medical assistance. Infections were considered when cultures were positive or there was clinical evidence of infection (such as X-ray, inflammatory markers and/or infectious symptoms or signs). The study was approved by the local research ethics committee [registration number 3447 (09/2018)].
Statistics
Values are expressed as mean ± standard deviation (SD) or median [interquartile range (IQR)]. Distribution was assessed using the Kolmogorov–Smirnov test. Patients were included if they had an eGFR assessment 3 months after the AKI episode. Included patients were divided into two groups based on the eGFR at 3 months: patients who recovered normal renal function after AKI (eGFR ≥60 ml/min/1.73 m2 at 3 months) and those who developed AKI-to-CKD transition (eGFR <60 ml/min/1.73 m2) (Figure 2). Variables were compared between the two groups using Fisher’s test for qualitative variables and the Mann–Whitney test for continuous variables.
Infections were determined during a follow-up period that started 3 months after serum creatinine peaked in the AKI episode. Factors associated with infection were evaluated using univariate Cox regression. Multivariate adjusted models were developed to identify independent predictors of infection. After assessing collinearity, we constructed the multivariate models adjusting for variables that were statistically significantly associated to the outcome in the univariate analysis or those with a P-value <.1 and also for confounders (such as age, sex and baseline eGFR). Multiple models were tested to confirm the independent association between AKI-to-CKD transition and infection. Kaplan–Meier curves were plotted to determine the association between AKI-to-CKD transition and infection during follow-up. Patients who died, were hospitalized for any reason or were lost during follow-up were censored for the analysis. All statistical analyses were performed with SPSS 22.0 (IBM, Armonk, NY, USA). P-values <.05 were considered statistically significant.
RESULTS
Baseline characteristics
Among 1731 patients with AKI during admission, 190 (11%) were excluded due to comorbidities, 121 (7%) did not have a previous eGFR determination, 656 (38%) had CKD at baseline and 286 (17%) died during admission. Among the 478 (28%) patients who were discharged alive and fulfilled inclusion criteria, five (1%) were lost and 103 (22%) did not have a renal function assessment 3 months after the AKI episode. Finally, 367 (21% of patients admitted with AKI and 77% of patients surviving the AKI episode) had an eGFR assessment 3 months after AKI and were included in the present analysis (64% male, mean age 71 ± 15 years) (Figure 1). The median baseline eGFR was 78 ml/min/1.73 m2 (IQR 68–90), nadir eGFR during the AKI episode was 35 ml/min/1.73 m2 (IQR 22–49) and post-AKI eGFR was 69 ml/min/1.73 m2 (IQR 52–88) (Table 1).
Table 1.
Baseline characteristics according to CKD status 3 months after AKI
| Characteristics | All (n = 367) | No CKD (eGFR ≥60 ml/min/1.73 m2) (n = 208) | AKI-to-CKD transitiona (n = 159) | P-value |
|---|---|---|---|---|
| Sex (male), n (%) | 235 (64) | 138 (66) | 97 (61) | .324 |
| Age (years), mean ± SD | 71 ± 15 | 67 ± 16 | 75 ± 11 | <.001 |
| Diabetes, n (%) | 103 (28) | 51 (24) | 52 (33) | .101 |
| Hypertension, n (%) | 237 (65) | 118 (57) | 119 (75) | <.001 |
| Dyslipidaemia, n (%) | 144 (39) | 67 (32) | 77 (48) | .002 |
| Coronary artery disease, n (%) | 51 (14) | 25 (12) | 26 (16) | .286 |
| Heart failure, n (%) | 69 (19) | 3 (18) | 32 (21) | .502 |
| Peripheral vascular disease, n (%) | 19 (6) | 13 (7) | 6 (5) | .346 |
| Atrial fibrillation, n (%) | 74 (20) | 35 (17) | 39 (25) | .067 |
| Stroke, n (%) | 47 (13) | 30 (14) | 17 (11) | .345 |
| Malignancy, n (%) | 88 (24) | 53 (26) | 35 (22) | .460 |
| Cognitive impairment, n (%) | 54 (15) | 30 (15) | 24 (15) | 1.000 |
| Baseline RAASi, n (%) | 159 (43) | 75 (38) | 84 (50) | .020 |
| Baseline diuretics, n (%) | 159 (43) | 93 (39) | 66 (52) | .020 |
| Baseline eGFR (ml/min/1.73 m2) | 78 (68–90) | 84 (71–95) | 72 (65–84) | <.001 |
| Nadir eGFR (ml/min/1.73 m2)b | 35 (22–49) | 35 (21–51) | 36 (22–47) | .833 |
| Post-AKI eGFR (ml/min/1.73 m2) | 69 (52–88) | 82 (63–97) | 57 (46–69) | <.001 |
| eGFR 3 months after AKI (ml/min/1.73 m2) | 65 (44–84) | 80 (71–94) | 40 (28–50) | <.001 |
| eGFR loss from baselinec (ml/min/1.73 m2) | 14 (0–34) | 2 (−7–12) | 36 (21–50) | <.001 |
| AKI severity, n (%) | <.001 | |||
| AKIN 1 | 175 (49) | 81 (39) | 94 (61) | |
| AKIN 2 | 101 (28) | 69 (33) | 32 (21) | |
| AKIN 3 | 84 (23) | 56 (27) | 28 (18) | |
| Albumin:creatinine ratio (mg/g)d, median (IQR) | 19 (8–119) | 15 (6–108) | 45 (8–512) | .185 |
| Serum albumin (g/dl), median (IQR) | 3.2 (2.8–3.8) | 3.2 (2.7–3.8) | 3.2 (2.9–3.7) | .489 |
RAASi: renin–angiotensin–aldosterone system inhibitor.
Defined as eGFR <60 ml/min/1.73 m2 at 3 months after AKI, i.e. from the time when serum creatinine peaked in AKI.
Defined as the lowest eGFR achieved during the AKI episode.
Defined as eGFR loss from baseline to 3 months after AKI.
Albumin:creatinine ratio was available in only 74 patients.
Factors associated to AKI-to-CKD transition
Three months after the AKI, 159 (43%) patients had AKI-to-CKD transition and 208 (57%) patients had an eGFR ≥60 ml/min/1.73 m2. Being older (P < .001), a history of hypertension (P < .001), milder AKI (P < .001), lower baseline eGFR (P < .001), nadir eGFR during admission (P < .001) and post-AKI eGFR (P < .001) were associated to the development of AKI-to-CKD transition (Table 1). AKI severity (AKIN) was not associated with the development of AKI-to-CKD transition. A sensitivity analysis of factors associated with AKI severity included baseline eGFR (P < .001) and aetiology of AKI (P = .016) (Supplementary Table S1).
To assess independent predictors of AKI-to-CKD transition, a multivariate adjusted regression model was constructed. The model showed that baseline and post-AKI eGFR were both independent predictors for development of AKI-to-CKD transition [hazard ratio (HR) 0.78, P = .044 and HR 0.70, P < .001, respectively] (Table 2).
Table 2.
Independent predictors for AKI-to-CKD transition using an adjusted logistic regression model
| Predictors | HR (95%CI) | P-value |
|---|---|---|
| Baseline eGFR (per ml/min/1.73 m2) | 0.78 (0.62–0.99) | .044 |
| Post-AKI eGFR (per ml/min/1.73 m2) | 0.70 (0.62–0.79) | <.001 |
| Age (per 10 y) | 1.08 (0.87–1.34) | .457 |
| Sex (female) | 1.06 (0.62–1.79) | .839 |
| Hypertension (yes) | 1.23 (0.70–2.16) | .462 |
| Dyslipidaemia (yes) | 1.39 (0.83–2.31) | .206 |
| Nadir eGFR (per ml/min/1.73 m2)a | 1.01 (0.82–1.25) | .912 |
| Severity of AKI (AKIN 1 versus others) | 0.70 (0.42–1.18) | .185 |
Nadir eGFR was defined as the lowest eGFR value during the AKI episode.
Infections during follow-up
Follow-up for infections began 3 months after AKI (i.e. 3 months after serum creatinine peaked in AKI), which is when the presence of AKI-to-CKD (<60 ml/min/1.73 m2) or normal kidney function (≥60 ml/min/1.73 m2) was determined. During a median follow-up of 9 months (IQR 2–56), 153 (42%) patients developed an infection. The most frequent events were urinary tract infections [67 (44%)], respiratory tract infections [46 (30%)], soft tissue infections [14 (9%)] and abdominal infections [14 (9%)]. The type of infection was not associated to any baseline variable.
Factors associated with infection during follow-up
Factors associated with infection during follow-up were tested using Cox regression. In univariate analysis, being older {HR 1.18 [95% confidence interval (CI) 1.05–1.33], P =.005}, cognitive impairment [HR 1.51 (95% CI 1.00–2.28), P = .050], lower eGFR 3 months after AKI [HR 0.91 (95% CI 0.86–0.97), P =.002], eGFR loss from baseline to 3 months [HR 1.07 (95% CI 1.01–1.14), P =.028] and AKI-to-CKD transition [HR 1.55 (95% CI 1.13–2.14), P =.007] were associated with infections (Table 3). eGFR significantly differed at baseline between patients who developed an infection and those free from infection (P =.038). However, nadir and post-AKI eGFR were similar between those cohorts (P =.289 and P =.215, respectively) (Figure 3).
Table 3.
Factors associated with infection in univariate analysis using Cox regression
| Factors | HR (95% CI) | P-value |
|---|---|---|
| Age (per 10 years) | 1.18 (1.05–1.33) | .005 |
| Sex (male) | 1.04 (0.75–1.44) | .818 |
| Diabetes (yes) | 1.32 (0.94–1.85) | .107 |
| Hypertension (yes) | 1.03 (0.74–1.43) | .875 |
| Dyslipidaemia (yes) | 0.89 (0.64–1.24) | .499 |
| Coronary artery disease (yes) | 0.82 (0.50–1.36) | .452 |
| Heart failure (yes) | 0.84 (0.54–1.30) | .428 |
| Peripheral vascular disease (yes) | 1.43 (0.73–2.83) | .298 |
| Atrial fibrillation (yes) | 0.98 (0.66–1.45) | .913 |
| Stroke (yes) | 1.08 (0.68–1.73) | .742 |
| Malignancy (yes) | 1.08 (0.75–1.56) | .683 |
| Cognitive impairment (yes) | 1.51 (1.00–2.28) | .050 |
| Baseline RAASi | 1.07 (0.78–1.47) | .657 |
| Baseline diuretics | 1.03 (0.74–1.44) | .863 |
| Baseline eGFR (per 10 ml/min/1.73 m2) | 0.91 (0.83–1.01) | .069 |
| Nadir eGFR (per 10 ml/min/1.73 m2) | 0.97 (0.90–1.05) | .419 |
| Immediate eGFR after AKI (per 10 ml/min/1.73 m2) | 0.96 (0.91–1.02) | .196 |
| eGFR 3 months after AKI (per 10 ml/min/1.73 m2) | 0.91 (0.86–0.97) | .002 |
| eGFR loss from baselinea (per 10 ml/min/1.73 m2) | 1.07 (1.01–1.14) | .028 |
| AKI-to-CKD transition (yes) | 1.55 (1.13–2.14) | .007 |
| Albumin:creatinine ratio (mg/g) | 1.00 (0.99–1.00) | .757 |
| Serum albumin (g/dl) | 1.05 (0.99–1.13) | .100 |
RAASi: renin–angiotensin–aldosterone system inhibitor.
Statistically significant values in bold.
eGFR loss from baseline to 3 months after the peak serum creatinine was reached in the AKI episode.
FIGURE 3:

The eGFR time-course for infected and non-infected patients. *P between groups = .038, **P between groups = .011.
Kaplan–Meier curves show the association between AKI-to-CKD transition and infections (logrank 7.8, P =.005) (Figure 4). Figure 5 plots the association between quartiles of eGFR loss from baseline and infection during follow-up.
FIGURE 4:

Kaplan–Meier plot of the association between AKI-to-CKD transition to infections during follow-up. Data include the 367 patients who were analysed as they had eGFR assessment 3 months after the AKI episode.
FIGURE 5:
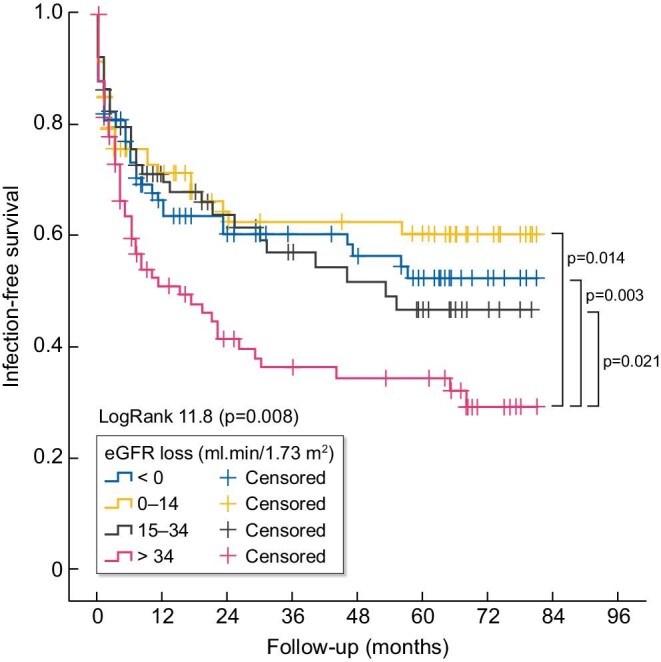
Kaplan–Meier plot of the association between quartiles of eGFR loss from baseline to 3 months after AKI and infections during follow-up.
In adjusted multivariate models, AKI-to-CKD transition, eGFR loss from baseline and eGFR at 3 months after the AKI episode were independently associated with infections (Table 4).
Table 4.
Independent predictors for infection using Cox regression in adjusted models
| Crude | Model 1 | Model 2 | Model 3 | |||||
|---|---|---|---|---|---|---|---|---|
| Predictors | HR (95% CI) | P-value | HR (95% CI) | P-value | HR (95% CI) | P-value | HR (95% CI) | P-value |
| AKI-to-CKD transition (yes) | 1.55 (1.13–2.14) | .007 | 1.40 (1.01–1.94) | .044 | 1.39 (1.00–1.94) | .049 | 1.47 (1.01–2.15) | .043 |
| 3-month eGFRa (per 10 ml/min/1.73 m2) | 0.91 (0.86–0.97) | .002 | 0.93 (0.87–0.99) | .035 | 0.93 (0.88–0.99) | .048 | 0.91 (0.85–0.98) | .015 |
| eGFR lossb (per 10 ml/min/1.73 m2) | 1.07 (1.01–1.14) | .028 | 1.06 (1.01–1.13) | .046 | 1.06 (0.99–1.13) | .091 | 1.09 (1.02–1.17) | .015 |
Model 1 was adjusted for age and sex. Model 2 was adjusted for age, sex and cognitive impairment. Model 3 was adjusted for baseline, nadir and post-AKI eGFR.
eGFR assessment 3 months after the peak serum creatinine was reached in the AKI episode (AKI-to-CKD assessment).
eGFR loss from baseline to 3 months after discharge from the AKI episode (AKI-to-CKD assessment).
DISCUSSION
The key finding of the present analysis is the independent association of AKI-to-CKD transition with infection during follow-up. In addition, three other parameters of kidney function (baseline eGFR, eGFR 3 months after AKI and the magnitude of eGFR loss from baseline to 3 months) were also independently associated with a higher risk of infection over the follow-up.
Multiple consequences of AKI have been widely explored in previous studies. However, the new AKI-to-CKD transition concept presents gaps in evidence. The mechanisms that determine that some patients progress to CKD are incompletely understood [17, 18]. Furthermore, clinicians lack biomarkers that predict the AKI-to-CKD transition and allow timely intervention [19–22]. In our study, the AKI-to-CKD transition was more frequent in patients with comorbidities (hypertension or dyslipidaemia) and in older patients, but lower baseline and post-AKI eGFR were independent predictors.
Infections are one of the less studied consequences of AKI. Although kidney diseases are well-known factors for infections and infections are one the most common causes of death in patients with kidney disease, the underlying mechanism for this apparent secondary immunodeficiency has been poorly demonstrated [23]. Regarding the bilateral relation between AKI and infections, the recently published prospective NARA-AKI study showed that post-operative AKI in non-cardiac surgery was associated with further hospitalization due to infection [9, 21]. Beyond AKI, patients with CKD are more vulnerable to infections and they present worse outcomes than non-CKD cohorts [24, 25]. Our results demonstrate for the first time a predictive association of the AKI-to-CKD transition with the risk of infection. Interestingly, not only the development of AKI-to-CKD transition but also eGFR loss (independent of baseline and post-AKI eGFR) was independently associated with the risk of infection. Several mechanisms can explain the high-risk for infections. The addition of CKD immune dysfunction (impaired innate and acquired immunity, decreased clearance of pro-inflammatory cytokines or even epigenetic modifications in haematological stem cells) to AKI disturbances (disruption of kidney–immune crosstalk with altered immune cell composition and function or an exacerbated inflammatory response) [26, 27]. However, the exact pathophysiology of the increased risk of infections in patients undergoing the AKI-to-CKD transition remains unexplained.
Some limitations should be acknowledged in the present study. First is the retrospective design and its inherent bias. To modulate this limitation, we strictly protocolized the inclusion and exclusion criteria and we did not analyse patients who were lost to follow-up or missed key information. As part of our clinical practice, most AKI episodes are followed during the first 3 months, even with normal renal function at discharge, so we had kidney function assessments available at 3 months in 77% of the cohort. Because of the strict inclusion and exclusion criteria, our study had a small sample size. Several features of AKI, such as its increased incidence among patients with CKD and high mortality, contributed to limit the number of eligible patients. Second, we assessed the infection incidence during follow-up in electronic records, leading to a heterogeneous definition of the events. However, we confirmed most infections using complementary analyses such as blood or urine analyses or imaging studies. Third, our analysis was based on eGFR using the CKD-EPI equation, which has inherent limitations and may not be reliable during the AKI episode. Finally, some missing data or subjective clinical information (i.e. cognitive impairment definition) should be addressed as a potential bias due to the study design. The study represents real-world routine clinical practice and thus some variables not routinely analysed outside nephrology departments, such as albuminuria or other tubular markers, were not available for most patients.
In conclusion, the development of AKI-to-CKD transition after an AKI episode is a predictor for a higher risk of infection during long-term follow-up. In this regard, efforts must be directed towards preserving renal function after AKI episodes to avoid the adverse consequences of persistent kidney dysfunction.
Supplementary Material
Contributor Information
Ana Sánchez Horrillo, Nephrology Department, Instituto de Investigación Sanitaria La Princesa, Hospital Universitario de La Princesa, Madrid, Spain.
Laura Salanova Villanueva, Nephrology Department, Instituto de Investigación Sanitaria La Princesa, Hospital Universitario de La Princesa, Madrid, Spain.
Alicia Cabrera Cárdenas, Nephrology Department, Instituto de Investigación Sanitaria La Princesa, Hospital Universitario de La Princesa, Madrid, Spain.
Patricia Muñoz Ramos, Nephrology Department, Instituto de Investigación Sanitaria La Princesa, Hospital Universitario de La Princesa, Madrid, Spain.
Alberto Ortiz, School of Medicine, Instituto de Investigación Sanitaria de la Fundación Jiménez Díaz, Universidad Autónoma de Madrid; Instituto de Investigación Carlos III, Fundación Renal Iñigo Alvarez de Toledo-IRSIN, Madrid, Spain.
Borja Quiroga, Nephrology Department, Instituto de Investigación Sanitaria La Princesa, Hospital Universitario de La Princesa, Madrid, Spain.
FUNDING
Research by the authors is supported by the Instituto de Salud Carlos III (ISCIII) RICORS program to RICORS2040 (RD21/0005/0001) and FEDER funds. The Open Access is financially supported by BI. BI had no role in the design, analysis or interpretation of the results in this study. BI was given the opportunity to review the manuscript for medical and scientific accuracy, as well as intellectual property considerations.
AUTHORS’ CONTRIBUTIONS
A.S. acquired data, interpreted the results and approved the final version of the manuscript. A.C.C., L.S., P.M.R. acquired data and approved the final version of the manuscript. A.O. interpreted the results and drafted the manuscript. B.Q. conceived and designed the work, interpreted the results and drafted the manuscript.
DATA AVAILABILITY STATEMENT
The data underlying this article will be shared upon reasonable request to the corresponding author.
CONFLICT OF INTEREST STATEMENT
B.Q. has received honoraria for conferences, consulting fees and advisory boards from Vifor Pharma, Astellas, Amgen, Bial, Ferrer, Novartis, AstraZeneca, Sandoz, Laboratorios Bial, Esteve, Sanofi-Genzyme and Otsuka. A.O. is the past CKJ Editor-in-Chief and has received consultancy or speaker fees or travel support from Astellas, AstraZeneca, Amicus, Amgen, Fresenius Medical Care, Bayer, Sanofi-Genzyme, Menarini, Kyowa Kirin, Alexion, Otsuka and Vifor Fresenius Medical Care Renal Pharma and is Director of the Catedra Mundipharma-UAM of diabetic kidney disease and the Catedra AstraZeneca-UAM of chronic kidney disease and electrolytes. The remaining authors declare no conflicts of interest. The results presented in this article have not been published previously in whole or part.
REFERENCES
- 1. Lameire NH, Bagga A, Cruz Det al. Acute kidney injury: an increasing global concern. Lancet 2013;382:170–9 [DOI] [PubMed] [Google Scholar]
- 2. Barton AL, Williams SBM, Dickinson SJet al. Acute kidney injury in primary care: a review of patient follow-up, mortality, and hospital admissions following the introduction of an AKI alert system. Nephron 2020;144:498–505 [DOI] [PubMed] [Google Scholar]
- 3. Quiroga B, Sanz M, Muñoz Ramos Pet al. Prognosis of in hospital nonagenarians with acute kidney injury. An Sist Sanit Navar 2021;44:215–23 [DOI] [PMC free article] [PubMed] [Google Scholar]
- 4. James MT, Bhatt M, Pannu Net al. Long-term outcomes of acute kidney injury and strategies for improved care. Nat Rev Nephrol 2020;16:193–205 [DOI] [PubMed] [Google Scholar]
- 5. Quiroga B, Sanz Sainz M, Santos Sánchez-Rey Bet al. Persistent kidney dysfunction after acute kidney injury predicts short-term outpatient mortality. Intern Med J 2022;52:834–40 [DOI] [PubMed] [Google Scholar]
- 6. Sawhney S, Marks A, Fluck Net al. Post-discharge kidney function is associated with subsequent ten-year renal progression risk among survivors of acute kidney injury. Kidney Int 2017;92:440–52 [DOI] [PMC free article] [PubMed] [Google Scholar]
- 7. Sarnak MJ, Jaber BL.. Mortality caused by sepsis in patients with end-stage renal disease compared with the general population. Kidney Int 2000;58:1758–64 [DOI] [PubMed] [Google Scholar]
- 8. Jang HR, Rabb H.. Immune cells in experimental acute kidney injury. Nat Rev Nephrol 2015;11:88–101 [DOI] [PubMed] [Google Scholar]
- 9. Tagawa M, Nishimoto M, Kokubu Met al. Acute kidney injury as an independent predictor of infection and malignancy: the NARA-AKI cohort study. J Nephrol 2019;32:967–75 [DOI] [PubMed] [Google Scholar]
- 10. Kidney Disease: Improving Global Outcomes Acute Kidney Injury Work Group . KDIGO clinical practice guideline for acute kidney injury. Kidney Int Suppl 2012;2:1–138 [Google Scholar]
- 11. Kidney Disease: Improving Global Outcomes CKD Work Group . KDIGO 2012 clinical practice guideline for the evaluation and management of chronic kidney disease. Kidney Int Suppl 2013;3:1–150 [DOI] [PubMed] [Google Scholar]
- 12. James PA, Oparil S, Carter BLet al. 2014 evidence-based guideline for the management of high blood pressure in adults: report from the panel members appointed to the Eighth Joint National Committee (JNC 8). JAMA 2014;311:507–20 [DOI] [PubMed] [Google Scholar]
- 13. Kidney Disease: Improving Global Outcomes Lipid Work Group. KDIGO clinical practice guidelines for lipid management in chronic kidney disease. Kidney Int Suppl 2013;3:259–305. [Google Scholar]
- 14. Inker LA, Astor BC, Fox CHet al. KDOQI US commentary on the 2012 KDIGO clinical practice guideline for the evaluation and management of CKD. Am J Kidney Dis 2014;63:713–35 [DOI] [PubMed] [Google Scholar]
- 15. American Diabetes Association . Pharmacologic approaches to glycemic treatment. In: Standards of medical care in diabetes—2017. Diabetes Care 2017;40(Suppl 1):S64–74 [DOI] [PMC free article] [PubMed] [Google Scholar]
- 16. Kilbride HS, Stevens PE, Eaglestone Get al. Accuracy of the MDRD (Modification of Diet in Renal Disease) study and CKD-EPI (CKD Epidemiology Collaboration) equations for estimation of GFR in the elderly. Am J Kidney Dis 2013;61:57–66. [DOI] [PubMed] [Google Scholar]
- 17. Fiorentino M, Grandaliano G, Gesualdo Let al. Acute kidney injury to chronic kidney disease transition. Contrib Nephrol 2018;193:45–54 [DOI] [PubMed] [Google Scholar]
- 18. Minami S, Nakamura S.. Therapeutic potential of beclin1 for transition from AKI to CKD: autophagy-dependent and autophagy-independent functions. Kidney Int 2022;101:13–5 [DOI] [PubMed] [Google Scholar]
- 19. Tan HL, Yap JQ, Qian Q.. Acute kidney injury: tubular markers and risk for chronic kidney disease and end-stage kidney failure. Blood Purif 2016;41:144–50 [DOI] [PubMed] [Google Scholar]
- 20. Inker LA, Titan S.. Measurement and estimation of GFR for use in clinical practice: core curriculum 2021. Am J Kidney Dis 2021;78:736–49 [DOI] [PubMed] [Google Scholar]
- 21. Kellum JA, Romagnani P, Ashuntantang Get al. Acute kidney injury. Nat Rev Dis Primers 2021;7:52. [DOI] [PubMed] [Google Scholar]
- 22. Palazzuoli A, Ruocco G, Pellegrini Met al. Comparison of neutrophil gelatinase-associated lipocalin versus B-type natriuretic peptide and cystatin c to predict early acute kidney injury and outcome in patients with acute heart failure. Am J Cardiol 2015;116:104–11 [DOI] [PubMed] [Google Scholar]
- 23. Steiger S, Rossaint J, Zarbock Aet al. Secondary immunodeficiency related to kidney disease (SIDKD) – definition, unmet need, and mechanisms. J Am Soc Nephrol 2022;33:259–78 [DOI] [PMC free article] [PubMed] [Google Scholar]
- 24. Xu H, Gasparini A, Ishigami Jet al. eGFR and the risk of community-acquired infections. Clin J Am Soc Nephrol 2017;12:1399–408 [DOI] [PMC free article] [PubMed] [Google Scholar]
- 25. Su G, Trevisan M, Ishigami Jet al. Short- and long-term outcomes after incident pneumonia in adults with chronic kidney disease: a time-dependent analysis from the Stockholm CREAtinine Measurement project. Nephrol Dial Transplant 2020;35:1894–900 [DOI] [PMC free article] [PubMed] [Google Scholar]
- 26. LaFavers K. Disruption of kidney-immune system crosstalk in sepsis with acute kidney injury: lessons learned from animal models and their application to human health. Int J Mol Sci 2022;23:1702. [DOI] [PMC free article] [PubMed] [Google Scholar]
- 27. Syed-Ahmed M, Narayanan M. Immune dysfunction and risk of infection in chronic kidney disease. Adv Chronic Kidney Dis 2019;26:8–15 [DOI] [PubMed] [Google Scholar]
Associated Data
This section collects any data citations, data availability statements, or supplementary materials included in this article.
Supplementary Materials
Data Availability Statement
The data underlying this article will be shared upon reasonable request to the corresponding author.