

ABSTRACT
Background
Differences in the performance of estimated glomerular filtration rate (eGFR) equations have been attributed to the mathematical form of the equations and to differences between patient demographics and measurement methods. We evaluated differences in serum creatinine (SCr) and eGFR in cohorts matched for age, sex, body mass index (BMI) and measured GFR (mGFR).
Methods
White North Americans from Minnesota (n = 1093) and the Chronic Renal Insufficiency Cohort (CRIC) (n = 1548) and White subjects from the European Kidney Function Consortium (EKFC) cohort (n = 7727) were matched for demographic patient characteristics (sex, age ± 3 years, BMI ± 2.5 kg/m2) and renal function (mGFR ± 3 ml/min/1.73 m2). SCr was measured with isotope dilution mass spectrometry (IDMS)-traceable assays in the Minnesota and EKFC cohorts and with non-standardized SCr assays recalculated to IDMS in the CRIC. The Minnesota cohort and CRIC shared a common method to measure GFR (renal clearance of iothalamate), while the EKFC cohort used a variety of exogenous markers and methods, all with recognized sufficient accuracy. We compared the SCr levels and eGFR predictions [for Chronic Kidney Disease Epidemiology Collaboration (CKD-EPI) and EKFC equations] of patients fulfilling these matching criteria.
Results
For 305 matched individuals, mean SCr (mg/dL) was not different between the Minnesota and EKFC cohorts (females 0.83 ± 0.20 versus 0.86 ± 0.23, males 1.06 ± 0.23 versus 1.12 ± 0.37; P > .05) but significantly different from the CRIC [females 1.13 ± 0.23 (P < .0001), males 1.42 ± 0.31 (P < .0001)]. The CKD-EPI equations performed better than the EKFC equation in the CRIC, while the opposite was true in the Minnesota and EKFC cohorts.
Conclusion
Significant differences in SCr concentrations between the Minnesota and EKFC cohorts versus CRIC were observed in subjects with the same level of mGFR and equal demographic characteristics and can be explained by the difference in SCr calibration.
Keywords: serum creatinine, standardization, unbiased GFR estimation
Graphical Abstract
Graphical Abstract.

INTRODUCTION
Estimation of the glomerular filtration rate (GFR) is of paramount importance for the diagnostic follow-up of chronic kidney disease (CKD) and for epidemiological studies on the prevalence and risk factors for CKD [1, 2]. GFR estimation is generally performed by equations using biomarkers and demographic parameters such as age, sex and sometimes race [3–5]. The most studied and used equations are thus far based on serum creatinine (SCr) as a biochemical factor, even if other biomarkers (like cystatin C) can be used alone or in combination with creatinine [4, 6]. Many formulas for estimating GFR have been published in the literature in the last 2 decades. Interestingly, the prediction performance of these equations differs across settings. Age range, measured GFR (mGFR) and percentage of males and females in the different cohorts can explain these differences, although the same clinical criteria (including age and sex) and the same biomarker values are applied in these formulas. For instance, from a recent multicentric study, the mean bias of the 2009 Chronic Kidney Disease Epidemiology Collaboration (CKD-EPI) equation in a European cohort (n = 7727) was −4.2 ml/min/1.73 m2, but +4.0 ml/min/1.73 m2 in the American Chronic Renal Insufficiency Cohort (CRIC) (n = 1548) [5]. Different factors such as the reference method used to measure GFR (i.e. iohexol versus iothalamate and plasma versus urine clearance) can explain why such differences are observed [7–11]. However, in the example mentioned above, the opposite systematic difference between the two cohorts clearly raises questions about another factor, i.e. the standardization of SCr measurement [12–18]. Indeed, SCr can be measured by two different analytical methodologies, namely the Jaffe and enzymatic methods [19, 20]. These methods are proposed by different manufacturers on different analytical platforms. Before the introduction of the Standard Reference Material 967 in 2007 [a commutable international standard provided by the US National Institute of Standards and Technology (NIST)] and the launch of the Creatinine Standardization Program (which obliged manufacturers to align with this standard), there was no standardization of SCr measurements. Since then, most manufacturers have used the NIST standards to calibrate their SCr assays, and since 2017, one can assert that most creatinine assays are correctly calibrated against NIST Standard 967 [such methods are generally called isotope dilution mass spectrometry (IDMS) traceable methods] [21], even if there is still doubt for some Jaffe assays (although IDMS traceability is claimed by all manufacturers) [20]. No retrospective analysis has ever evaluated the impact of SCr standardization (or lack thereof) on different cohorts that have been used to establish some estimated GFR (eGFR) formulas.
Therefore, in the current analysis we investigated the standardization of SCr by comparing the relationship between eGFR and mGFR in three well-known cohorts, two from the USA [CRIC (n = 1548) and Minnesota (n = 1093)] and one from Europe [European Kidney Function Consortium (EKFC) (n = 7727)] [4, 5]. Briefly, we compared eGFR and mGFR and investigated whether differences in eGFR (by different equations) still persisted after matching subjects in the different cohorts for age, sex, body mass index (BMI) and mGFR. Because subjects were matched, we hypothesize that if differences still exist, it is most likely due to a difference in creatinine standardization.
MATERIALS AND METHODS
Cohorts and measurement methods
Three different cohorts of patients with mGFR, age, sex, BMI and SCr available were used in this study.
The CRIC Study contains renal data of White North Americans (n = 1548) [22, 23]. mGFR was obtained by renal clearance of iothalamate. SCr was measured in the CRIC participating centres. At the time of measuring SCr in this cohort, the Creatinine Standardization Program had not yet been instituted. Consequently, Joffe et al [24]reported that there was substantial variability in SCr assays across the laboratories and over time. Yet, to circumvent this issue, the investigators decided to harmonize SCr by ‘recalibrating’ the 13 different analytical platforms used in the CRIC laboratories on the Cleveland Clinic laboratory method with a library of five large-volume plasma specimens from apheresis patients. The Cleveland Clinic laboratory was chosen as the ‘reference’ laboratory because it had served as the central laboratory for the Modified Diet in Renal Disease (MDRD) Study [25, 26]. Consequently, all the participating laboratories provided results that were harmonized on the Cleveland Clinic laboratory standards. Finally, all these harmonized results underwent a second harmonization on the Roche Cobas enzymatic method, which had been shown to be standardized against the IDMS reference method. The equation allowing the harmonization on the Roche assay was Roche SCr = 0.1032 + 0.8913 × CRIC SCr [22, 27, 28].
The EFKC cohort (only adults, n = 7727) contains multiple European cohorts. The mGFR was obtained with renal clearance (on inulin) or plasma clearance methods [iohexol, chromium-51 ethylenediaminetetraacetic acid (51Cr-EDTA)]. All SCr results were obtained with SCr assays that were traceable to the IDMS reference method (in Kent, all SCr results were obtained directly with IDMS) [5].
The Minnesota cohort (n = 1093) combines the Genetic Epidemiology Network of Arteriopathy (GENOA, n = 687) and Epidemiology of Coronary Artery Calcification (ECAC, n = 406) cohorts [29]. In Minnesota, the same measurement method (iothalamate renal clearance) was used for mGFR as in the CRIC Study and the patients were White North Americans. SCr was assayed using the IDMS-traceable enzymatic Roche Cobas method (Creatinine Plus, Roche Diagnostics, Indianapolis, IN, USA) [30].
To study the impact of potential differences in SCr calibration on eGFR, we compared the results for different GFR estimating equations, i.e. the 2009 CKD-EPI [age, sex, race (ASR)], the 2021 CKD-EPI [age, sex (AS)] and the EKFC equation [3–5].
Statistics
Patients of Minnesota (n = 1093) were matched to CRIC patients (n = 1548) and the matched pairs were then matched to European patients (n = 7727) in a 1:1:1 ratio, based on the following criteria:
sex,
age ± 3 years,
BMI ± 2.5 kg/m2 and
mGFR ± 3 ml/min/1.73 m2.
Descriptive statistics [mean ± standard deviation (SD)] was used for age, BMI and mGFR in each sex subgroup to demonstrate the success of the matching procedure.
We plotted SCr versus mGFR (the controlling variable) for the matched patients in Europe, Minnesota and CRIC, together with the fitted power function SCr = A × mGFR−B, which allowed easy visual comparison of the systematic shift, if present. We further plotted the distribution of ‘paired’ differences (ideally these distributions should be Gaussian and centred around zero) and the paired differences against mGFR [ideally the patterns should cluster around zero, show no mGFR dependency and show homoscedasticity (having the same scatter)].
Regarding the impact on eGFR results, bias (eGFR − mGFR), interquartile range (IQR = 75th percentile – 25th percentile) and P10/P30 accuracy (the percentage of subjects with eGFR within 10%/30% of mGFR) with 95% confidence intervals (CIs) were calculated in the cohort of matching patients.
RESULTS
Matching Minnesota with CRIC with EKFC
We were able to match 305 subjects from the Minnesota, CRIC and EKFC cohorts. Table 1 presents descriptive statistics for the variables used as matching criteria and for SCr, which allow evaluation of successful matching. The mean SCr was roughly the same in the Minnesota and EKFC cohorts, but much higher in the CRIC, both in males and females.
Table 1.
Demographic and renal characteristics of the matched cohorts
| Sex | Characteristics | Minnesota | CRIC | EKFC |
|---|---|---|---|---|
| Female (n = 140) | Age | 64.3 ± 7.0 | 63.6 ± 7.2 | 64.4 ± 7.1 |
| BMI | 29.1 ± 5.2 | 29.0 ± 5.2 | 28.8 ± 4.9 | |
| mGFR | 64.3 ± 16.1 | 64.1 ± 15.8 | 64.2 ± 16.1 | |
| SCra | 0.83 ± 0.20 | 1.13 ± 0.23 | 0.86 ± 0.30 | |
| Male (n = 165) | Age | 65.1 ± 7.7 | 63.9 ± 7.2 | 65.4 ± 7.8 |
| BMI | 29.5 ± 3.2 | 29.5 ± 3.0 | 29.0 ± 3.0 | |
| mGFR | 67.7 ± 17.5 | 67.5 ± 17.4 | 67.6 ± 17.7 | |
| SCra | 1.06 ± 0.23 | 1.42 ± 0.31 | 1.12 ± 0.37 |
Values presented as mean ± SD.
aMean SCr is not significantly different between the Minnesota and EKFC cohorts but is highly significantly different (P < .0001, t-test) between the CRIC and the other two cohorts.
Comparison of SCr results in the matched cohort
Figures 1–3 present SCr versus mGFR for the matching patients in the different cohorts. The difference between SCr results in the whole mGFR range is confirmed between the CRIC and Minnesota cohort in Figure 1, between the CRIC and EKFC cohort in Figure 2, whereas SCr concentrations were similar between the EKFC and Minnesota cohorts in Figure 3.
FIGURE 1:
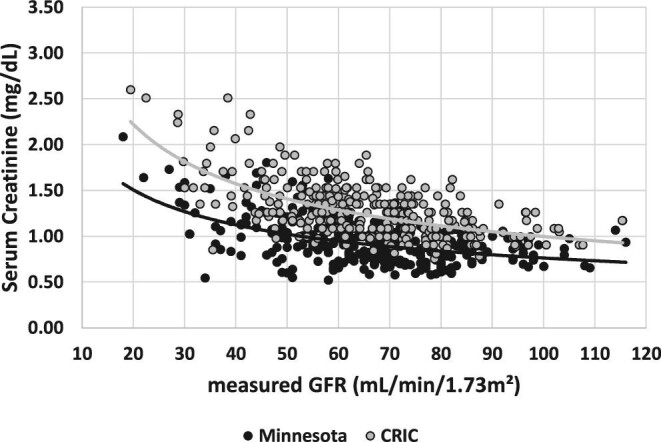
SCr versus mGFR for the matched patients of the Minnesota cohort and CRIC.
FIGURE 3:

SCr versus mGFR for the matched patients of the EKFC and Minnesota cohorts.
FIGURE 2:
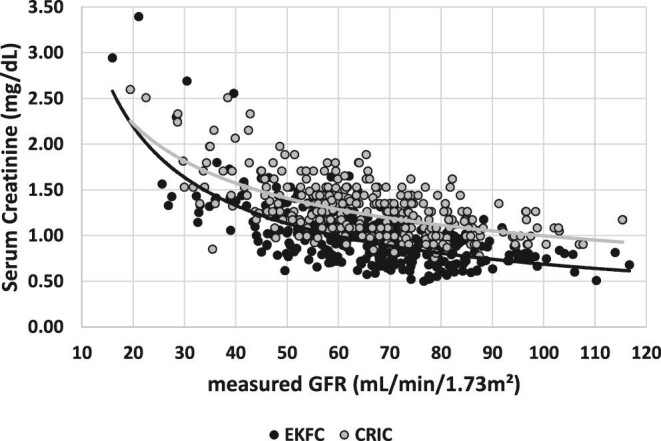
SCr versus mGFR for the matched patients of the EKFC cohort and CRIC.
Figure 4 presents the distributions of the paired differences and the paired differences against average mGFR for the matched patients.
FIGURE 4:

(Left panel) Distributions of paired differences of SCr (solid curve: normal; dotted curve: kernel; vertical dashed line is drawn at zero difference). (Right panel) Paired differences against average mGFR in the matching patients. The horizontal dashed lines are at zero difference, mean difference and the 95% limits of agreement.
Comparison of the performance of eGFR equations in the matched cohort
The performance of the CKD-EPI (ASR), CKD-EPI (AS) and EKFCCrea equations in the matched patients based on the Minnesota, CRIC and EKFC results is shown in Table 2.
Table 2.
Bias, IQR (P25–P75), P10 and P30 statistics (with 95% CI) in the matched subjects (n = 305) for the CKD-EPI (ASR), CKD-EPI (AS) and EKFC equations
| Variables | CKD-EPI (ASR) | CKD-EPI (AS) | EKFCCrea |
|---|---|---|---|
| Minnesota | |||
| Bias | 9.4 (7.5–11.5) | 14.0 (12.2–15.9) | 4.8 (3.1–7.4) |
| IQR (P25–P75) | 19.0 (0.0–19.0) | 19.3 (4.3–23.6) | 16.9 (−3.6–13.3) |
| P10 (%) | 32.5 (27.2–37.7) | 27.9 (22.8–32.9) | 38.4 (32.9–43.8) |
| P30 (%) | 75.7 (70.9–80.6) | 64.6 (59.2–70.0) | 82.3 (78.0–86.6) |
| CRIC | |||
| Bias | −11.2 (−12.5 to −9.5) | −7.7 (−8.9 to −6.0) | −13.2 (−14.3 to −11.5) |
| IQR (P25–P75) | 12.5 (−17.2 to −4.7) | 12.8 (−14.1 to −1.3) | 11.9 (−19.0 to −7.1) |
| P10 (%) | 24.6 (19.7–29.5) | 35.4 (30.0–40.8) | 19.0 (14.6–23.4) |
| P30 (%) | 84.6 (80.5–88.7) | 89.5 (86.0–93.0) | 81.3 (76.9–85.7) |
| EKFC | |||
| Bias | 8.0 (5.6–9.7) | 12.2 (9.6–13.9) | 3.9 (1.9–5.5) |
| IQR (P25–P75) | 17.1 (−0.7–16.4) | 18.1 (3.2–21.3) | 15.2 (−4.1–11.1) |
| P10 (%) | 39.7 (34.2–45.2) | 31.8 (26.5–37.1) | 45.9 (40.3–51.5) |
| P30 (%) | 79.3 (74.8–83.9) | 67.5 (62.3–72.8) | 87.2 (83.4–91.0) |
P25: 25th percentile; P75: 75th percentile.
Bias in the Minnesota and EKFC patients is much smaller for EKFCCrea than for CKD-EPI equation, while the opposite is true for the CRIC patients. Bias in the Minnesota and EKFC data is positive, while it is negative in the CRIC data. P10/P30 accuracy for EKFCCrea is much higher in the Minnesota and EKFC cohorts than in the CRIC, while the opposite is true for the CKD-EPI equation.
DISCUSSION
To compare the relationship between SCr and mGFR between two different populations, an ideal study would use identical methods to measure SCr and GFR, identical methods to identify and recruit study patients with similar demographic characteristics and the same statistical approach. With our original matching approach, we aimed to approximate equivalence with such an ideal study.
The impact of SCr calibration has been illustrated in the past in epidemiological studies (e.g. when comparing the prevalence of CKD with calibrated and uncalibrated results) [16, 31, 32] and in analytical studies (comparing different assays with SCr determined by mass spectrometry) [19, 20]. Here we used cohorts with mGFR and, based on the matching analysis, could show that SCr concentrations were different between the Minnesota and EKFC cohorts and CRIC, most likely due to differences in SCr calibration, which may have a great impact on the performance of equations. However, comparing the CRIC data with the EKFC and Minnesota data is not straightforward. Indeed, there are several differences in the methodologies and patient characteristics of the three studies that need to be considered besides calibration. First, measured GFR in the CRIC and Minnesota cohort is obtained via the clearance of non-radiolabeled iothalamate assayed with capillary electrophoresis from timed plasma and urine samples, whereas mGFR in the EKFC cohort was obtained with iohexol, inulin or 51Cr-EDTA, and mostly using plasma clearance. So there is a clear difference in GFR measurement methods between the CRIC, Minnesota and EKFC cohorts [7, 8, 11, 33]. Second, there are differences in the preparation of patients prior to the measurement of GFR (e.g. fasting state in Minnesota, after a light protein meal in CRIC). Third, there might be population-specific differences between White North Americans (CRIC and Minnesota) and White Europeans due to differences in nutritional habits, muscle mass etc. Fourth, the health status (e.g. diabetes status, cardiovascular risk factors) was probably different between the three cohorts. Thus we cannot exclude that matching for age, sex, BMI and mGFR is sufficient to obtain cohorts with similar properties.
However, in the matched analysis for mGFR, age, BMI and sex, we observed that SCr concentrations in the Minnesota and EKFC cohorts were similar but the SCr concentrations in the CRIC were systematically higher compared with both the Minnesota and EKFC results. The Minnesota cohort and CRIC used the same mGFR measurement method and are both in White North American subjects. Therefore these results suggest that the observed systematic differences in SCr between the Minnesota and EKFC cohorts on one side and the CRIC on the other side, once again in patients sharing the same demographic characteristics and the same mGFR level, may be explained by differences in the calibration of SCr assays. Indeed, it should be emphasized that the Minnesota and EKFC cohorts used assays standardized to the IDMS gold standard method. The way the CRIC SCr values have been calibrated is more debatable. Indeed, SCr was measured in the CRIC before the standardization program and large variability was observed between the different laboratories participating to the CRIC Study [24]. This variability was corrected by ‘recalibrating’ the 13 different analytical platforms used in the CRIC laboratories on the Cleveland Clinic laboratory method with a library of five large-volume plasma specimens from apheresis patients [25, 26]. As a consequence, the results were harmonized (which does not mean that the results were calibrated), but, to the best of our knowledge, no study has been performed to verify the commutability of the apheresis plasma samples with all the methods used by the 13 laboratories. The calibration of these harmonized results required a second calibration with the Roche Cobas enzymatic method, which had been shown to be standardized against the IDMS reference method. Thus this is not a direct calibration to IDMS, but an indirect one, which is far from ideal, as previously shown [15, 32]. Moreover, it remains unclear on which samples the final calibration equation in the CRIC was obtained and if the method used to measure the CRIC SCr was the Beckman CX3 analyser, which had initially been used at the Cleveland Clinic [24, 26, 27].
As illustrated in our study, the impact of SCr calibration on the global performance of different eGFR equations is important. Indeed, we have shown that the performance of the EKFC equation is better in the matched subjects from EKFC cohorts compared with the CKD-EPI equation (as expected, as the equation was developed in part with this cohort), but also in matched subjects from the Minnesota cohort, which is completely independent from both EKFC and CKD-EPI equation development. Because the CRIC was part of the development cohort for the CKD-EPI equation, the better performance of CKD-EPI equation in the CRIC compared with the EKFC cohort is not unexpected, but raises the question of the applicability of the CKD-EPI equation in laboratories using an enzymatic, well-calibrated assay for SCr measurement [13, 14, 32].
The strength of the current study is the large cohorts available, allowing an original analysis based on matched subjects for age, sex, BMI and mGFR, simulating an ideal study setup to compare the SCr and GFR relationship between populations. The limitation is the absence of Black subjects in both the Minnesota and EKFC cohorts. However, there is no reason to believe that the issues of SCr calibration are different in White and Black populations. Although we aimed to match patients based on demographic characteristics (sex, age and BMI) and renal function (mGFR), it remains impossible to totally rule out that biases were affected by other population differences, health status, data cleaning or differences in protocols for mGFR [34, 35].
In conclusion, our results show that even after controlling for age, sex, BMI and mGFR, there were still fundamental differences in the relationship between SCr and mGFR in the studied cohorts. Better standardization of SCr and harmonization of GFR methods are needed for meaningful progress, as differences still exist in widely used epidemiological cohorts, which may have led to biased coefficients and impaired external validity of GFR equations developed based on such cohorts.
ACKNOWLEDGEMENTS
The CRIC Study was conducted by the CRIC Investigators and supported by the National Institute of Diabetes and Digestive and Kidney Diseases (NIDDK). The data from the CRIC Study reported here were supplied by the NIDDK Central Repositories. This manuscript was not prepared in collaboration with investigators of the CRIC Study and does not necessarily reflect the opinions or views of the CRIC Study, the NIDDK Central Repositories or the NIDDK. We would also like to thank all patients and researchers, service users, caregivers and lay people who contributed to the original datasets and are not mentioned here as co-authors.
Contributor Information
Hans Pottel, Department of Public Health and Primary Care, KU Leuven Campus Kulak Kortrijk, Kortrijk, Belgium.
Etienne Cavalier, Department of Clinical Chemistry, University of Liège, CHU Sart Tilman, Liège, Belgium.
Jonas Björk, Division of Occupational and Environmental Medicine, Lund University, Lund, Sweden; Clinical Studies Sweden, Forum South, Skåne University Hospital, Lund, Sweden.
Ulf Nyman, Department of Translational Medicine, Division of Medical Radiology, Lund University, Malmö, Sweden.
Anders Grubb, Department of Clinical Chemistry, Skåne University Hospital, Lund, Lund University, Sweden.
Natalie Ebert, Charité Universitätsmedizin Berlin, Institute of Public Health, Berlin, Germany.
Elke Schaeffner, Charité Universitätsmedizin Berlin, Institute of Public Health, Berlin, Germany.
Björn O Eriksen, Section of Nephrology, University Hospital of North Norway and Metabolic and Renal Research Group, UiT The Arctic University of Norway, Tromsö, Norway.
Toralf Melsom, Section of Nephrology, University Hospital of North Norway and Metabolic and Renal Research Group, UiT The Arctic University of Norway, Tromsö, Norway.
Edmund J Lamb, Clinical Biochemistry, East Kent Hospitals University NHS Foundation Trust, Canterbury, UK.
Christophe Mariat, Service de Néphrologie, Dialyse et Transplantation Rénale, Hôpital Nord, CHU de Saint-Etienne, France.
Laurence Dubourg, Néphrologie, Dialyse, Hypertension et Exploration Fonctionnelle Rénale, Hôpital Edouard Herriot, Hospices Civils de Lyon, France.
Magnus Hansson, Function area Clinical Chemistry, Karolinska University Laboratory, Karolinska University Hospital Huddinge and Department of Laboratory Medicine, Karolinska Institute, Stockholm, Sweden.
Karin Littmann, Division of Clinical Chemistry, Department of Laboratory Medicine, Karolinska Institute, Huddinge, Sweden.
Per-Ola Sundin, Department of Geriatrics, School of Medical Sciences, Örebro University, Örebro, Sweden.
Anna Åkesson, Division of Occupational and Environmental Medicine, Lund University, Lund, Sweden; Clinical Studies Sweden, Forum South, Skåne University Hospital, Lund, Sweden.
Anders Larsson, Department of Medical Sciences, Clinical Chemistry, Uppsala University, Uppsala, Sweden.
Andrew Rule, Division of Nephrology and Hypertension, Mayo Clinic, Rochester, MN, USA.
Pierre Delanaye, Nephrology-Dialysis-Transplantation, University of Liège, CHU Sart Tilman, Liège, Belgium; Department of Nephrology-Dialysis-Apheresis, Hôpital Universitaire Carémeau, Nîmes, France.
FUNDING
No specific funding was obtained for this study.
DATA AVAILABILITY STATEMENT
Data for the matched cohorts can be made available upon request to the corresponding author, after agreement with NIDDK (CRIC Cohort).
CONFLICT OF INTEREST STATEMENT
P.D. is member of the CKJ Editorial Board. The other authors declare no competing interests.
REFERENCES
- 1. Delanaye P, Mariat C.. The applicability of eGFR equations to different populations. Nat Rev Nephrol 2013;9:513–22 [DOI] [PubMed] [Google Scholar]
- 2. Jonsson AJ, Lund SH, Eriksen BOet al. The prevalence of chronic kidney disease in Iceland according to KDIGO criteria and age-adapted estimated glomerular filtration rate thresholds. Kidney Int 2020;98:1286–95 [DOI] [PubMed] [Google Scholar]
- 3. Levey AS, Stevens LA, Schmid CHet al. A new equation to estimate glomerular filtration rate. Ann Intern Med 2009;150:604–12 [DOI] [PMC free article] [PubMed] [Google Scholar]
- 4. Inker LA, Eneanya ND, Coresh Jet al. New creatinine- and cystatin C–based equations to estimate GFR without race. N Engl J Med 2021;385:1737–49 [DOI] [PMC free article] [PubMed] [Google Scholar]
- 5. Pottel H, Björk J, Courbebaisse Met al. Development and validation of a modified full age spectrum creatinine-based equation to estimate glomerular filtration rate. A cross-sectional analysis of pooled data. Ann Intern Med 2021;174:183–91 [DOI] [PubMed] [Google Scholar]
- 6. Pottel H, Delanaye P, Schaeffner ESet al. Estimating glomerular filtration rate for the full age spectrum from serum creatinine and cystatin C. Nephrol Dial Transplant 2017;32:497–507 [DOI] [PMC free article] [PubMed] [Google Scholar]
- 7. White CA, Akbari A, Allen Cet al. Simultaneous glomerular filtration rate determination using inulin, iohexol and 99mTc-DTPA demonstrates the need for customized measurement protocols. Kidney Int 2021;99:957–66 [DOI] [PubMed] [Google Scholar]
- 8. Delanaye P, Jouret F, Le Goff Cet al. Concordance between iothalamate and iohexol plasma clearance. Am J Kidney Dis 2016;68:329–30 [DOI] [PubMed] [Google Scholar]
- 9. Delanaye P, Ebert N, Melsom Tet al. Iohexol plasma clearance for measuring glomerular filtration rate in clinical practice and research: a review. Part 2: why to measure glomerular filtration rate with iohexol? Clin Kidney J 2016;9:682–99 [DOI] [PMC free article] [PubMed] [Google Scholar]
- 10. Stolz A, Hoizey G, Toupance Oet al. Evaluation of sample bias for measuring plasma iohexol clearance in kidney transplantation. Transplantation 2010;89:440–5 [DOI] [PubMed] [Google Scholar]
- 11. Delanaye P, Vidal-Petiot E, Stehlé Tet al. Comparison of plasma clearance with early-compartment correction equations and urinary clearance in high glomerular filtration rate. Kidney Int Rep 2021;6:1622–8 [DOI] [PMC free article] [PubMed] [Google Scholar]
- 12. Delanaye P, Cavalier E, Krzesinski J-Met al. Why the MDRD equation should not be used in patients with normal renal function (and normal creatinine values)? Clin Nephrol 2006;66:147–8 [DOI] [PubMed] [Google Scholar]
- 13. Delanaye P, Cavalier E, Maillard Net al. Creatinine calibration in NHANES: is a revised MDRD study formula needed? Am J Kidney Dis 2008;51:709–10 [DOI] [PubMed] [Google Scholar]
- 14. Delanaye P, Cohen E.. Formula-based estimates of the GFR: equations variable and uncertain. Nephron Clin Pract 2008;110:c48–53 [DOI] [PubMed] [Google Scholar]
- 15. Delanaye P, Cavalier E, Chapelle JPet al. Importance of the creatinine calibration in the estimation of GFR by MDRD equation. Nephrol Dial Transplant 2006;21:1130. [DOI] [PubMed] [Google Scholar]
- 16. Selvin E, Manzi J, Stevens LAet al. Calibration of serum creatinine in the National Health and Nutrition Examination Surveys (NHANES) 1988–1994, 1999–2004. Am J Kidney Dis 2007;50:918–26 [DOI] [PubMed] [Google Scholar]
- 17. Delanaye P, Cavalier E, Pottel H. Serum creatinine: not so simple! Nephron 2017;136:302–8 [DOI] [PubMed] [Google Scholar]
- 18. Delanaye P, Cavalier E, Cristol J-Pet al. Calibration and precision of serum creatinine and plasma cystatin C measurement: impact on the estimation of glomerular filtration rate. J Nephrol 2014;27:467–75 [DOI] [PubMed] [Google Scholar]
- 19. Bargnoux AS, Piéroni L, Cristol JPet al. Multicenter evaluation of cystatin C measurement after assay standardization. Clin Chem 2017;63:833–41 [DOI] [PubMed] [Google Scholar]
- 20. Boutten A, Bargnoux AS, Carlier MCet al. Enzymatic but not compensated Jaffe methods reach the desirable specifications of NKDEP at normal levels of creatinine. Results of the French multicentric evaluation. Clin Chim Acta 2013;419:132–5 [DOI] [PubMed] [Google Scholar]
- 21. Piéroni L, Delanaye P, Boutten Aet al. A multicentric evaluation of IDMS-traceable creatinine enzymatic assays. Clin Chim Acta 2011;412:2070–5 [DOI] [PubMed] [Google Scholar]
- 22. Hsu C, Yang W, Parikh RVet al. Race, genetic ancestry, and estimating kidney function in CKD. N Engl J Med 2021;385:1750–60 [DOI] [PMC free article] [PubMed] [Google Scholar]
- 23. Feldman HI, Appel LJ, Chertow GMet al. The Chronic Renal Insufficiency Cohort (CRIC) study: design and methods. J Am Soc Nephrol 2003;14:148–53 [DOI] [PubMed] [Google Scholar]
- 24. Joffe M, Hsu CY, Feldman HIet al. Variability of creatinine measurements in clinical laboratories: results from the CRIC study. Am J Nephrol 2010;31:426–34 [DOI] [PMC free article] [PubMed] [Google Scholar]
- 25. Levey AS, Bosch JP, Lewis JBet al. A more accurate method to estimate glomerular filtration rate from serum creatinine: a new prediction equation. Modification of Diet in Renal Disease Study Group. Ann Intern Med 1999;130:461–70 [DOI] [PubMed] [Google Scholar]
- 26. Levey AS, Coresh J, Greene Tet al. Expressing the modification of diet in renal disease study equation for estimating glomerular filtration rate with standardized serum creatinine values. Clin Chem 2007;53:766–72 [DOI] [PubMed] [Google Scholar]
- 27. Anderson AH, Yang W, Hsu Cet al. Estimating GFR among participants in the Chronic Renal Insufficiency Cohort (CRIC) Study. Am J Kidney Dis 2012;60:250–61 [DOI] [PMC free article] [PubMed] [Google Scholar]
- 28. Ku E, Xie D, Shlipak Met al. Change in measured GFR versus eGFR and CKD outcomes. J Am Soc Nephrol 2016;27:2196–204 [DOI] [PMC free article] [PubMed] [Google Scholar]
- 29. Rule AD, Bailey KR, Lieske JCet al. Estimating the glomerular filtration rate from serum creatinine is better than from cystatin C for evaluating risk factors associated with chronic kidney disease. Kidney Int 2013;83:1169–76 [DOI] [PMC free article] [PubMed] [Google Scholar]
- 30. Murata K, Baumann NA, Saenger AKet al. Relative performance of the MDRD and CKD-EPI equations for estimating glomerular filtration rate among patients with varied clinical presentations. Clin J Am Soc Nephrol 2011;6:1963–72 [DOI] [PMC free article] [PubMed] [Google Scholar]
- 31. Coresh J, Eknoyan G, Levey AS.. Estimating the prevalence of low glomerular filtration rate requires attention to the creatinine assay calibration. J Am Soc Nephrol 2002;13:2811–2 [DOI] [PubMed] [Google Scholar]
- 32. Björk J, Bäck SE, Nordin Get al. How valid are GFR estimation results from the CKD-EPI databases? Am J Kidney Dis 2018;71:446. [DOI] [PubMed] [Google Scholar]
- 33. Soveri I, Berg U, Björk Jet al. Measuring GFR: a systematic review. Am J Kidney Dis 2014;64:411–24 [DOI] [PubMed] [Google Scholar]
- 34. Rule AD, Teo BW.. GFR estimation in Japan and China: what accounts for the difference? Am J Kidney Dis 2009;53:932–5 [DOI] [PMC free article] [PubMed] [Google Scholar]
- 35. Delanaye P, Cavalier E, Mariat Cet al. Estimating glomerular filtration rate in Asian subjects: where do we stand? Kidney Int 2011;80:439–40 [DOI] [PubMed] [Google Scholar]
Associated Data
This section collects any data citations, data availability statements, or supplementary materials included in this article.
Data Availability Statement
Data for the matched cohorts can be made available upon request to the corresponding author, after agreement with NIDDK (CRIC Cohort).