Abstract
BACKGROUND
The sinoatrial node (SAN) of the heart produces rhythmic action potentials, generated via calcium signaling within and among pacemaker cells. Our previous work has described the SAN as composed of a hyperpolarization-activated cyclic nucleotide-gated potassium channel 4 (HCN4)-expressing pacemaker cell meshwork, which merges with a network of connexin 43+/F-actin+ cells. It is also known that sympathetic and parasympathetic innervation create an autonomic plexus in the SAN that modulates heart rate and rhythm. However, the anatomical details of the interaction of this plexus with the pacemaker cell meshwork have yet to be described.
OBJECTIVES
This study sought to describe the 3-dimensional cytoarchitecture of the mouse SAN, including autonomic innervation, peripheral glial cells, and pacemaker cells.
METHODS
The cytoarchitecture of SAN whole-mount preparations was examined by three-dimensional confocal laser-scanning microscopy of triple immunolabeled with combinations of antibodies for HCN4, S100 calcium-binding protein B (S100B), glial fibrillary acidic protein (GFAP), choline acetyltransferase, or vesicular acetylcholine transporter, and tyrosine hydroxylase, and transmission electron microscopy.
RESULTS
The SAN exhibited heterogeneous autonomic innervation, which was accompanied by a web of peripheral glial cells and a novel S100B+/GFAP− interstitial cell population, with a unique morphology and a distinct distribution pattern, creating complex interactions with other cell types in the node, particularly with HCN4-expressing cells. Transmission electron microscopy identified a similar population of interstitial cells as telocytes, which appeared to secrete vesicles toward pacemaker cells. Application of S100B to SAN preparations desynchronized Ca2+ signaling in HCN4-expressing cells and increased variability in SAN impulse rate and rhythm.
CONCLUSIONS
The autonomic plexus, peripheral glial cell web, and a novel S100B+/GFAP− interstitial cell type embedded within the HCN4+ cell meshwork increase the structural and functional complexity of the SAN and provide a new regulatory pathway of rhythmogenesis.
Keywords: brain-like cytoarchitecture and function, calcium signaling, HCN4 cells, interstitial cells, intrinsic cardiac ganglion, pacemaker, peripheral glial cells, rhythm, S100B, sinoatrial node, telocytes
The heart is a central player in the hierarchical system of clocks operating within the body-wide neuro-visceral axis that determines the timing of synchronized rhythmic functions ranging from milliseconds to days, including cardiac beating rate. Brain stem neurons, with connections to and from cortical neurons, generate electrical signals that are conducted rostrally to neuronal ganglia embedded on the epicardial surface and to blood vessels that emerge from the heart.1 Axons from epicardial ganglionic neurons, “the little brain on the heart,”2 penetrate into the sinoatrial node (SAN),3 encountering and embracing SAN pacemaker cells, secreting neurotransmitters. 4,5 Activation of autonomic receptor-driven signaling within SAN cells by these transmitters affects the action potential (AP) firing rate and rhythm in SAN cells by modulating the tempo and ticking speed of an intrinsic coupled-clock system that drives their automaticity: the sarcoplasmic reticulum, a Ca2+ clock that generates diastolic local subcellular Ca2+ signals that self-organize via a criticality mechanism,6–8 and couples to an ensemble of surface membrane ion channels (M-clock), operating on a limit cycle mechanism to produce plasma membrane current oscillations.9,10 Evolution of the resultant electrochemical signal produced by the coupled-clock system during diastole results in progressive depolarization of the cell surface, culminating in an AP. Neurotransmitter input to SAN cells has an impact on the degree to which the Ca2+ and membrane potential clocks couple to each other, and therefore the duration and frequency of the AP ignition process, by modulating the kinetics of the molecular functions that drive the coupled clock system in the absence of neurotransmitter input. For example, sympathetic autonomic receptor stimulation improves clock coupling, resulting in an earlier onset of the ignition process and an increase in the pacemaker AP firing rate, in contrast to parasympathetic stimulation.
A recent discovery has added a new layer of complexity to the initiation of each heartbeat that extends well beyond the coupled-clock system intrinsic to individual SAN cells. Specifically, local oscillatory calcium signals that are heterogeneous in phase, amplitude, and frequency emerge within a meshwork of hyperpolarization-activated cyclic nucleotide-gated potassium channel 4 (HCN4)-expressing cells extending nearly the entire length and depth of the central SAN.11 The synchronization of local Ca2+ events occurring within an area12 generates a Ca2+ transient within the area having distinct kinetics of formation and decay similar to an AP cycle generated by the couple-clock system in SAN cells.12 Local Ca2+ signals that emerge within and among SAN pacemaker cells self-organize to create impulses that exit the SAN and are conducted to other parts of the heart to generate heartbeats, even in the absence of input from the brain stem.
How local Ca2+ signals within and among SAN pacemaker cells can self-organize into a critical synchronized event that emerges from the SAN to initiate heartbeats in the absence of neuronal input is not at all intuitive, however. Recent observations provide a valuable clue: it has been noted that this multiscale, complex process of impulse generation by pacemaker cells residing within the SAN resembles the emergence of organized signals from heterogeneous local signals occurring within clusters of neurons comprising brain neuronal networks. The variable morphology of HCN4+ pacemaker cells within the SAN suggests that these cells may differ in the fine-tuning of their functions that could contribute to heart rhythm generation in different ways. Furthermore, some HCN4+ cells project branches to the neighboring cells ending with endfeet11 that are similar in shape and size to those of astrocytes within the brain.13 It has also been shown that certain non-excitable cells could be electrically integrated within the SAN and may modulate the excitability of the cardiac pacemaker.14 Because the communication between SAN cells11 resembles the emergence of neuronal signals within the brain,15 we reasoned that, beyond the known association of peripheral glial cells (PGCs) and autonomic nerves, the SAN also harbors multicellular complexes similar to the neuro-glial interactions in nervous tissue.
Brain glial cells are active players in the formation and function of neuronal brain circuitry, and the incompleteness of discussing brain structure and function without the inclusion of glial cells has been realized previously.16 The role of glial cell support functions, including myelination, synapse-pruning, and macrophagy, has long been known, and their crucial function in modulating neuronal communication has also been appreciated.17 For instance, microglia have been shown to reduce neural activity by releasing adenosine, in a mechanism similar to inhibitory synaptic transmission18; satellite glia were shown to regulate the strength and firing rate of spontaneous synaptic transmission between sympathetic neurons and to promote the formation of synaptic sites, with a specific effect on the formation of presynaptic structures.18,19 In contrast to the mass of information available on the roles of central nervous system (CNS) glia, information regarding the presence of cytoarchitecture and functions of PGC in the heart is conspicuously sparse.20
Here, we hypothesized that neuronal cells, PGCs, and pacemaker cells may interconnect in functional units within the SAN and display a type of cytoarchitecture with anatomical interactions similar to those found in neuronal tissue. Specifically, glial and neuronal cells may create a microenvironment around pacemaker cells dedicated to the regulation not only of local Ca2+ releases (LCRs) within individual pacemaker cells but also to the regulation of intercellular communication among pacemaker cells that crucially affect heart rhythm. The spatial pattern of LCRs across SAN that emerges from intercellular communications may be monitored and regulated by a functional unit of neuronal, glial, and pacemaker cells. To this end, we used novel 3-dimensional (3D) confocal tile imaging techniques to optically dissect the entire mouse SAN (top to bottom, inside to outside) and to reconstruct SAN cytoarchitecture from 3D optical slices, with respect to neuronal fibers and PGCs.
METHODS
Detailed methods for immunolabeling, confocal microscopy, transmission electron microscopy (TEM), microelectrode recordings, and data analysis are described in the Supplemental Methods.
ANIMAL HANDLING.
Our experiments conformed to the Guide for the Care and Use of Laboratory Animals, published by the U.S. National Institutes of Health. The experimental protocols were approved by the Animal Care and Use Committee of the National Institutes of Health (protocol #034-LCS-2019). We used 1- to 3-month-old C57BL mice (Charles River Laboratories) and HCN4-GCaMP8 transgenic mice (The Jackson Laboratory; strain #028344), anesthetized with sodium pentobarbital (50 mg/kg). The adequacy of anesthesia was monitored until reflexes to tail pinch were lost.
ANTIBODIES.
HCN4+ cells were identified by rabbit polyclonal antibodies for cyclic nucleotide-gate cation channels HCN4 (1:300; Alomone Labs). S100 calcium-binding protein B (S100B) meshwork was identified by a recombinant rabbit monoclonal anti-S100B antibody (1:250; clone EP1576Y; catalog #ab52642; Abcam) and a chicken polyclonal antiS100B antibody (1:300; catalog #287006; Synaptic Systems, GmbH).
The parasympathetic nervous system was visualized by a goat polyclonal anti–choline acetyltransferase (ChAT) antibody (1:300; catalog #AB144P from MilliporeSigma) and a guinea pig anti–vesicular acetylcholine transporter (VAChT) antibody (1:300; catalog #139 105 from Synaptic Systems). Sympathetic nerve fibers were visualized by 2 anti–tyrosine hydroxylase (TH) antibodies, a mouse monoclonal (clone LNC1, Alexa-488 conjugated, catalog #MAB318-AF-488, 1:250 dilution) and a chicken polyclonal (AB9702, 1:250), both from MilliporeSigma. Astrocytic glial cells were labeled with 2 polyclonal anti–glial fibrillary acidic protein (GFAP) antibodies, a goat anti-GFAP (1:300, catalog #SAB2500462; MilliporeSigma) and chicken anti-GFAP (1:300; catalog #PA1–10004; Invitrogen), and a rabbit anti-S100B antibody (1:300; catalog #ab196175; Abcam). Nuclei were visualized with 500 nM 4′,6-diamidino-2-phenylindole (DAPI) in phosphate-buffered saline for 30 minutes.
IMAGING OF LOCAL CA2+ SIGNALS IN SAN TISSUE.
These experiments were performed in ex vivo, horizontally mounted, perfused SAN prep that was carefully dissected from mouse hearts. We used a 5 × air objective to obtain a wide-field view of the SAN and recorded Ca2+ dynamics using HCN4-GCaMP8 transgenic mice expressing a genetically encoded fluorescent Ca2+ indicator in HCN4+ pacemaker cells (The Jackson Laboratory; strain #028344; specific details about resolution are provided in the Supplemental Methods). Background Ca2+ fluorescence was negligible in the diastolic phase, creating a high signal-to-noise ratio when recording AP-induced Ca2+ transients. Our 2-dimensional (2D)-calcium images were recorded from the endocardial side of the SAN and did not include Ca2+ dynamics within deeper layers of the HCN4+ meshwork or within pacemaker cells located near the epicardial surface. The signal-to-noise ratio of Ca2+-induced fluorescence allowed us to reliably detect AP-induced Ca2+ transients from SAN preparations for up to 1 hour after the first moment of exposure to the excitation light of the objective during recording (n = 3). In each preparation, S100B was added to the superfusate within 10 to 15 minutes from the initial control recordings, and its effects were imaged.
RESULTS
PANORAMIC IMAGING OF THE HCN4+ MESHWORK AND INTERTWINING NEURONAL NETWORK WITHIN THE SAN.
We optically sectioned SAN tissue using a conventional confocal microscopy technique and tiled 3D Z-stacks into a panoramic 3D image of the SAN 350 μm deep, 8 mm long, and 4 mm wide (Figure 1). 3D SAN panoramic imaging presents a nearly complete picture of both the HCN4+ meshwork and of all nerve fibers passing throughout the SAN and right atrium. We use the previously proposed nomenclature of “head,” “body,” and “tail”21 throughout the text to describe HCN4 immunoreactive pacemaker meshwork (indicated by red color in Figure 1). The “head” of the meshwork forms around the root of the superior vena cava (SVC) and continues through the “body” of the meshwork along the course of the SA nodal artery, with the “tail” extending to the root of the inferior vena cava (IVC).
FIGURE 1. Panoramic 3-Dimensional Reconstruction of SAN Autonomic Innervation.
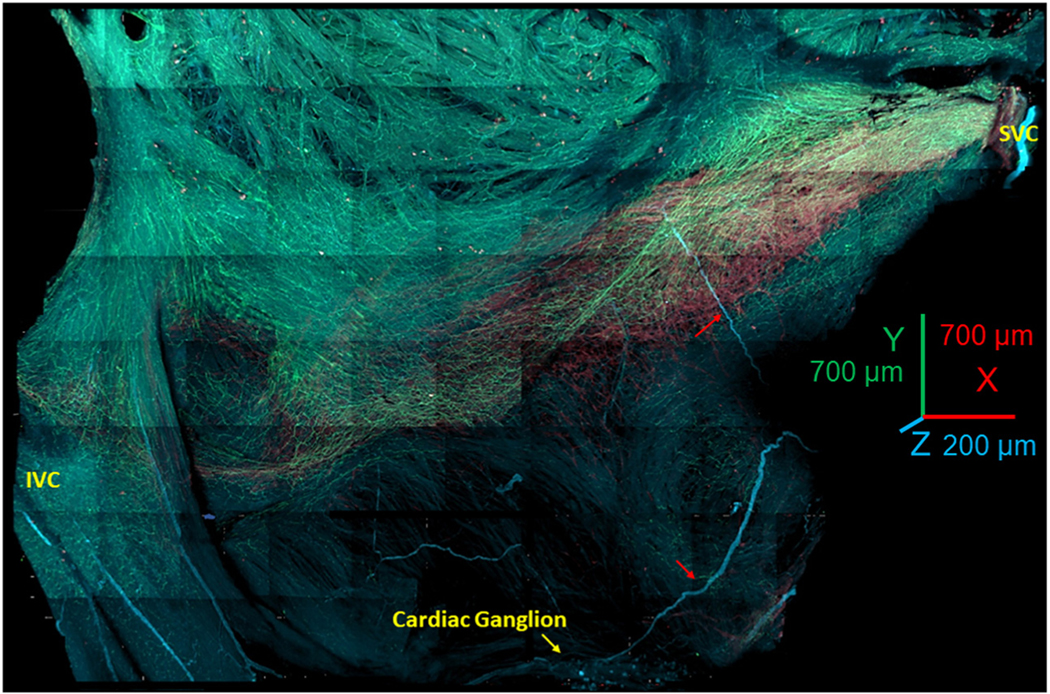
The image shows the area from the superior vena cava (SVC) (right side of the image) to the inferior vena cava (IVC) (left side of the image) and from the septum to the crista terminalis. The “head” of the hyperpolarization-activated cyclic nucleotide-gated channel 4–positive pacemaker cell meshwork forms around the root of the SVC; the “body” of the meshwork continues along the course of the sinoatrial nodal (SAN) artery, forming the “tail” that extends to the root of the IVC. The image presents all adrenergic (tyrosine hydroxylase; cyan) and cholinergic (vesicular acetylcholine transporter; green) fibers within the SAN and right auricle. The neuronal plexus enwrapped the hyperpolarization-activated cyclic nucleotide-gated channel 4–positive immunoreactive meshwork (red color) and penetrated into the pectinate muscles of the right auricle. Cardiac ganglia (yellow arrow at the bottom of the figure) were located near the epicardial side of the septum. Red arrows point to nerves emanating from these ganglia, which penetrated the tissue.
The panoramic 3D image depicted in Figure 1 highlights the innervation of the HCN4+ pacemaker meshwork interwoven with cholinergic and adrenergic fibers. Pacemaker cells, parasympathetic fibers, and sympathetic fibers of the SAN neuronal plexus immunoreactive for HCN4, VChAT, and TH, respectively, were readily identifiable up to 350 μm in depth in the SAN tissue in all whole-mount preparations (n = 3). The dense plexus of fine nerve fibers around pacemaker cells in all sites of the HCN4+ meshwork spanned both the SAN and the pectinate muscles of the right and left atria. Neuronal fibers of the SAN plexus also extended to cover contiguous areas along the borders of the HCN4+ meshwork. SAN 3D images at millimeter scale showed that the 3D patterns of cholinergic and adrenergic innervation were irregular and did not resemble each other. The 3D density patterns of adrenergic and cholinergic fibers were markedly patchy and created areas with dominant cholinergic or adrenergic innervation. Neural plexus density was noticeably greater within the HCN4+ pacemaker cell meshwork and adjacent areas than in the surrounding atrial walls, in accordance with previous reports.5,22
DETAILED IMAGING OF CHOLINERGIC AND ADRENERGIC INNERVATION OF THE SAN.
2D images taken with high magnification lens (Figure 2, center of A) indicate that adrenergic and cholinergic innervation do not overlap and that the pattern of innervation varies within and among SAN regions, as previously documented.23 Endo-epicardial optical slices were taken through the pink and yellow dashed lines in Figure 2A. The innervation gradients of the SAN are distinguishable by distribution of adrenergic and cholinergic varicosities within the endo-epicardial axis. The presence of neuronal varicosities found in immunonegative space containing DAPI-labeled nuclei suggests that adrenergic and cholinergic varicosities innervate not only HCN4+ pacemaker cells but also other cell types for which we did not immunolabel.
FIGURE 2. 3-Dimensional Images of the Cholinergic and Adrenergic Neuronal Plexus Gradients Within the HCN4+ Immunoreactive Pacemaker Cell Meshwork.
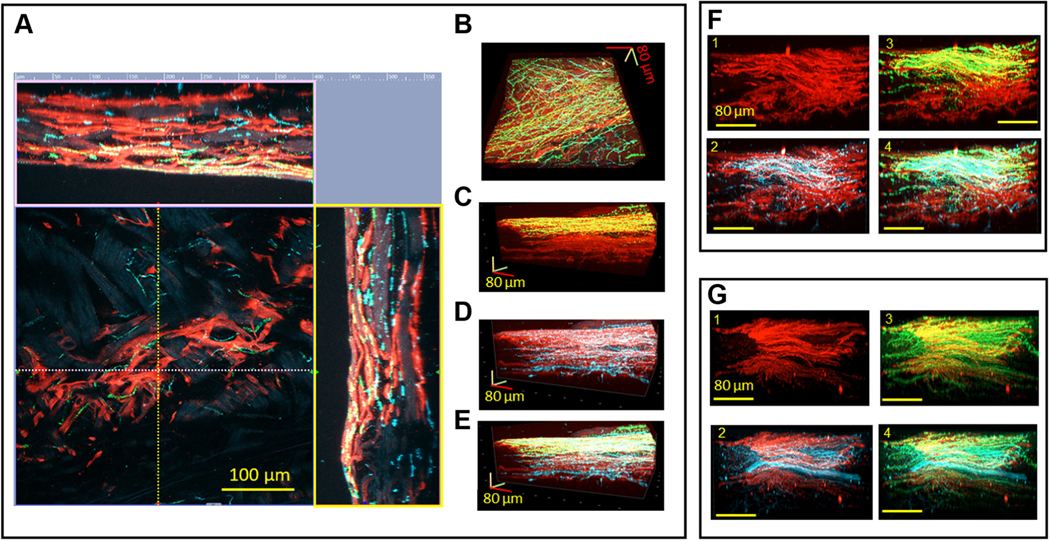
(A) Two-dimensional central image of hyperpolarization-activated cyclic nucleotide-gated channel 4–positive (HCN4+) (red) pacemaker cells and neuronal plexus. The 2 side images represent reconstructed virtual cuts of the SAN tissue from the endocardial to the epicardial side. The x-axis (pink broken line) and the y-axis (yellow broken line) on the 2-dimensional central image show the lines where the virtual cuts in the pink and yellow frames were taken. Vesicular acetylcholine transporter (VAChT) (green) and tyrosine hydroxylase (TH) (cyan) immunoreactive varicosities are co-localized with HCN4+ immunoreactive (red) pacemaker cells. (B to E) Three-dimensional images reconstructed from the series of 2-dimensional images, an example of which is shown in the central image of A. The endocardial side is on the top of the images of C to E. B displays a 3-dimensional HCN4+ meshwork (red) of the pacemaker cells seen from the endocardial side and the neuronal plexus of VAChT (green) and TH (cyan) immunoreactive neuronal fibers. In the center of the 3-dimensional image, the neuronal plexus has higher innervation than in the lower right and upper left corners. C illustrates a 3-dimensional image of the endo-epicardial gradient of cholinergic nerves. D illustrates the adrenergic innervation from the endocardial to the epicardial side. E image illustrates overlapping of the adrenergic and cholinergic innervation from the endocardial to the epicardial side. (F and G) Illustration of the meshwork of HCN4+ pacemaker cells (red) from 2 different whole-mount SAN preparations, and their associated adrenergic and cholinergic neuronal plexuses. F1 and G1 show the HCN4+ meshwork (red), F2 and G2 show the HCN4+ meshwork of pacemaker cells (red) and TH+ neuronal plexus (cyan), F3 and G3 show the HCN4+ meshwork of pacemaker cells (red) and VAChT+ neuronal plexus (green), and F4 and G4 show the HCN4+ meshwork (red), TH+ neuronal plexus (cyan), and VAChT+ neuronal plexus (green).
We used 3D images to visualize the entire innervation pattern to quantitatively determine the 3D gradients of cholinergic and adrenergic innervation relative to the septum-crista axis and the SVC-IVC axis. Figure 2 displays 3D images of an area of SAN tissue 400 μm by 400 μm and by 160 μm in depth, in the midpoint between the IVC and SVC on the junction with septum. The 3D image is seen flat from the endocardial side in Figure 2B, and the side view of the same Z-stacks is displayed in Figures 2C to 2E. This enables the visualization of both the flat 3D gradient of autonomic innervation (Figure 2B) as well as the endo-epicardial gradient (Figures 2C to 2E). Adrenergic input was present throughout the entire 150 μm total Z-depth of the tissue from endocardium to epicardium (Figure 2C), whereas cholinergic neurites only innervated the HCN4+ meshwork up to a depth of 70 μm from the endocardial side (Figure 2D). In Z-stacks of 2 additional SAN preparations, taken from the same location as in Figures 2A to 2E, we found gradients of innervation but with different patterns (Figures 2F and 2G). This variability of 3D innervation pattern between preparations suggests that the pattern of autonomic innervation may be determined by multiple factors, including meshwork cytoarchitecture and density of SAN capillaries.24 Thus, the presence of portions of the HCN4+ meshwork with an apparent scarcity of cholinergic or adrenergic neurites allows us to speculate that in these areas, the AP firing rate may be modulated only by sympathetic or parasympathetic signaling, creating regions of dominant neuronal input from either one or the other.
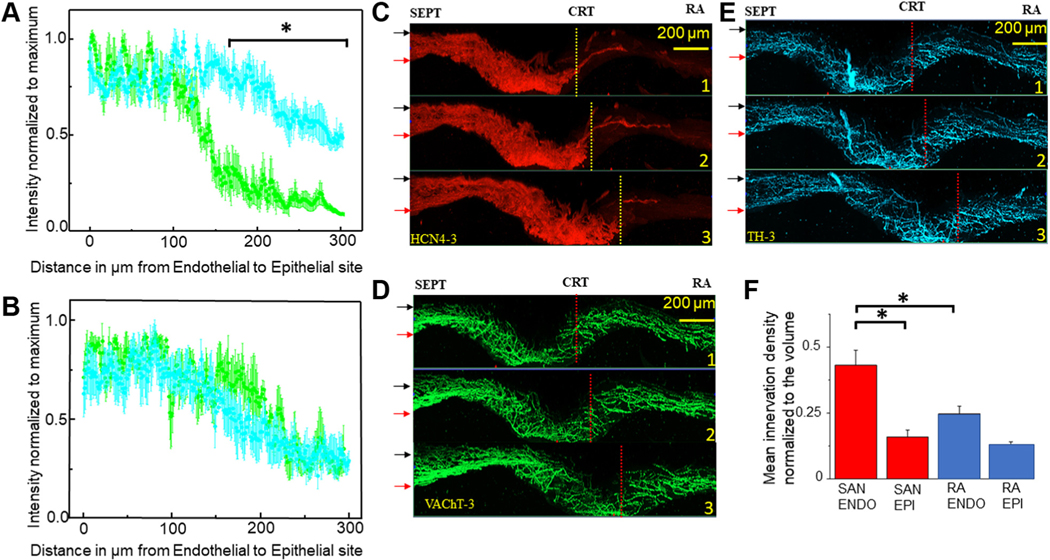
In quantifying the endo-epicardial autonomic innervation distribution patterns, we found both sharp and linear gradients. Analysis of seven Z-stacks for each type of gradient resulted in the plots of mean normalized density over endo-epicardial distance shown in Figures 3A and 3B. The plot in Figure 3A depicts the mean density of cholinergic innervation, with a sharp decrease in neuronal varicosity density of up to 4 times over a 25 μm distance from endocardium to epicardium, whereas adrenergic innervation is fairly homogeneous. In Figure 3B, a gradual decrease of up to 2 times the density of neuronal varicosities over a 100 μm distance from the endocardial to the epicardial side can be seen for both adrenergic and cholinergic innervation.
FIGURE 3. 3-Dimensional Images of the Cholinergic and Adrenergic Neuronal Plexus Gradients Within the HCN4+ Immunoreactive Pacemaker Cell Meshwork.
Mean density of adrenergic and cholinergic neuronal fibers normalized to maximum measured in 7 Z-stacks from 3 SAN preparations immunolabeled to VAChT (green) and TH (cyan) plotted against the SAN tissue deepness. The x-axes indicate tissue depth starting from 0 μm at the endocardial side and ends 300 μm at the epicardial site at. (A) Sharp gradient in which density of cholinergic innervation declines from its maximum near the endocardial site to its minimum within a distance of ~50 μm. (B) Linear gradient in which the density of cholinergic innervation declines from its maximum at the endocardial side to its minimum within a distance of ~100 μm. (C to E) Three-dimensional panoramic images of the SAN with triple immunolabeling of pacemaker cells HCN4 (red), cholinergic VAChT (green), and adrenergic TH (cyan) neuronal plexus separated in 3 channels. In C to E, the 3-dimensional virtual slice for Image 1 was taken at 1,000 μm from the root of the SVC, Image 2 at 1,250 μm, and Image 3 at 1,500 μm. Red arrows point to the endocardial site and black arrows point to the epicardial side of the SAN. SEPT indicates the site of septum; CRT above the yellow or red broken line indicates location of the crista terminalis; and RA indicates the right auricle. F summarizes the mean density of adrenergic and cholinergic innervation together near endocardial (ENDO) and epicardial (EPI) sites within the SAN (red bars) and within the RA (blue bars). At the 0.05 certainty level, the mean neuronal plexus density per 0.001 mm3 (50 μm by 100 μm by 200 μm) volume has higher density at the endocardial side of the SAN than in the auricle as tested by one-way analysis of variance. Asterisk highlights compared datasets that had showed higher density of neuronal plexus. Other abbreviations as in Figures 1 and 2.
To assess the evolution of endo-epicardial innervation gradients from the septum to the crista terminalis at millimeter scale, we produced 1.3 mm wide, 300 μm deep, and 100 μm thick 3D images of SAN innervation (Figures 3C to 3E). The upper 3D image on all panels was taken 550 μm away from the aperture of the SVC, the middle image at 850 μm, and the lower image at 1,050 μm from SVC. Both sharp and linear gradients of innervation can be tracked across the SAN, heterogeneously dispersed along the SVC-IVC and septum-crista axes, suggesting that the density of autonomic innervation depends not only on the cytoarchitecture of the meshwork but on other factors such as densities of capillaries within the SAN.24 Quantitative comparison of the combined adrenergic and cholinergic innervation in the endocardial and epicardial side showed that although the endocardial side of SAN had higher innervation density than was detected in the adjacent portions of the right atrium, the innervation at the epicardial side within the SAN meshwork and auricle is not significantly different (Figure 3F).
In sum, it is clear from Figures 2 and 3 that we find significant heterogeneity within and among preparations in the innervation patterns of the SAN, and that cells other than pacemaker cells are innervated and may contribute to nerve density gradients.
TRIPLE IMMUNOSTAINING OF PACEMAKER CELLS AND PGCs IN THE SAN WITH GFAP, S100B, AND HCN4 ANTIBODIES.
PGCs have not yet been investigated within the SAN in relation to the HCN4+ meshwork at the macroscopic level. GFAP and S100B, in combination with morphologic characteristics, have been used to identify glial cells in periphery and CNS.25,26 We designed a triple immunostaining procedure (S100B, GFAP, and HCN4) to image PGCs and SAN pacemaker cells simultaneously in 3 wholemount preparations.
The panoramic tiled 2D image (4 mm by 1.2 mm) in Figure 4A shows cells immunoreactive to GFAP and S100B with a somatic shape resembling “stars” scattered among HCN4+ cells, across the entire SAN. GFAP and S100B immunoreactive somata of PGCs embedded within the SAN were interconnected by GFAP+ branches and created a “web”-like regular pattern within and outside the HCN4+ immunoreactive meshwork.
FIGURE 4. 2-Dimensional Images of the Whole-Mount SAN Preparations With Triple Immunolabeling Illustrating PGCs and SAN Pacemaker Cells Imaged by Optical Slicing.
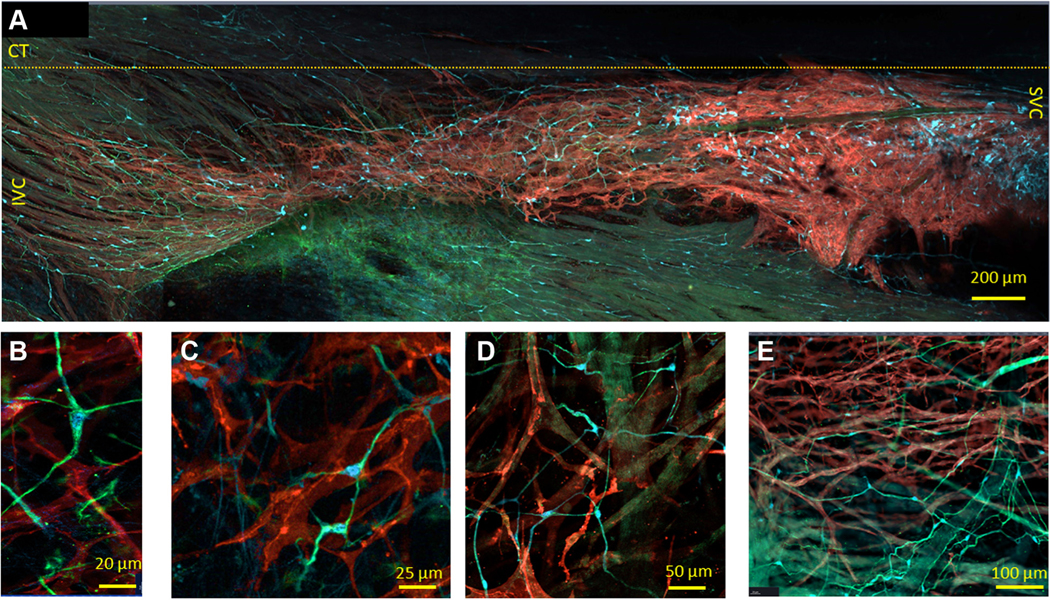
(A) Tiled panoramic 2-dimensional image (4 mm by 1.2 mm), illustrating the cytoarchitecture of the HCN4-immunoreactive meshwork from the SVC to the IVC; the approximate border of crista terminalis (CT) is indicated by the yellow broken line. Glial fibrillary acidic protein–positive (GFAP+) (green) and S100 calcium-binding protein B–positive (S100B+) (cyan) cells are scattered between HCN4-immunoreactive cells (red color) across the SAN. (B to E) Peripheral glial cells (PGCs) immunoreactive to GFAP and to S100B among HCN4+ cells, imaged with high optical magnification. GFAP+ was detected in higher levels than S100B+ within the branch PGCs. (E) Web of PGCs near the lumen of the blood vessels. Abbreviations as in Figures 1 and 2.
A closer look at the PGCs within the SAN revealed “star”-shaped cells with elongated soma of 10.2 ± 0.8 μm, which had 2, 3, 4, or 5 projections (Figures 4B to 4D). Those PGCs found to express both S100B and GFAP exhibited uniform morphology across both SAN and auricle. Interestingly, the web of PGCs was found to also surround the borders of the lumen of blood vessels (Figure 4E).
S100B+/GFAP− INTERSTITIAL CELLS WITHIN THE SAN.
Surprisingly, we observed S100B+ cells that were GFAP immunonegative, many of which were grouped in clusters, in contrast to PGCs. The morphology of these GFAP−/S100B+ cells sharply differed from the “star”-like cellular shape of PGCs. The 3D image of the triple immunolabeled wholemount SAN preparation in Figure 5 shows that this novel cell type was mostly confined to within the borders of the HCN4+ meshwork. In the 3D panoramic image in Figure 5, S100B+/GFAP− cells are grouped in one cluster in the “head” of the HCN4+ meshwork (right side of the 3D image near SVC) and a second cluster on the left, toward the IVC. Some of the S100B+/GFAP− cells were scattered across the “body” of the HCN4+ meshwork, and a few small clusters can be detected in the “tail” section of the SAN (left side of the image near the IVC).
FIGURE 5. 3-Dimensional Image of the Whole-Mount SAN Preparation Showing S100B+/GFAP− Cells.
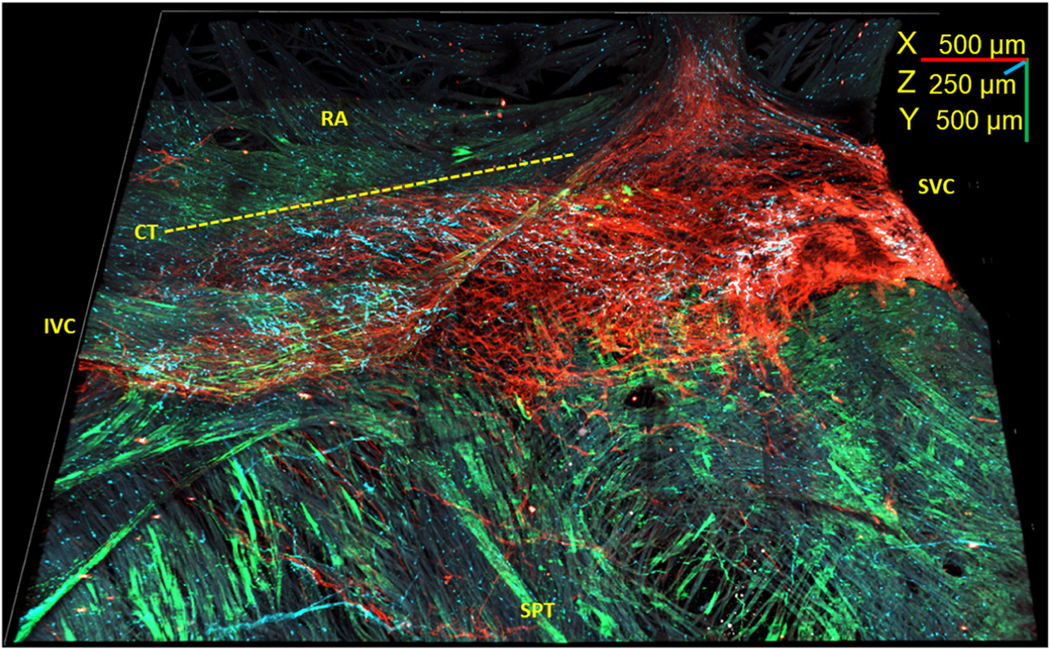
Three-dimensional reconstruction of the SAN from the SVC (right) to the IVC (left) and from the septum (SPT) (bottom) to the right auricle (RA) (top) 4.5 mm long, 3.5 mm wide, and 250 μm deep. Novel S100B+ (cyan)/GFAP− (green) cells were detected within the HCN4+ meshwork (red). The RA lacks S100B+ (cyan)/GFAP− (green) interstitial cells. Dotted line indicates the border of crista terminalis (CT). Abbreviations as in Figures 1 and 4.
The distribution pattern of S100B+/GFAP− interstitial cells was variable among different SAN preparations studied (Figure 6) relative to the “head,” “body,” and “tail” regions of the HCN4+ meshwork. All 3 regions had similar ranges of detected S100B+/GFAP− interstitial cells, suggesting that their presence within the SAN is determined by multiple factors and not only by the cytoarchitecture of the pacemaker cell within the meshwork. The number of S100B+/GFAP− cells within SANs, detected by counting DAPI-labeled nuclei, ranged from 21 to 148, and averaged 72.3 ± 18.6 of cells per SAN region (n = 7). It should be noted, however, that it is a rough estimate, because the exact number of S100B+/GFAP− cells is difficult to quantify due to their overlapping and interlacing.
FIGURE 6. Variability in the Number of Detected S100B+ Interstitial Cells in the Head, Body, and Tail of the SAN.
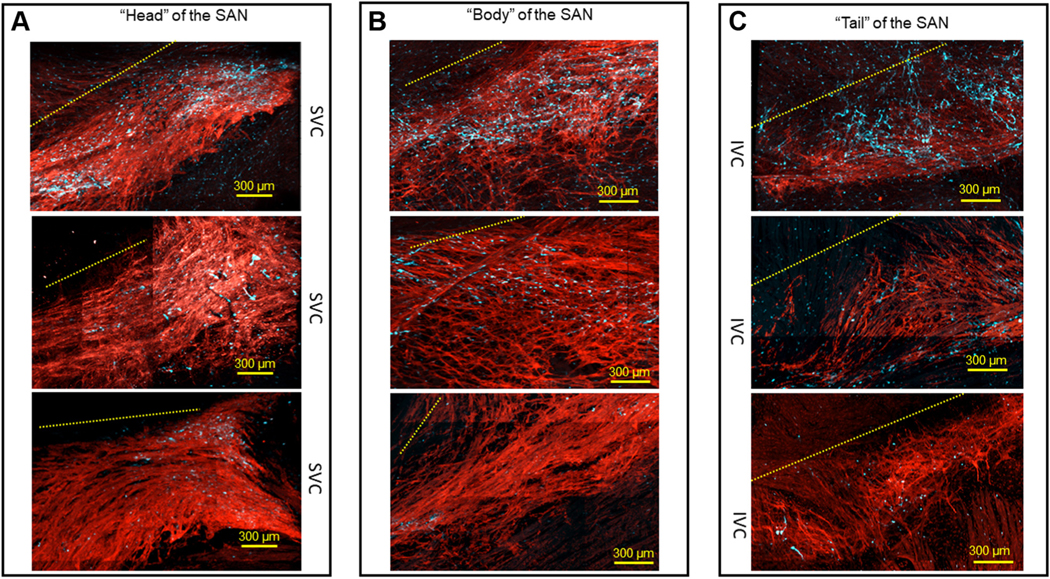
(A) Area near the root of the SVC, known as a “head,” of the HCN4+ meshwork of pacemaker cells (red), from 3 different SAN preparations. (B) S100B cell populations in the “body” of the SAN between the SVC and the IVC. (C) Area close to the IVC known as the “tail” of the SAN. In all 3 panels, the upper images illustrate examples of SANs in which >110 S100B+ cells were identified, the middle images illustrate meshworks exhibiting ~60 S100B+ cells, and the lower images show SANs with <25 S100B+ cells. Broken yellow lines indicate the relative position of the CT in each frame. Abbreviations as in Figures 1 and 4.
At higher optical zoom, it can be seen that S100B+/GFAP− cells were situated between, and in close proximity to, HCN4+ pacemaker cells. By definition, this classifies them as interstitial cells of the SAN. The geometry of their somata and cellular extensions, as well as the lack of expression of GFAP, undoubtedly separated S100B+/GFAP− interstitial cells from the web of S100B+/GFAP+ PGCs. The irregular pattern of S100B+/GFAP− processes of interstitial cells was distinct from the repetitive web of GFAP+/S100B+ glial cell branches, even within areas of the SAN in which both cell types intertwined (Figures 7A to 7D). The S100B+ somata of PGCs were within bundles of adrenergic (Figure 7E) or cholinergic (Figure 7F) varicosities, whereas S100B+/GFAP− interstitial cells were exclusively found outside of nerve bundles or varicosities.
FIGURE 7. 2-Dimensional Images of S100B+/GFAP− Interstitial Cells and PGCs Embedded Within the HCN4+ Meshwork.
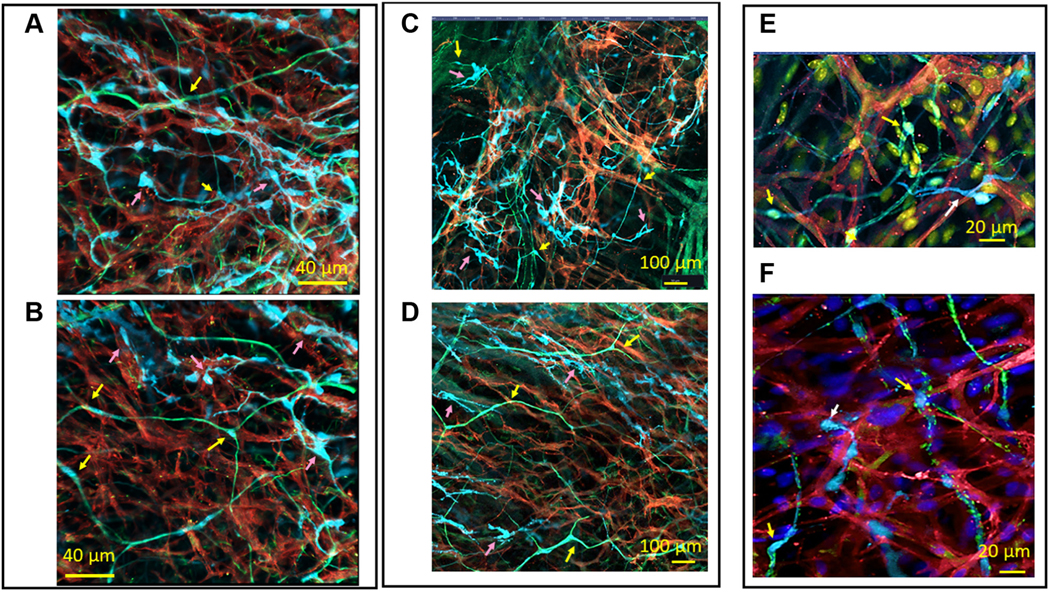
Pink arrows indicate S100B+/GFAP− interstitial cells, and yellow arrows indicate S100B+/GFAP+ PGCs. (A to D) S100B+/GFAP− interstitial cells (cyan) between, and in close proximity to, HCN4+ pacemaker cells (red). Higher levels of GFAP (green) than S100B were detected in the extensions of PGCs. (E) A 2-dimensional image of the radiating branches of adrenergic TH+ (green) fibers as well as S100B+ interstitial cells (cyan), among HCN4-immunoreactive pacemaker cells (red). (F) A 2-dimensional image of the radiating branches of cholinergic VAChT+ (green) fibers and S100B+ interstitial cells (cyan), among HCN4-immunoreactive pacemaker cells (red). Abbreviations as in Figures 2 and 4.
ANATOMICAL INTERACTION BETWEEN HCN4+ PACEMAKER CELLS AND S100B+/GFAP− INTERSTITIAL CELLS.
S100B+/GFAP− SAN interstitial cells and HCN4+ pacemaker cells interact anatomically in groups and clusters. We characterized instances of anatomical interaction between S100B+ cells and HCN4+ cells by the shape of cellular branches and geometry of the endings of cellular extensions. S100B+ cells exhibited both tapering and dilating extensions, which changed diameter right after exiting the soma (Figure 8). These extensions could broaden and narrow along their length. We defined these long tapering cellular extensions that flattened along the surface of a target cell as “spiculum”type. These were not observed within the web of S100B+/GFAP+ PGCs, in which cellular extensions had a constant diameter and did not exhibit sinuses or cytoplasmic dilations along their branches. The S100B+ interstitial cells shown in Figure 8A extended spicula of 78 μm alongside HCN4+ pacemaker cells so close that extracellular space between 2 cells could not be detected with the optical resolution of the confocal microscopy we used. Spicula from the cluster of S100B+ cells shown in Figure 8A targeted and adhered to the same group of HCN4+ cells. Spicula could bifurcate into multiple distinct tapering processes and wind around a target HCN4+ immunoreactive cell. Anatomical connections between S100B+ interstitial cells and HCN4+ cells by spicula were defined as fibrous “cotton”-type interactions.
FIGURE 8. Fibrous “Cotton” Type of Anatomical Interaction Between S100B+ Interstitial Cells and HCN4+ Pacemaker Cells.
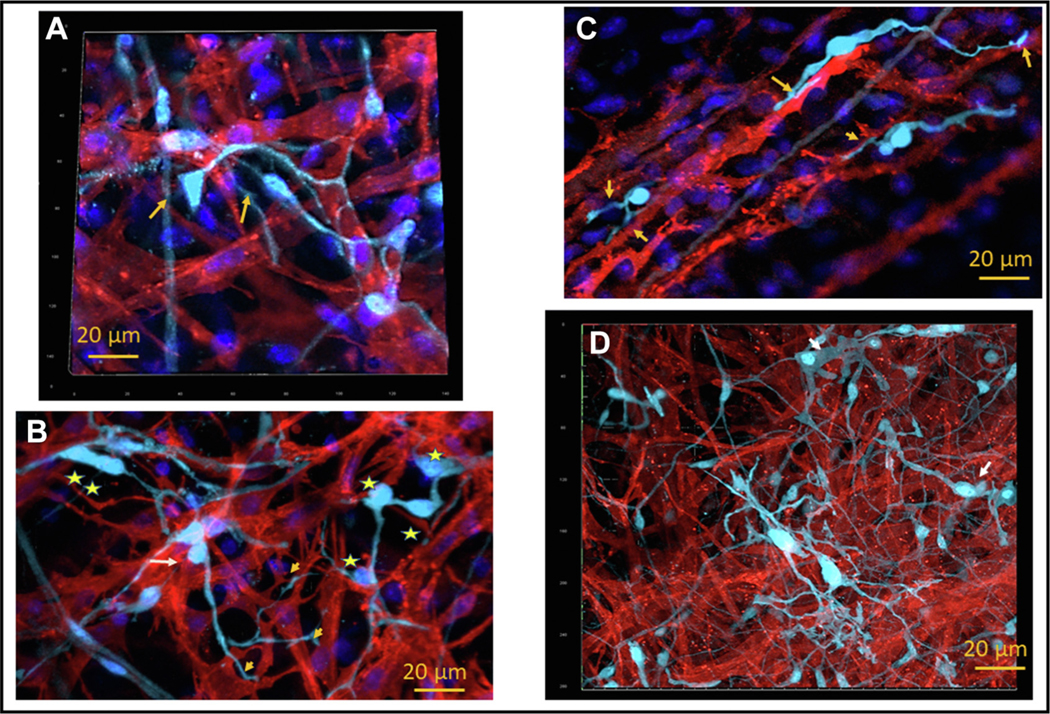
(A) Three-dimensional image (15 μm deep) illustrates 2 unipolar S100B+ cells (cyan) projecting tapered spicula that bifurcated on the HCN4-immunoreactive cells (red). These spicula adhered so close to the HCN4+ cell that extracellular space could not be detected by optical confocal microscopy. 4’,6-Diamidino-2-phenylindole staining highlights nuclei (blue). The soma of the unipolar S100B+ cell and the bifurcations of their spicula are indicated by yellow arrows. (B) Two-dimensional image that illustrates unipolar S100B+ cell, indicated by yellow arrow, connected to several HCN4+ pacemaker cells by one bifurcating spiculum. Groups of cells (yellow star) or clusters of S100B+ somata (2 yellow stars) attached to HCN4+ cells and were interconnected by short extensions in a “nodal”-like net cytoarchitecture. S100B+ cells from this “nodal”-like net extended long spicula to adjacent HCN4+ cells. (C) Two-dimensional image that illustrates the spiculum of an S100B+ cell (cyan) that dilated in an “endfoot”-like structure, indicated by an arrow, adhering to HCN4+ pacemaker cells (red). The 2 pacemaker cells interconnected by one bipolar S100B+ interstitial cell also have a point of direct contact. (D) Three-dimensional image, 20 μm thick, that illustrates composite fibrous “cotton” connections that include the spicula, “endfeet,” and “nodal”-like net of S100B+ (cyan) cells within the meshwork of HCN4+ cells (red). Abbreviations as in Figures 2 and 4.
In any given area, some HCN4+ pacemaker cells were connected to multiple S100B+ interstitial cells at once, whereas other HCN4+ cells lacked connections with S100B+ cells altogether (n = 7). Alternatively, one S100B+ cell could project spicula to several HCN4+ pacemaker cells at once. Examples of such S100B+ cells are shown in Figure 8B.
S100B+ spicula might terminate into an “endfoot”-like structure that adhered to HCN4+ pacemaker cells (Figure 8C). It is worth noting that the 2 pacemaker cells interconnected through one S100B+ interstitial cell in the image also had a point of direct contact to each other. The size of the S100B+ endfeet varied from 3.4 ± 1.8 μm to 14.9 ± 1.3 μm and could differ between “spot” or “stretched” endfeet. Both types of endfeet were equally scattered within the HCN4+ meshwork.
Groups of S100B+ somata could be closely interconnected by short processes or wide cytoplasmic dilations (stars in Figures 8B and 8D) rather than the thin projections described earlier, creating what we define as “nodal”-type cytoarchitecture. Cells within these S100B+ “nodal” groups could connect to adjacent pacemaker cells either through long extensions (yellow arrows in Figure 8B) or by having their somata directly adjacent to HCN4+ cells (white arrow in Figure 8B). Often, S100B+ interstitial cells created composite webs of “nodes,” interconnected by the aforementioned “spiculum”-type extensions (Figure 8D).
Another possible anatomical interaction between S100B-imunoreactive interstitial cells and HCN4+ pacemaker cells was defined as “amoeboid-flattened” type. These interstitial cells resembled amoeba (Figure 9). We defined flattened S100B+ extensions from this type of interstitial cell as a “pseudopodia,” also by morphologic analogy with the morphology of the amoeba. Somata of amoeboid S100B+ cells manifested round or elongated oval shapes. Typically, S100B+ pseudopodia were 1 to 3 μm wide and could manifest dilations with diameter reaching 5 μm, often as wide as the somata from which they originated (Figures 9A and 9B). Pseudopodal extensions could change their initial direction of branching and create angles, as well as bifurcate.
FIGURE 9. Anatomical Interaction Between Amoeboid-Like S100B+ Interstitial Cells and HCN4+ Pacemaker Cells.
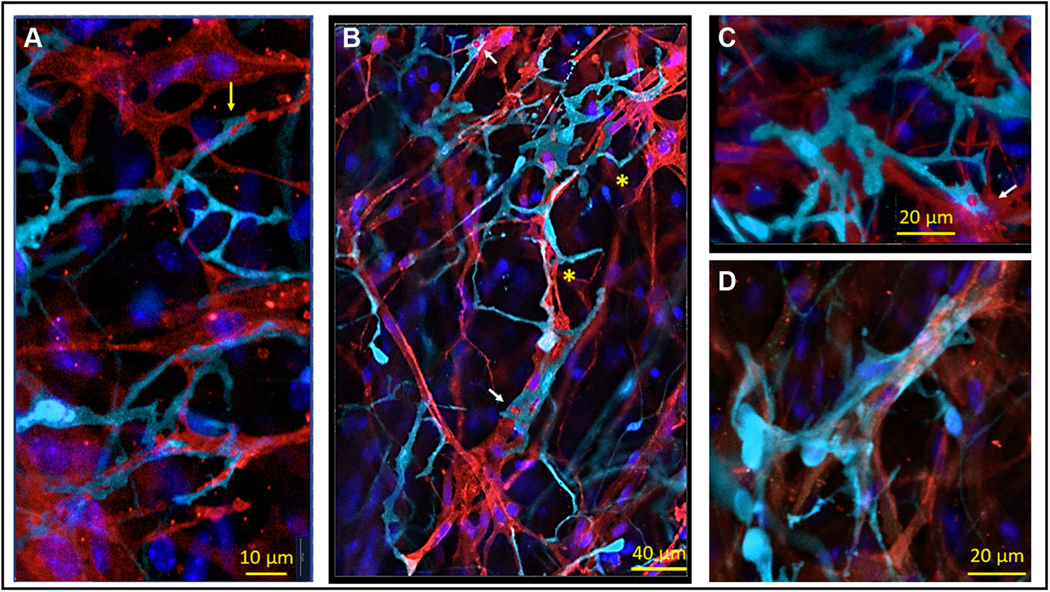
(A to C) Amoeboid S100B+ interstitial cells (cyan) with flattened cellular extensions. Flattened S100B+ extensions, or pseudopodia, were 1 to 2 μm wide and manifested dilations. S100B+ pseudopodia could fold, changing the initial direction of their projection, or bifurcate and produce branches as indicated by yellow asterisks. The “plier”-like terminal dilation of an S100B+ pseudopodium, enclosing an appendage from an HCN4+ pacemaker cell (red), is indicated on A by a yellow arrow. The “patch”-like dilation of an S100B+ pseudopodium that encircled a “patch” of the membrane of an HCN4+ cell is indicated by a white arrow. (D) S100B+ immunoreactive cells enwrapping a group of HCN4+ pacemaker cells with a wide “ribbon”-like pseudopodium. Abbreviations as in Figures 2 and 4.
S100B+ pseudopodal dilations could either adhere to the surface of HCN4+ pacemaker cells or enwrap an appendage extended from a pacemaker cell(Figures 9B to 9D). Terminal cytoplasmic dilations of S100B+ immunoreactive pseudopodia manifested unique geometry. Some S100B+ pseudopodial terminal dilations had a shape similar to “pliers” that enclosed an appendage from an HCN4+ pacemaker cell (Figure 9A, yellow arrow). A second type of contact point was “patch”-like dilation of S100B+ pseudopodium, which adheredtothemembraneoftheHCN4+cell(Figures 9B and 9C, white arrow). The distance between S100B+ pseudopodia and HCN4+ pacemaker cells in the contact points was so close that we could not detect a space between them at the resolution of our confocal microscopy. Finally, S100B+ cells could enwrap one or several HCN4+ pacemaker cells with a wide “ribbon”like pseudopodium (Figure 9D). S100B+ cells with spicula, as well as those with amoeboid extensions, both manifested unipolar or multipolar branches.
ANATOMICAL INTERACTIONS BETWEEN HCN4+ PACEMAKER CELLS, S100B+ INTERSTITIAL CELLS, AND THE NEURONAL PLEXUS.
In addition to anatomical contact between S100B+/GFAP− immune-reactive interstitial cells and HCN4+ pacemaker cells or PGCs, we found both cholinergic and adrenergic neurites near S100B+ cells (Figure 10). We did not find any specific pattern of innervation among S100B+ cells, which could be related to the shape of the S100B+ cell, to the number and type of processes, or to the number of contacts between S100B+ cells and HCN4+ pacemaker cells (n = 4).
FIGURE 10. 2-Dimensional Images of a Whole-Mount Preparation of SAN Tissue With Triple Immunolabeling for S100B, HCN4, and TH or VAChT.
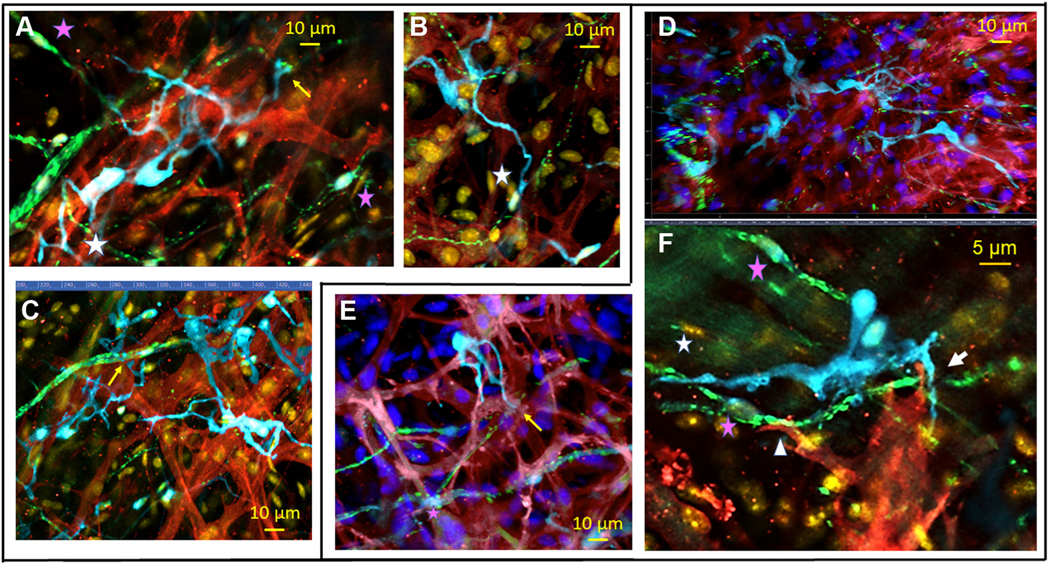
(A to C) Two-dimensional images of SAN tissue with triple immunolabeling for S100B+ cells (cyan), HCN4-immunoreactive pacemaker cells (red), and TH+ adrenergic fibers (green) illustrate anatomical interactions between pacemaker cells, adrenergic nerves, and interstitial cells. (D to F) Two-dimensional images of SAN tissue with triple immunolabeling for S100B+ cells (cyan), HCN4 immunoreactive pacemaker cells (red), and VAChT+ cholinergic fibers (green) illustrate anatomical relations between pacemaker cells, adrenergic nerves, and interstitial cells. Pink stars in any panel indicate the nuclei of peripheral glial cells. S100B+ spicula extended from “octopus”-like cells in A, C, and E ended on TH+ varicosities (A and C) or on VAChT+ varicosities (E). Yellow arrows indicate the S100B+ “endfeet.” An adrenergic neurite on A, indicated by a white star, overlaps with the spiculum of an “octopus”-like S100Bþ cell. An amoeboid-like S100B+ cell in the upper right corner of C receives adrenergic innervation. Images on C (adrenergic nerves) and D (cholinergic nerves) illustrate uneven innervation of S100B+ cells. (F) Composite point of contact between 3 cells: one S100B-immunoreactive cell, an HCN4-immunoreactive cell, and fibers from the neuronal plexus. A white arrow indicates the region where cellular extensions from an intertwined couple of S100B+ cells, an HCN4+ pacemaker cell, and a cholinergic neurite co-localize within 1 μm of each other. A white star indicates the point of contact between an S100B+ cell and a cholinergic nerve, whereas a white triangle marks the point of contact between a cholinergic nerve and an HCN4+ pacemaker cell. Abbreviations as in Figures 1, 3, and 4.
Unipolar or multipolar S100B+ cells extended dendritic-like processes toward neurites, which ended on or near the neuronal fiber (indicated by yellow arrows in Figures 10A, 10C, and 10E). For example, a spiculum extended from an “octopus”like S100B+ cell in the center of the 2D-image (Figure 10A) ended on TH+ varicosities. In the same image, an adrenergic neurite extended from the neuronal plexus overlapped with the spiculum of a second “octopus”-like S100B+ cell (Figure 10A, white star). In Figure 10B, a spiculum from a S100B+ cell elongated toward a large adrenergic fiber, ending with an “endfoot” dilation on the neuronal fiber (white star). The S100B+ endings could make contacts in the shape of “endfeet” with pacemaker cells (Figures 10C and 10E). Adrenergic and cholinergic varicosities of the neuronal plexus could also stretch alongside S100B+ processes (Figures 10B and 10D). Neurites were often found in proximity (1–5 μm) to S100B+ cells. Although 2 or more neurites may approach a single S100B+ cell, autonomic innervation did not make contact with all S100B cells in any given area, with the majority of S100B cells imaged receiving no discernable nervous input (Figures 10C and 10D). Adrenergic and cholinergic neurites could enwrap the soma and/or spiculum of a S100B+ cell. Cholinergic varicosities in Figure 10D were densely present around the soma and spiculum of one S100B+ cell, which was in a cluster of 7 interstitial cells. Amoeboid-like S100B+ cells were also found to be innervated (Figure 10C). Finally, nerves, HCN4+ pacemaker cells, and S100B+ cells were found to make composite points of contact among each other, allowing for the possibility for communication pathways in such cellular arrangements. Extensions from multiple intertwined S100B+ cells, an HCN4+ pacemaker cell, and a cholinergic neurite co-localized within 1 μm of distance interacted anatomically, manifesting an apparent anatomical unit between the 3 cell types in Figure 10F. In the image, a cytoplasmic extension from an HCN4+ cell, resembling a dendritic spine, made contact with an S100B+ amoeboid pseudopodium (white arrow in Figure 10F), both innervated by a cholinergic nerve. The white star in Figure 10F indicates a second point of contact between the same S100B+ cells and cholinergic neurite. Finally, in the same image, the extension from a HCN4+ cell was co-localized with a nerve ending near the nucleus of a PGC (indicated by a white triangle in Figure 10F).
ULTRASTRUCTURE OF INTERSTITIAL CELL POPULATIONS OF THE SAN VIEWEDTHROUGH TEM: MICROENVIRONMENT AND INTERCELLULAR RELATIONSHIPS.
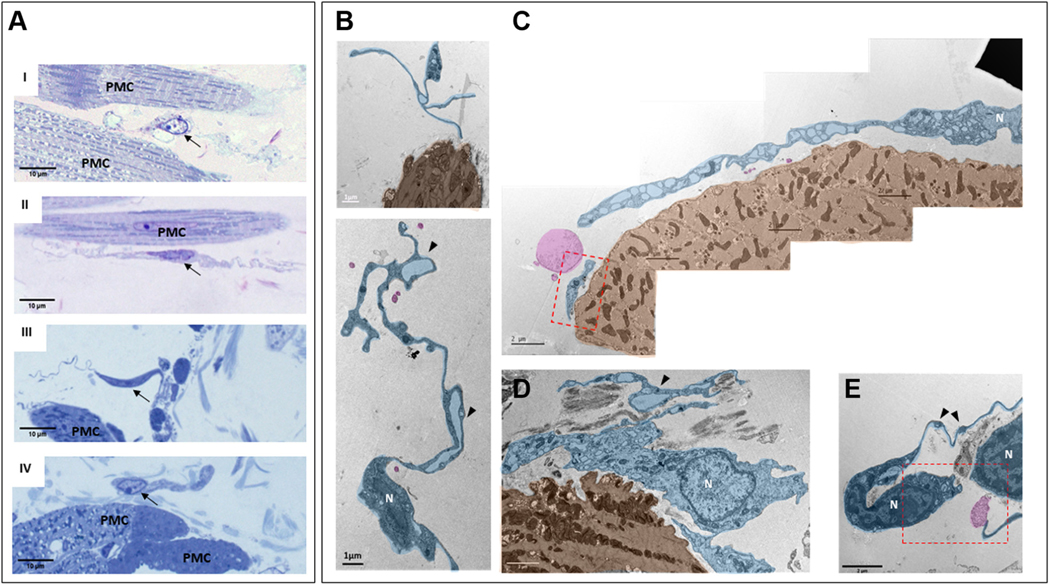
We identified interstitial cells within SAN semi-thin sections in TEM by their heterogenic cellular morphology and location with respect to pacemaker cells, as observed in our immunohistochemical studies. These cells were located in the interstitium between pacemaker cells; they had small, elongated soma, and extremely long and thin cytoplasmic extensions that distinguished them from other SAN cells. These features are those of cells classified as telocytes (Figure 11A), in accordance with the descriptions by Cretoiu and Popescu27 and Mitrofanova et al.28 Variable cellular extensions with cytoplasmic dilations, defined as telopodes (ie, extensions), resembling “strings,” with “beads” of cytoplasmic dilations are all ultrastructural hallmarks of telocytes. Cytoplasmic dilations within thin fibrillar cellular extensions have been classified as podomers, with the bead-like dilated cytoplasmic endings being classified as podoms (black arrowheads in Figure 11B indicate podomers). Podoms accommodate organelles such as caveolae, mitochondria, electron-dense granules, and endoplasmic reticulum that may be involved in maintaining Ca2+ homeostasis. Cells with this telocyte morphology were readily identifiable in TEM images to lie within the interstitial space of the SAN.
FIGURE 11. Interstitial Cells Within Mouse SAN Imaged by TEM.
Telocytes were identified by high-resolution transmission electron microscopy (TEM) and were found near pacemaker cells (PMC). (A) Semi-thin sections of sinoatrial nodal (SAN) stained with toluidine blue illustrate the heterogeneous shapes of interstitial cells. Black arrows indicate the nuclei of the interstitial cells. AI and AII present bipolar cells, and piriform/fusiform unipolar cells are shown in AIII and AIV. An interstitial cell with branching cellular extensions is shown in AI. The long and thin cytoplasmic extensions of interstitial cells (telopodes) are shown in AII and AIII. A flattened interstitial cell is illustrated in AIV. (B) Digitally colored TEM images that illustrate the ultrastructure of different types of telocytes (blue) located near PMC (brown), as well as exosomes shed from telocytes (pink). The “bead”-like regions of telopodes, defined as podoms, are indicated by black arrowheads. Scarce organelles (mitochondria, endoplasmic reticulum, caveolae, and larger membranous vesicles) can be visualized in the soma and in the podoms of telocytes. Telocyte nuclei in the TEM images are indicated by the letter N. The regions of interest highlighted by red dot boxes are shown in (C) and (E) at higher zoom.
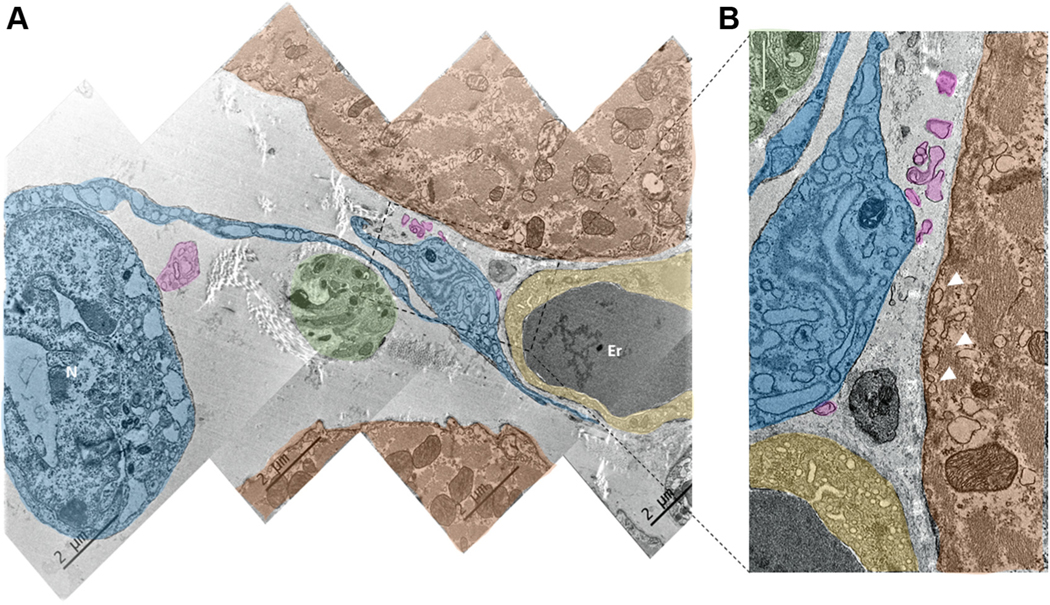
Panoramic images of the anatomical interface between the telopodes and the membrane of pacemaker cells was obtained by tiling TEM images (Figures 11B and 12A). The distance between the membrane of telopodes and the cytoplasmic membrane of target pacemaker cells varied from 0.1 μm to 1 μm, and, in some instances, the somata of telocytes came within 0.1 μm to 0.2 μm of the membrane of pacemaker cells (Figure 12B, lower central image).
FIGURE 12. Ultrastructure of Telocytes Co-Localized With Neuronal Fibers and the Endocardial Cells of Blood Capillaries.
(A) Digitally colored image of SAN tiled from 4 TEM images. (B) Zoomed-in picture of the area outlined by the rectangle in A. A and B illustrate close anatomical interactions between telocytes (blue), PMC (red), nerves from the neuronal plexus (green), and endocardial cells (yellow). Erythrocytes in the TEM images are indicated by the letters Er. It is worth noting that the telopodes and podomers from the telocyte are projected to the capillary, to the PMC, and to the neuronal fiber. They approach the membrane of the pacemaker and endocardial cell as close as several hundreds of nanometers, without making direct contact with the membrane of these cells. Pink color highlights the exosomal vesicles shed from the telocyte. Abbreviations as in Figure 11.
Figure 12A, a tiled composite of 4 TEM images, displays an example of multicellular anatomic interactions, in which the endocardial cells of capillaries, nerve bundles from the neuronal plexus, telocytes, and pacemaker cells were co-localized within an area of 10 μm by 15 μm. A telopode extending from the soma of a nearby telocyte with a readily identifiable nucleus approached the neuronal fibers, ultimately dilating to become a podom that reached a pacemaker and an endocardial cell of a capillary. The distances in the telocyte–axonal, telocyte–endocardial, and telocyte–pacemaker cell anatomical interactions were ~200 nm. The zoomed-in TEM image in Figure 12B shows exosomes colored in pink apparently shed by telocytes toward both endocardial and pacemaker cells.
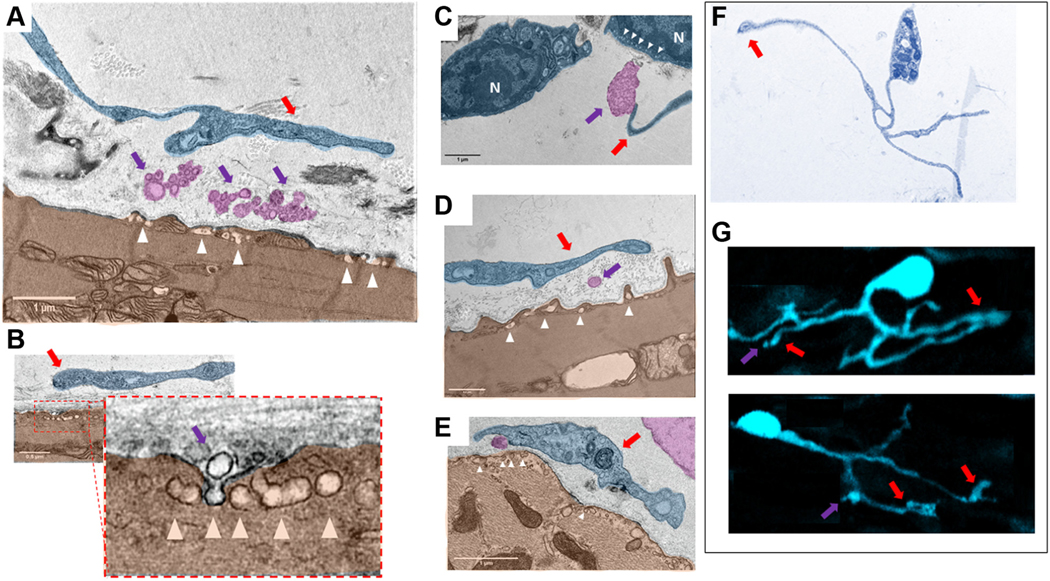
Figure 13 depicts vesicles and multivesicular bodies found within the extracellular space between telocytes and pacemaker cells. Ectosomes, exosomes, and multivesicular bodies (identified as a single or group of vesicles surrounded by membrane) (pink in Figures 12 and 13) were detected in pockets of extracellular space delineated by the membrane of pacemaker cells and the membrane of podoms and telopodes. We detected caveolae (white triangles in Figure 13) on the plasma membranes pacemaker cells facing toward vesicles apparently detached from podoms and telopodes of telocytes.
FIGURE 13. Digitally Colored TEM Images of “Cotton”-Type Interactions Between Telocytes and Pacemaker Cells in the Sinoatrial Node.
(A to E) Close contacts between telopodes (blue) indicated by red arrows and PMC (brown). Violet arrows point to the exosomes and multivesicular bodies (pink) within the intercellular space enclosed by telopodes and PMC. There is an extracellular space of about ~200 nm between the membrane of the soma of the telocytes and of the telopodes and the plasma membrane of the PMC. Physical contact between the membranes of PMC and telocytes was never detected. Ectosomes, exosomes, and multivesicular bodies have been found in close contact to the plasma membrane of the PMC. High numbers of caveolae (white arrowheads), invaginations of the plasma membrane of the PMC, were found in the area in which exosomes and multivesicular bodies approached the plasma membrane of the PMC. B shows a virtually zoomed-in image of caveolae in the membrane of a pacemaker cell (brown). The nuclei of telocytes in the TEM images are indicated by the letter N. (F) Type of telocytes found in thin slices by TEM that has a cellular phenotype identical to that of the S100B+ telocytes in G found in immunolabeled whole-mount preparations. It is worth noting that this type of telocytes detected by TEM and immunohistochemistry have identical structures of telomeres, telopodes, and podoms. Vesicular-like structures detected by immunohistochemistry are indicated by violet arrows. Red arrows indicate to the regions in which vesicular release occurs. Abbreviations as in Figures 4 and 11.
Telocytes visualized with TEM (Figure 13F) and S100B+ interstitial cells found in whole-mount preparations (Figure 13G) had a strikingly similar cellular phenotype: telopodes resembled the thin, long cellular extensions of GFAP−/S100B+ cells, and the podoms visualized in TEM resemble the dilated end-feet visualized by immunohistochemistry.
TELOCYTE–PACEMAKER CELL INTERACTIONS: EFFECT OF S100B ON THE ANATOMY OF EMERGENT CA2+ SIGNALS WITHIN THE SAN HCN4+ PACEMAKER CELL MESHWORK.
In the CNS, S100B is secreted from glial cells to alter the firing patterns of neurons.29,30 The intertwining and co-localization of S100B+/GFAP− interstitial cells and pacemaker cells and the congruent cellular phenotypes of S100B+ cells and telocytes seen in electron microscopy (Figures 13F and 13G), as well as apparent vesicular secretion from telocytes toward pacemaker cells seen in the EM images, suggest that S100B may influence the spatial-temporal anatomy of impulses that emerge within the SAN HCN4+ meshwork. To this end, we assessed the Ca2+ dynamics of the SAN before and during S100B superfusion.
We imaged Ca2+ dynamics across the entire HCN4+ meshwork, using low-zoom microscopy on SAN tissue preparations extracted from HCN4-GCaMP8 transgenic mice, which express a genetically encoded Ca2+ indicator exclusively within HCN4+ pacemaker cells (Videos 1 and 2).
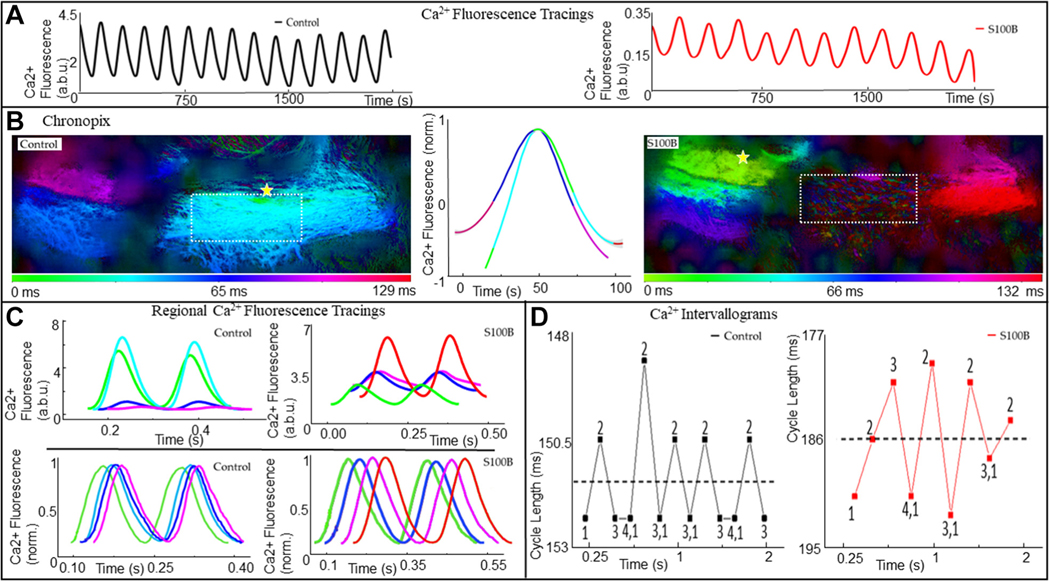
Figure 14A illustrates continuous 1.5-second traces of low-zoom Ca2+ fluorescence measured from an entire SAN in control (black plot) and during application of 200 nM S100B (red plot). Whole-SAN Ca2+ oscillations each averaged ~180 milliseconds during control and ~230 milliseconds in the presence of S100B, during the 1.5-second recordings (n = 3). Figure 14B portrays “Chronopix” analysis,11 which color-codes the SAN into spatio-temporally distinguishable regions of Ca2+ signal distribution based on the average time of appearance of Ca2+ events relative to each other during the 1.5-second recording. The major effects of S100B were to shift the site of earliest local Ca2+ event occurrence inferiorly toward the IVC (yellow stars in Figure 14B), and to impede the appearance of synchronized Ca2+ signals in the region of the HCN4+ meshwork which showed earliest signal appearance in control (Figure 14B, region of interests highlighted by the square), such that only LCRs are visible in that area. The middle plots in Figure 14B show the averaged Ca2+ fluorescence oscillations normalized to their peaks in control and during S100B application, color-coded according to the Chronopix map in control. It is worth nothing both the difference in shape of the 2 Ca2+ oscillations as well as the reversal in the order of activation of the SAN regions during the averaged oscillations.
FIGURE 14. APCT Recording Analysis From a Representative Recording of Ca2+ Transients.
(A) Fluorescence recordings of low-zoom whole-SAN Ca2+ signals recorded in the SANs of mice expressing the genetically encoded Ca2+ indicator GCaMP-8, under control conditions, and 20 minutes after the addition of 200 nM S100B. (B) Chronopix spatio-temporal maps of the video recordings. In the presence of S100B, the spatial-temporal distribution of the local Ca2+ signals differed compared with control, and the region highlighted by a yellow rectangle stopped generating synchronized Ca2+ signals detectable by low zoom, and only generated local Ca2+ releases (Video 2). The yellow star indicates the region of SAN with earliest action potential induced calcium transients. (C) Top: Raw Ca2+ tracings recorded locally from areas of the SAN identifiable in the Chronopix, colored accordingly. Bottom: The same tracings, normalized to maximum and minimum. (D) Variability in cycle lengths of the whole-SAN low-zoom Ca2+ signal shown in A, with the mean cycle length shown by the dotted line. The mean cycle length increased from 151.3 milliseconds to 185.6 milliseconds after the addition of S100B, with the range of intervals increasing from 4 to 12.8 milliseconds. a.b.u = arbitrary units; other abbreviations as in Figures 1 and 4.
In Figure 14C, the colors of the superimposed traces of Ca2+ fluorescence measured in each of the different SAN regions shown for 2 of the consecutive oscillations in Figure 14A are coded according to the color time scale of the Chronopix map. The raw Ca2+ signals recorded in the SAN regions delineated by the Chronopix exhibited different rates of rise, amplitudes, and rates of decay (top of Figure 14C). In the presence of S100B, the differences in the raw Ca2+ waveform properties of different SAN regions were attenuated, and their rates of rise and decay slowed significantly (Supplemental Tables 1 to 4). The lower panels of Figure 14C illustrate the same traces as in the top panel of Figure 14C, normalized to maximum and minimum to emphasize the phase shifts in the emergence of Ca2+ signals within spatially distinct regions. It is worth noting that the emergence of the Ca2+ signal in any given color-coded area begins before the full decay of the Ca2+ in the areas adjacent to it. In other words, Ca2+ signal emergence within SAN regions is staggered such that at any moment in time, an area is exhibiting rising signal and another is decaying, a pattern further accentuated after S100B superfusion. In control conditions, the time (green, left) and those detected at the root of the IVC (purple, left), measured by the phase shift at the point of halfwidth between the local Ca2+ events, averaged 67.2 ± 10.4 milliseconds (n = 4). This was prolonged by ~50% in the presence of S100B, with the signal appearing first near the root of the IVC (green, right) and lastly near the root of the SVC (red, right).
Figure 14D plots the variable peak-to-peak intervals between the whole-SAN Ca2+ oscillations shown in Figure 14A. The dotted line indicates the post hoc calculated mean cycle length for the time series of Ca2+ oscillations, which slowed from 405 ± 19 beats/min in control to 307 ± 30 beats/min in the presence of S100B after 31.7 ± 5.4 minutes. Numbers 1 to 4 of Figure 14D on the plot indicate the regular pattern of long-short-long intervals between oscillations, which resonate above and below the post hoc calculated mean interval in control conditions, becoming markedly distorted in the presence of S100B. In addition to peak-to-peak interval variability, beat-to-beat variability patterns in the time to peak, maximum rate of rise, and maximum rate of decay of the whole-SAN Ca2+ signal were also distorted in the presence of S100B (Supplemental Figure 2).
EFFECT OF S100B ON THE RATE AND RHYTHM OF APs RECORDED IN THE RIGHT ATRIUM.
Because of photobleaching and dye internalization, accurate beat-to-beat variability cannot be assessed by the 2-to 10-second recordings that can be produced with calcium fluorophores. The beat-to-beat interval variability of SAN impulses dictates the beat-to-beat variability of APs in the atria; to more accurately assess the effect of S100B on cycle length variability, we used a sharp microelectrode to obtain long membrane potential recordings from right atrial cells.
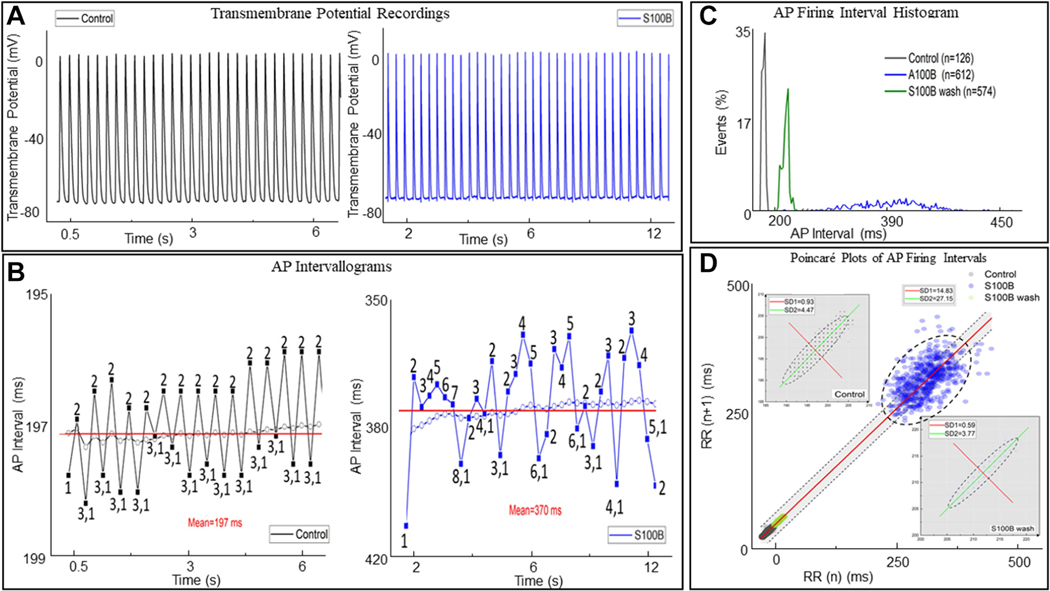
A recurring pattern of AP cycle-to-cycle variability (numbered 1–3 in Figure 15B) was observed in the AP recording. The range of inter-AP cycle lengths within this pattern of variability was ~2 milliseconds. The mean (post hoc calculated) AP interval within the time series is indicated by the dotted line. The real-time running average of the inter-AP interval is indicated by colored dots. It is worth noting how the pattern of long and short inter-oscillation intervals recorded in real time (numbers 1–3) resonate about the post hoc calculated mean of the time series, similar to the variability pattern observed in the low-zoom whole-SAN Ca2+ oscillations described in Figure 14D.
FIGURE 15. Intracellular Microelectrode Recording From a Representative Right Atrial Cell.
(A) Excerpt of the intracellular recording in control conditions (black) and in the presence of 200 nM S100 calcium-binding protein B–positive (S100B) (blue). (B) Variability in inter-action potential (AP) cycle lengths and the mean inter-AP cycle length for all APs occurring in the time series in control and in the presence of S100B. In both, the dotted line indicates the mean interval, and a running average for the time series is shown. (C) A histogram of the distribution of AP firing interval under control conditions, in the presence of 200 nM S100B, and after 40 minutes of washout. (D) Poincaré analysis of the time series, with the insets displaying a magnified version of the Poincaré plots for control and washout conditions. The best fit line of all the points is given by the equation y = 1.0x + 1.63, R2 = 1.0, indicating the self-similarity among the points in the time series, although their absolute magnitudes differ.
After the addition of 200 nM S100B, the pattern of beat-to-beat variability among inter-AP intervals was irregularly distributed around the post hoc calculated mean cycle length compared with control (Figure 15D). The deviation of the running mean interval from the post hoc calculated mean interval was multiple milliseconds after the addition of S100B, compared vs within a 1 millisecond range in control conditions. The histograms of mean AP firing interval distributions presented in Figure 15E show that maximum mean AP firing interval is increasing after S100B application (blue color), while the proportion of cycles exhibiting that maximum decreased by an order of 10 times compared with the control (black color), and both effects were partially reversed after 30 minutes of S100B washout (green color).
We constructed Poincaré plots of the AP time series for a more in-depth analysis of the marked effects of S100B on the AP firing interval variability and mean AP firing rate (Figure 15F). The points within the Poincaré plot can be fit to an ellipse, with the spread of the data measured as the SD1 or SD2, which, respectively, inform on the variability within short-range and long-range correlations among intervals within the AP time series.31 S100B had marked effects on AP interval variability within both short-range inter-AP interval correlations (SD1 was increased 15 times) and longrange correlations (SD2 was increased ~5 times). It is noteworthy that these effects were largely reversed after 30 minutes of S100B washout.
DISCUSSION
We had previously noted that the HCN4+/connexin 43− (CX43−) meshwork is characterized by cells with multiple branches and extensions of variable size and shape, resembling the arborization of brain neurons (Table 1).11 Furthermore, we described the presence of an HCN4−/CX43+ network within the SAN that locally interacted with cells in the HCN4+ meshwork. We also noted that multiscale, local heterogeneous Ca2+ signals within and among these cells underlie the generation of impulses that exit the SAN to initiate each heartbeat. This complex cytoarchitecture of SAN tissue and heterogeneous local Ca2+ signaling patterns within and among SAN pacemaker cells strikingly resemble those of brain neuronal networks.11
TABLE 1.
Summary Table
| Cell Type | Morphology | Distribution | Cytoarchitecture | Anatomical Interactions |
|---|---|---|---|---|
| Pacemaker cells HCN4+/− CX43+/− F-actin+/− |
• Low/undeveloped levels of organization of sarcomeric striation • Variable somatic shapes: elongated, pyramidal, or irregular • Multiple dendritic-like branching extensions |
• SAN, in a meshwork spanning IVC to SVC, crista terminalis to interatrial septum, epicardium to endocardium | • Heterogeneous meshwork of varying interconnectivity | • Neurons • Interstitial cells: ∘ S100B+/GFAP− ∘ Telocytes |
| Autonomic nerves TH+/ChAT+ |
• Neuronal fibers made by several axons of same or different ergicity. Up to tens of axons per fiber. Axons terminate in neuromascular or neuro-interstitial junction | • Soma located in epicardial ganglia, projecting long axons into the SAN • Higher density within the HCN4+ meshwork than surrounding areas of the right atrium • Heterogeneous cholinergic and adrenergic innervation of structures and cell types in the SAN |
• Regular plexus of nerves across the SAN, interacting with multiple cell types and structures | • HCN4+ cells • Interstitial Cells: ∘ S100B+/GFAP− ∘ Telocytes • Peripheral glial cells |
| Peripheral glial cells | ||||
| GFAP+ S100B+ |
• Star-shaped, with small soma and long projections | • Here shown to intertwine with the HCN4+ meshwork, shadowing nerves | • Regular web of inter-connected cells, following nerves | • Neurons |
| Novel S100B+ GFAP− |
• “Amoeboidal” type, with small soma and flattened cytoplasmic projections of varying number or • “Fibrous” type, with small soma and a varying number of thin extensions, which could branch and dilate |
• Throughout the HCN4 meshwork | • Interstitial • Heterogeneously scattered across the SAN, either appearing alone or in nodes, intertwined among HCN4+ pacemaker cells and other SAN cell types |
• HCN4+ cells • Nerves |
| Novel Telocytes (identified via TEM) |
• Small round soma, with multiple long branches • Telopodes, capable of dilatations |
• Throughout the HCN4+ meshwork | • Interstitial | • HCN4+ cells • Nerves • Blood vessels |
ChAT = choline acetyltransferase; CX = connexin 43; GFAP = glial fibrillary acidic protein; HCN4 = hyperpolarization-activated cyclic nucleotide-gated potassium channel 4; IVC = inferior vena cava; S100B = S100 calcium-binding protein B; SAN = sinoatrial node; SVC = superior vena cava; TEM = transmission electron microscopy; TH = tyrosine hydroxylase.
Here, 3D confocal tile imaging with various combinations of triple immunolabeling combined with optical dissection of the mouse SAN from IVC to SVC, endocardium to epicardium, was performed at multiple levels of magnification. Thus, we obtained both panoramic and finely detailed images of local SAN cytoarchitecture that describe the distribution of different cell types throughout SAN tissue, as well as their variable phenotypic details and connectivity patterns. We complemented our confocal microscopy with TEM imaging of ultra-thin SAN tissue sections.
We uncovered novel aspects of the autonomic plexus within the SAN and discovered the existence of 2 novel structures that intertwined with the HCN4+ meshwork: 1) a web of S100B+/GFAP+ PGCs; and 2) a population of S100B+/GFAP- interstitial cells. Combining previous research and the work presented here, the SAN cytoarchitecture may be defined as having at least 5 interacting cell types: HCN4+/CX43− pacemaker cells, HCN4−/CX43+/F-actin+ cells,11 TH+ or VChAT+ autonomic nerves, GFAP+/S100B+ PGCs, and S100B+/GFAP− interstitial cells (Table 1).
INTRACARDIAC GANGLIA AND NEURONAL PLEXUS COMMUNICATION WITH THE SAN CYTOARCHITECTURE.
Nerves extending from intracardiac ganglia (ICG) neurons are known to be essential participants in the communication between the autonomic nervous system and SAN cells, and have been studied extensively.22 However, our novel findings through the use of panoramic 3D optical mapping of the neuronal plexus in the HCN4+ meshwork describe a novel 3D endo-epicardial axis of SAN autonomic innervation.
Although the number of nerve fibers innervating the SAN is high throughout the tissue, the distribution of autonomic neurites displayed substantial heterogeneity, suggesting that HCN4+ cells within different areas of the SAN likely vary in excitatory or inhibitory autonomic input, which would likely provide differential local control of pacemaker cell beating rate. Because sympathetic nerves may innervate the heart bypassing the ICG, areas of dominant adrenergic input imply the possibility of nervous signals reaching the SAN without modulation by the ICG.32 The presence of long-recognized accentuated antagonism33 attributable to vagal stimulation relative to sympathetic stimulation likely results not only from the dominance of cholinergic input in the ICG but also the local variability of autonomic innervation. Because cells of the HCN4+ meshwork are defined by a constitutively active adenylate cyclase that affects intracellular Ca2+ dynamics to favor a faster beating rate, the net inhibitory effect of neuronal input into the SAN counterbalances this intrinsic modus operandi of pacemaker cells.
The heterogeneity in autonomic innervation of the SAN could also be involved in the shifts in the site of earliest impulse initiation within the SAN observed previously in response to application of autonomic neurotransmitters or selective stimulation of vagal or sympathetic fibers. Differential autonomic input also likely has an effect on differences in the microvascular pattern observed among various SAN areas.24
COMMUNICATION BETWEEN THE NOVEL PERIPHERAL GLIAL CELL WEB AND NOVEL S100B+/GFAP− INTERSTITIAL CELL NETWORK WITH THE SAN CYTOARCHITECTURE.
We were in quest of CNS-like neuron–glial cell coupling interactions within the SAN that extend beyond neurites. The S100B+/GFAP+ PGCs that traversed the SAN’s ‘’head,” “body,” and “tail” were arranged in a regular web pattern across the entire HCN4+ meshwork, which had never been visualized previously (Figure 4). Projections from the somata of some PGCs were closely associated with the lumen of blood vessels within SAN tissue, hinting at the existence of a glial–perivascular interface within the heart, similar to that found within the brain. This discovery adds to the previously proposed idea that the organization of the microvasculature of the SAN is related to local myocyte firing properties, which may now be expanded to include a glial component to the determinants of the microvasculature.24
In addition to a web of GFAP+/S100B+ PGCs, we discovered a remarkable, novel population of S100B+/GFAP− cells that was irregularly distributed, some individually and some in groups or clusters localized to the SAN HCN4+ meshwork (Figure 5). The existence of this cell type is consistent with single-cell transcriptional profiling experiments of mouse cardiac nonmyocytes, which had previously suggested the potential existence of a specific astrocyte-like cell subpopulation enriched for S100B with limited GFAP expression.34 S100B+/GFAP− cells were characterized by somata of variable size (~10 μm in diameter) and strikingly diverse cellular morphology, suggesting that this expression phenotype represents multiple cell types (Figures 7 to 9). Multicellular complexes of S100B+/GFAP− cells, HCN4+ pacemaker cells, the other novel GFAP+/S100B+ PGC network described here, and neurites emanating from autonomic neurons create anatomical, and likely functional, units within the SAN.
Using TEM to define the types of connections between pacemaker cells and other cells of the node more precisely, we observed interstitial cells with the distinct morphology of telocytes, resembling in many ways the long projections of S100B+/GFAP− interstitial cells. These strikingly similar anatomical cellular phenotypes and the fact that both telocytes and GFAP−/S100B+ cells display anatomical interactions with pacemaker cells, neuronal fibers, and capillaries strongly support the idea that the telocytes observed in TEM and at least one type of S100B+/GFAP− interstitial cells found in whole-mount preparations are the same type of cells that can potentially secrete S100B protein from the cytoplasm to extracellular space surrounding pacemaker cells. In the absence of immunolabeling of TEMs, however, the certainty that these interstitial telocytes are the very same interstitial cells identified as expressing S100B in our triple immunolabeled 3D confocal images cannot be verified and will require additional studies using immunogold labeling.
EFFECTS OF S100B.
S100B is a member of the large S100 protein family having a multitude of effects. It is typically expressed in glial cells but has also been detected in other cell types, all of which originate from the neural crest (eg, melanocytes,35 adipocytes36). S100B is regarded as a biomarker of structural brain health, including in the context of neurodegenerative diseases.37,38 S100B in the heart originates from intracardiac neural fibers and can be used to assess the health of the intrinsic cardiac autonomic nervous system.39 Plasma S100B levels increase after acute brain injury40 and are released from cardiac glia in response to diverse cardiac interventions.41 S100B is released from cardiac glia in the context of neural damage39 such as catheter-based treatments of atrial fibrillation. S100B is also known to participate in nerve sprouting through RAGE (Receptors for Advanced Glycation Endproducts) receptor signaling (ref). The AP firing frequency of intracardiac neurons is strongly attenuated by exposure to recombinant S100B.39
S100B secreted from glial cells has been implicated in the modulation of rhythmic activity in trigeminal sensory-motor circuit for mastication,29 as well as in enhancement of kainate-induced gamma rhythm-genesis in hippocampal CA1.30 These findings highlight the crucial importance of glial cell–secreted proteins and gliotransmitters in modulating the AP firing rate and rhythm within neural circuits.42 The intertwining of S100B-expressing cells and pacemaker cells within the HCN4+ meshwork, and the presence of vesicles within extracellular space between telocytes and pacemaker cells (Figure 13), suggest that telocytes communicate with HCN4+ pacemaker cells via exosomal secretion.
A ROLE OF S100B IN INTERCELLULAR COMMUNICATION WITHIN THE SAN CYTOARCHITECTURE.
Given the aforementioned findings, as well as the buffering capacity of S100B Ca2+, we hypothesized that crosstalk between S100B+ interstitial cells and HCN4+ pacemaker cells might affect the synchronicity and kinetics of the development and decay of Ca2+ signals that emerge from the HCN4+ meshwork.31 Indeed, application of S100B to the perfusate of SAN preparations had a marked effect on the Ca2+ signaling within and among the cells of the HCN4+ meshwork, which was associated with changes in the spatial-temporal pattern at which Ca2+ signals emerged within the SAN. In fact, in the presence of S100B, the central body of the SAN lacked the sufficient synchronization of local Ca2+ events required to generate signals detectable within low-zoom images, and only LCRs could be detected within the area (Figure 14, Video 2). In conjunction with these effects, S100B distorted the fairly rhythmic resonance among impulses, increasing the variability of global Ca2+ signals across the whole SAN, leading to a slowing of the mean rate of Ca2+ signal generation within the HCN4+ meshwork. These effects of S100B on the rate and rhythm of the HCN4+ meshwork’s Ca2+ oscillations were mirrored in longer intracellular recordings of atrial APs (Figure 15), indicating that the effects of S100B on the rate and rhythm of HCN4+ meshwork Ca2+ signaling shape the characteristics of impulses that exit the SAN to excite the atria. In other terms, the degree of spatial-temporal synchronization of Ca2+ events during heartbeat generation have a major impact on the stability and consistency of the output impulse of the SAN. Ultimately, the rate and rhythm of SAN Ca2+ signals, therefore, shape the RR interval variability within the electrocardiography time series recorded on the body’s surface in vivo.43
Because intracellular Ca2+ levels in pacemaker cells are highly dependent on Ca2+flux in and out of the cell during each beat, we cannot ascertain from our results whether these marked effects of S100B on the synchronicity of whole-SAN global Ca2+ oscillations, their variability, and mean oscillation frequency result from intracellular or extracellular Ca2+ buffering, or a combination of both, or events not directly affected by Ca2+.44 Future experiments are required to determine the mechanism by which S100B affects Ca2+ dynamics in the SAN, whether extracellular or intracellular, or even whether it is exclusively limited to its buffering properties.
CONCEPTUALIZING THE SAN AS THE HEART’S “CENTRAL BRAIN”.
Our discoveries reported here, together with those of our prior study,11 provide the basis for describing the cytoarchitecture and function of SAN tissue as distinctly neuronal-like. The variability and complexity of cellular phenotypes and intracellular calcium signaling kinetics found in the SAN more closely resemble the cytoarchitecture and calcium signals of neuronal tissue: pacemaker cells are connected within the meshwork with branching cellular extensions, similar to the dendritic arborization of neurons; the calcium signaling found in the SAN, with its variable amplitudes, frequencies, and kinetics, is also conceptually similar to the mechanisms controlling AP-mediated signaling observed in neuronal tissue.
The heterogeneous pattern of pacemaker cell interconnectivity combined with the variable scattering of S100B+ interstitial cells (Table 1) may modulate local Ca2+ signal transduction throughout the HCN4+ meshwork. Our experiments support this hypothesis, showing that S100B applied to ex vivo SANs reorganized the initiation and formation of the SAN impulse, suggestive of the type of modulatory interactions observed between astrocytes and neurons.
Thus, we conceptualize pacemaker cells within the HCN4+/CX43− meshwork as “neuromimetic,” sharing phenotypical similarities with neurons within brain neuronal networks. Therefore, to conceptualize the SAN (here depicted as intertwined networks of autonomic neurites, HCN4+ pacemaker cells, PGCs, S100B+ interstitial cells, and telocytes) as the heart’s “central brain,” which is not to be confused with the “little brain of the heart,”2 known as ICG, that receives inputs from the autonomic nervous system and which modulates the rate of AP firing of pacemaker cells via release of transmitters from synaptic terminals within the SAN neuronal plexus. In conceptualizing the SAN as the heart’s “central brain,” we borrow terms used to describe cells and structures within nervous tissue, even though the fine details of these terms have not yet been fully defined for the SAN. Rather, the heart’s “central brain” integrates signals not only from the ICG but also from PGCs and local mechanical factors within the SAN. It then forms a near-term memory of these factors through the same mechanisms observed in isolated pacemaker cells (ie, post-translational modifications), due largely to Ca2+-dependent phosphorylation of coupled-clock proteins that regulate their AP firing rate and rhythm.31,45 This near-term memory, formed over the time frame of several beats, instructs the SAN on when to initiate the heartbeat.31
Heterogeneous co-localization of different cell types within the anatomical units defined earlier enables the exchange of signaling molecules that drive and transform local and global calcium signals. Similar to neuronal networks,46,47 the HCN4+ meshwork both generates and post-processes Ca2+ signals. Thus, we envision cardiac rhythmogenesis to result from brain-like integrative structure and function having near-term memory, rather than from the dominant activity of pacemaker cells with the highest frequency of spontaneous APs.
The “neuromimetic” meshwork of HCN4+ pacemaker cells does not constitute the entire SAN. We previously described a network of HCN4−/CX43+/F-actin+ striated cells, which intertwines with the HCN4+ meshwork.11 These striated cells, therefore, contain elements that relate to muscle contractility, as well as “neuromimetic” spontaneous calcium activity. Points of contact between HCN4+/CX43− cells and striated HCN4−/CX43+/F-actin+ may establish a conversion from the apparently conducted heterogeneous electrochemical signals generated within the HCN4+ meshwork to a more ordered form of electrical conduction within striated cells, as noted previously.11 It is also likely that feedback signaling from HCN4−/CX43+/F-actin+ striated cells to the HCN4+ meshwork affects the consequent self-ordering of its electrochemical signals. In other words, each heartbeat is initiated by heterogeneous, local Ca2+ oscillations within and among numerous types of SAN cells, including striated F-actin+/CX43+ cells, HCN4+/CX43− cells, and likely the glial cell web. The “neuromimetic” calcium signaling within and among the cell types in these cell meshes/nets/webs becomes self-organized, by mechanisms yet to be understood, to produce the net impulse activity that exits the SAN toward cardiomyocytes. The fact that Ca2+ signals are informed and transformed by such a variety of cell types grouped into anatomical units strengthens our vision of the SAN as the heart’s “central brain,” making for a strong hypothetical framework for future research on the SAN.
Supplementary Material
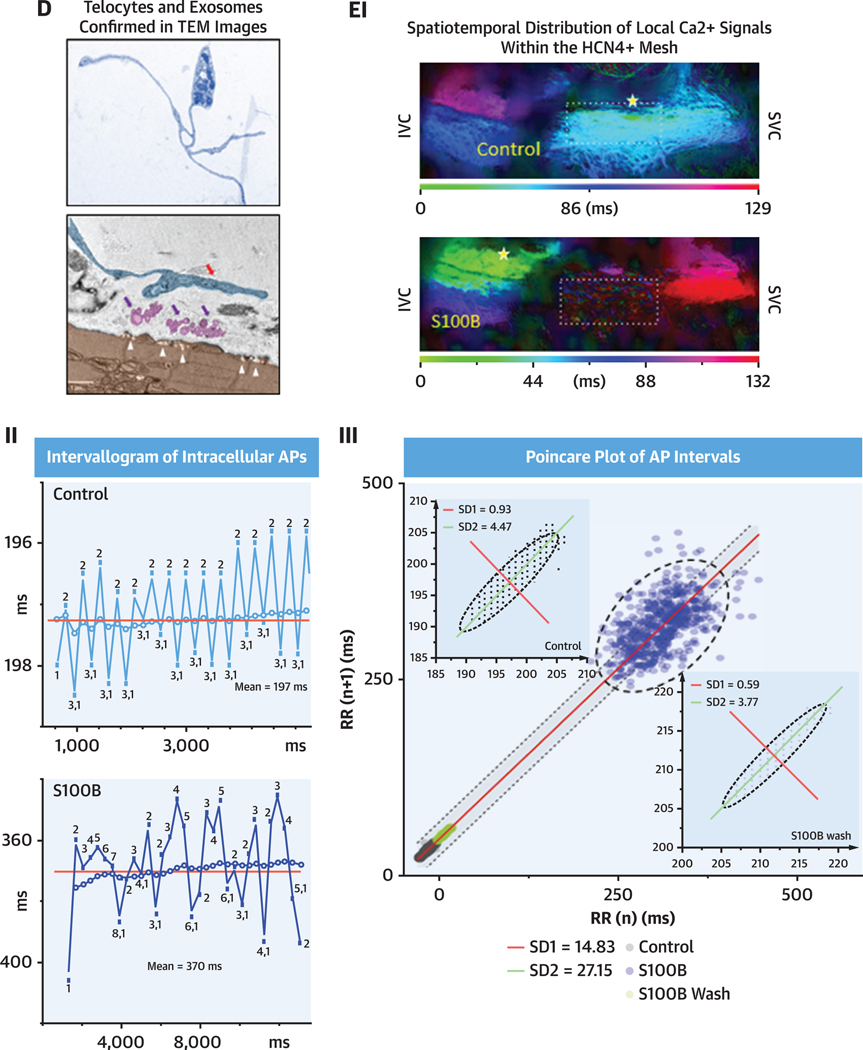
CENTRAL ILLUSTRATION. Brain-Like Cytoarchitecture of the Sinoatrial Node.
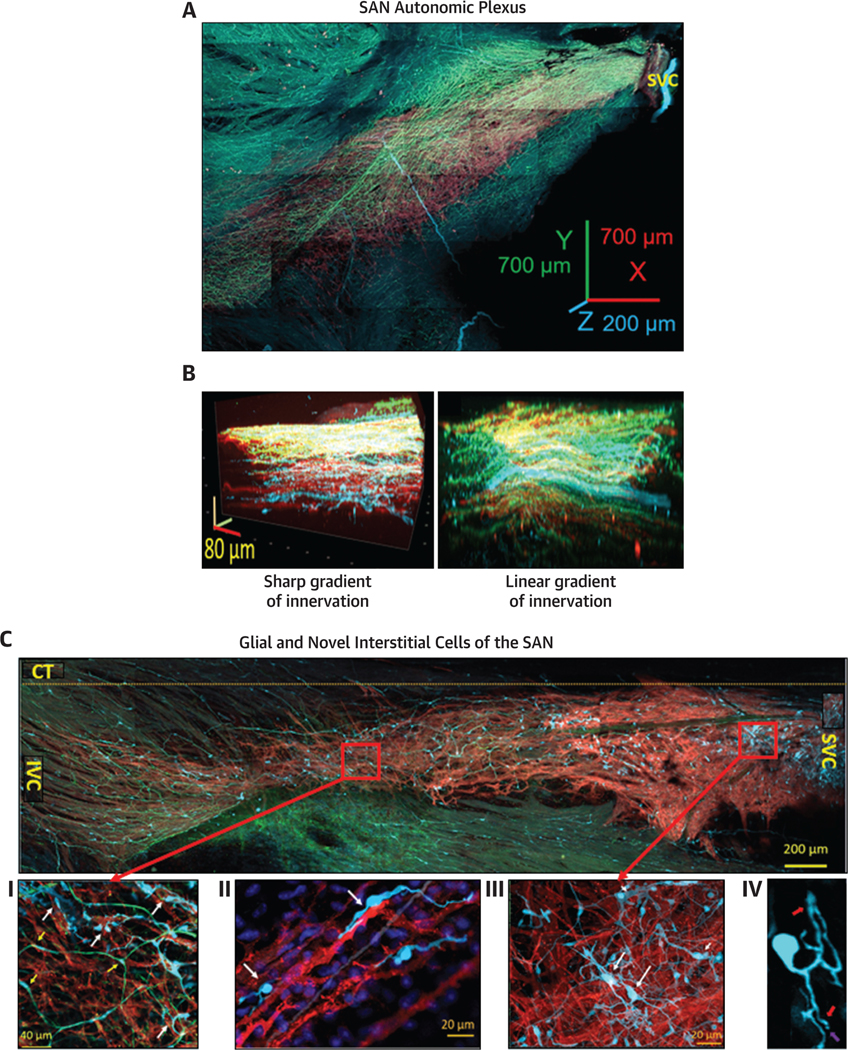
(A) Panoramic 3D-image of the cardiac ganglia (yellow arrow), nerves (red arrows) penetrate the tissue and of the neuronal plexus (cyan-TH, green-VAChT)enwrapped the HCN4+-meshwork (red) and penetrated pectinate muscles of the right auricle. (B) Panel B shows a 3D HCN4+ meshwork (red) of pacemaker cells seen from the endocardial side (top) to the endocardial side (bottom) of VAChT (green) and TH (cyan) immunoreactive neuronal fibres. (C) Tiled panoramic 2D-image, of the HCN4+ - meshwork from superior vena cava (SVC) to inferior vena cava (IVC), crista terminalis (CT) and GFAP+ (green) and S100B+ (cyan) cells scattered between HCN4-immunoreactive cells (red color), across the SAN. (C I, II, III and IV) Illustrate S100B+/GFAP− interstitial cells (white arrows), S100B+/GFAP+ peripheral glial cells (yellow arrow) imaged at higher optical zoom. (D) Illustrates Telocytes confirmed by TEM and extravesicular bodies resembling to telocytes detected by immunohistochemistry in panel C IV. (E) Illustrates the variability in cycle lengths of the Ca2+ signal, with the mean cycle length shown by the dotted line. Poincare plot shows that S100B alters SAN spatial and temporal distribution of local Ca2+ signals (top panels) and rate rhythm of AP firing (lower panels). The best fit is given by the equation y=1.0×+1.63, R2=1.0, indicating the self-similarity among the points in the time series, although their absolute magnitudes differ.
PERSPECTIVES.
COMPETENCY IN MEDICAL KNOWLEDGE:
Our discoveries open the door for reframing and reconceptualizing mechanisms of SAN structure and rhythmogenesis.
TRANSLATIONAL OUTLOOK:
Our conceptualization of the SAN as the heart’s “central brain” allows for the synthesis of the results reported herein, as well as previous data from the field, to ultimately create an understanding of SAN structure different from previously proposed models. Our discovery that S100B, contained in a novel type of SAN interstitial cells, modulates rhythmic Ca2+ activity of pacemaker cells by decreasing their AP-firing frequency and increasing heart rate variability implies previously undefined cellular mechanisms of arrhythmias.
FUNDING SUPPORT AND AUTHOR DISCLOSURES
From the Laboratory of Cardiovascular Science, Intramural Research Program, National Institute on Aging, National Institutes of Health, Baltimore, Maryland, USA. This work was supported by the Intramural Research Program of the National Institutes of Health, National Institute on Aging.
ABBREVIATIONS AND ACRONYMS
- 2D
2-dimensional
- 3D
3-dimensional
- AP
action potential
- ChAT
choline acetyltransferase
- CNS
central nervous system
- CX43
connexin 43
- DAPI
4’,6-diamidino-2-phenylindole
- GFAP
glial fibrillary acidic protein
- HCN4
hyperpolarization-activated cyclic nucleotidegated-channel 4
- ICG
intracardiac ganglia
- IVC
inferior vena cava
- LCR
local Ca2+ release
- PGC
peripheral glial cell
- S100B
S100 calcium-binding protein B
- SAN
sinoatrial node
- SVC
superior vena cava
- TEM
transmission electron microscopy
- TH
tyrosine hydroxylase
- VAChT
vesicular acetylcholine transporter
Footnotes
The authors attest they are in compliance with human studies committees and animal welfare regulations of the authors’ institutions and Food and Drug Administration guidelines, including patient consent where appropriate. For more information, visit the Author Center.
APPENDIX For supplemental figures, tables, and videos, please see the online version of this paper.
The authors have reported that they have no relationships or conflicts of interest relevant to the contents of this paper to disclose.
REFERENCES
- 1.Wake E, Brack K. Characterization of the intrinsic cardiac nervous system. Auton Neurosci. 2016;199: 3–16. [DOI] [PubMed] [Google Scholar]
- 2.Armour JA. The little brain on the heart. Cleve Clin J Med. 2007;74(suppl 1):S48–S51. [DOI] [PubMed] [Google Scholar]
- 3.Rajendran PS, Challis RC, Fowlkes CC, et al. Identification of peripheral neural circuits that regulate heart rate using optogenetic and viral vector strategies. Nat Commun. 2019;10:1944. [DOI] [PMC free article] [PubMed] [Google Scholar]
- 4.Grodner AS, Lahrtz HS, Pool PE, Braunwald E. Neurotransmitter control of sinoatrial pacemaker frequency in isolated rat atria and in intact rabbits. Circ Res. 1970;27:867–873. [DOI] [PubMed] [Google Scholar]
- 5.Hanna P, Dacey MJ, Brennan J, et al. Innervation and neuronal control of the mammalian sinoatrial node a comprehensive atlas. Circ Res. 2021;128:1279–1296. [DOI] [PMC free article] [PubMed] [Google Scholar]
- 6.Bak P, Tang C, Wiesenfeld K. Self-organized criticality: an explanation of the 1/f noise. Phys Rev Lett. 1987;59:381–384. [DOI] [PubMed] [Google Scholar]
- 7.Maltsev AV, Maltsev VA, Mikheev M, et al. Synchronization of stochastic Ca(2)(+) release units creates a rhythmic Ca(2)(+) clock in cardiac pacemaker cells. Biophys J. 2011;100:271–283. [DOI] [PMC free article] [PubMed] [Google Scholar]
- 8.Nivala M, Ko CY, Nivala M, Weiss JN, Qu Z. Criticality in intracellular calcium signaling in cardiac myocytes. Biophys J. 2012;102:2433–2442. [DOI] [PMC free article] [PubMed] [Google Scholar]
- 9.Tsutsui K, Monfredi OJ, Sirenko-Tagirova SG, et al. A coupled-clock system drives the automaticity of human sinoatrial nodal pacemaker cells. Sci Signal. 2018;11. [DOI] [PMC free article] [PubMed] [Google Scholar]
- 10.Weiss JN, Qu Z. The sinus node: still mysterious after all these years. J Am Coll Cardiol EP. 2020;6:1841–1843. [DOI] [PMC free article] [PubMed] [Google Scholar]
- 11.Bychkov R, Juhaszova M, Tsutsui K, et al. Synchronized cardiac impulses emerge from heterogeneous local calcium signals within and among cells of pacemaker tissue. J Am Coll Cardiol EP. 2020;6:907–931. [DOI] [PMC free article] [PubMed] [Google Scholar]
- 12.Yaniv Y, Lyashkov AE, Sirenko S, et al. Stochasticity intrinsic to coupled-clock mechanisms underlies beat-to-beat variability of spontaneous action potential firing in sinoatrial node pacemaker cells. J Mol Cell Cardiol. 2014;77:1–10. [DOI] [PMC free article] [PubMed] [Google Scholar]
- 13.Cerbai F, Lana D, Nosi D, et al. The neuron-astrocyte-microglia triad in normal brain ageing and in a model of neuroinflammation in the rat hippocampus. PLoS One. 2012;7:e45250. [DOI] [PMC free article] [PubMed] [Google Scholar]
- 14.Fahrenbach JP, Mejia-Alvarez R, Banach K. The relevance of non-excitable cells for cardiac pace-maker function. J Physiol. 2007;585:565–578. [DOI] [PMC free article] [PubMed] [Google Scholar]
- 15.Lynn CW, Bassett DS. The physics of brain network structure, function and control. Nat Rev Phys. 2019;1:318–332. [Google Scholar]
- 16.Freeman MR, Rowitch DH. Evolving concepts of gliogenesis: a look way back and ahead to the next 25 years. Neuron. 2013;80:613–623. [DOI] [PMC free article] [PubMed] [Google Scholar]
- 17.Jakel S, Dimou L. Glial cells and their function in the adult brain: a journey through the history of their ablation. Front Cell Neurosci. 2017;11:24. [DOI] [PMC free article] [PubMed] [Google Scholar]
- 18.Badimon A, Strasburger HJ, Ayata P, et al. Negative feedback control of neuronal activity by microglia. Nature. 2020;586:417–423. [DOI] [PMC free article] [PubMed] [Google Scholar]
- 19.Enes J, Haburcak M, Sona S, et al. Satellite glial cells modulate cholinergic transmission between sympathetic neurons. PLoS One. 2020;15: e0218643. [DOI] [PMC free article] [PubMed] [Google Scholar]
- 20.Tedoldi A, Argent L, Montgomery JM. The role of the tripartite synapse in the heart: how glial cells may contribute to the physiology and path-ophysiology of the intracardiac nervous system. Am J Physiol Cell Physiol. 2021;320:C1–C14. [DOI] [PubMed] [Google Scholar]
- 21.Pauza DH, Saburkina I, Rysevaite K, et al. Neuroanatomy of the murine cardiac conduction system: a combined stereomicroscopic and fluorescence immunohistochemical study. Auton Neurosci. 2013;176:32–47. [DOI] [PubMed] [Google Scholar]
- 22.Pauza DH, Rysevaite K, Inokaitis H, et al. Innervation of sinoatrial nodal cardiomyocytes in mouse. A combined approach using immunofluorescent and electron microscopy. J Mol Cell Cardiol. 2014;75:188–197. [DOI] [PubMed] [Google Scholar]
- 23.Rysevaite K, Saburkina I, Pauziene N, Noujaim SF, Jalife J, Pauza DH. Morphologic pattern of the intrinsic ganglionated nerve plexus in mouse heart. Heart Rhythm. 2011;8:448–454. [DOI] [PMC free article] [PubMed] [Google Scholar]
- 24.Grainger N, Guarina L, Cudmore RH, Santana LF. The organization of the sinoatrial node microvasculature varies regionally to match local myocyte excitability. Function (Oxf). 2021;2: zqab031. [DOI] [PMC free article] [PubMed] [Google Scholar]
- 25.Boesmans W, Lasrado R, Vanden Berghe P, Pachnis V. Heterogeneity and phenotypic plasticity of glial cells in the mammalian enteric nervous system. Glia. 2015;63:229–241. [DOI] [PubMed] [Google Scholar]
- 26.Jessen KR, Mirsky R. Glial fibrillary acidic polypeptides in peripheral glia. Molecular weight, heterogeneity and distribution. J Neuroimmunol. 1985;8:377–393. [DOI] [PubMed] [Google Scholar]
- 27.Cretoiu SM, Popescu LM. Telocytes revisited. Biomol Concepts. 2014;5:353–369. [DOI] [PubMed] [Google Scholar]
- 28.Mitrofanova LB, Gorshkov AN, Konovalov PV, Krylova JS. Telocytes in the human sinoatrial node. J Cell Mol Med. 2018;22:521–532. [DOI] [PMC free article] [PubMed] [Google Scholar]
- 29.Morquette P, Verdier D, Kadala A, et al. An astrocyte-dependent mechanism for neuronal rhythmogenesis. Nat Neurosci. 2015;18:844–854. [DOI] [PubMed] [Google Scholar]
- 30.Sakatani S, Seto-Ohshima A, Shinohara Y, et al. Neural-activity-dependent release of S100B from astrocytes enhances kainate-induced gamma oscillations in vivo. J Neurosci. 2008;28:10928–10936. [DOI] [PMC free article] [PubMed] [Google Scholar]
- 31.Yang D, Morrell CH, Lyashkov AE, et al. Ca(2þ) and membrane potential transitions during action potentials are self-similar to each other and to variability of ap firing intervals across the broad physiologic range of AP intervals during autonomic receptor stimulation. Front Physiol. 2021;12: 612770. [DOI] [PMC free article] [PubMed] [Google Scholar]
- 32.Scridon A, Serban RC, Chevalier P. Atrial fibrillation: neurogenic or myogenic? Arch Cardiovasc Dis. 2018;111:59–69. [DOI] [PubMed] [Google Scholar]
- 33.Levy MN. Sympathetic-parasympathetic interactions in the heart. Circ Res. 1971;29:437–445. [DOI] [PubMed] [Google Scholar]
- 34.Kikel-Coury NL, Brandt JP, Correia IA, et al. Identification of astroglia-like cardiac nexus glia that are critical regulators of cardiac development and function. PLoS Biol. 2021;19:e3001444. [DOI] [PMC free article] [PubMed] [Google Scholar]
- 35.Denecker G, Vandamme N, Akay O, et al. Identification of a ZEB2-MITF-ZEB1 transcriptional networkthatcontrolsmelanogenesisandmelanoma progression. Cell Death Differ. 2014;21:1250–1261. [DOI] [PMC free article] [PubMed] [Google Scholar]
- 36.Sowa Y, Imura T, Numajiri T, et al. Adipose stromal cells contain phenotypically distinct adipogenic progenitors derived from neural crest. PLoS One. 2013;8:e84206. [DOI] [PMC free article] [PubMed] [Google Scholar]
- 37.Ion A, Stafie C, Mitu O, et al. Biomarkers utility: at the borderline between cardiology and neurology. J Cardiovasc Dev Dis. 2021;8. [DOI] [PMC free article] [PubMed] [Google Scholar]
- 38.Michetti F, D’Ambrosi N, Toesca A, et al. The S100B story: from biomarker to active factor in neural injury. J Neurochem. 2019;148:168–187. [DOI] [PubMed] [Google Scholar]
- 39.Scherschel K, Hedenus K, Jungen C, et al. Cardiac glial cells release neurotrophic S100B upon catheter-based treatment of atrial fibrillation. Sci Transl Med. 2019;11. [DOI] [PubMed] [Google Scholar]
- 40.Zheng L, Fan QM, Wei ZY. Serum S-100beta and NSE levels after off-pump versus on-pump coronary artery bypass graft surgery. BMC Cardiovasc Disord. 2015;15:70. [DOI] [PMC free article] [PubMed] [Google Scholar]
- 41.Missler U, Orlowski N, Notzold A, Dibbelt L, Steinmeier E, Wiesmann M. Early elevation of S100B protein in blood after cardiac surgery is not a predictor of ischemic cerebral injury. Clin Chim Acta. 2002;321:29–33. [DOI] [PubMed] [Google Scholar]
- 42.Broadhead MJ, Miles GB. A common role for astrocytes in rhythmic behaviours? Prog Neurobiol. 2021;202:102052. [DOI] [PubMed] [Google Scholar]
- 43.Moen JM, Matt MG, Ramirez C, et al. Over-expression of a neuronal type adenylyl cyclase (type 8) in sinoatrial node markedly impacts heart rate and rhythm. Front Neurosci. 2019;13:615. [DOI] [PMC free article] [PubMed] [Google Scholar]
- 44.Donato R,Sorci G,Riuzzi F,et al.S100B’sdouble life: intracellular regulator and extracellular signal. Biochim Biophys Acta. 2009;1793:1008–1022. [DOI] [PubMed] [Google Scholar]
- 45.Vinogradova TM, Bogdanov KY, Lakatta EG. Novel perspectives on the beating rate of the heart. Circ Res. 2002;91:e3. [DOI] [PubMed] [Google Scholar]
- 46.Laing BT, Siemian JN, Sarsfield S, Aponte Y. Fluorescence microendoscopy for in vivo deep-brain imaging of neuronal circuits. J Neurosci Meth. 2021: 348. [DOI] [PMC free article] [PubMed] [Google Scholar]
- 47.Zong WJ, Wu RL, Li ML, et al. Fast highresolution miniature two-photon microscopy for brain imaging in freely behaving mice. Nat Methods. 2017;14:713–719. [DOI] [PubMed] [Google Scholar]
Associated Data
This section collects any data citations, data availability statements, or supplementary materials included in this article.


