Abstract
The T-cell receptor (TCR) Vα/β gene product expression upon in vitro stimulation with mycobacteria was investigated to assess whether T-cell proliferation was associated with any specific TCR V gene usage. T-cell-enriched populations from peripheral blood of Mycobacterium bovis BCG-vaccinated healthy blood donors were stimulated in vitro with live or killed M. tuberculosis or with a soluble extract thereof. TCR Vα/β repertoire analysis of reactive CD4+ and CD8+ T cells revealed a selective HLA-DR17(3), DQ2-restricted expansion of Vα2.3+ CD4+ T cells upon stimulation with live M. tuberculosis or its soluble extract. Third-complementarity-determining-region (CDR3) length analysis of the expanded Vα2.3+ T cells indicated an oligoclonal pattern with short CDR3 lengths in six of seven HLA-DR17(3), DQ2+ individuals tested. In addition, Vα/Vβ repertoire analysis of T lymphocytes from a DR17(3), DQ2+ donor before and after BCG vaccination revealed that positivity of skin test reactivity was associated with expansion of Vα2.3+ CD4+ T lymphocytes with preferential use of a short CDR3 peak length after in vitro stimulation. Separation of M. tuberculosis soluble extract by fast protein liquid chromatography (FPLC) purification indicated that fractions corresponding to molecular masses of 60 to 70 and 15 to 25 kDa were particularly effective in eliciting Vα2.3+ CD4+ T-cell expansion.
Mycobacteria are intracellular pathogens which persist and multiply inside the cells of the monocyte-macrophage lineage (34). Immunity to mycobacteria strongly depends on T cells, and although recent studies have demonstrated that, at least in the mouse model, CD8+ or γδ+ T cells are required for an effective response to Mycobacterium tuberculosis (15, 24, 25), CD4+ T cells remain the main T-cell subset involved (1, 34). T cells are indispensable for protection, but they also contribute to the immunopathology of tuberculosis and may be responsible for clinical manifestations like fever, weight loss, inflammation, and tissue necrosis (10).
T lymphocytes use T-cell receptor (TCR) heterodimers to specifically recognize antigens. Antigen recognition involves the formation of a trimolecular complex between the TCR, major histocompatibility complex (MHC) molecules, and processed antigen (8). αβ and γδ TCRs are composed of two chains, each encoded by different gene segments: V (variable), D (diversity), J (joining), and C (constant) for β and δ; V, J, and C for α and γ. The third hypervariable region (CDR3) of TCR α and β chains, encoded by VαJα and VβDβJβ joints, respectively, is involved mainly in recognition of the antigen fragment associated with the MHC molecule (8, 14). Thus, involvement of CDR3-β and CDR3-α loops is expected in a conventional antigen-specific response (17). Unlike nominal antigens, superantigens bind to MHC class II molecules at nonpolymorphic sites distinct from the peptide binding groove and interact with a portion of the Vβ-encoded region not involved in conventional antigen recognition (23). Consequently, superantigens have the capability of polyclonally stimulating a substantial fraction of T cells expressing particular TCR Vβ family members (7). Thus, a detailed analysis of responsive T cells at the TCR level may give important information about the nature of the antigens involved.
Many aspects of the cellular immune response to mycobacteria in humans remain to be elucidated. For example, whether the response is directed toward a few powerful immunodominant mycobacterial antigens or, rather, is directed to a vast number of bacterial proteins is still under investigation. While several studies reveal marked heterogeneity of the cellular immune response to M. tuberculosis both in patients and in healthy purified protein derivative (PPD)-positive contacts, formally demonstrating that a large number of different antigens serve as targets for T cells (5, 39), other groups reported that heat shock protein (hsp)-derived peptides are immunodominant in the mycobacterium-specific T-cell response of individuals with a particular haplotype (18). Polyclonal proliferation of T cells expressing a Vβ8 TCR has been found in pleural fluid of tuberculous patients and after stimulation in vitro with M. tuberculosis (31). Vβ8+ T-cell expansions were independent of MHC restriction and did not require antigen processing, suggesting the existence of a superantigen in M. tuberculosis. Such an observation deserves further confirmation since massive proliferation of T cells induced by a superantigen could explain some systemic manifestations as well as immunopathological aspects of tuberculosis. A better understanding of the nature of the T-cell response to mycobacteria as well as of the immunologically important antigens able to induce such a response will help to reveal the role of T cells in the disease process and will be useful in the development of a new vaccine against tuberculosis.
We have previously studied the in vitro proliferative responses of distinct human T-cell subsets upon stimulation with live M. tuberculosis or other kinds of mycobacterial antigen preparations (3, 11). The aim of the present study was to establish if the T-cell proliferation was associated with any particular Vα/β TCR usage. To this end, the TCR V-gene product expression of Mycobacterium-reactive peripheral blood T lymphocytes was analyzed after in vitro stimulation with M. tuberculosis (live or killed) or a soluble extract thereof. Furthermore, analyses of the CDR3 region length were performed on expanded T cells to evaluate the nature of the response (i.e., polyclonal or oligoclonal). While in most of the blood donors tested no bias toward any particular Vα/β TCR was observed, stimulation with live M. tuberculosis or its soluble extract induced a selective HLA-DR17, DQ2-restricted TCR Vα2.3 expression by Mycobacterium-reactive peripheral blood CD4+ T cells. Interestingly, this enhanced, restricted V-gene expression was highly similar to that previously described for bronchial lavage CD4+ T cells from patients with sarcoidosis (19), a granulomatous, chronic disease in which mycobacteria have been suspected to be etiologic agents.
MATERIALS AND METHODS
Mycobacterial antigens.
M. tuberculosis NBL 27/94 was isolated from the blood of a Swedish child with disseminated tuberculosis. The strain was grown for 3 to 4 weeks at 37°C in standing cultures in Middlebrook 7H9 broth supplemented with oleic acid-albumin-dextrose complex (Difco, Detroit, Mich.). Killed M. tuberculosis was prepared by exposing an aliquot of the bacterial suspension to UV irradiation for 40 min. In each experiment, live and UV-killed bacteria were from the same suspension. An M. tuberculosis soluble extract (SN1), selectively stimulating CD4+ αβ+ T cells, was prepared by prolonged sonication of autoclaved and then washed bacteria (3). Another M. tuberculosis extract (TBe) was prepared as previously described (11) and used for fractionation experiments (see below).
Cell populations and in vitro stimulation.
Peripheral blood mononuclear cells (PBMC) were isolated from 15 M. bovis BCG-vaccinated and one nonvaccinated healthy blood donors in a standard Ficoll-density gradient and seeded on 24-well plates at a density of 106 per cm2. After a 1-h incubation at 37°C, nonadherent cells were removed and plastic-adherent cells were incubated with live or UV-killed M. tuberculosis at bacterium-to-monocyte ratios of 5:1 and 25:1, respectively. After a 3-h phagocytosis, the monolayers were washed to remove noningested bacteria and an autologous enriched T-cell population (obtained by passage of PBMC through a nylon wool column) was added (3 × 10⁶ to 4 × 10⁶ cells per well). In parallel cultures, SN1 was used as the stimulant at 9 μg/ml. Phytohemagglutinin (PHA) was used at 5 μg/ml as a control for cell reactivity. As negative controls, antigen-free cultures were established. Enriched T-cell populations from three donors were also stimulated with 9 μg of each of the following mycobacterial proteins per ml: M. leprae 65-kDa protein and M. tuberculosis 10-kDa protein, obtained from the WHO Recombinant Protein Bank; and M. tuberculosis 70-kDa protein and M. bovis 65-kDa protein, obtained from M. Singh, German National Research Center for Biotechnology, Braunschweig, Germany. Cultures were maintained at 37°C for 6 to 7 days in humidified air containing 5% CO2 before the proliferation assay and TCR Vα/Vβ expression analyses were performed.
Proliferation assay and identification of cell subsets responding to mycobacterial antigens.
Proliferative responses of the nylon wool effluent population following stimulation with mycobacterial antigens were assayed by flow cytometric measurement of bromodeoxyuridine (BrdU) uptake, as previously described (11). Briefly, stimulated cultures were incubated for 16 h with BrdU (Sigma, St. Louis, Mo.) at a final concentration of 30 μg/ml. Nonadherent cells were collected, washed and resuspended in a known volume of phosphate-buffered saline (PBS). Each cell suspension was divided into aliquots, and each was stained with a phycoerythrin (PE)-conjugated monoclonal antibody (MAb) directed against different phenotypic surface markers (see below). One aliquot from each stimulated culture was transferred to a Falcon tube (Becton Dickinson, Mountain View, Calif.) and used to assess the absolute number of cells per well after 6 to 7 days of stimulation. The cells were fixed overnight with 1% paraformaldehyde–0.01% Tween 20 in PBS and then subjected to DNA digestion by resuspension in PBS plus Ca2+ and Mg2+ and containing 50 Kunitz units of bovine pancreatic DNase I (Sigma) per ml. Digestion was continued for 45 min at 37°C. After being washed, the cells were resuspended in 150 μl of 10% bovine serum albumin–0.5% Tween 20 in PBS and stained with a fluorescein-isothiocyanate (FITC)-labeled anti-BrdU MAb (Becton Dickinson). After incubation for 45 min at room temperature, the cells were washed, resuspended in PBS, and analyzed by flow cytometry.
TCR repertoire analysis of PBMC stimulated in vitro with M. tuberculosis or its soluble extract.
A triple-staining technique was used as previously described (12). Nonadherent cells were stained with a panel of unlabeled TCR Vα/β-specific MAbs (see below) followed by incubation with FITC-conjugated F(ab′)2 fragments of rabbit anti-mouse immunoglobulin (Ig). After an additional staining with a cocktail of PE-conjugated anti-CD8 and cyanin 5 (Cy5)-conjugated anti-CD4 MAbs, the cells were analyzed. In some experiments, to assess the proliferation of T cells expressing certain Vα and Vβ gene products (i.e., Vα2.3, Vα12.1, Vβ5.1, and Vβ8), FITC-conjugated F(ab′)2 rabbit anti-mouse Ig was replaced with a PE-conjugated antibody, anti-CD8 and anti-CD4 MAbs were omitted, and staining was continued with a FITC-conjugated anti-BrdU antibody as described above.
MAbs.
The following MAbs were used for the stainings: UCHT1 (anti-CD3), MT310 (anti-CD4), and DK25 (anti-CD8) (Dakopatts, Glostrup, Denmark); and anti-TCR-γ/δ-1 (11F2, recognizing all γδ+ T cells) and Leu-11c (anti-CD16) (Becton Dickinson). MAbs specific for the following TCR V gene products were included: Vβ2 and Vβ17 from Immunotech S.A. (Marseilles, France); and Vα2.3, Vα12.1, Vβ3, Vβ5.1, Vβ5.2+5.3, Vβ5.3, Vβ6.7, Vβ8, Vβ12, and Vβ13 from T Cell Diagnostics (Cambridge, Mass.). In addition, FITC-conjugated F(ab′)2 fragments of rabbit anti-mouse Ig and MAbs specific for CD4 (MT310, Cy5 conjugated) and CD8 (DK25, PE conjugated) were purchased from Dakopatts. Normal mouse serum from BALB/c mice at a dilution of 1:500 (PBS containing 0.2% bovine serum albumin and 0.01% sodium azide) and isotype-matched FITC-, PE-, and Cy5-conjugated mouse IgGs (Dakopatts) were used as the negative controls and stained <0.5% of the cells in all cases.
Fluorescence-activated cell sorter (FACS) analysis and estimation of the absolute number of cells responding to mycobacterial antigens.
Twenty thousand events were acquired ungated for each cell surface marker in a FACScan flow cytometer (Becton Dickinson). For analyses, two different gates (R1 and R2) including resting cells and blasts, respectively, were manually set on a two-parameter plot of side scatter versus forward scatter and were kept constant for each condition. LYSYS-II and CellQuest software (Becton Dickinson) was used for computer-assisted analyses.
To assess the absolute number of cells after 6 to 7 days of stimulation, an aliquot (usually 50 μl) of each stimulated culture was fixed by adding 200 μl of 1% paraformaldehyde–0.01% Tween 20 in PBS. During the flow cytometric analysis of the corresponding stained culture, this aliquot was used to assess the absolute count by using a flow rate (usually 0.75 μl/s)-calibrated flow cytometer. In some experiments the absolute number of cells estimated by this method was compared to that obtained by direct counting of the cells by light microscopy, and a good correlation between the two methods was detected. The absolute number of Vα2.3+ T cells was calculated by multiplying the absolute count of total cells by the percentage of immunostained cells.
CDR3-length analysis of expanded T cells.
A method involving PCR amplification and primer extension with fluorescent oligonucleotides was performed to analyze the TCR CDR3 region diversity (35). In brief, total RNA was extracted from nonadherent cells (before and after stimulation) and cDNA was synthesized by standard procedures (9, 38). Vα2.3 cDNA was amplified by PCR (for detailed information, see reference 13) with Vα2.3-specific sense (5′ gat cct gga ccc ttc aat gtt cc) and FITC-labeled Cα-specific antisense (3′ aga gtc tct cag ctg gta cac ggc ag) primers. For fluorescence analysis, an aliquot of each PCR product was loaded into a polyacrylamide gel (ReadyMix; Pharmacia, Uppsala, Sweden). After separation by electrophoresis in an automated sequencer (A. L. F., Pharmacia), the approximate sizes of the different CDR3 fragment peaks were estimated by computer-assisted analysis with A. L. F. Fragment Manager 1.2 software (Pharmacia). Since the sum of the peaks covers the entire TCR Vα2.3 repertoire, the relative frequency of each CDR3-fragment peak was then calculated by dividing the area under each peak by the sum of the areas of all detected peaks. Only CDR3 peak percentages more than twice the percentage of the same-size peak in PHA-stimulated cultures were considered indicative of oligoclonality.
Gel filtration of M. tuberculosis soluble extract by FPLC.
An M. tuberculosis water-soluble extract (TBe), prepared as previously described (11), was lyophilized and resuspended in PBS. Then 1.2 mg of the extract was fractionated by gel filtration on a Superose 12 column (Pharmacia) equilibrated with PBS (pH 7.4). Elution of 0.5-ml fractions at a flow rate of 0.3 ml/min was monitored by measuring the absorbance at 280 nm. Molecular mass standards from 2,000 to 6 kDa (Pharmacia) were used to calibrate the column with PBS as a buffer. While unfractionated TBe extract was particularly effective in eliciting the proliferation of γδ+ T cells (3, 11), upon fast protein liquid chromatography (FPLC) fractionation, γδ+ T-cell-stimulatory activity was confined to the low-molecular-mass range (<10 to 14 kDa), and fractions with higher molecular masses induced strong proliferation of CD4+ αβ+ T cells (3). Then 200 μl of each fraction that was able to selectively stimulate CD4+ αβ+ T cells was used to stimulate PBMC from BCG-vaccinated or nonvaccinated healthy blood donors and tested for their ability to induce the expansion of Vα2.3+ CD4+ T cells.
HLA typing.
HLA-DRB, HLA-DQA, and HLA-DQB alleles were determined by PCR and sequence-specific oligonucleotide probe hybridization (28). The positivity of the HLA-DR17(3), DQ2 haplotype was further confirmed by PCR amplification with DRB1*0301 and DQB1*0201 sequence-specific primers (32, 33). The HLA alleles of the subjects included in the study are depicted in Table 1.
TABLE 1.
HLA typing of the individuals included in the study
| Donora | DRB1 | DQA1 | DQB1 | DRB1 | DQA1 | DQB1 |
|---|---|---|---|---|---|---|
| 1 | *11 | *0501 | *0301 | *13 | *0103 | *0603 |
| 2 | *15 | *0102 | *0602 | *08 | *0401 | *0401/2 |
| 3 | *15 | ND | *0602 | *01 | *0101 | *0501 |
| 4 | *0301 | *0501 | *0201 | *15 | *0102 | *0602 |
| 5 | *0301 | ND | *0201 | ND | ND | ND |
| 6 | *0301 | *0501 | *0201 | *15 | *0102 | *0602 |
| 7 | *13 | *0102 | *0602/3/4 | *07 | *0201 | *0303 |
| 8 | *15 | ND | *0602 | *07 | *0201 | *0303 |
| 9 | *0301 | *0501 | *0201 | *07 | *0201 | *0303 |
| 10 | *04/09 | *03 | *0301/3 | ND | ND | ND |
| 11 | *04/09 | *03 | *0301/3 | ND | ND | ND |
| 12b | ||||||
| 13 | *0301 | ND | *0201 | ND | ND | ND |
| 14 | *0301 | ND | *0201 | ND | ND | ND |
| 15 | *0301 | ND | *0201 | ND | ND | ND |
| 16 | *0301 | ND | *0201 | ND | ND | ND |
Individuals with the HLA-DR17, DQ2 haplotype are indicated in bold.
This donor was negative for DRB1*0301 and DQB1*0201 alleles (sequence-specific primers/PCR).
ND, not done.
Statistical analysis.
The statistical significance of the data was determined by the two-tailed Fisher exact test and the nonparametric Mann-Whitney U test. A P value of less than 0.05 was considered significant.
RESULTS
Proliferative responses of PBMC stimulated with different kinds of M. tuberculosis antigen preparations.
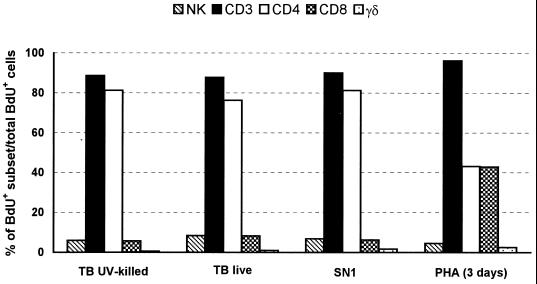
Proliferative responses of PBMC from healthy, BCG-vaccinated donors were evaluated by determination of BrdU uptake following in vitro stimulation with whole (live or killed) M. tuberculosis cells or with a soluble extract (SN1) that selectively stimulates CD4+ αβ+ T cells, prepared by sonication of autoclaved and then washed bacteria (3). In most of the blood donors tested, 20 to 30% of the cells had incorporated BrdU in their DNA after 6 to 7 days of stimulation. At this time point, the proportion of different cell subsets, among the total BrdU+ cells, was evaluated by two-color cytofluorimetric analysis. In agreement with our previous study (11), all the mycobacterial antigen preparations tested elicited a strong proliferation of CD3+ αβ+ T cells, which accounted for more than 80% of the responding population (Fig. 1). Among the CD3+ T cells, a marked proliferation of CD4+ T cells and, to a minor extent, of CD8+ T cells was detected, indicating a major involvement of the CD4+ subset in the in vitro proliferative response to M. tuberculosis.
FIG. 1.
Composition of proliferating cells after 7 days of in vitro stimulation with different kinds of M. tuberculosis (TB) antigen preparations or 3 days of stimulation with PHA. Results from a representative experiment are illustrated.
TCR repertoire analysis of Mycobacterium-reactive T lymphocytes.
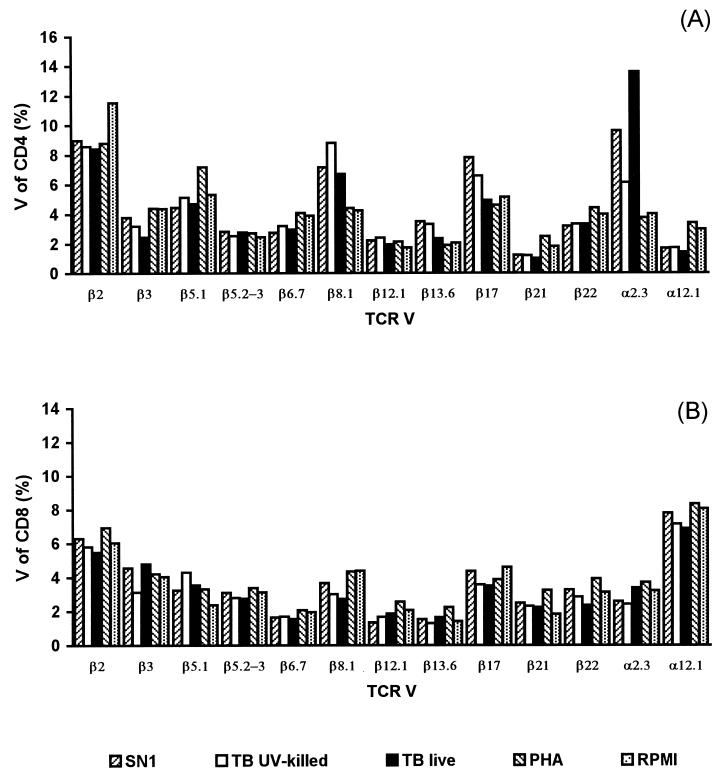
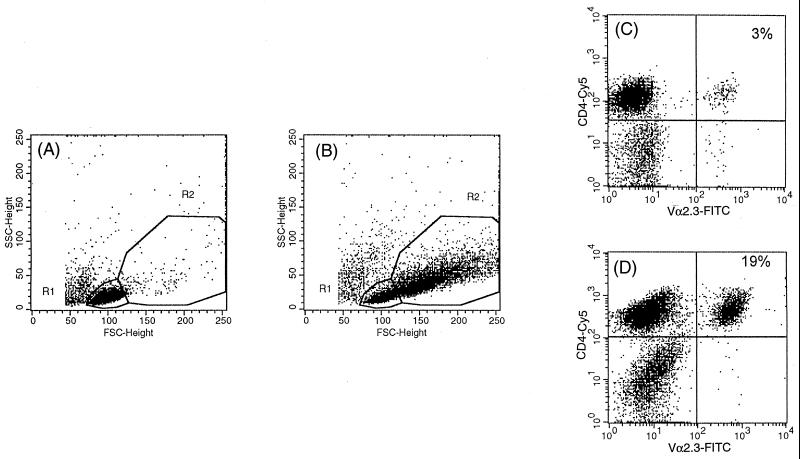
To determine whether the observed T-cell proliferation was associated with any specific TCR V gene usage, we analyzed the TCR Vα/β repertoire of CD4+ and CD8+ T cells by three-color cytofluorimetric analysis with a TCR Vα/β-specific MAb panel that recognizes a substantial proportion of the V-gene repertoire. The TCR Vα/Vβ gene segment product expression of T cells after 6 to 7 days of stimulation with live, killed, or soluble extract of M. tuberculosis cells was compared to that obtained after 3 days of stimulation with a polyclonal stimulator (PHA) or to that obtained with antigen-free cultures. In initial studies, T cells from two of three individuals tested with the available panel of Vα/β gene segment-specific MAbs displayed no evident bias toward any particular Vα/β gene segment following stimulation in vitro with the different kinds of mycobacterial antigen preparations. In contrast, a marked expansion of Vα2.3+ T cells (greater than threefold increase compared to that in PHA-stimulated cultures) was recorded in the CD4 subset from an HLA-DR17(3), DQ2+ individual upon stimulation with live M. tuberculosis or its soluble extract but not with killed bacteria (Fig. 2). A moderate expansion (1.5-fold compared to that in PHA-stimulated cultures) of Vβ8+ CD4+ T cells was also noted for the same blood donor. No evident bias toward any particular Vα/β gene segment was observed in the CD8+ subset. In the subsequent analyses, two different gates were manually set during computer-assisted analysis to include resting cells and blasts, respectively (Fig. 3A and B). The percentages of T cells expressing certain Vα/Vβ gene segment products were separately recorded in the two gates. The expanded Vα2.3+ T cells were preferentially represented in the blast gate, where they accounted for 19% of the total CD4+ cells (Fig. 3D). The preferential proliferation of Vα2.3+ T cells in the blast gate was further confirmed by BrdU-Vα2.3 double staining (data not shown). In contrast, no expansion was observed in the population in the resting-cell gate, in which TCR Vα2.3 expression was similar to that in PHA-stimulated or antigen-free cultures (Fig. 3C).
FIG. 2.
TCR Vα/Vβ expression profiles of CD4+ (A) and CD8+ (B) T cells from an HLA-DR17(3), DQ2+ individual, after a 6-day stimulation with various M. tuberculosis (TB) antigen preparations and a 3-day stimulation with PHA.
FIG. 3.
Preferential expansion of Vα2.3+ CD4+ T cells in the blast gate after a 6-day stimulation with live M. tuberculosis. The resting-cell gate (R1) and the blast gate (R2) were defined in forward-scatter (FSC), side-scatter (SSC) plots according to the population in the antigen-free cultures (A) and to large cells proliferating in response to live mycobacteria (B), respectively. The Vα2.3+ T-cell frequencies among CD4 cells were separately calculated for the resting-cell gate (C) and the blast gate (D).
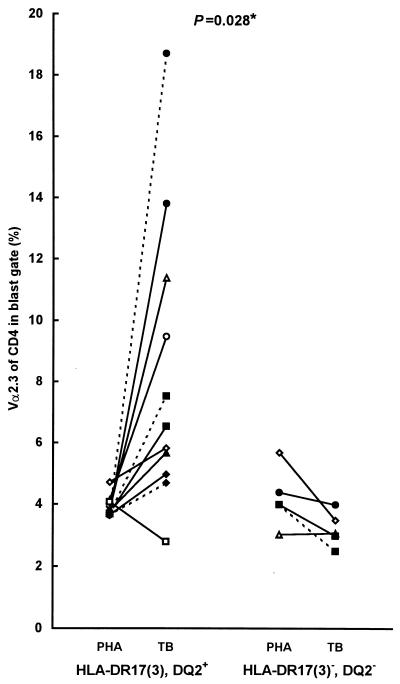
HLA-DR17(3), DQ2-restricted Vα2.3+ CD4+ T-cell expansions were demonstrated previously in bronchoalveolar lavage fluid from patients with sarcoidosis, a granulomatous disease with unknown etiology (19). Thus, to further investigate the TCR Vα2.3 expansions in relation to HLA-DR17(3), DQ2 expression in a larger group of individuals, a restricted panel of two to five anti-TCR Vα/β-region MAbs (i.e., anti-Vα2.3, anti-Vβ8, anti-Vβ5.1, anti-Vβ3, and anti-Vα12.1) was chosen for the analyses. Expansions of Vα2.3+ CD4+ T cells compared to those in PHA-stimulated cultures were detected upon in vitro stimulation with live M. tuberculosis or its soluble extract in seven of the eight HLA-DR17(3), DQ2+ individuals but in none of the four HLA-DR17(3)−, DQ2− subjects tested. When the ratios between the percentage of Vα2.3+ CD4+ T cells in Mycobacterium-stimulated cultures and PHA-stimulated cultures were calculated for DR17+ and DR17− individuals, a statistically significant difference was observed between the two groups (P = 0.028, two-tailed nonparametric Mann-Whitney U test) (Fig. 4). In addition, a moderate, 1.5- to 2-fold expansion of Vβ8+ CD4+ T cells was noted in 2 of 12 individuals. No significant expansions of T cells expressing other TCR Vα/β cells tested were recorded for any of the blood donors analyzed (data not shown).
FIG. 4.
TCR Vα2.3 expression of CD4+ T cells (blast gate), upon in vitro stimulation with live M. tuberculosis (TB) or its soluble extract (SN1), in eight HLA-DR17, DQ2-positive and four negative individuals. The ratio of Vα2.3 expression in Mycobacterium-stimulated and PHA-stimulated T cells was compared between the two groups of subjects by the nonparametric, two-tailed Mann-Whitney U test. Continuous lines, soluble extract; dashed lines, live M. tuberculosis (each symbol represents a different individual).
CDR3 length analysis of expanded Vα2.3+ T cells.
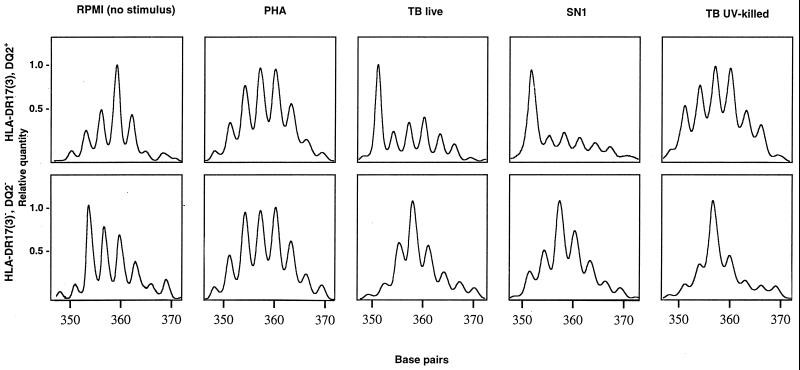
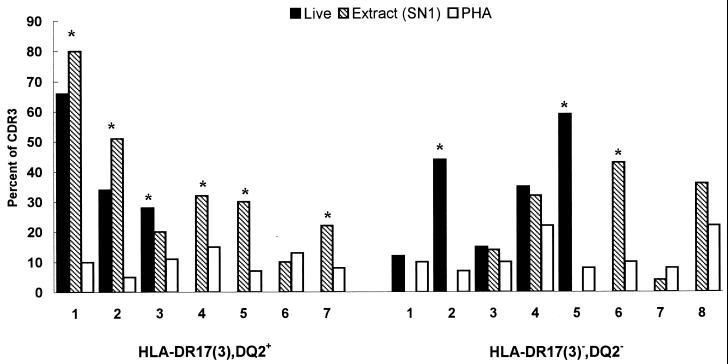
To assess the nature of the antigen(s) driving the expansions of Vα2.3+ T cells (nominal antigen or superantigen), CDR3 length analysis was performed following amplification with Vα2.3 and FITC-labeled Cα-specific primers of cDNA obtained from stimulated cells. Figure 5 illustrates the distributions of CDR3 lengths used by Vα2.3+ T cells in DR17+ and in DR17− individuals, respectively. In both blood donors, the CDR3 length diversity profiles of PHA-stimulated lymphocytes were consistent with a polyclonal stimulation and resembled those observed for unstimulated PBMC. In contrast, stimulation with live M. tuberculosis or its soluble extract resulted in a marked length restriction with a preferential usage of a short (351-bp) CDR3 length for TCR Vα2.3+ T cells from the DR17+ but not from the DR17− individual. Upon in vitro stimulation with live M. tuberculosis and/or its soluble extract, such bias with short (351- to 357-bp) CDR3 peak lengths was observed for the TCR Vα2.3 gene segment in six of seven DR17+ subjects but in only three of eight DR17− donors tested (P = 0.11, two-tailed Fisher exact test) (Fig. 6).
FIG. 5.
CDR3 profiles for the Vα2.3 gene segment from an HLA-DR17(3), DQ2+ and an HLA-DR17(3)−, DQ2− blood donor upon in vitro stimulation with various M. tuberculosis (TB) antigens, PHA, and RPMI (no stimulus). Major peaks observed in the CDR3 length profiles of Vα2.3+ T cells stimulated with live M. tuberculosis or its soluble extract (SN1) in the DR17+ donor correspond to 351 bp.
FIG. 6.
Relative frequency of short CDR3 peak lengths (351 to 357 bp) for the Vα2.3 gene segment from HLA-DR17(3), DQ2+ and HLA-DR17(3)−, DQ2− individuals. ∗, CDR3 peak percentage more than twice the percentage of the same-size peak in PHA-stimulated cultures. The relative frequency (percent) of each CDR3 size peak was calculated by dividing the area under each peak by the sum of the areas of all detected peaks.
TCR repertoire analyses in an HLA-DR17(3), DQ2+ donor before and after vaccination with BCG.
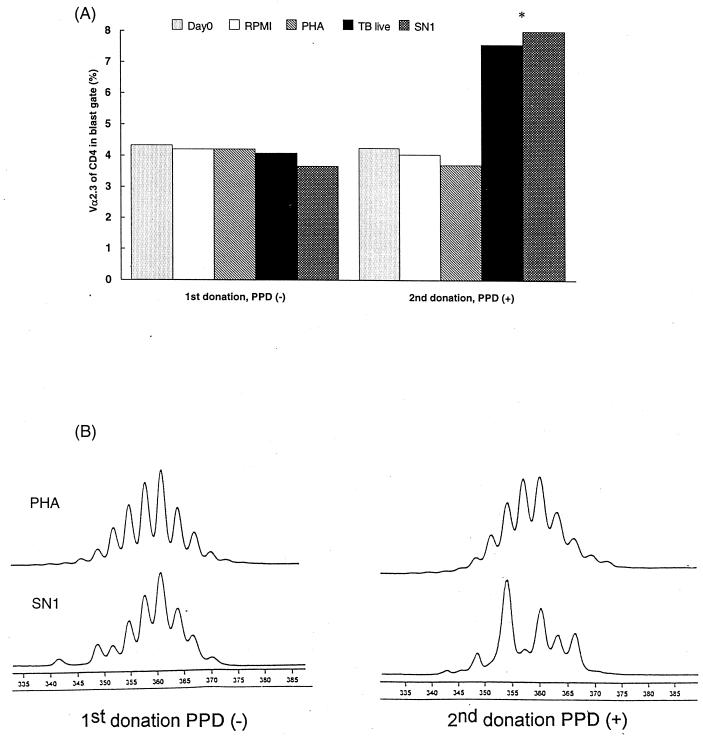
For one HLA-DR17(3), DQ2+ adult, it was possible to perform two subsequent TCR Vα/Vβ repertoire analyses. The first sample was obtained after assessing the negativity of the subject to the PPD skin test, indicating no prior sensitization to mycobacterial antigens. The second sample was collected 8 months after BCG vaccination, when the individual now displayed positive skin reactivity to PPD. In vitro stimulation with mycobacterial antigens of T lymphocytes from the first sample induced low proliferation levels similar to the antigen-free cultures with no preferential Vα/Vβ expansion. However, stimulation of T lymphocytes from the second sample induced a preferential proliferation of Vα2.3+ CD4+ T cells, with at least a twofold increase in comparison to that for PHA-stimulated or nonstimulated cultures (Fig. 7A). In addition, CDR3 length profiles for Mycobacterium-stimulated Vα2.3+ T cells differed before and after the BCG vaccination. As represented in Fig. 7B, in vitro stimulation with live M. tuberculosis or SN1 (soluble extract) resulted in substantial increases in the amount of a 354-bp peak in the CDR3 length profile of Vα2.3+ T cells stimulated after vaccination, while a profile essentially identical to that of PHA-stimulated cultures was observed at the time of PPD negativity.
FIG. 7.
TCR Vα2.3 expression (A) and CDR3 length analyses of Vα2.3+ T cells (B) upon in vitro stimulation with mycobacterial antigens and PHA in an HLA-DR17(3), DQ2+ individual before and 8 months after BCG vaccination. (A) When there was not a significant number of events in the blast gate due to low proliferation, the resting-cell gate was used for calculations (i.e., Day0 and antigen-free culture [RPMI] for both donations, TB live and SN1 for the first donation). (B) The vertical axis represents the relative quantity (arbitrary fluorescence units), while the horizontal axis denotes the length in base pairs.
Vα2.3+ T-cell expansion upon stimulation with FPLC-fractionated M. tuberculosis soluble extract or some known mycobacterial proteins.
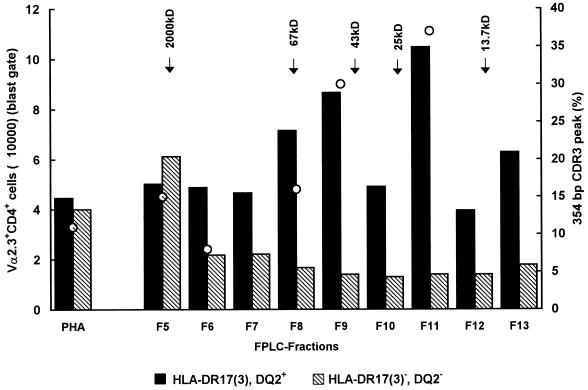
In an attempt to identify the active component(s) that was able to induce expansion of Vα2.3+ CD4+ T cells, M. tuberculosis extract was fractionated by FPLC. Each fraction was assayed for its ability to stimulate Vα2.3+ T cells in vitro (in a 7-day stimulation assay) in three individuals. In the two DR17+ individuals but not in the DR17− individual, several fractions corresponding to molecular masses of 60 to 70 kDa and 15 to 25 kDa, respectively, were able to stimulate the expansion of Vα2.3+ T cells compared to PHA (Fig. 8). Moreover, expansion of Vα2.3+ T cells stimulated with the different fractions correlated well with the preferential usage of short CDR3 length used by Vα2.3+ T cells of the corresponding fractions (Fig. 8).
FIG. 8.
Absolute number of Vα2.3+ CD4+ T cells (blast gate) after 7 days of in vitro stimulation with fractionated M. tuberculosis extract and 3 days of stimulation with PHA, in an HLA-DR17(3), DQ2+ and an HLA-DR17(3)−, DQ2− donor. The short CDR3 peak length percentage of each fraction (when tested) is indicated by an open circle for the DR17+ donor.
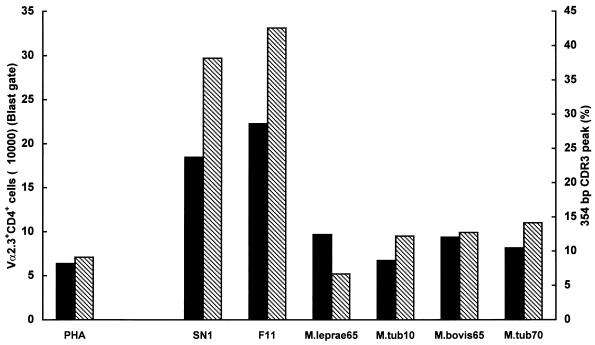
To determine whether any of the known mycobacterial antigens could induce the expansion of the Vα2.3+ CD4+ T-cell subset, cells from three HLA-DR17(3), DQ2+ donors were stimulated in vitro with some recombinant M. tuberculosis (10- and 70-kDa), M. leprae (65-kDa), or M. bovis (65-kDa) proteins. As illustrated in Fig. 9 for a representative donor, in contrast to what observed with SN1 or FPLC fraction F11, none of the tested proteins corresponding to molecular masses of 65, 70, or 10 kDa were able to induce the expansion of Vα2.3+ T cells and/or preferential usage of short CDR3 length by Vα2.3+ T cells.
FIG. 9.
Absolute number of Vα2.3+ CD4+ cells (blast gate) ■ and short CDR3 peak length percentages (▧) upon in vitro stimulation with M. tuberculosis extract (SN1), FPLC fraction F11, several known mycobacterial proteins, or PHA, in an HLA-DR17, DQ2+ donor.
DISCUSSION
A central role of CD4+ αβ+ T cells in protective immunity to mycobacteria is well established (1, 34), although recent evidence indicates that several cell subsets are required for a balanced immune response to M. tuberculosis (6, 26, 30). However, T cells also contribute to the pathogenesis of tuberculosis (10). A central question in mycobacterial immunity, in view of the design of a new vaccine against tuberculosis, is which antigens are protective or contribute to the immunopathology of the disease. Analysis of TCR Vα/β expression of Mycobacterium-reactive T lymphocytes may provide important information about the nature of the antigen(s) involved.
In the present study, the Vα/β repertoire of T lymphocytes from healthy blood donors upon in vitro stimulation with mycobacterial antigens was investigated. While T cells from most of the donors showed no bias toward any of the Vα/β chains tested, significant expansions of CD4+ Vα2.3+ T cells in HLA-DR17(3), DQ2+ subjects were demonstrated upon in vitro stimulation with M. tuberculosis or its soluble extract SN1. The Vα2.3+ T-cell expansions accounted for up to 19% of the CD4+ blast T-cell population with an up to fourfold increase in frequency compared to that in PHA-stimulated cultures. CDR3 length analysis of expanded Vα2.3+ T cells implied an oligoclonal pattern with a preferential usage of short (possibly less than 9 amino acids [36]) CDR3 lengths in all but one of the HLA-DR17(3), DQ2+ subjects. For one HLA-DR17(3), DQ2+ individual, it was possible to perform two subsequent TCR Vα/Vβ repertoire analyses before and after BCG vaccination. Interestingly, while stimulation with mycobacterial antigens of T lymphocytes from the first donation, when the subject was PPD negative, induced low proliferation levels similar to the antigen-free cultures with no preferential Vα/Vβ expansion, a positive skin test reactivity was associated with a preferential expansion of Vα2.3+ CD4+ T lymphocytes with a preferential use of short CDR3 peak lengths after in vitro stimulation. Altogether, these findings (i.e., dependence on CD4 expression and DR17, DQ2-Vα2.3 restriction, CDR3 length profile suggesting oligoclonality, and dependence on a previous sensitization with mycobacterial antigens) may indicate a conventional antigen-specific T-cell response to M. tuberculosis as a cause of the observed preferential reactivity of Vα2.3+ T cells. To assess whether the observed increased frequency of Vα2.3+ CD4+ T lymphocytes is consistent with an expansion or, instead, is a clonal selection, data have also been expressed in terms of the absolute number of Vα2.3+ CD4+ T lymphocytes after stimulation. The observed increases in the absolute numbers of Vα2.3+ CD4+ T cells (Fig. 8 and 9) favor an expansion rather than clonal selection.
In accordance with previous reports (5, 39), the data presented in this study suggest that most healthy, sensitized individuals can recognize a large variety of the proteins of M. tuberculosis rather than a few immunodominant antigens. Nevertheless, it seems possible that individuals with a particular HLA haplotype are preferentially responsive to one or a few immunodominant mycobacterial antigens. Preferential responses toward dominant mycobacterial T-cell epitopes in DR17+ individuals have been described previously (18). Also, a reduced frequency of the HLA-DR3 type was observed in tuberculosis patients and was associated with unfavorable development of the disease (27). It remains to be determined whether the expanded Vα2.3+ T cells in our study protect against or contribute to the immunopathology of tuberculosis.
In vivo T-cell expansions in pleural fluids of tuberculous patients have been described and indicate local involvement of specific T cells at the site of the disease (16, 31). In particular, in one study a local expansion of Vβ8+ T cells, in comparison with PBMC, was described in the majority of tuberculous pleuritis patients analyzed (31). Since expansions occurred in both CD4+ and CD8+ T-cell subsets and the CDR3 region of responsive Vβ8+ T cells displayed highly diverse sequences, the possibility that M. tuberculosis contains a superantigen was suggested (31). In the same study, expansions of Vβ8+ T lymphocytes were also found after in vitro stimulation of PBMC from PPD− or PPD+ healthy blood donors. In another study, whose results are in conflict with those described above, increases in numbers of T cells expressing different Vβ subfamilies from pleural fluids of tuberculous patients (as compared to PBMC), but with no preferential expansion of Vβ8+ T cells, were recorded (16). In our study, in agreement with the results of the latter report, only a few subjects (2 of 12) displayed expansion of Vβ8+ T cells upon in vitro stimulation with M. tuberculosis antigens.
In the present report, we have also demonstrated that different kinds of mycobacterial antigen preparations differ in their abilities to trigger expansions of Vα2.3+ T cells. In particular, UV-killed bacteria were less efficient than live M. tuberculosis or its soluble extract (SN1) in driving Vα2.3+ T-cell expansions in the DR17(3), DQ2+ blood donors tested. Differences in the load of antigens (e.g., hsps) produced during the growth of bacteria in an intracellular environment (live bacteria) and during the heat treatment used to prepare the soluble extract might be responsible for the increased ability of live bacilli or the soluble extract to trigger expansions of the Vα2.3+ T cells. Another possible explanation of the less efficient stimulation of the Vα2.3+ subset by UV-killed bacteria in comparison to live bacteria or SN1 could be the involvement of antigens that are actively secreted and/or produced by live bacteria and therefore are less abundant in killed bacteria or in an extract. Indeed, we found that in most cases, live M. tuberculosis was the best inducer of Vα2.3+ T-cell expansion in comparison to the other antigen preparations. If actively produced antigens are involved, one can hypothesize that they could be available, even if present at a low level, in the extract which is obtained by disruption of the bacteria but not in the UV-killed preparation, in which bacteria are supposed to be intact. hsps have been described as immunodominant mycobacterial antigens in mice and humans, and a number of peptides derived from M. tuberculosis hsp65, M. leprae hsp70, and M. leprae hsp18 have been reported to be particularly active in eliciting a Mycobacterium-specific T-cell response in HLA-DR17+ individuals (18). Interestingly, in our study, as revealed by FPLC separation experiments, fractions corresponding to similar molecular masses (60 to 70 kDa and 15 to 25 kDa) preferentially stimulated Vα2.3+ T-cell expansions. To determine whether any of the known mycobacterial hsps were responsible of the Vα2.3+ T-cell stimulation, three HLA-DR17(3)+, DQ2+ individuals were also tested with recombinant M. leprae 65-kDa, M. tuberculosis 70-kDa, M. tuberculosis 10-kDa, and M. bovis 65-kDa proteins, but none of them were found to respond with an oligoclonal expansion of the Vα2.3+ CD4+ T-cell subset. Experiments are in progress to identify the mycobacterial component(s) able to induce such an expansion.
Mycobacteria have been considered possible etiologic agents of many immunopathological diseases (4, 21, 37, 40). In particular, pulmonary sarcoidosis, a granulomatous disease with histological similarities to tuberculosis, has been suggested to be caused by mycobacteria (37). Mycobacterial DNA and/or Mycobacterium-like microorganisms have also been found in sarcoidosis patients (2, 29, 37). CD4+ T cells accumulate in the lungs of sarcoidosis patients; when these cells are analyzed following bronchoalveolar lavage, they show signs of being activated, and they have been suggested to be implicated in the pathogenesis of the disease (22). Moreover, it has been demonstrated that CD4+ T lymphocytes which accumulate in the lungs of sarcoidosis patients expressing the HLA DR17(3), DQ2 haplotype exhibit TCR Vα2.3+ T-cell expansions (19). Sequencing of cDNA coding for the Vα2.3 chain indicated oligoclonality with a preference for short CDR3 lengths (5 to 8 amino acids) (20). It has been suggested that such oligoclonal T-cell expansions are a result of antigen recognition in the lungs of HLA-DR17(3), DQ2+ sarcoidosis patients (20). Interestingly, in the present study, the same HLA-DR17(3), DQ2-restricted Vα2.3+ CD4+ oligoclonal T-cell expansions with CDR3 size similar to those described for cells found in the lungs of sarcoidosis patients was demonstrated upon in vitro stimulation with mycobacterial antigens, suggesting a possible link between M. tuberculosis and sarcoidosis. If the in vivo-expanded Vα2.3+ T cells in sarcoidosis patients prove to be responsive to the same mycobacterial antigen(s) that stimulates such cells in vitro, strong evidence of a mycobacterial involvement in sarcoidosis will be provided, opening the possibility of new therapeutic interventions.
ACKNOWLEDGMENTS
This work was supported by grants from EU BIOMED II Programme (contract BMH4-CT97-2671); Karolinska Institute; the Sigurd och Elsa Golje’s Foundation; the Swedish Heart-Lung Foundation; the National Tuberculosis Project (Istituto Superiore di Sanità, Ministero della Sanità), Rome, Italy (grant 96/D/T18); Progetti M.U.R.S.T. 40%, Rome; and the Swedish Medical Research Council.
We thank A. Eklund and O. Widström for PPD-negative-donor material, R. Andersson and G. Källenius for discussions, H. Gaines for the flow cytometry facility for infectious material, and S. Hoffner for biosafety level 3 laboratory facilities.
REFERENCES
- 1.Andersen P. Host responses and antigens involved in protective immunity to Mycobacterium tuberculosis. Scand J Immunol. 1997;45:115–131. doi: 10.1046/j.1365-3083.1997.d01-380.x. [DOI] [PubMed] [Google Scholar]
- 2.Ang S C, Moscovic E A. Cross-reactive and species specific Mycobacterium tuberculosis antigens in the immunoprofile of Schumann bodies: a major clue to the etiology of sarcoidosis. Histol Histopathol. 1996;11:125–134. [PubMed] [Google Scholar]
- 3.Batoni G, Esin S, Harris R A, Källenius G, Svenson S B, Andersson R, Campa M, Wigzell H. γδ+ and CD4+ αβ+ human T cell subset responses upon stimulation with various Mycobacterium tuberculosis soluble extracts. Clin Exp Immunol. 1998;112:52–62. doi: 10.1046/j.1365-2249.1998.00540.x. [DOI] [PMC free article] [PubMed] [Google Scholar]
- 4.Birnbaum G, Kotilinek L, Albrecht L. Spinal fluid lymphocytes from a subgroup of multiple sclerosis patients respond to mycobacterial antigens. Ann Neurol. 1993;34:18–24. doi: 10.1002/ana.410340106. [DOI] [PubMed] [Google Scholar]
- 5.Boesen H, Jensen B N, Wilcke T, Andersen P. Human T-cell responses to secreted antigen fractions of Mycobacterium tuberculosis. Infect Immun. 1995;63:1491–1497. doi: 10.1128/iai.63.4.1491-1497.1995. [DOI] [PMC free article] [PubMed] [Google Scholar]
- 6.Bothamley G H, Festenstein F, Newland A. Protective role for CD8 cells in tuberculosis. Lancet. 1992;339:315–316. doi: 10.1016/0140-6736(92)91397-q. [DOI] [PubMed] [Google Scholar]
- 7.Chatila T, Geha R S. Superantigens. Curr Opin Immunol. 1992;4:74–78. doi: 10.1016/0952-7915(92)90129-3. [DOI] [PubMed] [Google Scholar]
- 8.Chien Y, Davis M M. How alpha-beta T-cell receptors ’see’ peptide/MHC complexes. Immunol Today. 1993;14:597–609. doi: 10.1016/0167-5699(93)90199-u. [DOI] [PubMed] [Google Scholar]
- 9.Chomczynski P, Sacchi N. Single-step method of RNA isolation by acid guanidinium thiocyanate-phenol-chloroform extraction. Anal Biochem. 1987;162:156–159. doi: 10.1006/abio.1987.9999. [DOI] [PubMed] [Google Scholar]
- 10.Dannenberg A M., Jr Delayed-type hypersensitivity and cell-mediated immunity in the pathogenesis of tuberculosis. Immunol Today. 1991;12:228–233. doi: 10.1016/0167-5699(91)90035-R. [DOI] [PubMed] [Google Scholar]
- 11.Esin S, Batoni G, Källenius G, Gaines H, Campa M, Svenson S B, Andersson R, Wigzell H. Proliferation of distinct human T cell subsets in response to live, killed or soluble extracts of Mycobacterium tuberculosis and Mycobacterium avium. Clin Exp Immunol. 1996;104:419–425. doi: 10.1046/j.1365-2249.1996.d01-691.x. [DOI] [PMC free article] [PubMed] [Google Scholar]
- 12.Esin S, Gül A, Hodara V, Jeddi-Tehrani M, Dilsen N, Koniçe M, Andersson R, Wigzell H. Peripheral blood T cell expansions in patients with Behçet’s disease. Clin Exp Immunol. 1997;107:520–527. doi: 10.1046/j.1365-2249.1997.d01-947.x. [DOI] [PubMed] [Google Scholar]
- 13.Esin S, Hodara V, Jeddi-Tehrani M, Grunewald J, Svenberg T, Andersson R, Wigzell H. Enhanced prevalence of T cell receptor Vβ7 gene family expression in human intestine-associated T lymphocytes. Immunol Lett. 1996;51:149–155. doi: 10.1016/0165-2478(96)02544-8. [DOI] [PubMed] [Google Scholar]
- 14.Fields B A, Mariuzza R A. Structure and function of the T-cell receptor: insights from X-ray crystallography. Immunol Today. 1996;17:330–336. doi: 10.1016/0167-5699(96)10020-7. [DOI] [PubMed] [Google Scholar]
- 15.Flynn J L, Goldstein M M, Triebold K J, Koller B, Bloom B R. Major histocompatibility complex class I-restricted T cells are required for resistance to Mycobacterium tuberculosis infection. Proc Natl Acad Sci USA. 1992;89:12013–12017. doi: 10.1073/pnas.89.24.12013. [DOI] [PMC free article] [PubMed] [Google Scholar]
- 16.Gambón-Deza F, Pacheco-Carracedo M, Cerdá-Mota T, Montes-Santiago J. Lymphocyte populations during tuberculosis infection: Vβ repertoires. Infect Immun. 1995;63:1235–1240. doi: 10.1128/iai.63.4.1235-1240.1995. [DOI] [PMC free article] [PubMed] [Google Scholar]
- 17.Garcia K C, Degano M, Stanfield R L, Brunmark A, Jackson M R, Peterson P A, Teyton L, Wilson I A. An alpha-beta T cell receptor structure at 2.5 Å and its orientation in the TCR-MHC complex. Science. 1996;274:209–219. [PubMed] [Google Scholar]
- 18.Geluk A, Van Meijgaarden K E, Janson A A, Drijfhout J W, Meloen R H, De Vries R R, Ottenhoff T H. Functional analysis of DR17(DR3)-restricted mycobacterial T cell epitopes reveals DR17-binding motif and enables the design of allele-specific competitor peptides. J Immunol. 1992;149:2864–2871. [PubMed] [Google Scholar]
- 19.Grunewald J, Olerup O, Persson U, Öhrn M B, Wigzell H, Eklund A. T-cell receptor variable region gene usage by CD4+ and CD8+ T cells in bronchoalveolar lavage fluid and peripheral blood of sarcoidosis patients. Proc Natl Acad Sci USA. 1994;91:4965–4969. doi: 10.1073/pnas.91.11.4965. [DOI] [PMC free article] [PubMed] [Google Scholar]
- 20.Grunewald J, Hultman T, Bucht A, Eklund A, Wigzell H. Restricted usage of T cell receptor Vα/Jα gene segments with different nucleotide but identical amino acid sequences in HLA-DR3+ sarcoidosis patients. Mol Med. 1995;1:287–296. [PMC free article] [PubMed] [Google Scholar]
- 21.Holoshitz J, Klajman A, Druker I, Lapidot Z, Yaretzky A, Frenkel A, VanEden W, Cohen I. T lymphocytes of rheumatoid arthritis patients show augmented reactivity to a fraction of mycobacteria cross-reactive with cartilage. Lancet. 1986;ii:305–309. doi: 10.1016/s0140-6736(86)90003-6. [DOI] [PubMed] [Google Scholar]
- 22.Hunninghake G, Crystal R. Pulmonary sarcoidosis: a disorder mediated by excess helper T lymphocyte activity at sites of disease activity. N Engl J Med. 1981;305:429–434. doi: 10.1056/NEJM198108203050804. [DOI] [PubMed] [Google Scholar]
- 23.Jardetzky T S, Brown J H, Gorga J C, Stern L J, Urban R G, Chi Y I, Stauffacher C, Strominger J L, Wiley D C. Three-dimensional structure of a human class II histocompatibility molecule complexed with superantigen. Nature. 1994;368:711–718. doi: 10.1038/368711a0. [DOI] [PubMed] [Google Scholar]
- 24.Kaufmann S H. γδ and other unconventional T lymphocytes: what do they see and what do they do? Proc Natl Acad Sci USA. 1996;93:2272–2279. doi: 10.1073/pnas.93.6.2272. [DOI] [PMC free article] [PubMed] [Google Scholar]
- 25.Kaufmann S H. Immunity to intracellular bacteria. Annu Rev Immunol. 1993;11:129–163. doi: 10.1146/annurev.iy.11.040193.001021. [DOI] [PubMed] [Google Scholar]
- 26.Kaufmann S H E. Immunity to intracellular microbial pathogens. Immunol Today. 1995;16:338–342. doi: 10.1016/0167-5699(95)80151-0. [DOI] [PubMed] [Google Scholar]
- 27.Khomenko A G, Litvinov V I, Chukanova V P, Pospelov L E. Tuberculosis in patients with various HLA phenotypes. Tubercle. 1990;71:187–192. doi: 10.1016/0041-3879(90)90074-i. [DOI] [PubMed] [Google Scholar]
- 28.Kimura A, Sasazuki T. Eleventh International Histocompatibility Workshop reference protocol for the HLA DNA-typing technique. In: Tsuji K, Aizawa M, Sasazuki T, editors. HLA 1991. Oxford, United Kingdom: Oxford University Press; 1992. pp. 397–419. [Google Scholar]
- 29.Mitchell I C, Turk J L, Mitchell D N. Detection of mycobacterial rRNA in sarcoidosis with liquid-phase hybridization. Lancet. 1992;339:1012–1015. doi: 10.1016/0140-6736(92)90536-c. [DOI] [PubMed] [Google Scholar]
- 30.Modlin R L, Pirmez C, Hofman F M, Torigian V, Uyemura K, Rea T H, Bloom B R, Brenner M B. Lymphocytes bearing antigen-specific gamma delta T-cell receptors accumulate in human infectious disease lesions. Nature. 1989;339:544–548. doi: 10.1038/339544a0. [DOI] [PubMed] [Google Scholar]
- 31.Ohmen J D, Barnes P F, Grisso C L, Bloom B R, Modlin R L. Evidence for a superantigen in human tuberculosis. Immunity. 1994;1:35–43. doi: 10.1016/1074-7613(94)90007-8. [DOI] [PubMed] [Google Scholar]
- 32.Olerup O, Zetterquist H. HLA-DR typing by PCR amplification with sequence-specific primers (PCR-SSP) in 2 hours: an alternative to serological DR typing in clinical practice including donor-recipient matching in cadaveric transplantation. Tissue Antigens. 1992;39:225–235. doi: 10.1111/j.1399-0039.1992.tb01940.x. [DOI] [PubMed] [Google Scholar]
- 33.Olerup O, Aldener A, Fogdell A. HLA-DQB1 and -DQA1 typing by PCR amplification with sequence-specific primers (PCR-SSP) in 2 hours. Tissue Antigens. 1993;41:119–134. doi: 10.1111/j.1399-0039.1993.tb01991.x. [DOI] [PubMed] [Google Scholar]
- 34.Orme I M, Andersen P, Boom W H. T cell response to Mycobacterium tuberculosis. J Infect Dis. 1993;167:1481–1497. doi: 10.1093/infdis/167.6.1481. [DOI] [PubMed] [Google Scholar]
- 35.Pannetier C, Cochet M, Darche S, Casrouge A, Zöller M, Kourilsky P. The sizes of the CDR3 hypervariable regions of the murine T-cell receptor beta chains vary as a function of the recombined germ-line segments. Proc Natl Acad Sci USA. 1993;90:4319–4323. doi: 10.1073/pnas.90.9.4319. [DOI] [PMC free article] [PubMed] [Google Scholar]
- 36.Rock E P, Sibbald P R, Davis M M, Chien Y. CDR3 length in antigen-specific immune receptors. J Exp Med. 1994;179:323–328. doi: 10.1084/jem.179.1.323. [DOI] [PMC free article] [PubMed] [Google Scholar]
- 37.Saboor S A, Johnson N M, McFadden J. Detection of mycobacterial DNA in sarcoidosis and tuberculosis with polymerase chain reaction. Lancet. 1992;339:1012–1015. doi: 10.1016/0140-6736(92)90535-b. [DOI] [PubMed] [Google Scholar]
- 38.Sambrook J, Fritsch E F, Maniatis T. Molecular cloning: a laboratory manual. Cold Spring Harbor, N.Y: Cold Spring Harbor Laboratory Press; 1989. [Google Scholar]
- 39.Schoel B, Gulle H, Kaufmann S H. Heterogeneity of the repertoire of T cells of tuberculosis patients and healthy contacts to Mycobacterium tuberculosis antigens separated by high-resolution techniques. Infect Immun. 1992;60:1717–1720. doi: 10.1128/iai.60.4.1717-1720.1992. [DOI] [PMC free article] [PubMed] [Google Scholar]
- 40.Wall S, Kunze Z M, Saboor S, Soufleri I, Seechurn P, Chiodini R, McFadden J J. Identification of spheroplast-like agents isolated from tissues of patients with Crohn’s disease and control tissues by polymerase chain reaction. J Clin Microbiol. 1993;31:1241–1245. doi: 10.1128/jcm.31.5.1241-1245.1993. [DOI] [PMC free article] [PubMed] [Google Scholar]


