

Abstract
Motivation
Reference-based phasing and genotype imputation algorithms have been developed with sublinear theoretical runtime behaviour, but runtimes are still high in practice when large genome-wide reference datasets are used.
Results
We developed EagleImp, a software based on the methods used in the existing tools Eagle2 and PBWT, which allows accurate and accelerated phasing and imputation in a single tool by algorithmic and technical improvements and new features. We compared accuracy and runtime of EagleImp with Eagle2, PBWT and prominent imputation servers using whole-genome sequencing data from the 1000 Genomes Project, the Haplotype Reference Consortium and simulated data with 1 million reference genomes. EagleImp was 2–30 times faster (depending on the single or multiprocessor configuration selected and the size of the reference panel) than Eagle2 combined with PBWT, with the same or better phasing and imputation quality in all tested scenarios. For common variants investigated in typical genome-wide association studies, EagleImp provided same or higher imputation accuracy than the Sanger Imputation Service, Michigan Imputation Server and the newly developed TOPMed Imputation Server, despite larger (not publicly available) reference panels. Additional features include automated chromosome splitting and memory management at runtime to avoid job aborts, fast reading and writing of large files and various user-configurable algorithm and output options. Due to the technical optimizations, EagleImp can perform fast and accurate reference-based phasing and imputation and is ready for future large reference panels in the order of 1 million genomes.
Availability and implementation
EagleImp is implemented in C++ and freely available for download at https://github.com/ikmb/eagleimp.
Supplementary information
Supplementary data are available at Bioinformatics online.
1 Introduction
Genotype phasing and imputation have become standard procedures to improve statistical power in genome-wide association studies (GWAS) by increasing genome-wide coverage of variants and enabling meta-analysis of individual GWAS studies. In general, the accuracy of phasing and imputation increases with the number of haplotypes from a reference panel of sequenced genomes (McCarthy et al., 2016). Due to the algorithmic complexity of the imputation process a larger reference panel implies an increase in runtime and memory demand, depending on the number of unique haplotypes in each genomic segment of the target samples (e.g. in the GWAS input dataset) and the total number of these segments in the reference panel. State-of-the-art reference-based phasing and imputation algorithms such as Eagle2 (Loh et al., 2016), PBWT (Durbin, 2014) and minimac4 (Das et al., 2016; Fuchsberger et al., 2014) have been efficiently developed with runtimes better than linear scaling over the size of the reference panel. For example, Das et al. (2016) showed that increasing the reference panel size from 1092 (1000 Genomes Project Phase 1, 27 million variants) to 33 000 individuals [Haplotype Reference Consortium (HRC), 40 million variants] (>40-fold increase in the number of reference genotypes) only increases the phasing and imputation runtime by a factor of 10 (5.3 h versus 51.3 h) to impute 100 GWAS samples in one single-threaded process. However, for a new reference panel with more than 1 million reference samples, this would still result in a runtime of weeks, combined with an extremely increasing system memory demand. The UK Biobank (UKB) has recently made whole-genome sequencing (WGS) data from 200 000 individuals available (Bycroft et al., 2018), and the newly established European ‘1+ Million Genomes’ Initiative (1+MG) project is underway, generating WGS data of over 1 million genomes (https://digital-strategy.ec.europa.eu/en/policies/1-million-genomes). The 1+MG project will lead to a further increase in the number of reference genotypes by more than >30-fold compared to the HRC panel benchmarked by Das et al. (2016). Currently, the best solution to perform phasing and imputation for large datasets is to perform parallel processing on large multi-core systems or high-performance computing (HPC) clusters with hundreds of CPU-cores, to distribute the computational load as much as possible. Therefore, algorithmic and technical improvements together with existing implementations are needed to ensure that phasing and imputation remain feasible for reference panels with more than 1 million samples.
2 Approach
Since early studies have shown that the accuracy of imputation increases significantly when the genotype data contains information on the haplotype phase of heterozygous variants (Browning, 2008), it is common practice to apply a haplotype phasing algorithm to a target input dataset prior to genotype imputation. Among others, the best known phasing tools are SHAPEIT2 (Delaneau et al., 2013), SHAPEIT4 (Delaneau et al., 2019) and Eagle2 (Loh et al., 2016), whereby the latter is currently used on all prominent imputation servers, such as the Sanger Imputation Service (SIS) (McCarthy et al., 2016) (https://imputation.sanger.ac.uk), Michigan Imputation Server (MIS) (Das et al., 2016) (https://imputationserver.sph.umich.edu) and the newly developed TOPMed Imputation Server (TOPMed) (Taliun et al., 2021) (https://imputation.biodatacatalyst.nhlbi.nih.gov). Prominent imputation tools are IMPUTE v2 (Howie et al., 2009), minimac4 (Das et al., 2016; Fuchsberger et al., 2014), Beagle 5.0 (Browning et al., 2018) and PBWT (Durbin, 2014), whereby the latter is used within the SIS.
To allow phasing and imputation for very large reference panels, while ensuring at least the same phasing and imputation accuracy, we developed EagleImp, a software tool for accelerated phasing and imputation. EagleImp introduces algorithmic, parameter and implementation improvements to the core methods of the established tools Eagle2 (Loh et al., 2016) (phasing) and PBWT (Durbin, 2014) (imputation) and merges them in a new single convenient application. With EagleImp, we were able to speed up the classical 2-step imputation process with Eagle2 and subsequent PBWT by more than a factor of ten for single chromosome analysis and (depending on the parallelization strategy) at least more than a factor of two for the entire human genome while maintaining or even improving phasing and imputation quality. For a simulated reference panel with 1 million samples, we achieved speedups of at least 6.82 and 30.6, respectively, with phasing and imputation of a GWAS dataset using EagleImp compared to the phasing-only process in Eagle2 (subsequent imputation of phasing results from Eagle2 using PBWT was not possible due PBWT’s high memory demand, which exceeded 256 GB of system memory).
EagleImp also provides new convenient features via simple command line parameters, such as a continuous progress report to a file, user pre-selection of per genotype imputation information (genotypes, allele dosage, genotype dosage and/or probabilities), phasing confidences and usage information of input variants in a separate file, variant IDs from the reference in imputation output, automated chromosome chunking (if main memory requirements are too high), lock file support (to enable two or more processes to share CPU resources), detection and handling of ref/alt swaps and/or strand flips, the ability to skip certain parts of the algorithm (e.g. pre-phasing, reverse phasing or entire phasing or imputation) and more. In addition, EagleImp supports imputation of chromosome X and Y with automatic partitioning by pseudo-autosomal regions (PAR).
3 Materials and methods
In developing EagleImp, we focused on combining and improving the core methods from Eagle2 and PBWT, since both tools are used by the established SIS web service and both use the same-named Position-based Burrows-Wheeler Transform (PBWT) data structure introduced by Durbin (2014), which we could target as a basis for acceleration. Its main advantages are the compact representation of binary data and the ability to quickly look up any binary sequence at any position in the data. The runtime complexity is linear to the length of the query sequence, independent of the size of the database. To create a PBWT, the algorithm determines permutations of the input sequences for each genomic site such that the subsequences ending at that site are sorted when read backwards. In our work, we propose further algorithmic and implementation improvements that allow a more efficient use of the PBWT data structure and thus increase the speed of phasing and imputation, while maintaining at least the same accuracy of phasing and imputation.
3.1 Improvements in EagleImp
For algorithmic and computational details of the original phasing in Eagle2 and imputation in PBWT, we refer to our Supplementary Material S1 and the original publications by Loh et al. (2016) and Durbin (2014). Full details of EagleImp improvements summarized below can be found in the Supplementary Material S2.
First, the following points summarize the EagleImp improvements to the data structure and further technical improvements: (i) we have developed a new .qref format for reference data, which significantly improves the reading time of the reference data (Supplementary Material S2.1). (ii) The PBWT data structure of the condensed reference (Supplementary Material S1.1) required for each target sample is now stored in a compressed format (Supplementary Material Fig. S1 in Supplementary Material S2.2), i.e. a binary format (in permuted form) corresponding to the calculated permutation arrays with an index similar to the FM-index used for a Burrows-Wheeler transformation (BWT) (Ferragina and Manzini, 2000) (Supplementary Material Listing S1), to ensure fast generation, compact storage and fast access to the reference data. (iii) Haplotype probabilities are no longer stored in a log-based format and a non-normalized scaling factor is used for the haplotype path probabilities (Supplementary Material S2.2), which only needs to be updated in case of a predictable loss of precision after several path extension operations. In this way, probability calculations remain precise, especially for heavily needed summations of floating point numbers without an otherwise required approximation (as in Eagle2) or back-transformation. (iv) The imputation of missing genotypes during phasing is obsolete since the subsequent imputation step imputes missing genotypes for shared variants (between target and reference) in the same way as variants that only occur in the reference. To implement this, we used a tree structure to calculate set-maximal matches (Supplementary Material S2.3). (v) Unlike the original PBWT tool, EagleImp uses multiple threads for genotype imputation, including the use of multiple temporary output files to reduce the input/output file bottleneck (Fig. 1 and Supplementary Material S2.3). (vi) We introduced a conversion of genotypes and haplotypes into a compact representation with integer registers and made extensive use of Boolean and bit masking operations as well as processor directives for bit operations (such as popcount for counting the set bits in a register) throughout the application which accelerated the computing time significantly (Supplementary Material Fig. S1 and Supplementary Material Listing S2).
Fig. 1.
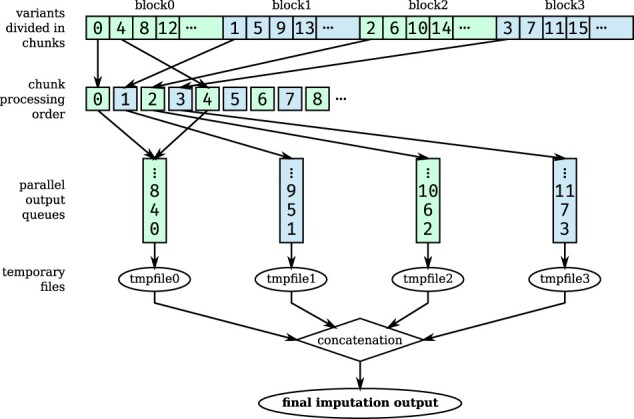
Newly implemented multi-processing scheme for imputation with EagleImp. After calculating set-maximal matches by intuitively distributing all target samples over multiple threads, variants to be imputed are evenly distributed over blocks with a separate output file assigned to each block. Each block is further divided into chunks that are processed in the indicated order by repetitively iterating over the blocks. The output files are written concurrently with one thread assigned to each output file. The processing of each chunk is multi-threaded over all samples using the remaining available system threads. Output files are concatenated at the end. The example shows a distribution over four blocks. The numbers in the chunks indicate the order in which the chunks are processed. See Supplementary Material S2.3.5 for details
Second, the following points summarize further algorithmic improvements in EagleImp: (i) due to the properties of the PBWT data structure, sequences that end with equal subsequences at a certain position are located next to each other in the PBWT and can thus be addressed as an interval. For the path extension step now only the interval boundaries have to be mapped to the next position to get the corresponding intervals for both possible extensions of the sequence (Fig. 2 and Supplementary Material Listing S2). Since the frequency of a subsequence is equal to the (normalized) size of the corresponding interval, the frequency calculation could thus be accelerated. (ii) We increased the default beam width parameter (number of possible paths) from 50 (fixed value in Eagle2) to 128 and the Δ parameter from 20 (fixed value in Eagle2) to 24 in favor of further increasing the phasing quality with minimal loss of computing time (Supplementary Material S1.1 and S2.2). (iii) We omitted the identical-by-descent (IBD) check performed by Eagle2 before the phasing process, since we found no loss in phasing quality without the IBD-check implemented. (iv) Pre-phasing is disabled by default as we encountered no improvement, but can explicitly be enabled with a user option in EagleImp. Likewise, reverse phasing can optionally be disabled.
Fig. 2.
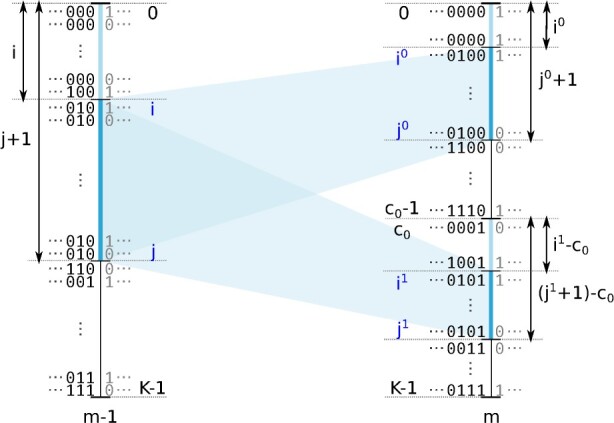
Improved path extension step in EagleImp. Illustration of mapping a PBWT interval from position m − 1 to m, resulting in two intervals and . The interval exemplary represents the sequences in the PBWT that end with 010 at position m − 1. By stepping forward to position m these sequences are extended either with 0 or 1 and thus are located in one of the mapped intervals or , respectively. It is easy to see, that and (as j is inclusive in the interval) which directly leads to the mapping Equations (6) and (7) in Supplementary Material S2.1
Third, we introduced new features and improvements in usability, among other things: (i) EagleImp allows imputation of haploid samples on X and Y chromosomes. Especially for chromosome X imputation, the problem is that diploid data in the PAR and haploid data in the non-PAR regions occur in the same chromosome X input file. Existing tools and imputation servers often crash with an error message if diploid and haploid data is mixed in a single input file. We provide a script together with the EagleImp source code that takes care of these regions by automatically splitting the input data with respect to PAR regions on chromosome X before imputation and then merging the imputation results back into one file afterwards. (ii) EagleImp allows reference and alternative alleles in the target to be swapped compared to the reference (with the option –allowRefAltSwap), e.g. an A/C variant is considered as C/A, and it allows strands to be flipped, e.g. an A/C variant is considered a T/G variant at the same chromosomal position (with the option –allowStrandFlip). (iii) EagleImp computes the imputation accuracy r2 [as described in Das et al. (2018) and used in minimac4] and provides the value together with the allele frequency, the minor allele frequency (MAF), the allele count and number as well as the reference panel allele frequency (if available) in the imputation output. An optional r2 filter can be applied to filter out variants with low imputation quality. (iv) Phasing confidences and information about how the target variants are used for imputation are provided in separate output files. (v) To save disc space for the output files, the user can decide which information is provided along with the imputed (hard called) genotypes, i.e. any combination of allele dosages (ADS tag), genotype dosages (DS tag), genotype probabilities (GP tag) or no information. Variant IDs in imputation output are provided exactly as they appear in the reference. (vi) EagleImp automatically activates chromosome chunking if the memory requirement is higher than the available main memory (provided as the runtime parameter –maxChunkMem) to eliminate the tedious process of trying out chunk sizes on different input and reference datasets for the user. (vii) For better workload distribution on multi-core computers, we provide a locking mechanism (via a lock file) such that low CPU-load tasks (e.g. reading input files) can run multiple processes at once, while high CPU-load tasks (e.g. the phasing and imputation processes) require multiple-exclusion of CPU resources. We provide an optional launch script that uses this feature for simultaneous processing of multiple input files. (viii) A progress indicator shows the progress in percentage (giving the user a hint how long the analysis will take). Optionally, constantly updated status and info files display summarized information about the running process.
3.2 Benchmark settings
To quantify phasing and imputation quality and runtime improvements of EagleImp compared to the original tools Eagle2 and PBWT, first, we conducted quality benchmarks with different parameters on three different sized reference panels (Table 1) and 12 target datasets (Table 2) including two real-world target GWAS datasets [from Ellinghaus et al. (2020)] to further compare imputation accuracy of EagleImp with the accuracy of current imputation servers (SIS, MIS and TOPMed). Then, we ran all runtime benchmarks using the HRC.EUR target dataset (Table 2) and the parameters used for the quality benchmarks. Full descriptions about reference and target datasets from Tables 1 and 2 and details about the setup for quality and runtime comparisons (in particular, the preparation of various multi-processor configurations) can be found in Supplementary Material S3.
Table 1.
Three different sized reference panels (A–C) were used for phasing and imputation benchmarks
| Reference | #Variants | #Samples | Ancestry | |
|---|---|---|---|---|
| (A) | HRC1.1 | 40.4 million | 27 165 | Mixeda |
| (B) | 1000G Phase 3 | 84.8 million | 2504 | Mixedb |
| (C) | simulated | 40.4 million | 1 000 000 | not applicable |
Predominantly of European descent.
Five superpopulations by continent: African (AFR), American (AMR), East Asian (EAS), European (EUR) and South Asian (SAS).
Table 2.
Twelve target datasets in total were used for phasing and imputation benchmarks to evaluate the runtime and imputation accuracy of EagleImp compared to the original tools Eagle2 and PBWT
| Target | #Variants | #Samples | Ancestry | |
|---|---|---|---|---|
| (1) | HRC.AFR | 619 872 | 661 | African |
| (2) | HRC.AMR | 619 872 | 347 | American |
| (3) | HRC.EAS | 619 872 | 504 | East Asian |
| (4) | HRC.EUR | 619 872 | 494 | European |
| (5) | HRC.SAS | 619 872 | 489 | South Asian |
| (6) | 1kG.AFR | 647 963 | 50 | African |
| (7) | 1kG.AMR | 647 963 | 50 | American |
| (8) | 1kG.EAS | 647 963 | 50 | East Asian |
| (9) | 1kG.EUR | 647 963 | 50 | European |
| (10) | 1kG.SAS | 647 963 | 50 | South Asian |
| (11) | COVID.Italy | 559 519 | 2113 | Italian |
| (12) | COVID.Spain | 549 696 | 1792 | Spanish |
Note: Target datasets (1–5) were sampled from the HRC1.1 panel (A) and target datasets (6–10) were sampled from the 1000G Phase 3 panel (B). For each of the target datasets (1–10), the selected samples were removed from the corresponding reference panels (A) and (B) in the benchmarks to avoid a biased result. The real-world datasets (11–12) [from Ellinghaus et al. (2020)] did not show an overlap of samples with any of the reference panels. All target datasets contain data from chromosomes 1 to X.
3.2.1 Choice of phasing and imputation parameters
The exact input parameters for the program call of EagleImp, Eagle2 and PBWT are listed in Supplementary Material S3.3. For performance comparison, we focused on testing different values of the parameter K (to select the K-best haplotypes from the reference for phasing). For example, we ran a benchmark on each HRC.* dataset (Table 2 (1–5)) with four different values of K for EagleImp as well as for Eagle2: 10 000 (default setting in Eagle2), 16 384, 32 768 and ‘max’ {where max means using all available haplotypes for phasing, which is 54 330 minus the number of removed haplotypes [e.g. 1322 for target (1), i.e. HRC.AFR, corresponding to two times the number of input samples] in the case of the reduced HRC1.1 panel (A)}. All runs used one phasing iteration (reflecting the default setting of Eagle2 if the number of target samples is less than half of the number of reference samples).
3.2.2 Benchmark system and program versions
The computing system we used for benchmarks consists of two Intel Xeon E5-2667 v4 CPUs, each with 8 cores running at 3.2 GHz, resulting in 32 available system threads. The system was equipped with 256 GB of DDR4 RAM and used a ZFS file system that combines six HDDs, each with a capacity of 2 TB in a raidz2 pool (leading to a total capacity of about 7 TB). The operating system was Ubuntu Linux 21.10 with kernel 5.13.0.
EagleImp is written in C++ and compiled with GCC v11.2.0. For Eagle2 and PBWT, we used the to date most recent builds on Github: Eagle2 v2.4.1 (https://github.com/poruloh/Eagle.git) and PBWT 3.1-v3.1-7-gf09141f (https://github.com/VertebrateResequencing/pbwt.git). Both tools were also compiled with GCC v11.2.0 together with the required HTSlib v1.12 and bcftools v1.12. For runtime benchmarks, we measured the wall-clock runtime by marking the start and end points of the benchmark with the command date and calculated the difference in runtime.
3.2.3 Metrics for phasing and imputation accuracy
We define a phase switch whenever the current phase at a (heterozygous) call site differs from the phase at the previous call site, and we counted a switch error whenever a phase switch occurs at a call site in the phased target but not in the same original target sample in the reference (with the correct phase known), or vice versa, when comparing phased haplotype pairs from the target to the original haplotype pairs in the reference. The switch error rate per sample is then computed by dividing the switch errors by the number of target variants. Please note that switch errors in the reference cannot be completely ruled out, since the publicly available reference data was phased by algorithms themselves.
Genotype errors are determined in a similar way by comparing the genotypes of an imputed haplotype pair with the corresponding (correctly known) genotypes in the reference panel. However, because hard called genotypes (usually determined by a fixed allele dosage threshold of 0.5) do not properly reflect uncertainty in genotype estimations and downstream analyses often require the allele dosages instead of hard called genotypes, we calculated genotype error rates using ‘soft called’ genotypes. Therefore, the number of genotype errors for a sample is determined by where x is the correct genotype from the reference and gpx the corresponding genotype probability calculated from the imputed allele dosages. Finally, dividing by the total number of variants gives the genotype error rate.
Another way to determine the imputation quality is the imputation accuracy r2, which is a valuable means of interpretation with regard to sample size and statistical power in a GWAS study and which can basically be considered independent of MAF (although the precision of the r2 estimate decreases with low MAF) (Das et al., 2018). r2 can be estimated for each imputed variant from posterior allele probabilities without knowing the true allele on each chromosome.
4 Results and discussion
4.1 Phasing and imputation quality
4.1.1 Switch and genotype error rates
For both EagleImp and Eagle2/PBWT, average (genome-wide) switch error rates and genotype error rates decreased (as expected) with higher values of K using the HRC1.1 reference panel for American (AMR) and European (EUR) superpopulation datasets (Fig. 3; Supplementary Material Tables S1 and S2; Supplementary Material Fig. S2). In contrast, the African (AFR) and East Asian (EAS) populations showed an increase of the error rates with a higher K value which we attribute to the predominantly European ancestry of the samples in the HRC1.1 panel (and thus the inclusion of more samples into the phasing set that do not match the target population). For the South Asian (SAS) dataset, the switch error rate decreased with a higher K but the genotype error rate stagnated. Given the predominantly European ancestry of the samples in the panel, our expectation that the European (EUR) dataset would perform best was also confirmed, followed by the American (AMR) dataset. Genotype error rates were more than eight times higher for the African (AFR) dataset than for to the European (EUR) dataset, while the switch error rates where about 4 times higher. In a direct comparison of EagleImp to Eagle2 combined with PBWT, we observed that EagleImp performed comparably or slightly better at K = 10 000 (depending on the superpopulation), with average change in switch error rates ranging from a minimal increase of 0.4% (EUR and SAS datasets) to a reduction of 4.9% (AFR dataset), and a reduction in the average genotype error rate from 0.3% (SAS dataset) to 2.6% (EUR dataset). At higher values of K, EagleImp differed more from Eagle2/PBWT as EagleImp runs performed better compared to the corresponding Eagle2/PBWT runs with the same value of K. The reduction in average switch error rates ranged from 0.1% (SAS dataset, K = 16 384) to 5.0% (AFR dataset, ) and the reduction in genotype error rates ranged from 0.5% (SAS dataset, K = 16 384) to 4.2% (EUR dataset, ). In our 1000G Phase 3 reference benchmark analysis (Fig. 4, Supplementary Material Tables S3 and S4), EagleImp performed better than Eagle2/PBWT for all five target datasets from the 1000G Phase 3 panel. Phase switch errors rates improved from 2.6% (AMR dataset) up to 7.1% (AFR dataset), and genotype error rates improved from 1.6% (SAS dataset) up to 1.8% (AFR, EAS and EUR datasets).
Fig. 3.

Phasing and imputation based on the HRC1.1 reference panel [mostly European ancestry; Table 1 (A)] performed better for EagleImp (green) compared to the original Eagle2/PBWT (blue) in all five test datasets HRC.AFR, HRC.AMR, HRC.EAS, HRC.EUR and HRC.SAS [Table 2 (1–5)]. The figure shows boxplots (hinges at the first and third quartiles, whiskers extending up to interquartile range, outliers plotted separately) for sample-wise switch error rates after phasing (top) and genotype error rates after imputation (bottom), shown for four different values of K: 10 000 (default setting in Eagle2), 16 384, 32 768 and ‘max’ (corresponding to maximum available haplotypes in reference panel). The mean values are shown as red dots. The parameter K selects the K-best haplotypes from the reference for phasing. As expected, phasing and imputation of input data of European ancestry using the HRC1.1 reference panel, which consist mostly of European samples, results in the best accuracy, which increases with an increasing K parameter. For populations that do not match the predominant population of the reference panel, an increasing K parameter may lead to less accurate results. A scaled version of this figure with a stretched Y axis is provided in Supplementary Material Figure S2 to better illustrate the difference between EagleImp and Eagle2/PBWT (A color version of this figure appears in the online version of this article.)
Fig. 4.

For the 1000G Phase 3 reference panel [five superpopulations; Table 1 (B)], phasing and imputation with EagleImp (green) outperformed the original Eagle2/PBWT (blue) in all five test datasets 1kG.AFR, 1kG.AMR, 1kG.EAS, 1kG.EUR and 1kG.SAS [Table 2 (6–10)]. The figure shows boxplots (hinges at the first and third quartiles, whiskers extending up to interquartile range, outliers plotted separately) for sample-wise switch error rates after phasing (left) and genotype error rates after imputation (right). The mean values are indicated as red dots. Parameter K was chosen to be maximum in all test runs (here, K = 5008), thus including the entire 1000G Phase 3 reference panel (A color version of this figure appears in the online version of this article.)
4.1.2 Imputation accuracy r2
For the real-world GWAS datasets COVID.Italy and COVID.Spain, we determined r2 values stratified by MAF (including all variants above this threshold) using the four different K parameters from above (Supplementary Material Figs S3 and S4). The COVID.Spain dataset showed a generally slightly better imputation performance than the COVID.Italy dataset in all runs, possibly due to a more similar genetic background compared to the HRC1.1 reference panel. Already for K = 10 000 (Supplementary Material Figs S3a and S4a), phasing and imputation with EagleImp consistently produced higher r2 values than the Eagle2/PBWT combination across the entire MAF spectrum, and also higher r2 values than the SIS, despite its larger (not freely available) HRC1.1 reference panel as compared to our HRC1.1 benchmark panel. With K = 10 000 and a MAF >0.002 (and especially at higher MAF), EagleImp also showed a quality advantage in contrast to the MIS, which we attribute to our algorithmic changes. Below a MAF of 0.002, the MIS still seems to show its higher imputation quality due to the larger HRC1.1 reference panel. Especially, in this low frequency range, TOPMed imputation (as a reference model) shows that a much larger reference panel plays a another key role in increasing imputation accuracy for rare variants, in addition to algorithmic improvements. Interestingly, for K = 10 000 and common variants such as in GWAS studies, EagleImp was shown to achieve even higher quality than TOPMed (here for MAF >0.03 for COVID.Spain and >0.006 for COVID.Italy), which is probably due to the algorithmic improvements of EagleImp, although EagleImp’s reference panel is more than three times smaller than that of TOPMed.
For higher K parameters, the graphs for EagleImp and Eagle2/PBWT showed (as expected) better r2 values but the distance between both tools remained the same (Supplementary Material Figs S3b–d and S4b–d). Figure 5 depicts the average genome-wide r2 values for the COVID.Italy and COVID.Spain datasets as a function of different MAF thresholds (on logarithmic scale), for Eagle2 and EagleImp with (which is effectively K = 54 330 as we used the public HRC1.1 panel). Here, EagleImp achieved at least equivalent or better results compared to the MIS across the entire MAF spectrum and showed same quality or a quality gain compared to TOPMed for MAF >0.01 (COVID.Spain) and 0.004 (COVID.Italy). Please note that we did not apply any r2-filter and that the TOPMed results contain more than 186 million variants (in comparison to 40 million from the HRC1.1 panel). Also note, that because MIS and TOPMed do not provide reference panel MAFs, the study data set MAFs are presented here with a MAF cut-off of 0.0005 to ensure a sufficiently high estimate of the MAF of the imputed variants for the input study datasets. However, the same behaviour is visible, although not as clearly, in the visualizations using the reference panel MAF (RefPanelMAF) (Supplementary Material Figs S5 and S6—reference panelMAFs for the MIS were taken from the SIS (due to unavailability from MIS), and the TOPMed results could not be shown due to unavailability of reference panel MAFs from TOPMed).
Fig. 5.

Imputation accuracy r2 was higher for EagleImp [green; K = 54 330 (max)] compared to Eagle2/PBWT [blue; K = 54 330 (max)] for two real-world GWAS datasets (a) COVID.Italy and (b) COVID.Spain [Table 2 (11–12)], with further comparison to imputation r2 from imputation servers SIS (purple), MIS (orange) and TOPMed (grey). EagleImp showed a quality gain compared to TOPMed for minor allele frequency (MAF) >0.004 (COVID. Italy) and 0.01 (COVID.Spain) and achieved at least equivalent results compared to MIS across the entire MAF spectrum, although MIS/SIS and TOPMed use their own reference panels, which are ∼1.2 times (32 470 samples) and 3.5 times (97 256 samples) larger than the publicly available HRC1.1 panel [27 165 samples; Table 1 (A)] used for EagleImp and Eagle2/PBWT. Note that the TOPMed reference panel contains 186 million variants in contrast to the 40 million variants of the HRC1.1 panel, and we did not apply an r2-filter (A color version of this figure appears in the online version of this article.)
4.2 Phasing and imputation runtime
For the sake of simplicity, we ran all runtime benchmarks using the HRC.EUR target dataset and the parameters used for the HRC1.1 reference benchmarks above, but with different multi-processing configurations with up to 32 concurrent system threads for EagleImp and Eagle2/PBWT. Details of the various multiprocessor configurations tested can be found in Supplementary Material S3.6. In addition, we examined runtimes of individuals chromosomes processed with all 32 system threads (referred to as 1x32 runs) (Supplementary Material S3.7) and single-thread runtimes with multi-processing disabled (Supplementary Material S3.8), since multi-processing strategies can behave differently on different computing systems. We also measured the runtimes of our real-world GWAS datasets COVID.Italy and COVID.Spain which can be found in Supplementary Material S3.9. Note, that the runtime benchmarks do not include the preparation of the reference files, which is required for PBWT and is optional for EagleImp. (PBWT requires a .pbwt file for each reference file; for EagleImp we used our newly developed .qref format instead of .vcf.gz or .bcf.) We present the runtimes for converting the reference panel separately in Supplementary Material S3.10.
4.2.1 Multi-processing runtimes
We observed that for any value of K, the Eagle2.8x4 configuration performed best for the Eagle2/PBWT runs and the EagleImp.2x4x8 configuration performed best for EagleImp (Supplementary Material Table S5), which is why we only compared these two configurations in the following.
For K = 10 000 (Fig. 6a), Eagle2.1x32 took 1 h and 46 min: The Eagle2.8x4 configuration accelerated this by a factor of 2.30 to 46 min. In contrast, the EagleImp.1x32 configuration required 40 min, which we could speed up by a factor of 1.85–22 min in the EagleImp.2x4x8 configuration. This corresponds to a speedup factor of 2.66 when comparing the 1x32 configurations of Eagle2/PBWT and EagleImp or a factor of 2.14 when comparing the fastest multi-processing configurations of the two tools. The total runtime increased with higher values of K (Fig. 6b–d), but the speedup factors between both tools only varied slightly. For , the Eagle2/PBWT runtime was 2 h and 27 min for the 1x32 configuration and 1 h and 25 min for 8x4. EagleImp analysed the same data in 54 min (1x32) and 35 min (2x4x8), resulting in speedup factors of 2.71 and 2.41, respectively.
Fig. 6.

Faster runtimes of EagleImp compared to Eagle2/PBWT (with at least the same accuracy, Fig. 3), demonstrated for the processing of 494 European target samples using the HRC1.1 reference panel [Table 1(A)] and different K parameters (K = 54 330 denotes the maximum value including all haplotypes from the HRC1.1 panel). The naive multi-processor configuration (1x32 with 32 phasing threads and each chromosome processed sequentially) and the best individual multi-processor configuration (i.e. fastest individual configuration determined from six different runs of Eagle2/PBWT and eight different runs of EagleImp, see Supplementary Material Table S5) were compared. The numbers in brackets give the acceleration factor of EagleImp compared to the corresponding Eagle2/PBWT run
When comparing runtimes for individual chromosomes, we additionally measured runtimes for phasing-only, imputation-only and combined runs. For the phasing-only runs, we observed that EagleImp is between 2.93 and 4.81 times faster than Eagle2 for all chromosomes and different values of K (Supplementary Material Table S6). The imputation-only runs of EagleImp with 32 threads when compared to PBWT showed the advantages of the multi-threading capability of EagleImp (which PBWT does not offer), with a speedup between 7.77 and 12.94 (Supplementary Material Table S7). The combination of phasing and imputation offers the advantage for EagleImp that the reference panel does not have to be read twice (as is the case with Eagle2 and PBWT), resulting in a combined speedup between 5.82 and 10.81 for single chromosomes (Supplementary Material Table S8).
4.2.2 Single-thread runtimes
We measured the runtimes of the HRC.EUR dataset from above with the four values of K exemplary for chromosome 2 and chromosome 21 (largest and smallest number of input variants) with only one thread for Eagle2 and EagleImp (by using the corresponding –numThreads parameters for both tools). We found that EagleImp is faster than Eagle2/PBWT with measured speedups between 1.59 and 2.48 for phasing only and between 1.40 and 1.51 for imputation only, and a combined speedup between 1.58 and 2.25 (Supplementary Material Tables S9 and S10).
4.2.3 Phasing and imputation using 1 million reference genomes
To our knowledge, the TOPMed imputation server uses the largest reference panel currently available for phasing and imputation, with 97 256 reference samples (TOPMed r2) (Taliun et al., 2021). To explore EagleImp’s capabilities in handling a future reference panel with way more samples, we created a simulated panel [Table 1 (C); Supplementary Material S3.1] containing 1 million samples and 40.4 million variants (taken from the HRC1.1 panel) by generating random haplotypes for each variant while maintaining the reference panel allele frequency of the original HRC1.1 panel. We measured EagleImp’s and Eagle2’s runtimes for the real-world GWAS dataset COVID.Italy (2113 samples) using K = 10 000 and K = 2 000 000 (maximum K for the simulated panel) and the naive (Eagle2.1x32, EagleImp.1x32) and respectively fastest multi-processor configurations (Eagle2.8x4, EagleImp.2x4x8) from the previous runtime benchmark (Supplementary Material S3.11).
EagleImp took about 8 h and 25 min for K = 10 000 in 2x4x8 configuration for phasing and imputation, while, in contrast, the original Eagle2 took more than 2 days and 9 h in 8x4 configuration respectively for phasing only. Thus, EagleImp outperformed Eagle2 with a speedup factor of at least 6.82 (K = 10 000, Fig. 7). For the naive configuration (1x32) Eagle2 took even more than 17 days for the analysis, which is a speedup of 30.6 for EagleImp that took only less than 14 h. Note that when using the smaller HRC1.1 reference panel for the same benchmark Eagle2 took 1 h and 26 min for phasing alone while EagleImp took only 40 min for phasing and imputation together, which is a speedup of 2.16 already (see Supplementary Material Tables S5 and S6). This highlights that runtime benefits of EagleImp grow with an increasing size of the reference panel. The runs with , i.e. K = 2 000 000 in this case, resulted in a runtime of less than 4 days and 19 h for EagleImp in 2x4x8 configuration, while Eagle2 could not complete the runs due to insufficient memory and missing automatic chunking ability (requirement of more than 256 GB of RAM) on our benchmark system in both 8x4 and 1x32 configurations. Note that we needed to compare EagleImp runs including phasing and imputation to Eagle2 runs with phasing only as we were not able to run a PBWT imputation afterwards. PBWT requires the reference panel converted to a .pbwt format which failed due to insufficient main memory again.
Fig. 7.

Phasing and imputation runtimes for the simulated reference panel [Table 1 (C)] containing 1 million samples (2 000 000 haplotypes) and the real-world COVID.Italy dataset [2113 samples; Table 2 (11)]. The numbers in brackets give the acceleration factor of EagleImp (phasing + imputation) compared to the corresponding Eagle2 (phasing only) run. Note that we could not perform imputation with PBWT using this panel due to insufficient main memory to generate the required .pbwt files, so only Eagle2 phasing times are shown. For Eagle2 could not complete the analysis in any configuration due to insufficient main memory again (marked with ‘failed’), hence, no runtime or speedup could be measured in this configuration
5 Conclusion
We have introduced EagleImp, a fast and accurate tool for phasing and imputation. Due to technical improvements and changes in the data structure, EagleImp was 2 to 30 times faster (depending on the reference panel size and multi-processor configuration) than Eagle2/PBWT, with same or better phasing and imputation quality in all tested scenarios. For common variants investigated in typical GWAS studies, EagleImp also yielded equal or higher imputation accuracy than the imputation servers MIS, SIS and TOPMed that use larger (not freely available) reference panels, which we attribute to our algorithmic improvements. Because of the technical optimization and the improvement of the stability of the software, EagleImp can perform phasing and imputation for upcoming very large reference panels with more than 1 million genomes.
For phasing, we accelerated the search for the K best haplotypes, the generation of the condensed reference and the entire phasing process by using an alternative haplotype encoding, Boolean comparison operations and processor directives for bit operations. We improved the accuracy of the phase probability calculation by using a scaled floating point representation instead of a logarithm-based representation, and we improved the frequency lookups in the PBWT data structure by introducing our interval mapping procedure and omitting duplicate calculations of frequencies. By adding a multi-threading scheme that includes concurrent writing of multiple temporary files during imputation, and by using a tree-structure and the same interval mapping technique as for the phasing part to search for set-maximal matches, we were able to speed up the imputation process considerably compared to PBWT. Furthermore, the correct treatment of missing genotypes from the input dataset became possible with the tree-structure.
An additional reduction in computing time was made possible by the introduction of the Qref -format (producible from standard .vcf or .bcf files) for fast reference loading, by combining phasing and imputation in a single tool, and by a helper script that introduces multi-processing with several worker processes and a balanced distribution of a complete genome-wide input dataset. We further enhanced the usability of phasing and imputation by adding several convenience features, such as chromosome X and Y handling, imputation r2 and MAF calculation for output files, user selection of desired imputation information (allele dosages, genotype dosages, genotype probabilities), automated optimization of chromosome partitioning (chunking) and memory management during runtime, preserving variant IDs from reference, r2 filtering and other things.
Unfortunately, we were not able to sufficiently investigate the quality of the imputation of rare variants, as we did not have the larger reference panels of the MIS, SIS and the TOPMed imputation servers at our disposal. We noticed that in the imputation of common variants, the MIS (uses minimac4 for imputation) fell behind the SIS (uses PBWT for imputation) in terms of quality, despite the same larger HRC reference panel, but the MIS performed better than the SIS in the imputation of rare variants. We have not investigated this further. However, since new, even larger reference panels will be available soon, this difference should not matter too much. We already designed EagleImp to use more than 1 million reference genomes (>2 million haplotypes) for reference-based phasing and imputation. In this case, EagleImp will be able to show its full strength in terms of runtime and quality compared to other tools, although again an optimization of the K parameter (selection of the K best reference genomes where a higher K increases the runtime but produces better results) will be required. Imputation in combination with new methods such as study-specific pre-selection of reference samples using deep learning imputation reconstruction methods for reference panels (Shi et al., 2021) could provide a higher accuracy for rare variants.
As an improvement, in the future, we plan to replace the slow HTSlib with our own library in order to speed up the writing process since this is still a bottleneck in EagleImp. A reduction of the runtime by using field-programmable gate arrays (FPGAs) is another possibility to reduce the runtime even further (Wienbrandt et al., 2020).
Since the existing imputation servers do not all offer the same reference panels (1000 Genomes, HRC, TOPMed) for different imputation scenarios (e.g. imputation of individuals of non-European descent) and also the topic of the European Union (EU) General Data Protection Regulation (GDPR) is not sufficiently addressed in our view, it would also be desirable to set up mirror servers in different countries and to provide them with the same algorithms and reference panels to facilitate comparability of imputation results as well as to allow optimization of phasing and imputation for different GWAS input data sets, for example, by appropriate choices of input parameters. For example, the K parameter basically increases the accuracy in case of high similarity between input and reference, but may also decrease the accuracy in case of low similarity as we observed e.g. when imputing the HRC.AFR dataset of African origin with the HRC1.1 reference of predominantly European origin. Thus, we plan to offer a free GDPR-compliant web service for EagleImp with adjustable input parameters (e.g. the K parameter), so that the advantages of EagleImp can also be used by the community even without own hardware resources.
Availability of source code and requirements
Project name: EagleImp
Project home page: https://github.com/ikmb/eagleimp
Operating system: Linux
Programming language: C++ (bash, awk)
Other requirements: HTSlib, Zlib, BOOST, TBB, Cmake
License: GNU GPL v3.0
Ethical approval
GWAS data from the COVID-19 GWAS Group: All participants provided written informed consent, and the study was approved by the ethics boards of the participating institutions in agreement with the Declaration of Helsinki principles.
Supplementary Material
Acknowledgements
The authors would like to thank the COVID-19 GWAS Group for the use of the COVID-19 GWAS data for the benchmark.
Funding
The project received fundings from the DFG (Deutsche Forschungsgemeinschaft) [EL 831/3-1, PI: David Ellinghaus and WI 4908/1-1, PI: Lars Wienbrandt]. This work was supported by the German Federal Ministry of Education and Research (BMBF) within the framework of iTREAT [01ZX1902A]. The study received infrastructure support from the DFG Cluster of Excellence 2167 ‘Precision Medicine in Chronic Inflammation (PMI)’ (DFG Grant: ‘EXC2167’) and the DFG research unit ‘miTarget’ (project number 426660215).
Conflict of Interest: none declared.
Contributor Information
Lars Wienbrandt, Institute of Clinical Molecular Biology, Kiel University, 24105 Kiel, Germany.
David Ellinghaus, Institute of Clinical Molecular Biology, Kiel University, 24105 Kiel, Germany; Novo Nordisk Foundation Center for Protein Research, Disease Systems Biology, Faculty of Health and Medical Sciences, University of Copenhagen, 2200 Copenhagen, Denmark.
Data Availability
All quality and runtime measures from our benchmarks are listed in the Supplementary Material. The 1000 Genomes Phase 3 reference panel can be downloaded at ftp://ftp.1000genomes.ebi.ac.uk/vol1/ftp/release/20130502/. Data access to the EGAD00001002729 dataset for the HRC1.1 panel is restricted and was granted under request ID 11699. The benchmark datasets HRC.EUR, HRC.v1–5, 1kG.EUR.v1–5 and 1kG.v1–5 are subsets of the previously mentioned reference panels. The COVID-19 GWAS datasets COVID.Italy and COVID.Spain used in this article cannot be shared publicly due to the privacy of individuals that participated in the study. For further information on these datasets we kindly refer to Ellinghaus et al. (2020).
References
- Browning B.L. et al. (2018) A One-Penny imputed genome from Next-Generation reference panels. Am. J. Hum. Genet., 103, 338–348. [DOI] [PMC free article] [PubMed] [Google Scholar]
- Browning S.R. (2008) Missing data imputation and haplotype phase inference for genome-wide association studies. Hum. Genet., 124, 439–450. [DOI] [PMC free article] [PubMed] [Google Scholar]
- Bycroft C. et al. (2018) The UK biobank resource with deep phenotyping and genomic data. Nature, 562, 203–209. [DOI] [PMC free article] [PubMed] [Google Scholar]
- Das S. et al. (2016) Next-generation genotype imputation service and methods. Nat. Genet., 48, 1284–1287. [DOI] [PMC free article] [PubMed] [Google Scholar]
- Das S. et al. (2018) Genotype imputation from large reference panels. Annu. Rev. Genomics Hum. Genet., 19, 73–96. [DOI] [PubMed] [Google Scholar]
- Delaneau O. et al. (2013) Improved whole chromosome phasing for disease and population genetic studies. Nat. Methods, 10, 5–6. [DOI] [PubMed] [Google Scholar]
- Delaneau O. et al. (2019) Accurate, scalable and integrative haplotype estimation. Nat. Commun., 10, 5436. [DOI] [PMC free article] [PubMed] [Google Scholar]
- Durbin R. (2014) Efficient haplotype matching and storage using the positional Burrows-Wheeler transform (PBWT). Bioinformatics, 30, 1266–1272. [DOI] [PMC free article] [PubMed] [Google Scholar]
- Ellinghaus D. et al. (2020) Genomewide association study of severe COVID-19 with respiratory failure. N. Engl. J. Med., 383, 1522–1534. [DOI] [PMC free article] [PubMed] [Google Scholar]
- Ferragina P., Manzini G. (2000) Opportunistic data structures with applications. In: Proceedings 41st Annual Symposium on Foundations of Computer Science, pp. 390–398.
- Fuchsberger C. et al. (2014) minimac2: faster genotype imputation. Bioinformatics, 31, 782–784. [DOI] [PMC free article] [PubMed] [Google Scholar]
- Howie B.N. et al. (2009) A flexible and accurate genotype imputation method for the next generation of genome-wide association studies. PLoS Genet., 5, e1000529. [DOI] [PMC free article] [PubMed] [Google Scholar]
- Loh P.-R. et al. (2016) Reference-based phasing using the haplotype reference consortium panel. Nat. Genet., 48, 1443–1448. [DOI] [PMC free article] [PubMed] [Google Scholar]
- McCarthy S. et al. ; Haplotype Reference Consortium. (2016) A reference panel of 64,976 haplotypes for genotype imputation. Nat. Genet., 48, 1279–1283. [DOI] [PMC free article] [PubMed] [Google Scholar]
- Shi S. et al. (2021) RefRGim: an intelligent reference panel reconstruction method for genotype imputation with convolutional neural networks. Brief Bioinform, 22, bbab326. [DOI] [PMC free article] [PubMed] [Google Scholar]
- Taliun D. et al. ; NHLBI Trans-Omics for Precision Medicine (TOPMed) Consortium. (2021) Sequencing of 53,831 diverse genomes from the NHLBI TOPMed program. Nature, 590, 290–299. [DOI] [PMC free article] [PubMed] [Google Scholar]
- Wienbrandt L. et al. et al. (2020) Reference-Based Haplotype Phasing with FPGAs. In: Krzhizhanovskaya V.V. (ed.) Computational Science—ICCS 2020. Springer International Publishing, Cham, pp. 481–495. [Google Scholar]
Associated Data
This section collects any data citations, data availability statements, or supplementary materials included in this article.
Supplementary Materials
Data Availability Statement
All quality and runtime measures from our benchmarks are listed in the Supplementary Material. The 1000 Genomes Phase 3 reference panel can be downloaded at ftp://ftp.1000genomes.ebi.ac.uk/vol1/ftp/release/20130502/. Data access to the EGAD00001002729 dataset for the HRC1.1 panel is restricted and was granted under request ID 11699. The benchmark datasets HRC.EUR, HRC.v1–5, 1kG.EUR.v1–5 and 1kG.v1–5 are subsets of the previously mentioned reference panels. The COVID-19 GWAS datasets COVID.Italy and COVID.Spain used in this article cannot be shared publicly due to the privacy of individuals that participated in the study. For further information on these datasets we kindly refer to Ellinghaus et al. (2020).