Abstract
Average aging is associated with a gradual decline of memory capacity. SuperAgers are humans ≥80 years of age who show exceptional episodic memory at least as good as individuals 20–30 years their junior. This study investigated whether neuronal integrity in the entorhinal cortex (ERC), an area critical for memory and selectively vulnerable to neurofibrillary degeneration, differentiated SuperAgers from cognitively healthy younger individuals, cognitively average peers (“Normal Elderly”), and individuals with amnestic mild cognitive impairment. Postmortem sections of the ERC were stained with cresyl violet to visualize neurons and immunostained with mouse monoclonal antibody PHF-1 to visualize neurofibrillary tangles. The cross-sectional area (i.e., size) of layer II and layer III/V ERC neurons were quantified. Two-thirds of total participants were female. Unbiased stereology was used to quantitate tangles in a subgroup of SuperAgers and Normal Elderly. Linear mixed-effect models were used to determine differences across groups. Quantitative measurements found that the soma size of layer II ERC neurons in postmortem brain specimens were significantly larger in SuperAgers compared with all groups (p < 0.05)—including younger individuals 20–30 years their junior (p < 0.005). SuperAgers had significantly fewer stereologically quantified Alzheimer's disease-related neurofibrillary tangles in layer II ERC than Normal Elderly (p < 0.05). This difference in tangle burden in layer II between SuperAgers and Normal Elderly suggests that tangle-bearing neurons may be prone to shrinkage during aging. The finding that SuperAgers show ERC layer II neurons that are substantially larger even compared with individuals 20–30 years younger is remarkable, suggesting that layer II ERC integrity is a biological substrate of exceptional memory in old age.
SIGNIFICANCE STATEMENT Average aging is associated with a gradual decline of memory. Previous research shows that an area critical for memory, the entorhinal cortex (ERC), is susceptible to the early formation of Alzheimer's disease neuropathology, even during average (or typical) trajectories of aging. The Northwestern University SuperAging Research Program studies unique individuals known as SuperAgers, individuals ≥80 years old who show exceptional memory that is at least as good as individuals 20–30 years their junior. In this study, we show that SuperAgers harbor larger, healthier neurons in the ERC compared with their cognitively average same-aged peers, those with amnestic mild cognitive impairment, and – remarkably – even compared with individuals 20–30 years younger. We conclude that larger ERC neurons are a biological signature of the SuperAging trajectory.
Keywords: Alzheimer's disease, entorhinal cortex, neurofibrillary tangles, neuronal integrity, SuperAging
Introduction
Memory capacity declines during the course of average aging. The entorhinal cortex (ERC) and hippocampus, two areas critical for episodic memory, are selectively susceptible to neurofibrillary tangle (NFT) formation. This phenomenon starts as an age-related process and intensifies in a prodromal stage of Alzheimer's disease (AD), known as amnestic mild cognitive impairment (aMCI), reaching its peak in the dementia of AD. Even age-related memory decline could therefore reflect the emergence of neurofibrillary degeneration in the hippocampus and entorhinal cortex (Balasubramanian et al., 2012; Koen and Yonelinas, 2016; Gefen et al., 2018). While this age-related decline is common, it is not necessarily inevitable.
The Northwestern University SuperAging Research Program investigates a unique trajectory that reflects the resistance and resilience to the involutional process characteristic of the MCI–AD continuum. SuperAgers (SAs) are defined as individuals ≥80 years old who demonstrate episodic memory performance at least as good as what would be considered normal for individuals 20–30 years younger (Harrison et al., 2012; Rogalski et al., 2013; Gefen et al., 2014). Of the first 10 cases that came to autopsy, the hippocampus and ERC contained a low to intermediate density of NFTs (Braak stages II–III), whereas healthy cognitively average age-matched control subjects (“Normal Elderly”) had an NFT density range that extended into Braak stage IV (Merrill et al., 2000; Rogalski et al., 2019). Even the NFT-containing limbic areas in SuperAgers contained many healthy-appearing neurons and the neocortex was generally free of neurofibrillary degeneration (Rogalski et al., 2019). The status of ERC neurons is of particular interest in light of the exceptional memory performance in SuperAgers despite old age. A central question is whether SuperAgers are resistant to neurofibrillary degeneration or are resilient to the effects of NFT on neuronal number and size.
Prior research has shown that the number of cortical neurons does not display age-related changes in cognitively intact elderly free of dementia (Stark et al., 2007; Freeman et al., 2008). Recent work on postmortem cases with non-AD dementia demonstrated a tight concordance between shrinkage of neuronal soma and the manifestation of clinical symptoms (Kim et al., 2018). In an effort to understand the factors that contribute to the preservation of memory and to the SuperAging phenotype, the current study investigated the cross-sectional area (i.e., size) of neurons in the ERC in a rare series of autopsies. Stellate cells in layer II and pyramidal cells in layer III/V of the ERC were targeted for measurement given their pivotal role in the reciprocal transfer of information between association cortex and the hippocampal formation (Van Hoesen and Hyman, 1990; Van Hoesen and Solodkin, 1993; Canto et al., 2008), their position along the perforant pathway (Hyman et al., 1984, 1986; Witter, 2007), and the relative paucity of ERC NFTs in SuperAgers compared to their cognitively average peers (Gefen et al., 2021). Stereological quantitation was also performed in a subset of specimens to determine the relationship between NFT formation and neuronal size in layer II of the ERC. The result of this investigation includes the unexpected finding that ERC neuronal size is significantly larger in SuperAgers compared with younger neurologically healthy individuals, in addition to their same-aged elderly peers. This outcome raises fundamental questions regarding the nature of the age-related involutional phenomena in SuperAgers and their relationship to superior memory capacity.
Materials and Methods
Participant characteristics
All participants were required to demonstrate preserved activities of daily living. All participants were also required to lack clinical evidence or history of neurologic or psychiatric disease. The autopsied brains of six participants characterized as “Cognitive SuperAgers” from the Northwestern University SuperAging Research Program were identified from the Northwestern University Alzheimer's Disease Research Center Brain Bank. As comparison, the autopsied brains of seven “cognitively average elderly” [“Normal Elderly”(NE)] participants from the Northwestern University SuperAging Research Program, six healthy younger adults [“Younger Controls” (YCs)], and five participants with antemortem aMCI were additionally identified. Written informed consent and agreement to enter the brain donation program were obtained from all participants in the study, and the study was approved by the Northwestern University Institutional Review Board and in accordance with the Helsinki Declaration (https://www.wma.net/policies-post/wma-declaration-of-helsinki-ethical-principles-for-medical-research-involving-human-subjects/). Samples from representative brain regions of each participant were surveyed qualitatively and found to be free of significant neurodegenerative pathology other than amyloid plaques and neurofibrillary tangles. Braak staging (Braak and Braak, 1991b; Braak et al., 1993) was surveyed in each participant to identify the degree of tangle involvement. Apolipoprotein E (ApoE) genotype was assessed using DNA extracted from blood samples provided by each participant according to enrollment procedures into the Northwestern University SuperAging Research Program. See Table 1 for participant characteristics.
Table 1.
Participant characteristics
| Participant | Age at death (years) | Sex | Education (years) | PMI (h) | Brain weight (g) | Braak staging | ApoE | Non-AD pathology |
|---|---|---|---|---|---|---|---|---|
| SA 1 | 99 | F | 16 | 58 | 1020 | III | 3, 3 | Multiple cortical microinfarcts (nonsignificant); 1 remote lacunar infarct, left putamen; ARTAG, AGD |
| SA 2 | 90 | F | 18 | 4 | 990 | III | 3, 3 | ARTAG, AGD, 1 remote lacunar infarct, left globus pallidus |
| SA 3 | 90 | F | 14 | 4.5 | 1100 | II-III | 2, 3 | PART (definite), Lewy body in dorsal motor nucleus of vagus (incidental), ARTAG |
| SA 4 | 95 | F | 18 | 5 | 1241 | 0 | NA | NA |
| SA 5 | 92 | M | 16 | 11 | 1247 | I | 3, 3 | Medial temporal TDP-43 pathology; moderate cerebrovascular disease, non-occlusive |
| SA 6 | 82 | F | 14 | 24 | 1241 | I | 3, 3 | Lewy bodies in substantia nigra and locus coeruleus, incidental; mild cerebrovascular disease, nonocclusive |
| NE 1 | 96 | F | 14 | 5 | NA | IV | NA | NA |
| NE 2 | 88 | M | 12 | 12 | 1250 | III-IV | NA | NA |
| NE 3 | 82 | M | NA | 24 | NA | III-IV | NA | NA |
| NE 4 | 95 | F | 12 | 3.25 | 1096 | III | 2, 3 | NA |
| NE 5 | 89 | F | 16 | 9 | 1180 | II | 3, 3 | NA |
| NE 6 | 88 | M | 20 | 9 | 1490 | I | 3, 3 | Glioblastoma, WHO grade IV, 9.0 cm in greatest dimension, left parieto-occipital region; amygdala-only Lewy body disease |
| NE 7 | 87 | F | 16 | 16 | 1183 | I | 3, 3 | Moderate vascular disease |
| aMCI 1 | 89 | F | 18 | 4.5 | 1280 | II | NA | None |
| aMCI 2 | 99 | F | 13 | 5 | 1060 | III-IV | 3, 3 | None |
| aMCI 3 | 92 | F | 12 | 3.5 | 1084 | III-IV | 3, 3 | None |
| aMCI 4 | 90 | M | 14 | 3 | 1380 | III | 3, 3 | None |
| aMCI 5 | 92 | M | 16 | 4.5 | 1100 | V | 3, 4 | Superficial contusion in occipital lobe |
| YC 1 | 45 | M | NA | 13 | 1650 | 0 | NA | NA |
| YC 2 | 61 | F | NA | 22 | 1080 | I | NA | NA |
| YC 3 | 50 | F | NA | 48 | 1150 | 0 | NA | NA |
| YC 4 | 57 | F | NA | 6 | 1100 | 0 | NA | NA |
| YC 5 | 59 | F | NA | 20 | 1300 | NA | NA | NA |
| YC 6 | 26 | M | NA | 8 | 1560 | 0 | NA | NA |
ARTAG, aging-related tau astrogliopathy; AGD, argyrophilic grain disease; PART, primary age-related tauopathy; CHD, coronary heart disease; NA, not available; F, female; M, male; WHO, World Health Organization; None, TDP-43 staining was not available. Braak staging followed published guidelines (Braak and Braak, 1985, 1991a,b; Braak et al., 1993).
Inclusion criteria
Cognitive SuperAgers.
Detailed inclusion criteria have been reported previously (Rogalski et al., 2013). Briefly, all participants were community-dwelling, English-speaking adults ≥80 years of age who were free of significant neurologic or psychiatric illness. Inclusion criteria also included neuropsychological test performance criteria, which were chosen for their relevance for cognitive aging and their sensitivity to detect clinical symptoms associated with dementia of the Alzheimer's type (Weintraub et al., 2009). The delayed recall score of the Rey Auditory Verbal Learning Test (RAVLT; Schmidt, 2004) was used as a measure of episodic memory, and SuperAgers were required to perform at or above average normative values for individuals in their 50s and 60s (midpoint age, 61 years; RAVLT delayed recall raw score, ≥9; RAVLT delayed recall scaled score, ≥10; for more information, see Gefen et al., 2015).
Cognitively average Normal Elderly individuals.
Cognitively average elderly individuals were community-dwelling, English-speaking adults ≥80 years of age who were free of significant neurologic or psychiatric illness and were enrolled into the Northwestern University SuperAging Research Program as cognitively average control subjects based on neuropsychological performance. Specifically, these individuals were required to fall within 1 SD of the average range for their age and education before death (Ivnik et al., 1996; Heaton et al., 2004; Shirk et al., 2011). Criteria are in accordance with the National Institute on Aging and Alzheimer's Association (NIA-AA) for elderly individuals considered “not demented” (Albert et al., 2011).
Younger cognitively average individuals (Younger Controls).
Ages of the younger cognitively average participants ranged from 26 to 61 years. Clinical records were available for each participant and were assessed carefully for evidence of cognitive deficits. If the clinical history did not definitively validate normal cognitive function, this information was obtained from the next of kin.
Individuals with aMCI diagnosis.
Participants received a diagnosis of aMCI during life based on the criteria proposed by the NIA-AA (Albert et al., 2011). Individuals with an antemortem diagnosis of aMCI were required to show clear impairment on neuropsychological tests of memory and no impairment in other cognitive domains.
Tissue processing and histopathology
Postmortem intervals (PMIs) ranged from 3 to 58 h. After autopsy, each specimen was cut into 3–4 cm coronal blocks and fixed in 4% paraformaldehyde for 30–36 h at 4°C, and then taken through sucrose gradients (10–40% in 0.1 m sodium phosphate buffer, pH 7.4) for cryoprotection and stored at 4°C. Blocks were sectioned at a thickness of 40 μm on a freezing microtome and stored in 0.1 m phosphate buffer containing 0.02% sodium azide at 4°C until use. Regions were equivalent across tissue blocks taken from the anterior entorhinal cortex. Up to six sections (intersection interval, 24 or 54) of the entorhinal cortex were collected, and a 1.0% cresyl violet Nissl stain was used to visualize neurons. All specimens were evaluated grossly for cortical, caudate, cerebellar, and brainstem atrophy, as well as vascular pathology. Braak staging (Braak et al., 1993) was surveyed in each case to identify NFT involvement in transentorhinal/entorhinal cortex, other limbic cortical areas, and neocortical regions. SuperAger, Normal Elderly, and aMCI specimens were also evaluated microscopically for Lewy and non-Lewy α-synucleinopathies, vascular pathologies, frontotemporal lobar degeneration-tau, and pathologic TDP-43 (Table 1).
Measurement of cross-sectional area of neurons in the ERC
The cross-sectional area of neurons in layer II and layer III/V of each ERC region per participant was measured. Layer II neurons were identified by their stellate appearance and their arrangements in islands of neurons. Layer III/V neurons were identified by their pyramidal shape and the orientation of their apical dendrite toward the cortical surface. To measure the cross-sectional area of neurons, ∼6–10 photomicrographs were obtained randomly from sections spanning layer II and layer III/V per each ERC layer and analyzed at 20× magnification. Analysis of the cross-sectional area of neurons in the ERC was conducted by an individual blinded to group affiliation; a second rater performed analyses of the area of ERC neurons on three cases to ensure consistency in measurement. Analysis was conducted using the image analysis software ImageJ (version 1.53). Within ImageJ (RRID:SCR_003070), the tracing function was used to measure the area of the neuron at 5.5 pixels/μm (image size, 1600 × 1200 pixels). The area was obtained for at least 100 neurons per layer (II and III/V independently) of the ERC region per participant. Mean total area of neurons was calculated in layer II and layer III/V of the ERC, per case, and evaluated for differences across groups.
Modified stereological analysis of NFT pathology in layer II of ERC
In a subset of cases (five SuperAgers and five Normal Elderly) with tissue available, modified stereological methods were used to estimate the density of PHF-1-stained tangles in layer II. Thioflavin-S-positive NFT counts in the ERC without specific quantitation of laminar patterns are reported in the study by Gefen et al. (2021). Whole-hemisphere sections were selected that contained ERC with clear layer II cell islands and were immunostained with the mouse monoclonal antibody PHF-1 (P. Davies, Albert Einstein College of Medicine, New York, NY; catalog #PHF1; RRID:AB_2315150). PHF-1 recognizes tau phosphorylated at Ser396/404 and allows for visualization of tangles and pretangles in the ERC. Briefly, layer II of the ERC was traced at 2.5× magnification and analyzed at 40× magnification by an individual blinded to group. Analysis was performed using the fractionator method and StereoInvestigator software (MBF Bioscience; RRID:SCR_004314). The sections used in analysis were treated as adjacent sections, allowing for calculation of the density in the total volume within the sections. The top and bottom 10 μm of each section were set as the guard height. The dimensions of the counting frame chosen were 225 × 225 μm, based on trials. The coefficient of error was calculated, and sampling parameters were adjusted so that the coefficient of error was <0.1. Data were expressed as counts per cubic millimeter based on planimetric calculation of volume by the fractionator software. Mean NFT densities were compared between the two groups.
Experimental design and statistical analysis
The study used a cross-sectional experimental design based on autopsied specimens. A Kolmogorov–Smirnov test for equality of distributions was used to confirm consistency between two raters of neuronal size. The test failed to reject the null hypothesis of equal distributions, indicating agreement (i.e., consistency) between raters. Differences among age at death, education, and PMI were determined using a one-way ANOVA. A linear mixed-effect model with a random intercept for subject was used to compare the mean neuronal cross-sectional area among the four groups for layer II and layer III/V. The same model was used to determine differences in area between layer II and layer III/V neurons across all cases. Postmortem interval, age at death, and Braak stage, were included as covariates. The p-value for rejecting the null hypothesis was set at 0.05. Linear mixed-effect modeling was also used to test whether there was an association among age at death, cross-sectional area of neurons, and Braak staging (layer II and layer III/V, independently). Braak staging was treated as a continuous variable. Statistical analyses were performed using RStudio Software (version 4.0.3; RRID:SCR_000432). A Welch's t test was used to compare the densities of NFTs in layer II between SuperAgers and Normal Elderly.
Results
In accordance with criteria, the mean age of Younger Controls (mean age, 49.67 years; SD, 13.05) was significantly lower than those of SuperAgers (mean age, 91.33 years; SD, 5.72), Normal Elderly (mean age, 89.29 years; SD, 4.82), and aMCI (mean age, 92.40 years; SD, 3.91; p < 0.05); there were no significant differences in age among other groups. No group differences were found among years of education, PMI, or brain weight. Only one aMCI case (aMCI 5) carried an APOE-4 allele, a known risk factor for Alzheimer's disease (Saunders et al., 1993; Roses, 1996). The Braak staging of NFTs in aMCI subjects ranged from II to V, in Normal Elderly from I to IV, and in SuperAgers from 0 to III. All Younger Controls showed a Braak stage of 0 with the exception of participant “YC 2” (stage I; Table 1).
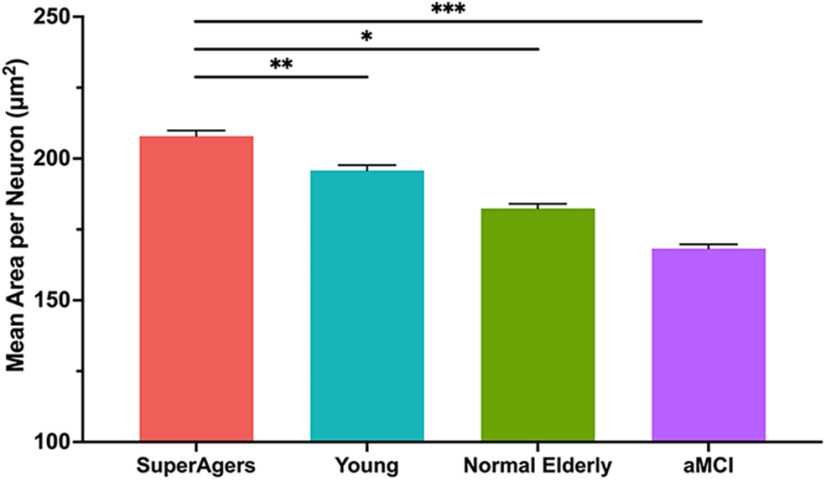
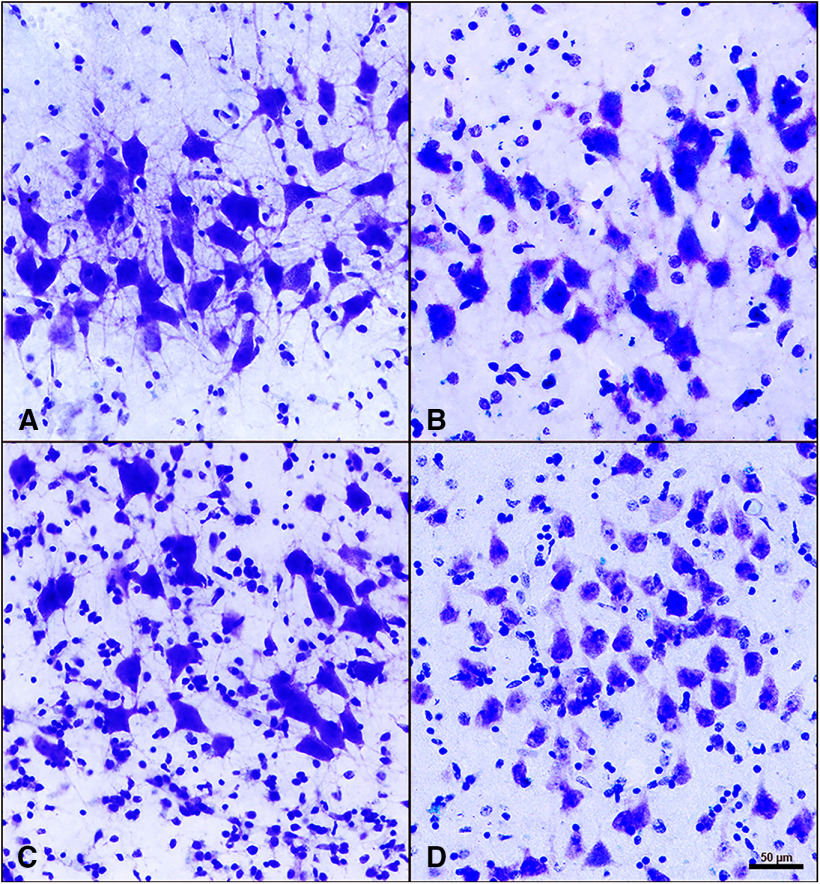
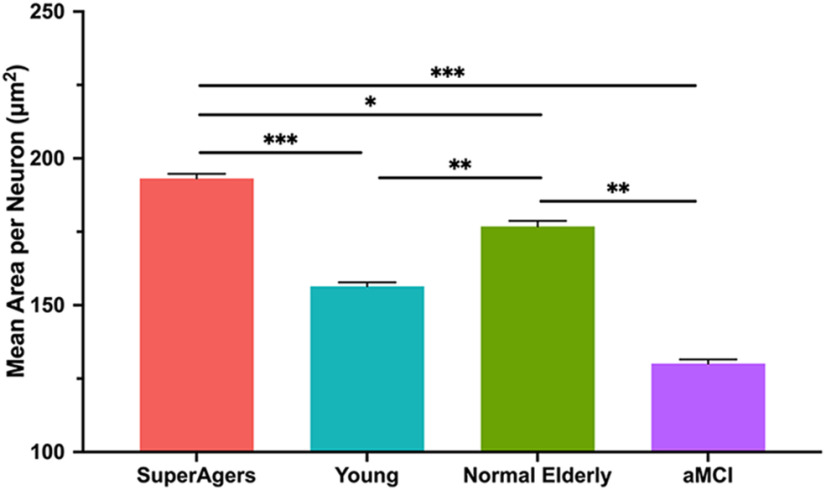
For each group, the mean cross-sectional area of neuronal soma was significantly greater in layer II compared with layer III/V (SuperAgers, Younger Controls, aMCI: p < 0.001; Normal Elderly: p = 0.005). Mean soma area of layer II ERC neurons was significantly larger in SuperAgers compared with Normal Elderly (p < 0.05), aMCI individuals (p = 0.001), and, remarkably, Younger Controls (p < 0.005). There were no significant differences in the mean area of neurons among Normal Elderly, Younger Controls, and aMCI individuals in layer II of the ERC [Fig. 1 (see also Fig. 4)]. At the individual-case level, there was some overlap in layer II soma sizes, highlighting variability; for example, two SuperAgers (SA 1 and SA 4) showed soma sizes that fell below the average size of their same-age peers, and the inverse was true for two Normal Elderly (NE 5 and NE 6). The mean area of layer III/V ERC neurons followed the same trend, where SuperAgers showed a larger soma area than Normal Elderly (p < 0.05), Younger Controls (p < 0.001), and aMCI individuals (p < 0.001). However, Normal Elderly showed a significantly larger soma area of layer III/V neurons compared with aMCI individuals (p = 0.003) and, unexpectedly, Younger Controls (p = 0.01). This is also likely because of the presence of variability in soma size among individual cases given the small groups of postmortem brain tissue, particularly in the Normal Elderly (Fig. 2).
Figure 1.
Mean cross-sectional area per neuron in layer II of the entorhinal cortex. Heights of bars represent the difference in mean cross-sectional area per squared micrometer of layer II neurons in the entorhinal cortex between SuperAgers (N = 6), Younger Controls (N = 6), Normal Elderly (N = 7), and individuals with aMCI (N = 5). An overall average of ∼1044 neurons (SD, 229) were measured per group. SuperAgers showed a significantly larger mean area of layer II ERC neurons compared with Normal Elderly, aMCI individuals, and Younger Controls. There were no significant differences in the mean area of layer II neurons between Normal Elderly, aMCI individuals, and Younger Controls. Statistical significance was assessed using a linear mixed-effect model. Error bars represent the SEM. *p < 0.05; **p < 0.01; *** p < 0.001.
Figure 4.
Layer II neurons of the entorhinal cortex in SuperAgers, Younger Controls, Normal Elderly, and aMCI individuals. A–D, Layer II neurons in SuperAgers, Younger Controls, Normal Elderly, and individuals with aMCI visualized with cresyl violet staining. A, SA 2, a 90-year-old female SuperAger. B, YC 4, a 57-year-old female young control subject. C, NE 6, an 88-year-old male elderly control subject. D, aMCI 1, an 89-year-old female with aMCI. Scale bar: (in D) A–D, 50 µm. A–D, SuperAger (A) shows a significantly larger mean area of layer II ERC neurons compared with Younger Controls (B), Normal Elderly (C), and individual with aMCI (D).
Figure 2.
Mean cross-sectional area per neuron in layer III/IV of the entorhinal cortex. Heights of bars represent the mean cross-sectional area per square micrometer of layer III/V neurons in the entorhinal cortex among SuperAgers (N = 6), Younger Controls (N = 6), Normal Elderly (N = 7), and individuals with aMCI (N = 5). An overall average of ∼1052 neurons (SD, 53) were measured per group. Mean area of layer III/V ERC neurons was significantly larger in SuperAgers compared with Normal Elderly, aMCI individuals, and Younger Controls. Normal Elderly also showed larger neuronal cross-sectional area in layer III/V of the ERC compared with aMCI individuals and Younger Controls. Statistical significance was assessed using a linear mixed-effect model. Error bars represent the SEM. *p < 0.05; **p < 0.01; ***p < 0.001.
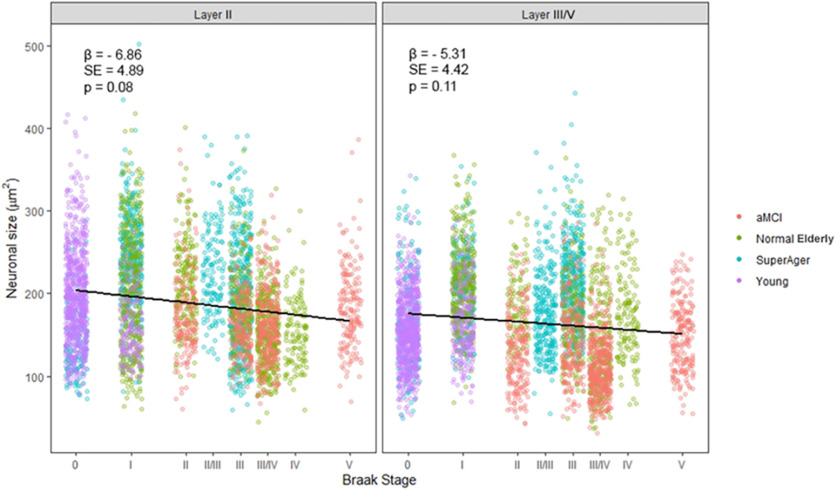
Analyses were performed to determine whether there was a relationship between age at death and the cross-sectional area of neurons within layer II and layer III/V of the ERC, regardless of group affiliation. There was no evidence of an association between age at death and area of layer II and III/V neurons of the ERC. The same relational analyses were performed to determine the relationship between cross-sectional area of neurons and Braak staging (Figs. 3, 4). There was moderate evidence for a negative association of increasing Braak stage on neuronal cross-sectional area that did not quite reach statistical significance in layer II (p = 0.08; β = 6.86) or layer III/V (p = 0.11; β = 5.31) of the ERC.
Figure 3.
Relationship between the cross-sectional area of layer II ERC neurons and Braak stage. Moderate evidence for a negative association of increasing Braak stage on neuronal cross-sectional area (in µm2) was found, yet it did not quite reach statistical significance in ERC layer II (p = 0.08; β = 6.86) and in ERC layer III/V (p = 0.11; β = 5.31). Statistical significance was assessed using a linear mixed-effect model. β, Regression coefficient; SE, SE of the regression coefficient.
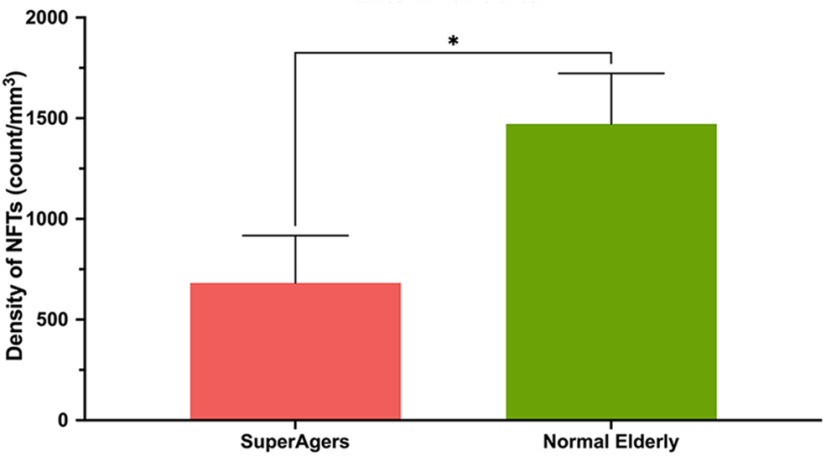
Finally, modified unbiased stereology was performed in ERC sections stained immunohistochemically with PHF-1 to visualize layer II pre-NFTs and mature NFTs in a subset of five SuperAgers (SA 1–5) and five Normal Elderly (NE 1, 2, 3, 6, and 7). The estimated PHF-1-positive NFT densities in layer II were significantly higher in Normal Elderly (∼1500/mm3) compared with SuperAgers (∼700/mm3; p < 0.05), by a difference of about twofold (Figs. 5, 6).
Figure 5.
Density of NFTs in layer II of the entorhinal cortex heights of bars represent the mean density per cubic millimeter of NFTs in layer II neurons in the entorhinal cortex between SuperAgers (N = 5) and Normal Elderly (N = 5). Density of NFTs in layer II ERC neurons was significantly smaller in SuperAgers (mean, 682; SEM, 235) compared with Normal Elderly (mean, 1472; SEM, 251; p < 0.05). This relationship held when controlled for Braak staging. Statistical significance was assessed using a Welch's t test. Error bars represent the SEM.
Figure 6.
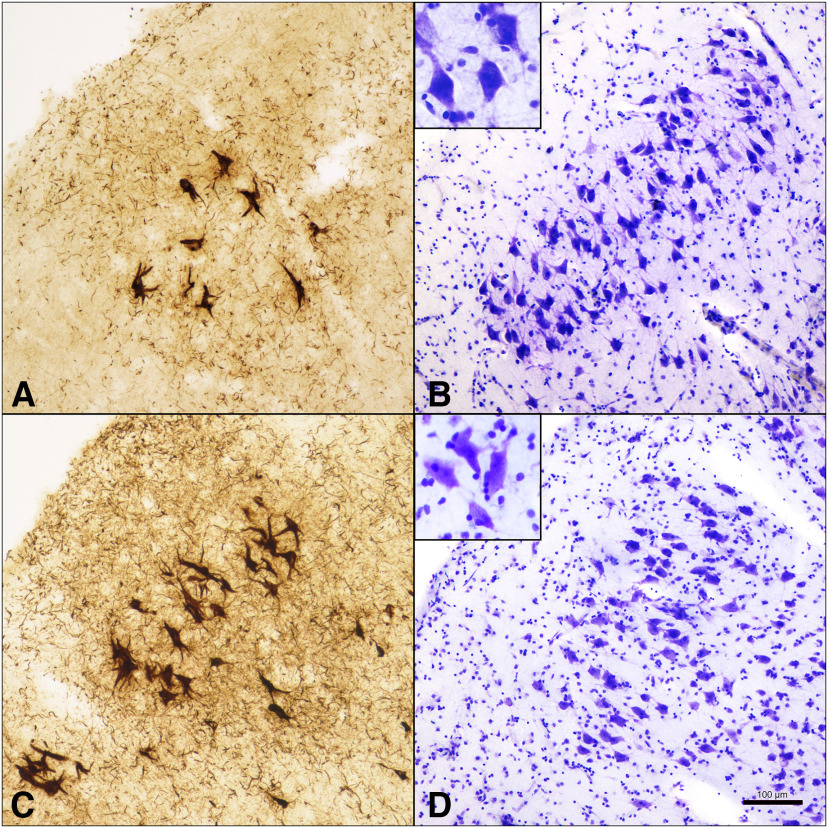
NFTs in layer II ERC neurons compared with neuronal size in SuperAgers and Normal Elderly. A, B, SA 2, a 90-year-old female SuperAger. C, D, NE 6, an 88-year-old male elderly control. SuperAger shows significantly fewer layer II NFTs (A) and larger layer II soma size (B) compared with Normal Elderly (C, D). Scale bar, 100 µm.
Discussion
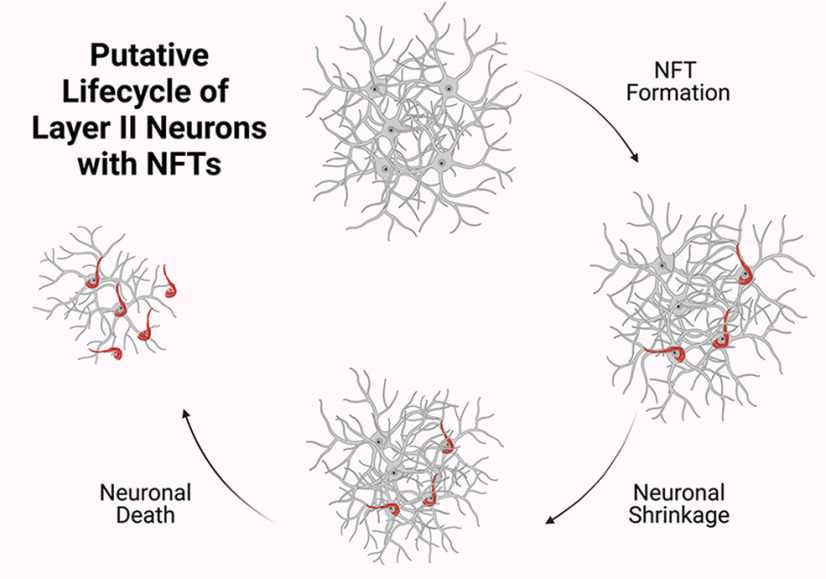
Cognitive SuperAgers are individuals ≥80 years of age who appear to be resistant to the deleterious effects of aging on memory function. Thus far, prior research reported that compared with same-aged peers, SuperAgers show less white matter neuroinflammatory markers (Gefen et al., 2019) and acetylcholinesterase activity (Janeczek et al., 2018), higher cortical volumes (Harrison et al., 2012; Rogalski et al., 2013; Sun et al., 2016), lower rates of atrophy (Cook et al., 2017), and higher density of Von Economo neurons in the anterior cingulate cortex (Gefen et al., 2018) when compared with Normal Elderly. Additional neuropathologic studies of successful agers found associations between preservation of cognition and decreased levels of neurofibrillary tangles (Kawas et al., 2015), amyloid plaques (Kawas et al., 2021), and TDP-43 inclusions (Nelson et al., 2022) in postmortem samples. In a recent study, we reported that SuperAgers harbor fewer NFTs in the entirety of the ERC compared with Normal Elderly and individuals with aMCI (Gefen et al., 2021). The current study extended these findings through an examination of neuronal size as a proxy for cellular integrity of the ERC in SuperAgers. There were four novel findings. First, SuperAgers displayed significantly larger neuronal cross-sectional area in layer II of the ERC when compared with Normal Elderly, individuals with aMCI, and, most remarkably, even relative to the mean ERC cell size of Younger Controls, some of whom were nearly 60 years their junior. Second, a small to moderate negative effect was found between age at death and neuronal size in layer II among all cases, a trend that was recapitulated by the relationship between Braak stage and size as well. Third, we found that SuperAgers harbored significantly fewer NFTs in layer II alone than Normal Elderly. Finally, and in accordance with prior literature (Krimer et al., 1997; Merrill et al., 2000), within the ERC and across all groups, layer II perikarya were larger than those that dwell in layer III/V. Taken together, we can conclude that the integrity of neuronal size in the entorhinal cortex is a biological substrate of exceptional cognitive aging. The inverse is also true: that is, neuronal atrophy appears to be a characteristic marker of normal and pathologic aging. We suspect that this process is a function of neurofibrillary formation in the affected cells (Fig. 7), leading to compromised memory abilities in older age.
Figure 7.
Putative life cycle of layer II neurons with NFTs. Results suggest that in stellate neurons in layer II of ERC, NFT formation leads to neuronal shrinkage. As previously understood, NFTs undergo biochemical changes and remain as “ghost tangles” after their associated neurons dies. Neuronal shrinkage may be an initial mechanism along the course toward age-related cognitive impairment. Created with BioRender.com.
For reasons that remain unknown, cell populations in the ERC are selectively vulnerable to NFT formation during normal aging and in early stages of AD (Braak and Braak, 1985, 1991a). In contrast, SuperAgers either resist the neuropathologic changes of aging and AD or are resilient to cognitive impairment despite demonstrating pathologic brain changes (Rogalski et al., 2013, 2019; Gefen et al., 2021). In a previous report, despite an overlap in Braak staging, NFT burden in SuperAgers was unusually low in the ERC given their age with approximately three times fewer NFTs compared with Normal Elderly across the entire ERC (Gefen et al., 2021). In the current study, Braak staging ranged from 0 to III in SuperAgers and from I to IV in Normal Elderly, again with overlap. When viewed in relation to layer II cell size, there was evidence to suggest that increased NFT pathology is a biological driving force leading to neuronal shrinkage. This was most apparent in the aMCI group, where AD is pathologically present and cell size is significantly lower compared with other groups. To our knowledge, this is one of the first reports to suggest that neuronal shrinkage is a biological substrate of NFT degeneration and poor memory functioning. Current findings showing that SuperAgers resist layer II NFTs in the ERC strongly suggest that a neuron spared from tangle formation can maintain its structural integrity. The remarkable observation that SuperAgers showed larger layer II neurons than their younger peers may imply that large ERC stellate cells were present de novo and are maintained structurally throughout life.
Future in-depth studies are needed to examine possible mechanisms of neuronal, axonal, synaptic, and dendritic integrity in larger samples of SuperAgers across corticolimbic regions. The nucleus basalis of Meynert, for example, contains a population of cholinergic neurons (Ch4) that are distinctly magnocellular, and project to the olfactory bulb, the amygdala, and the entire cortical mantle (Mesulam et al., 1983). Early pretangles form first in Ch4 neurons in parallel with layer II neurons of the ERC over the course of aging and AD, then spread to other limbic/paralimbic areas, then to neocortex. The cause of vulnerability is not presumed to be the cholinergic nature of Ch4 but rather its location within a continuous band of limbic structures (Mesulam, 2013). The investigation of dendritic and axonal integrity, synaptic abnormalities, and genetic and metabolomic factors in any of these anatomically vulnerable limbic regions are all viable avenues of exploration. In the hippocampus proper, synaptic loss in particular is highly correlated with cognitive decline in AD (Honer et al., 1992; Colom-Cadena et al., 2020). Such decline is thought to be because of the loss of afferents from layer II ERC neurons that span to the outer molecular layer of the dentate gyrus (Scheff et al., 2006). In animal models of successful aging, the preservation of postsynaptic densities in the molecular layer correlated with better spatial learning ability in cognitively intact rats (Smith et al., 2000; Morrison and Baxter, 2012). Less is known, however, about the status of synaptic integrity in limbic systems in human specimens procured from successful agers. A fruitful future study involves the measurement of synaptic proteins in layer II pyramidal neurons and throughout hippocampal subfields to establish a putative link between strong synaptic currents and neuronal integrity. Thus far, the study of SuperAgers has led to the conclusion that these unique individuals carry with them a biological signature that now comprises a finding of larger, and healthier, ERC neurons relatively void of tau pathology. With time, it is likely that other factors that promote resistance and resilience to aging-related involutional phenomena will be discovered.
Footnotes
This study was supported by the National Institute on Aging of the National Institutes of Health (Grants P30-AG-013854, R01-AG-062566, R01-AG-067781, R01-AG-045571, R56-AG-045571, U19-AG-073153). National Institute on Aging (P30 AG072977, F31AG07631), the National Institute of Neurological Disorders and Stroke (T32NS047987), and a National Science Foundation Graduate Research Fellowship (DGE-1842165). We thank the research participants of the Northwestern University SuperAging Research Program and the Northwestern University Alzheimer's Disease Research Center for invaluable contributions to this study and the brain donation program.
The authors declare no competing financial interests.
References
- Albert MS, DeKosky ST, Dickson D, Dubois B, Feldman HH, Fox NC, Gamst A, Holtzman DM, Jagust WJ, Petersen RC, Snyder PJ, Carrillo MC, Thies B, Phelps CH (2011) The diagnosis of mild cognitive impairment due to Alzheimer's disease: recommendations from the National Institute on Aging-Alzheimer's Association workgroups on diagnostic guidelines for Alzheimer's disease. Alzheimers Dement 7:270–279. 10.1016/j.jalz.2011.03.008 [DOI] [PMC free article] [PubMed] [Google Scholar]
- Balasubramanian AB, Kawas CH, Peltz CB, Brookmeyer R, Corrada MM (2012) Alzheimer disease pathology and longitudinal cognitive performance in the oldest-old with no dementia. Neurology 79:915–921. 10.1212/WNL.0b013e318266fc77 [DOI] [PMC free article] [PubMed] [Google Scholar]
- Braak H, Braak E (1985) On areas of transition between entorhinal allocortex and temporal isocortex in the human brain. Normal morphology and lamina-specific pathology in Alzheimer's disease. Acta Neuropathol 68:325–332. 10.1007/BF00690836 [DOI] [PubMed] [Google Scholar]
- Braak H, Braak E (1991a) Morphological changes in the human cerebral cortex in dementia. J Hirnforsch 32:277–282. [PubMed] [Google Scholar]
- Braak H, Braak E (1991b) Neuropathological stageing of Alzheimer-related changes. Acta Neuropathol 82:239–259. 10.1007/BF00308809 [DOI] [PubMed] [Google Scholar]
- Braak H, Braak E, Bohl J (1993) Staging of Alzheimer-related cortical destruction. Eur Neurol 33:403–408. 10.1159/000116984 [DOI] [PubMed] [Google Scholar]
- Canto CB, Wouterlood FG, Witter MP (2008) What does the anatomical organization of the entorhinal cortex tell us? Neural Plast 2008:381243. 10.1155/2008/381243 [DOI] [PMC free article] [PubMed] [Google Scholar]
- Colom-Cadena M, Spires-Jones T, Zetterberg H, Blennow K, Caggiano A, DeKosky ST, Fillit H, Harrison JE, Schneider LS, Scheltens P, de Haan W, Grundman M, van Dyck CH, Izzo NJ, Catalano SM (2020) The clinical promise of biomarkers of synapse damage or loss in Alzheimer's disease. Alzheimers Res Ther 12:21. [DOI] [PMC free article] [PubMed] [Google Scholar]
- Cook AH, Sridhar J, Ohm D, Rademaker A, Mesulam MM, Weintraub S, Rogalski E (2017) Rates of cortical atrophy in adults 80 years and older with superior vs average episodic memory. JAMA 317:1373–1375. 10.1001/jama.2017.0627 [DOI] [PMC free article] [PubMed] [Google Scholar]
- Freeman SH, Kandel R, Cruz L, Rozkalne A, Newell K, Frosch MP, Hedley-Whyte ET, Locascio JJ, Lipsitz LA, Hyman BT (2008) Preservation of neuronal number despite age-related cortical brain atrophy in elderly subjects without Alzheimer disease. J Neuropathol Exp Neurol 67:1205–1212. 10.1097/NEN.0b013e31818fc72f [DOI] [PMC free article] [PubMed] [Google Scholar]
- Gefen T, Shaw E, Whitney K, Martersteck A, Stratton J, Rademaker A, Weintraub S, Mesulam MM, Rogalski E (2014) Longitudinal neuropsychological performance of cognitive superagers. J Am Geriatr Soc 62:1598–1600. 10.1111/jgs.12967 [DOI] [PMC free article] [PubMed] [Google Scholar]
- Gefen T, Peterson M, Papastefan ST, Martersteck A, Whitney K, Rademaker A, Bigio EH, Weintraub S, Rogalski E, Mesulam MM, Geula C (2015) Morphometric and histologic substrates of cingulate integrity in elders with exceptional memory capacity. J Neurosci 35:1781–1791. 10.1523/JNEUROSCI.2998-14.2015 [DOI] [PMC free article] [PubMed] [Google Scholar]
- Gefen T, Papastefan ST, Rezvanian A, Bigio EH, Weintraub S, Rogalski E, Mesulam MM, Geula C (2018) Von Economo neurons of the anterior cingulate across the lifespan and in Alzheimer's disease. Cortex 99:69–77. 10.1016/j.cortex.2017.10.015 [DOI] [PMC free article] [PubMed] [Google Scholar]
- Gefen T, Kim G, Bolbolan K, Geoly A, Ohm D, Oboudiyat C, Shahidehpour R, Rademaker A, Weintraub S, Bigio EH, Mesulam MM, Rogalski E, Geula C (2019) Activated microglia in cortical white matter across cognitive aging trajectories. Front Aging Neurosci 11:94. 10.3389/fnagi.2019.00094 [DOI] [PMC free article] [PubMed] [Google Scholar]
- Gefen T, Kawles A, Makowski-Woidan B, Engelmeyer J, Ayala I, Abbassian P, Zhang H, Weintraub S, Flanagan ME, Mao Q, Bigio EH, Rogalski E, Mesulam MM, Geula C (2021) Paucity of entorhinal cortex pathology of the Alzheimer's type in SuperAgers with superior memory performance. Cereb Cortex 31:3177–3183. 10.1093/cercor/bhaa409 [DOI] [PMC free article] [PubMed] [Google Scholar]
- Harrison TM, Weintraub S, Mesulam MM, Rogalski E (2012) Superior memory and higher cortical volumes in unusually successful cognitive aging. J Int Neuropsychol Soc 18:1081–1085. 10.1017/S1355617712000847 [DOI] [PMC free article] [PubMed] [Google Scholar]
- Heaton R, Miller S, Taylor M, Grant I (2004) Revised comprehensive norms for an expanded Halstead-Reitan battery: demographically adjusted neuropsychological norms for African American and caucasian adults. Lutz, FL: Psychological Assessment Resources. [Google Scholar]
- Honer WG, Dickson DW, Gleeson J, Davies P (1992) Regional synaptic pathology in Alzheimer's disease. Neurobiol Aging 13:375–382. 10.1016/0197-4580(92)90111-a [DOI] [PubMed] [Google Scholar]
- Hyman BT, Van Hoesen GW, Damasio AR, Barnes CL (1984) Alzheimer's disease: cell-specific pathology isolates the hippocampal formation. Science 225:1168–1170. 10.1126/science.6474172 [DOI] [PubMed] [Google Scholar]
- Hyman BT, Van Hoesen GW, Kromer LJ, Damasio AR (1986) Perforant pathway changes and the memory impairment of Alzheimer's disease. Ann Neurol 20:472–481. 10.1002/ana.410200406 [DOI] [PubMed] [Google Scholar]
- Ivnik RJ, Malec JF, Smith GE, Tangalos EG, Petersen RC (1996) Neuropsychological tests' norms above age 55: COWAT, BNT, MAE token, WRAT-R reading, AMNART, STROOP, TMT, and JLO. Clin Neuropsychol 10:262–278. 10.1080/13854049608406689 [DOI] [Google Scholar]
- Janeczek M, Gefen T, Samimi M, Kim G, Weintraub S, Bigio E, Rogalski E, Mesulam MM, Geula C (2018) Variations in acetylcholinesterase activity within human cortical pyramidal neurons across age and cognitive trajectories. Cereb Cortex 28:1329–1337. 10.1093/cercor/bhx047 [DOI] [PMC free article] [PubMed] [Google Scholar]
- Kawas CH, Kim RC, Sonnen JA, Bullain SS, Trieu T, Corrada MM (2015) Multiple pathologies are common and related to dementia in the oldest-old: the 90+ Study. Neurology 85:535–542. 10.1212/WNL.0000000000001831 [DOI] [PMC free article] [PubMed] [Google Scholar]
- Kawas CH, Legdeur N, Corrada MM (2021) What have we learned from cognition in the oldest-old. Curr Opin Neurol 34:258–265. 10.1097/WCO.0000000000000910 [DOI] [PMC free article] [PubMed] [Google Scholar]
- Kim G, Vahedi S, Gefen T, Weintraub S, Bigio EH, Mesulam MM, Geula C (2018) Asymmetric TDP pathology in primary progressive aphasia with right hemisphere language dominance. Neurology 90:e396–e403. 10.1212/WNL.0000000000004891 [DOI] [PMC free article] [PubMed] [Google Scholar]
- Koen JD, Yonelinas AP (2016) Recollection, not familiarity, decreases in healthy ageing: converging evidence from four estimation methods. Memory 24:75–88. 10.1080/09658211.2014.985590 [DOI] [PMC free article] [PubMed] [Google Scholar]
- Krimer LS, Hyde TM, Herman MM, Saunders RC (1997) The entorhinal cortex: an examination of cyto- and myeloarchitectonic organization in humans. Cereb Cortex 7:722–731. 10.1093/cercor/7.8.722 [DOI] [PubMed] [Google Scholar]
- Merrill DA, Roberts JA, Tuszynski MH (2000) Conservation of neuron number and size in entorhinal cortex layers II, III, and V/VI of aged primates. J Comp Neurol 422:396–401. [DOI] [PubMed] [Google Scholar]
- Mesulam MM (2013) Cholinergic circuitry of the human nucleus basalis and its fate in Alzheimer's disease. J Comp Neurol 521:4124–4144. 10.1002/cne.23415 [DOI] [PMC free article] [PubMed] [Google Scholar]
- Mesulam MM, Mufson EJ, Levey AI, Wainer BH (1983) Cholinergic innervation of cortex by the basal forebrain: cytochemistry and cortical connections of the septal area, diagonal band nuclei, nucleus basalis (substantia innominata), and hypothalamus in the rhesus monkey. J Comp Neurol 214:170–197. 10.1002/cne.902140206 [DOI] [PubMed] [Google Scholar]
- Morrison JH, Baxter MG (2012) The ageing cortical synapse: hallmarks and implications for cognitive decline. Nat Rev Neurosci 13:240–250. 10.1038/nrn3200 [DOI] [PMC free article] [PubMed] [Google Scholar]
- Nelson PT, et al. (2022) Frequency of LATE neuropathologic change across the spectrum of Alzheimer's disease neuropathology: combined data from 13 community-based or population-based autopsy cohorts. Acta Neuropathol 144:27–44. 10.1007/s00401-022-02444-1 [DOI] [PMC free article] [PubMed] [Google Scholar]
- Rogalski EJ, Gefen T, Shi J, Samimi M, Bigio E, Weintraub S, Geula C, Mesulam MM (2013) Youthful memory capacity in old brains: anatomic and genetic clues from the Northwestern SuperAging Project. J Cogn Neurosci 25:29–36. 10.1162/jocn_a_00300 [DOI] [PMC free article] [PubMed] [Google Scholar]
- Rogalski EJ, Gefen T, Mao Q, Connelly M, Weintraub S, Geula C, Bigio EH, Mesulam MM (2019) Cognitive trajectories and spectrum of neuropathology in SuperAgers: the first 10 cases. Hippocampus 29:458–467. 10.1002/hipo.22828 [DOI] [PMC free article] [PubMed] [Google Scholar]
- Roses AD (1996) Apolipoprotein E alleles as risk factors in Alzheimer's disease. Annu Rev Med 47:387–400. [DOI] [PubMed] [Google Scholar]
- Saunders AM, et al. (1993) Association of apolipoprotein E allele ε4 with late-onset familial and sporadic Alzheimer's disease. Neurology 43:1467. 10.1212/WNL.43.8.1467 [DOI] [PubMed] [Google Scholar]
- Scheff SW, Price DA, Schmitt FA, Mufson EJ (2006) Hippocampal synaptic loss in early Alzheimer's disease and mild cognitive impairment. Neurobiol Aging 27:1372–1384. 10.1016/j.neurobiolaging.2005.09.012 [DOI] [PubMed] [Google Scholar]
- Schmidt M (2004) Rey auditory verbal learning test: a handbook. Los Angeles: Western Psychological Services. [Google Scholar]
- Shirk SD, Mitchell MB, Shaughnessy LW, Sherman JC, Locascio JJ, Weintraub S, Atri A (2011) A web-based normative calculator for the uniform data set (UDS) neuropsychological test battery. Alzheimers Res Ther 3:32. 10.1186/alzrt94 [DOI] [PMC free article] [PubMed] [Google Scholar]
- Smith TD, Adams MM, Gallagher M, Morrison JH, Rapp PR (2000) Circuit-specific alterations in hippocampal synaptophysin immunoreactivity predict spatial learning impairment in aged rats. J Neurosci 20:6587–6593. [DOI] [PMC free article] [PubMed] [Google Scholar]
- Stark AK, Petersen AO, Gardi J, Gundersen HJ, Pakkenberg B (2007) Spatial distribution of human neocortical neurons and glial cells according to sex and age measured by the saucer method. J Neurosci Methods 164:19–26. 10.1016/j.jneumeth.2007.03.019 [DOI] [PubMed] [Google Scholar]
- Sun FW, Stepanovic MR, Andreano J, Barrett LF, Touroutoglou A, Dickerson BC (2016) Youthful brains in older adults: preserved neuroanatomy in the default mode and salience networks contributes to youthful memory in superaging. J Neurosci 36:9659–9668. 10.1523/JNEUROSCI.1492-16.2016 [DOI] [PMC free article] [PubMed] [Google Scholar]
- Van Hoesen GW, Hyman BT (1990) Hippocampal formation: anatomy and the patterns of pathology in Alzheimer's disease. Prog Brain Res 83:445–457. 10.1016/s0079-6123(08)61268-6 [DOI] [PubMed] [Google Scholar]
- Van Hoesen GW, Solodkin A (1993) Some modular features of temporal cortex in humans as revealed by pathological changes in Alzheimer's disease. Cereb Cortex 3:465–475. 10.1093/cercor/3.5.465 [DOI] [PubMed] [Google Scholar]
- Weintraub S, Salmon D, Mercaldo N, Ferris S, Graff-Radford NR, Chui H, Cummings J, DeCarli C, Foster NL, Galasko D, Peskind E, Dietrich W, Beekly DL, Kukull WA, Morris JC (2009) The Alzheimer's Disease Centers' Uniform Data Set (UDS): the neuropsychologic test battery. Alzheimer Dis Assoc Disord 23:91–101. 10.1097/WAD.0b013e318191c7dd [DOI] [PMC free article] [PubMed] [Google Scholar]
- Witter MP (2007) The perforant path: projections from the entorhinal cortex to the dentate gyrus. Prog Brain Res 163:43–61. [DOI] [PubMed] [Google Scholar]


