Background:
The Hirsch-index (h-index) is a measure of academic productivity that incorporates both the quantity and quality of an author’s output. However, it is still affected by self-citation behaviors. This study aims to determine the research output and self-citation rates (SCRs) in the Journal of Medicine (Baltimore), establishing a benchmark for bibliometrics, in addition to identifying significant differences between stages from 2018 to 2021.
Methods:
We searched the PubMed database to obtain 17,912 articles published between 2018 and 2021 in Medicine (Baltimore). Two parts were carried out to conduct this study: the categories were clustered according to the medical subject headings (denoted by midical subject headings [MeSH] terms) using social network analysis; 3 visualizations were used (choropleth map, forest plot, and Sankey diagram) to identify dominant entities (e.g., years, countries, regions, institutes, authors, categories, and document types); 2-way analysis of variance (ANOVA) was performed to differentiate outputs between entities and stages, and the SCR with articles in Medicine (Baltimore) was examined. SCR, as well as the proportion of self-citation (SC) in the previous 2 years in comparison to SC were computed.
Results:
We found that South Korea, Sichuan (China), and Beijing (China) accounted for the majority of articles in Medicine (Baltimore); ten categories were clustered and led by 3 MeSh terms: methods, drug therapy, and complications; and more articles (52%) were in the recent stage (2020–2021); no significant difference in counts was observed between the 2 stages based on the top ten entities using the forest plot (Z = 0.05, P = .962) and 2-way ANOVA (F = 0.09, P = .76); the SCR was 5.69% (<15%); the h-index did not differ between the 2 collections of self-citation inclusion and exclusion; and the SC in the previous 2 years accounted for 70% of the self-citation exclusion.
Conclusion:
By visualizing the characteristics of a given journal, a breakthrough was made. Subject categories can be classified using MeSH terms. Future bibliographical studies are recommended to perform the 2-way ANOVA and then compare the outputs from 2 stages as well as the changes in h-indexes between 2 sets of self-citation inclusion and exclusion.
Keywords: choropleth map, forest plot, h-index, medicine (Baltimore), Sankey diagram, self-citation percentage, social network analysis, 2-way analysis of variance
Highlights
With the teaching material in the supplemental digital contents, we demonstrated and explained how to calculate the percentage of self-citations for a given journal.
In contrast to the traditional approach of using simple descriptive statistics with numerous Tables and Figures in an analysis, the 2 perspectives from 2 steps and 2 collections enriched the contents of bibliometric analysis. Sankey diagrams highlight the dominant entities on a picture, which is a novel and unique portrayal and has never been seen in the literature before.
It is common in statistics to use 2-way ANOVA for group comparisons but rarely in bibliometrics to evaluate the difference between groups and the trend in evolutionary stages (e.g., the early and recent stages).
1. Introduction
The Hirsch-index (h-index)[1] measures both the quantity and the quality of an author’s work. h-indexes are calculated as maximum values of h where the given journal/author has published h papers that have each been cited at least h times.[2]
1.1. Journal Impact Factor scores distorted by excessive self-citations
h-indexes are still influenced by self-citation, which has been assessed in other medical fields and journals.[3] An h-index is calculated by finding the maximum square that fits under the citation curve for an author when plotting the number of citations in decreasing order[4] and can be applied to an entire series of journals[5] or a large group of scientists,[6] for example, the h5-index for journals in Google Scholar.[7] Journals indexed by Clarivate[8] are temporarily dropped from the Journal Citation Reports if their Journal Impact Factor is distorted by excessive self-citations[9] or citation stacking.[8]
There is nothing wrong with journal self-citations. Almost every journal has a reference to itself. The majority of high-quality science journals examined by Clarivate Analytics have a self-citation rate (SCR) of 20% or less.[10] Meanwhile, Clarivate reports that self-citation in the Web of Science ranges from 0% to 15%,[11] and particularly in management journals, self-citation is much lower than 10%.[12] The SCR of articles published in the journal Medicine (Baltimore), which ranked in the top 10 journals with Taiwan authors in 2020,[13] motivated us to examine it.
1.2. Trend of article numbers in the past
A new definition of predatory journals has been published in Nature,[14] highlighting the growing concern within academia about how these pernicious journals exploit the gold open-access publication model,[10] harm academia and science,[15] and “sow confusion, promote shoddy scholarship, and waste research resources.”[14] Both the quantity and quality of predatory journals with articles they publish are growing rapidly[16] due to their own benefit with a nonexistent or almost nonexistent peer-review process,[15,17–19] which allows rapid publication of academic papers without due assurances. Potential predatory journals have recently been uncovered and pointed out in academics.[20,21] Accordingly, the second question is to study the output trend in Medicine (Baltimore) with a limited increase of publications in the past.
1.3. Publications reporting on trends in bibliometrics
Trend publications are reported extensively in bibliometrics. In the past, the ten top elements in article entities (e.g., variables in country, institute, author, journal, document type, and subject category) were frequently displayed using dozens of Tables and Figures.[22] A single glance tells a thousand words.[23] To simplify the disclosure of study results, the third research question looks at ten top elements in article entities using the Sankey diagram.[24,25]
1.4. Techniques for identifying citation cartels in a network
Citation cartels were first described in an essay by Franck in 1999 who defined them as groups of Editors and Journals working together for mutual benefit.[26] This definition refers to editors who used inter-journal citations to increase the impact factors (IF) of their journals. Citation cartels have recently addressed other relationships, such as those between editors and authors.[27] As such, citation cartels, where members of these mutually cited papers of authors with which they are known or not known, have become reality in the research domain.
With the help of modern semantic web tools for manipulating the knowledge on the Internet, citation cartels can be discovered.[27] However, it is difficult to determine whether this citation cartel is valid in the real world. It is only possible to infer that there is a high probability of citation cartels, but this fact needs to be confirmed through a more detailed analysis.[27] The criterion of a self-citation rate exceeding 20%,[10] 15%,[11] or 10%[12] is therefore temporarily regarded as a sign of citation cartel in nature.
There is also a long-standing debate in science concerning the relationship between productivity and impact of scientific production that is still controversial and poorly understood.[28] There is some evidence that academics are adverse to simultaneous changes in their productivity and journal prestige levels over consecutive career years.[28]
To prevent this phenomenon or to discredit authors (or journals) that may inadvertently become involved in the citation cartels, it is necessary to demonstrate that the cartels do or do not exist. It is widely known that journal editors and reviewers are aware of this phenomenon, but without any indication that their self-citation rate is below or above the cutting point of 20%,[10] 15%,[11] or 10%.[12] As part of our motivation, we intend to develop a module for computing the self-citation rate of journals in this study.
1.5. Study aims
Based on the intentions mentioned above, the following hypotheses will be inspected: the top ten article entities can be identified using the Sankey diagram; publications are not continuously increasing in Medicine (Baltimore); and the self-citation rates in Medicine (Baltimore) are significantly lower than the criterion of 15%.[11]
2. Methods
2.1. Data source
Two steps were taken to organize the study data. First, we searched the PubMed database (PubMed.com) using the keyword Medicine (Baltimore) [Journal]) and downloaded 18,465 abstracts on April 21, 2022 (see dataset in Availability of data and materials). The citing articles were downloaded from the icite analysis[29] based on the article identity number (i.e., PubMed identity number [PMID], PubMed ID). From these PMIDs, the article citations and relative citation ratio (RCR)[30] were obtained. A PubMed match of the corresponding journals related to the citing articles was performed (that is, only PubMed citing articles were considered).
We selected top subject categories by performing social network analysis (SNA)[31] with Pajek software[32] by using coword datasets built from article PMIDs and medical subject headings (described by midical subject headings [MeSH] terms). Those ten categories were then matched to articles.
Because all data were obtained from a publicly available database, this study does not require ethical approval.
2.2. Study designs and approaches
Two parts were involved in dealing with the data:
2.2.1. Part I: characteristices in outputs.
2.2.1.1. Traditional bibliometrics using descriptive statistics.
In total, 17,912 PMIDs were retrieved from the top 10 subject categories using SNA and MeSH terms. In the choropleth map, the geographical distribution of outputs in countries/regions (i.e., the US states and provinces/ metropolitan cities in China) were separated so that they could compete with other countries/regions; otherwise, publications in the US or China might always dominate the publications on the choropleth map.[33]
On the Sankey diagram,[24,25] the top 10 article entities (e.g., years, countries, regions, institutes, authors, categories, and document types) are shown with proportional counts.
2.2.1.2. Advanced bibliometrics using 2-way analysis of variance (ANOVA).
Comparisons of the differences in proportional counts of publications between the 2 early/recent stages in article entities were made on the basis of odds ratios computed using event and non-vent counts observed in 17,912 articles.[24] The overall effect in counts was interpreted in favor of either the early or the recent stage by observing the composited Z and P values.[24,25]
We used a 2-way ANOVA with no replication[24] to differentiate between the 2 factors of entities and stages, with equations 1 to 10 using functions in MS Excel.
| (1) |
df1 is the degree of freedom (df) within factor 1 or 2. df2 is the df of the residual (or error in ANOVA). The P value of the F statistic indicates the likelihood that the F value calculated from the F test would occur in the absence of a difference.
| (2) |
| (3) |
| (4) |
An F value is the test statistic resulting from an F test (the mean square of the column variable (MSc) divided by MSe, see Eq. 6 below). The MSc is the mean sum of squares (the sum of squares divided by the column factor).
| (5) |
| (6) |
Sum sqc is the sum of squares (i.e., the variation between the group means, denoted by cmean in column variables, and the overall means, denoted by tmean). The number of row factors is m (for instance, years from 2018 to 2021 and m = 4). The column represents the number of column factors (e.g., stages = n = 2 in this study). Similarly, sum sqr can be expressed using Eq 6 (e.g., row = m represents the number of entities, and m is 4 if there are 4 years in a row).
| (7) |
| (8) |
| (9) |
| (10) |
2.2.2. Part II: changes in h-indexes between collections.
The change in the h-index of the 2 collections of self-citation inclusion (SCI) and exclusion (SCE) was compared. The PMIDs in citing articles from step 1 in the section 2.1 of data source(e.g., PMID) were transformed into their publishing journals. SCE is defined as articles that are cited in journals without the name of Medicine (Baltimore) in contrast to SCI with the name of Medicine (Baltimore) in citing journals.
Both SCE and SCI were compared in 2 stages from 2018 to 2021. Share of SCE (SSCE) is defined as SCE shares covered by the window of the previous 2 years only (i.e., SCE = SSCE + NonSSCE). A variety of contingency tables were provided, such as an h-index in cells when stages are in columns and SCI/SCE/SSCE in rows. We also calculated the impact factors (IFs = citations/counts), counts with the name of Medicine (Baltimore) per article, and SCR = (SCI-SCE)/SCI and (SCI-SSCE)/SCI) in contingency tables. We drew a scatter plot for the articles with SCE, and SCI plotted on the x and y axes, respectively.
2.3. Statistical tools and data analysis
Visual representations of the Sankey diagram, the choropleth map, and the forest plot were created using the author-made MS Excel modules. To determine the momentum of association between self-citation inclusion and exclusion, the correlation coefficient (CC) was used. The CC t value was calculated based on the following formula ().[25,34,35]
3. Results
3.1. Part I: characteristics in outputs
3.1.1. The county-based geographics using traditional descriptive statistics.
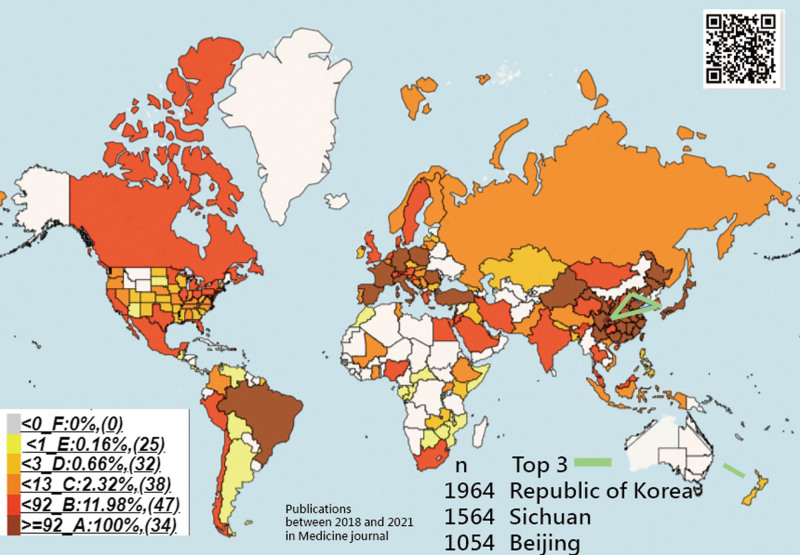
The publications of countries/regions are displayed on the choropleth map[33] in Figure 1. The majority of articles in Medicine (Baltimore) came from South Korea, Sichuan (China), and Beijing (China).
Figure 1.
Geographical distribution of publications in Medicine (Baltimore) between 2018 and 2020 (note: China and the US have been divided into provinces/metropolitans and US states in comparison to other countries/regions based on equal population size).
3.1.2. Clusters of subject category using traditional descriptive statistics.
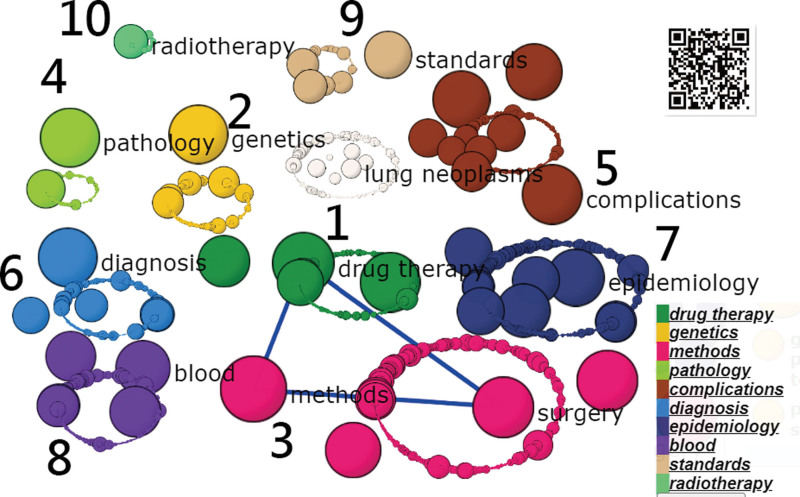
A total of ten categories were clustered, which are shown in Figure 2. The top 3 (methods, drug therapy, and complications) are highlighted by 3 blue lines linked together.
Figure 2.
Cluster analysis of MeSH terms appearing in articles in the journal Medicine between 2018 and 2021 (note: ten themes in Medicine (Baltimore) are determined by MeSH terms using co-word analysis or, say, social network analysis).
3.1.3. All relevant entities are shown on the Sankey diagram using traditional descriptive statistics.
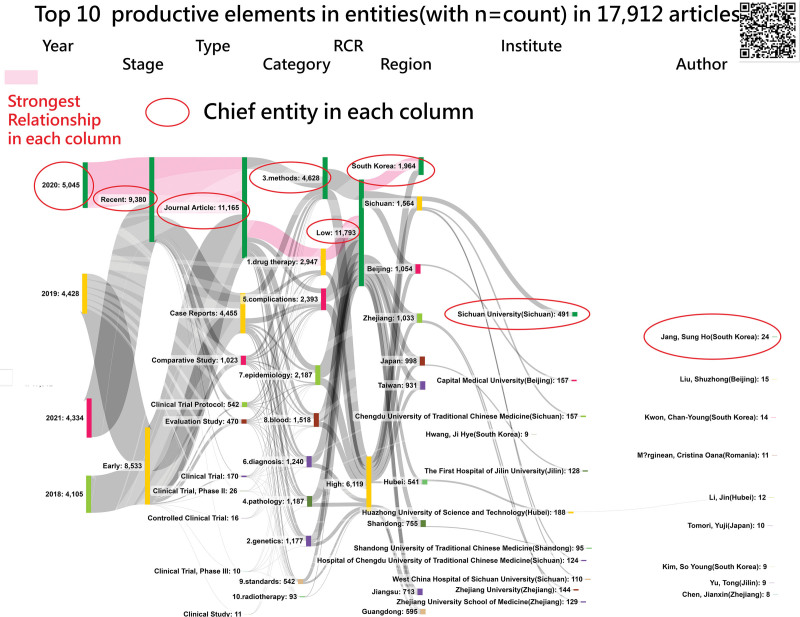
In the Sankey diagram (Fig. 3),[36] we can see that slightly more articles (52%) are in the recent stage (2020–2021). The year 2020 is ranked top (n = 5045) in years. Other top elements in article entities are shown in Figure 3, including the recent stage (9380). Journal Article (11,165) in document type, methods (4628) in the category, stratus in Low RCR (11,793), South Korea (1964), Sichuan University (China) (491) in a research institute, Sung-Ho Jang (Sihth Korea) (24) in authors.
Figure 3.
Sankey diagram of the top ten elements in entities (note: nodes and edges are sizes by publications and flow momentum; the larger node means more publications; the wider edge represents more flow counts between 2 adjacent members; details are at the link[36]).
The first hypothesis regarding the top ten elements in article entities simultaneously shown on the Sankey diagram has been confirmed.
3.1.4. Comparison of proportional counts on the forest plot using advanced bibliomertic analysis.
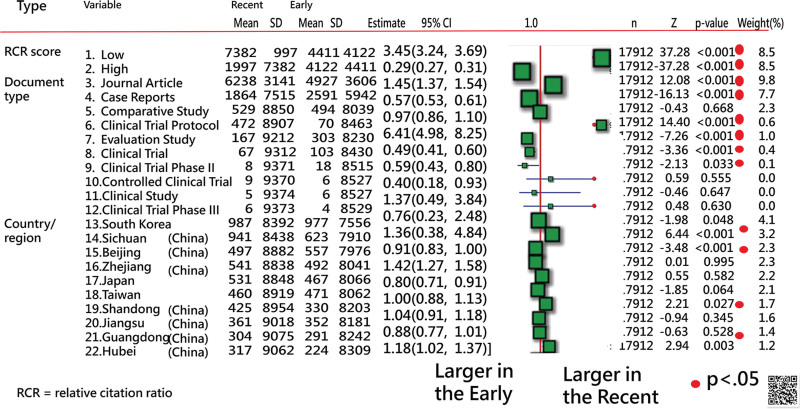
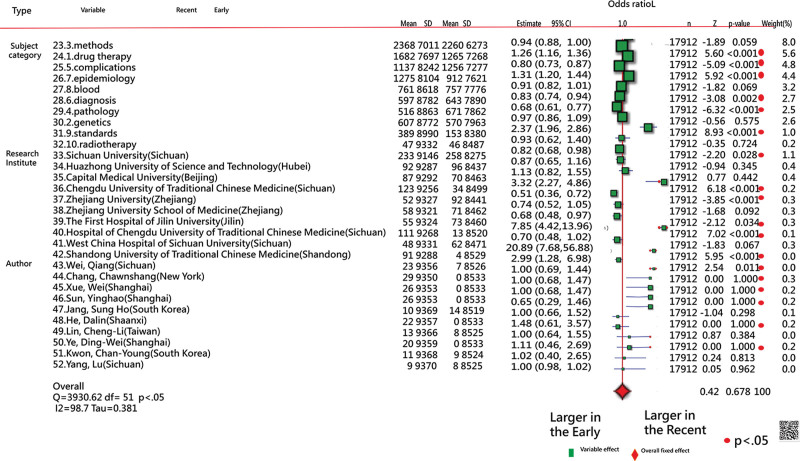
We did not find a significant difference between stages based on the ten top elements in entities using the forest plot (Z = 0.05, P = .962 in Figs. 4 and 5) and the 2-way ANOVA (F = 0.09, P = .76); see Table 1 and the MP4 video[37] for more information about the execution of the 2-way ANOVA in MS-EXCEL.
Figure 4.
Comparison of proportional counts of articles published in Medicine (Baltimore) between 2018 and 2021 for the top ten elements in entities (note: significant difference between 2 stages are shown with red dot at the right side, indicating the proportional counts are distinctly different and the green boxes are deviated from the vertical middle line).
Figure 5.
Comparison of the difference in proportional counts of publications for articles of the top ten dominant subject categories, research institutes, and authors in Medicine journal between 2018 and 2021 (note: significant difference between 2 stages are shown with red dot at the right side, indicating the proportional counts are distinctly different and the green boxes are deviated from the vertical middle line).
Table 1.
Comparison of counts in stages using 2-way ANOVA.
| No. | Variable | F-value | P-value | Point* | Recent | Early | n |
|---|---|---|---|---|---|---|---|
| 1 | Year | 0.01 | .94 | 10.13 | 2344.75 | 2133.25 | 4 |
| 3 | Stage | 0.00 | .97 | 161.45 | 4689.5 | 4266.5 | 2 |
| 5 | Type | 0.27 | .62 | 5.12 | 936.5 | 852.2 | 10 |
| 7 | Category | 1.88 | .20 | 5.12 | 937.9 | 853.3 | 10 |
| 9 | RCR | 0.03 | .90 | 161.45 | 4689.5 | 4266.5 | 2 |
| 11 | Country | 3.16 | .11 | 5.12 | 536.4 | 478.4 | 10 |
| 13 | Institute | 1.12 | .32 | 5.12 | 95.0 | 77.3 | 10 |
| 15 | Author | 0.12 | .74 | 5.12 | 5.5 | 6.1 | 10 |
| Over effect | 0.09 | .76 | 4.01 | 918.1 | 832.28 | 58 |
RCR = relative citation ratio in 2 low/high levels.
Critical cutting-point for F-value (if it < F-value), P-value would be less than .05.
The second hypothesis regarding no such increasing trend of publications observed in Medicine (Baltimore) was confirmed.
3.2. Part II: changes in h-indexes between collections
3.2.1. Citing journals clustered using SNA.
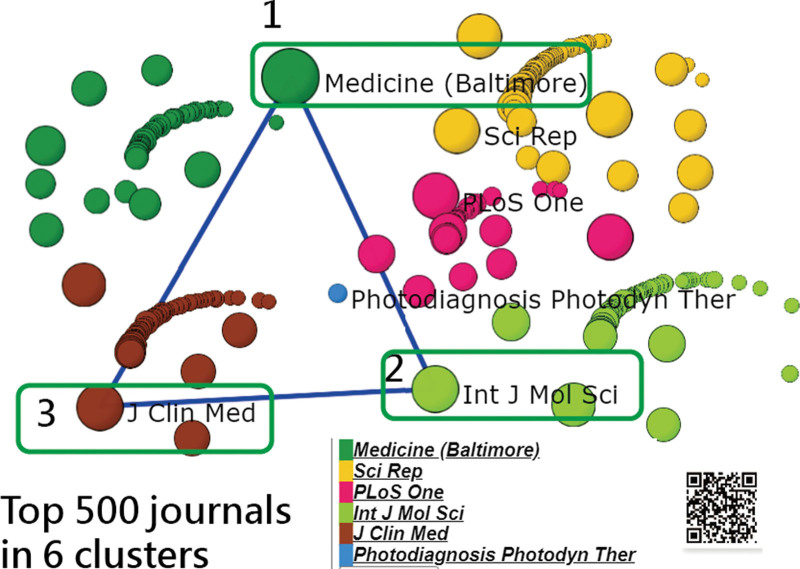
The largest bubble is indicated by Medicine (Baltimore) in green. The top 500 citing articles are shown in Figure 6. If we click on other green bubbles, we can see that the closest citing journals to Medicine (Baltimore) are Am J Transl Res, World Neurosurg, and J Int Med Res. The next 2 dominant journal clusters are Int J Mol Sci and J Clin Med. In Figure 6, 3 blue lines are connected and linked.
Figure 6.
Citing journals related to Medicine (Baltimore) based on referenced articles from 2018 to 2021 (note: coword analysis was performed to separate journals into 6 clusters denoted by the chief journal with highest number of weighted publications in each cluster; only bigger bubbles with higher weighted publications are present in this SNA diagram).
3.2.2. Comparison of differences in changes in the h-index in the 2 collections of SCI and SCE.
In Table 2, we observed 2 collections of SCI and SCE. We can see that the SCR was 5.69%. The h-indexes and impact factors did not differ between the 2 collections (e.g., h = 20 and IF = 2.9:2.74 with P = 1.0 and P = .27). The counts with the name of Medicine (Baltimore) per article were 0.25 (0.17 and 0.20 in the recent and early stages, respectively).
Table 2.
Comparison of metrics between scenarios and stages using 2-way ANOVA.
| Category | All | Recent | Early | P value | |
|---|---|---|---|---|---|
| *Row | *Column | ||||
| A. h-index | |||||
| 1. Self inclusion | 40 | 20 | 39 | ||
| 2. Self exclusion | 40 | 20 | 39 | 1.00 | 1.00 |
| B. Count & citation | |||||
| 3. Publication | 18,431 | 9546 | 8885 | ||
| 4. Citation in SCI | 53,528 | 11,336 | 42,192 | ||
| 5. Citation in SCE | 3044 | 637 | 2407 | ||
| 6. Citation in SSCE | 2145 | 381 | 1764 | ||
| C. Total citation | |||||
| 7. SCI | 53,528 | 11,336 | 42,192 | ||
| 8. SCI-SCE | 50,484 | 10,699 | 39,785 | ||
| 9. SCI-SSCE | 51,383 | 10,955 | 40,428 | .26 | <.001 |
| D. IF comparison | |||||
| 10. SCI (=4 ÷ 3) | 2.90 | 1.19 | 4.75 | ||
| 11. SCE (=5 ÷ 3) | 2.74 | 1.12 | 4.48 | ||
| 12. SSCE (=6 ÷ 3) | 2.79 | 1.15 | 4.55 | .27 | <.001 |
| E. SCR | |||||
| 13. SCR (%) (=5 ÷ 4) | 5.69 | 5.62 | 5.70 | ||
| 14. SCR (%) (=6 ÷ 4) | 4.01 | 3.36 | 4.18 | .12 | .43 |
| 15. Count per article | 0.25 | 0.17 | 0.20 | ||
Count per article = Count with the name of Medicine (Baltimore) per article = 0.25 = 3044/12057 = citations/counts when citations > 0, SCE = journal self-citations exclusion, SCI = total number of journal SC inclusion, SSCE = share of journal self-citations cited in previous 2 years.
* Row: among categories; *Column: between stages of recent and early.
It is expected that the impact factors in the early stage are higher than those in the recent stage due to the article age (see 4.75:1.19 and 4.48:1.12 for the 2 scenarios (P < .001)). Nevertheless, SSCE accounts for 70% (=2145/3044) of the SCE, which indicates a medium-citation proportion of articles published in the past 2 years.
The third hypothesis about the SCR in Medicine (Baltimore) being significantly lower(=5.69%) than the criterion of 15%[11] was also confirmed.
3.2.3. CC between the 2 scenarios.
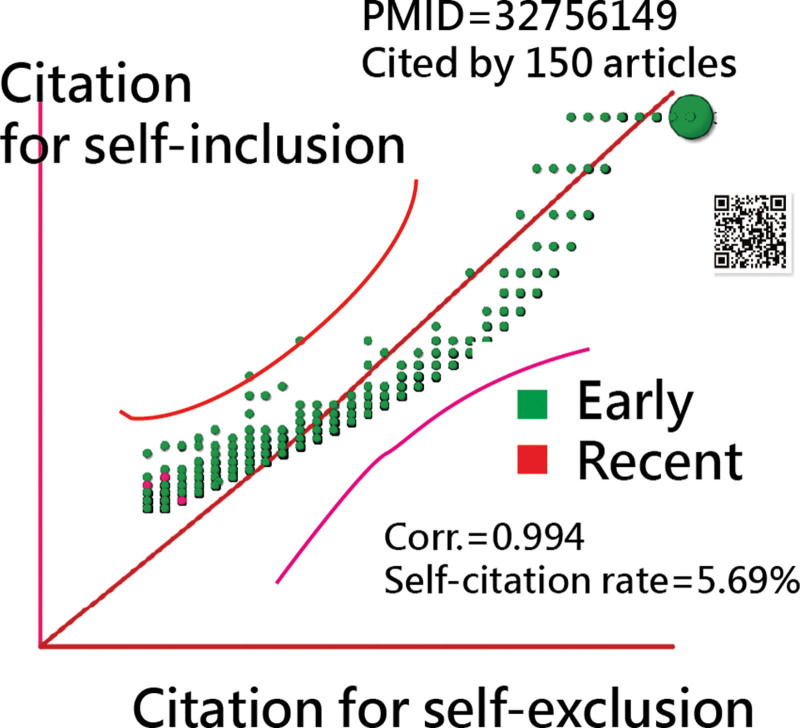
According to a comparison of SCE and SCI, the CC is 0.994 (Fig. 7). An article with PMID = 32756149[38] entitled Clinical remission of a critically ill COVID-19 patient treated by human umbilical cord mesenchymal stem cells in 2020 had 150 citations.
Figure 7.
Correlation coefficient between citations for self-inclusions and exclusions (note: numbers of citing articles in 2 scenarios of SI and SE are compared using a scatter plot to display).
3.2.4. Online dashboards shown on google maps.
All dashboards in Figures appear once the QR code is scanned and clicked. It is recommended that readers examine the details regarding each element in entities on the dashboard.
4. Discussion
4.1. Principal findings
We confirmed 3 hypotheses: the top ten elements in article entities simultaneously shown on the Sankey diagram; no such increasing trend of publications observed in Medicine (Baltimore); the SCR in Medicine (Baltimore) being significantly lower (=5.69%) than the criterion of 15%, based on the following findings: South Korea, Sichuan (China), and Beijing (China) accounted for the majority of articles in Medicine (Baltimore); ten categories were clustered and led by 3: methods, drug therapy, and complications; more articles (52%) were in the recent stage (2020–2021); no significant difference was observed between the 2 stages based on the top ten entities using the forest plot (Z = 0.05, P = .962) and 2-way ANOVA (F = 0.09, P = .76); the SCP was 5.69%; the h-index did not differ between the 2 collections of self-citation inclusion and exclusion; and SSCE (the gap between cited and citing articles within 2 years) accounted for 70% of the SCI (=SSCE + NonSSCE).
4.2. What this study adds to what was known
Using the 3 viewpoints evaluated in this study, a single glance tells a thousand words[23] to simplify the disclosure of study results using the Sankey diagram,[24,25] which has been employed in bibliometrics thus far.[34,39] In contrast to previous studies,[34,39] RCR[30] using normalized citation scores by years and disciplines was applied to compare the adjusted citations in binary categories (low/high); colorful thin-and-thick flows to interpret relations between the 2 adjacent neighbors; and 8 entities simultaneously displayed on the Sankey diagram, which had never been done before in the literature.
Accordingly, nodes and arcs in the Sankey diagram visualize the paths connecting related events (i.e., states, positions, or steps).[40] As transitions occur, each arc moves from its source node to its target node(s). In Figure 3, variable elements are numbered and labeled in order of size to make data easy to understand, especially in bibliometrics, where numerous Tables and Figures are required to interpret study results.
Sankey diagrams indicate the magnitude of flow based on the size of its nodes and the width of its arcs (e.g., a node with 5 members is half as tall as a node with ten members, and an arc transitioning 20 objects is twice as wide/tall as a ten-time transition arc). As shown in Figure 3, the nodes are stacked vertically and arranged by steps from left to right.
Moreover, no such increasing trend of publications was found in Medicine (Baltimore) using the forest plot and 2-way ANOVA to confirm that the counts in the 2 stages (early in 2018 and 2018 and recent in 2020 and 2021) were statistically equal. Medicine (Baltimore) publications from 2018 to 2021 are [4105, 4428, 5045, 4334], which are similar to those [1,345,983, 1,409,889, 1,627,152, 1,772,608] deposited in PubMed in the same period,[34] particularly the peak that occurred in the year of the COVID-19 pandemic.
Despite the fact that no differences between stages were found in the numbers of publications, the figures were derived from the ten top elements of the entities instead of the absolute numbers (e.g., 8885 and 9546 shown in Table 2) using forest plot and 2-way analysis of variance approaches. It is important to note that odds ratios calculated for the forest plot are based on proportional rather than absolute values. As a result, when using 2-way ANOVA, the data are limited to the ten top elements in entities instead of the entire set of data from the 2 stages.
In addition, the SCR (=5.69%) in Medicine (Baltimore) fell significantly below the threshold of 15%, indicating that the SCR in the previous 2 years (=4.01%) accounted for 70 percent of the SCE, a figure much lower than those in dentistry, oral surgery, and medicine between 2014 and 2016 (13.72%, 12.68%, and 10.66%, respectively).[34] The study[40] revealed that open-access journals tended to show lower SCR, and nonsignificant correlations (corr. = 0.3, P > .05) were found between SCR and impact factor, which differed from the 53 MDPI journals[10] whose impact factors were reduced in a range from 38.96% to 0.68% when self-citations were removed. Twenty-four MDPI journals out of 53 had self-citation rates exceeding 15% in 2019, which is the normality threshold set by Clarivate.[10]
In particular, the average time from submission to the first decision from MDPI journals was 19 days,[41] exceedingly slower than Medicine (Baltimore) at 77.5 days.[42] This is the reason why MDPI, like other journals, has recently been deemed a potential predatory journal in academics.[20,21]
4.3. What it implies and what should be changed?
This study, which is divided into 3 categories in 2 parts, offers guidance and support to bibliometrics regarding the use of visualizations and statistics, including traditional and advanced bibliometrics and changes in the h-index by observing the SCR.
In addition to the Sankey diagram discussed in the previous section, the application of SNA to cluster subject categories and journals in Figures 2 and 6 is a unique and modern representation that is essential to bibliographical studies. Using this approach replaces the traditional method that is inefficiently based on human classification.[39] According to the choropleth map in Figure 1, the US states and provinces/metrocities in China were separated so that they would be able to compete with other countries/regions. Otherwise, publications from the US or China would always dominate the choropleth map in bibliometric analysis.
Forest plots (Figs. 4 and 5) provide us with an interpretation of 2 panels (such as 2 stages in a column) in comparison, which is popular and familiar to meta-analysis readers. The scatter plot (Fig. 7) with 95% control lines is also unique in the literature. Readers are provided with the ability to manipulate the dashboard-type scatter plot on their own, allowing them to view more detailed information on elements in 2 kinds of variables (for example, early in green and recent in red).
In addition, MS-EXCEL allows 2-way ANOVA to be performed consecutively. An MP4 video of each MS-EXCEL module is provided in the link[37] for readers to practice them independently.
4.4. Limitations and suggestions
However, there are still some limitations to this study. First, the data were retrieved exclusively from PubMed. This study may have different results from other major citation databases, such as Scopus, Web of Science, and Embase. It should be noted that citing articles collected in PubMed would result in different SCRs in other bibliometric databases.
Second, to measure the research achievements shown in Figure 3, the authors used the article RCRs instead of traditional citations. The results may differ from the studies that used citations. Nevertheless, the RCRs are recommended for future research since the RCRs have been adjusted and normalized by years and disciplines, thus allowing citations to be compared based on years and disciplines. As a result, citations would always be in a decreasing trend because citations are increased by the aging of articles.
Third, except for Figure 3, all dashboards in Figures are displayed on Google Maps. Google Maps may not be used for free unless you use the application programming interface with a paid project key. In the absence of an application programming interface, the dashboard limitation is not publicly accessible. The process of making dashboards with MP4 video using Microsoft Excel is provided in the following link[34,37] that helps readers apply the procedures to other topics, not just that of the given journal as we did in this study.
Fourth, it is complex and tedious to handle the data arrangement in dealing with the extraction of citing journals matching PMIDs to calculate SCRs and SCRs based on the previous 2 years without a computer program. This module addresses the extraction of self-citation data, which is also deposited in the link.[37]
Finally, the Sankey diagram is also not simple, and it is easy to draw a sophisticated diagram, as shown in Figure 3. The computer program also has to be adjusted to fit the format of the software[43] we used in this study.
5. Conclusion
By visualizing the characteristics of a given journal, the breakthrough was made. Subject categories(namely, major themes) can be classified by using coword datasets built from article PMIDs and MeSH terms. It is recommended that future bibliographical studies conduct a 2-way analysis of variance to examine the publications (or other metrics, e.g., citations) from 2 stages as well as the change in h-indexes (or other bibliometric metrics) between 2 collections of self-citation inclusions or exclusions rather than relying exclusively on descriptive statistics as many bibliometrics did in the past.
Acknowledgments
We thank Enago (www.enago.tw) for English language revision.
Author contributions
MY and TWC initiated the research, collected data, conducted the analysis, and wrote the manuscript. WC contributed to the design of the study and provided critical reviews of the manuscript, and TWC contributed to the interpretation of the results.
Conceptualization: Mei-Yuan Liu.
Investigation: Willy Chou.
Methodology: Tsair-Wei Chien.
Abbreviations:
- ANOVA =
- analysis of variance
- CC =
- correlation coefficient
- h-index =
- Hirsch-index
- IF =
- impact factors
- MeSH =
- midical subject headings
- PMID =
- PubMed identity number
- RCR =
- relative citation ratio
- SC =
- self-citation
- SCE =
- self-citation exclusion
- SCI =
- self-citation inclusion
- SCR =
- self-citation rates
- SNA =
- social network analysis
- SSCE =
- share of SCE
All data are publicly available from the GitHub website. All methods were carried out in relevant guidelines and regulations.
The authors have no funding and conflicts of interest to disclose.
The datasets generated during and/or analyzed during the current study are publicly available.
How to cite this article: Liu M-Y, Chien T-W, Chou W. The Hirsch-index in self-citation rates with articles in Medicine (Baltimore): Bibliometric analysis of publications in two stages from 2018 to 2021. Medicine 2022;101:45(e31609).
Contributor Information
Mei-Yuan Liu, Email: m880419@mail.chimei.org.tw.
Tsair-Wei Chien, Email: smile@mail.chimei.org.tw.
References
- [1].Hirsch JE. An index to quantify an individual’s scientific research output. Proc Natl Acad Sci USA. 2005;102:16569–72. [DOI] [PMC free article] [PubMed] [Google Scholar]
- [2].Kung SC, Chien TW, Yeh YT, Lin JJ, Chou W. Using the bootstrapping method to verify whether hospital physicians have different h-indexes regarding individual research achievement: a bibliometric analysis. Medicine (Baltim). 2020;99:e21552. [DOI] [PMC free article] [PubMed] [Google Scholar]
- [3].Pfirrman SJ, Yheulon CG, Parziale JR. The Hirsch-index and self-citation in academic physiatry among graduate medical education program directors. Am J Phys Med Rehabil. 2022;101:294–7. [DOI] [PubMed] [Google Scholar]
- [4].Fenner T, Harris M, Levene M, Bar-Ilan J. A novel bibliometric index with a simple geometric interpretation. PLoS One. 2018;13:e0200098. [DOI] [PMC free article] [PubMed] [Google Scholar]
- [5].Googleblog. Google scholar metrics for publications. Available at: googlescholar.blogspot.com.br [access date October 2, 2022].
- [6].Jones T, Huggett S, Kamalski J. Finding a way through the scientific literature: indexes and measures. World Neurosurg. 2011;76:36–8. [DOI] [PubMed] [Google Scholar]
- [7].Google Scholar. The h5-index applied to journals. Available at: https://scholar.google.com.tw/citations?view_op=metrics_intro&hl=zh-TW [access date April 20, 2022].
- [8].Clarivate. Journal citation reports. Available at: https://jcr.clarivate.com/jcr/home [access date April 20, 2022].
- [9].Moussa S, Moussa S. A bibliometric investigation of the journals that were repeatedly suppressed from Clarivate’s Journal Citation Reports [published online ahead of print, 2022 May 6]. Account Res. 2022;1:21. [DOI] [PubMed] [Google Scholar]
- [10].Oviedo-García MA. Journal citation reports and the definition of a predatory journal: the case of the Multidisciplinary Digital Publishing Institute (MDPI). Res Eval. 2021;30:405–19. [Google Scholar]
- [11].Cahue M. Web of science core collection. Available at: http://thinkepi.net/notas/crecs_2017/J_9_45_Cahue.pdf [access date April 20, 2022].
- [12].Martin BR. Editors’ JIF-Boosting stratagems-which are appropriate and which not? Res Pol. 2016;45:1–7. [Google Scholar]
- [13].Lin JK, Chien TW, Yeh YT, Ho SY, Chou W. Using sentiment analysis to identify similarities and differences in research topics and medical subject headings (MeSH terms) between Medicine (Baltimore) and the Journal of the Formosan Medical Association (JFMA) in 2020: a bibliometric study. Medicine (Baltim). 2022;101:e29029. [DOI] [PMC free article] [PubMed] [Google Scholar]
- [14].Grudniewicz A, Moher D, Cobey KD, et al. Predatory journals: no definition, no defense. Nature. 2019;576:210–2. [DOI] [PubMed] [Google Scholar]
- [15].Frandsen TF. Are predatory journals undermining the credibility of science? A bibliométric analisis of citers. Scientometrics. 2017;113:1513–28. [Google Scholar]
- [16].Shen C, Björk BC. “Predatory” open access: a longitudinal study of article volumes and market characteristics. BMC Med. 2015;13:230. [DOI] [PMC free article] [PubMed] [Google Scholar]
- [17].Beall J. Predatory journals and the breakdown of research cultures. Inf Dev. 2015;31:473–6. [Google Scholar]
- [18].Demir SB. Predatory journals: who publishes in them and why? J Informetr. 2018;12:1296–311. [Google Scholar]
- [19].Rice DB, Skidmore B, Cobey KD. Dealing with predatory journal articles captured in systematic reviews. Syst Rev. 2021;10:175. [DOI] [PMC free article] [PubMed] [Google Scholar]
- [20].Zhihu. Blacklist of potential predatory journals. Available at: https://zhuanlan.zhihu.com/p/341984220 [access date April 22, 2022].
- [21].Tsai ML. What do tens of billions change every year? The significance of the positive list of academic journals with doubts in the National Taiwan University School of Medicine. Available at: https://www.twreporter.org/a/opinion-academic-journals-dispute-1 [access date April 22, 2022].
- [22].Block JH, Fisch C. Eight tips and questions for your bibliographic study in business and management research. Manag Rev Q. 2020. Available at: 10.1007/s11301-020-00188-4 [access date April 22, 2022]. [DOI] [Google Scholar]
- [23].Barnard FR. One look is worth a thousand words. Available at: http://www2.cs.uregina.ca/~hepting/projects/pictures-worth/1921-dec-08.html [access date April 22, 2022].
- [24].Lamer A, Laurent G, Pelayo S, El Amrani M, Chazard E, Marcilly R. Exploring patient path through Sankey diagram: a proof of concept. Stud Health Technol Inform. 2020;270:218–22. [DOI] [PubMed] [Google Scholar]
- [25].Yu B, Silva CT. VisFlow – web-based visualization framework for tabular data with a subset flow model. IEEE Trans Vis Comput Graph. 2017;23:251–60. [DOI] [PubMed] [Google Scholar]
- [26].Franck G. Scientific communication – a vanity fair? Science. 1999;286:53–5. [Google Scholar]
- [27].Fister I, Jr, Fister I, Perc M. Toward the discovery of citation cartels in citation networks. Front Phys. 2016;4:49. [Google Scholar]
- [28].Sunahara AS, Perc M, Ribeiro HV. Association between productivity and journal impact across disciplines and career age. Phys Rev Res. 2021;3:033158. [Google Scholar]
- [29].NIH. ICite tool. Available at: https://icite.od.nih.gov/analysis [access date October 2, 2022].
- [30].Hutchins BI, Yuan X, Anderson JM, Santangelo GM. Relative Citation Ratio (RCR): a new metric that uses citation rates to measure influence at the article level. PLoS Biol. 2016;14:e1002541. [DOI] [PMC free article] [PubMed] [Google Scholar]
- [31].Kan WC, Chou W, Chien TW, Yeh Y-T, Chou P-H. The most-cited authors who published papers in JMIR Mhealth and Uhealth using the authorship-weighted scheme: bibliometric analysis. JMIR Mhealth Uhealth. 2020;8:e11567. [DOI] [PMC free article] [PubMed] [Google Scholar]
- [32].de Nooy W, Mrvar A, Batagelj V. Exploratory Social Network Analysis with Pajek: Revised and Expanded. 2nd edn. New York, NY: Cambridge University Press, 2011. [Google Scholar]
- [33].Chien TW, Wang HY, Hsu CF, Kuo SC. Choropleth map legend design for visualizing the most influential areas in article citation disparities: a bibliometric study. Medicine (Baltim). 2019;98:e17527. [DOI] [PMC free article] [PubMed] [Google Scholar]
- [34].Kuo YC, Chien TW, Kuo SC, Yeh YT, Lin JJ, Fong Y. Predicting article citations using data of 100 top-cited publications in the journal Medicine since 2011: a bibliometric analysis. Medicine (Baltim). 2020;99:e22885. [DOI] [PMC free article] [PubMed] [Google Scholar]
- [35].Yang TY, Chen CH, Chien TW, Lai FJ. Predicting the number of article citations on the topic of pemphigus vulgaris with the 100 top-cited articles since 2011: a protocol for systematic review and meta-analysis. Medicine (Baltim). 2021;100:e26806. [DOI] [PMC free article] [PubMed] [Google Scholar]
- [36].Chien TW. Figure 3 in this study. Available at: http://www.healthup.org.tw/aif/aif.asp?mname=F3hTcountalluvial-02&width=2600&height=1600 [access date April 22, 2022].
- [37].Chien TW. The two-way ANOVA in an MP4 video. Available at: http://www.healthup.org.tw/article/course_mb2.asp?repno=32 [access date April 22, 2022].
- [38].Liang B, Chen J, Li T, et al. Clinical remission of a critically ill COVID-19 patient treated by human umbilical cord mesenchymal stem cells: a case report. Medicine (Baltim). 2020;99:e21429. [DOI] [PMC free article] [PubMed] [Google Scholar]
- [39].Liu PC, Lu Y, Lin HH, et al. Classification and citation analysis of the 100 top-cited articles on adult spinal deformity since 2011: a bibliometric analysis. J Chin Med Assoc. 2022;85:401–8. [DOI] [PubMed] [Google Scholar]
- [40].Harris RL. Information Graphics: A Comprehensive Illustrated Reference. New York, NY: Oxford University Press, 1999. [Google Scholar]
- [41].Livas C, Delli K. Journal self-citation rates and impact factors in dentistry, oral surgery, and medicine: a 3-year bibliometric analysis. J Evid Based Dent Pract. 2018;18:269–74. [DOI] [PubMed] [Google Scholar]
- [42].MDPI. MDPI Annual report 2019. Available at: https://res.mdpi.com/data/2019_web.pdf [access date April 22, 2022].
- [43].Otto E, Culakova E, Meng S, et al. Overview of Sankey flow diagrams: focusing on symptom trajectories in older adults with advanced cancer. J Geriatr Oncol. 2022;13:742–6. [DOI] [PMC free article] [PubMed] [Google Scholar]
- [46].Medicine. The average turnaround days from submission to the first decision. Available at: https://journals.lww.com/md-journal/Pages/aboutthejournal.aspx [access date April 22, 2022].
- [48].SankeyMATIC. Sankey software. Available at: https://sankeymatic.com/ [access date April 22, 2022].


