

Summary
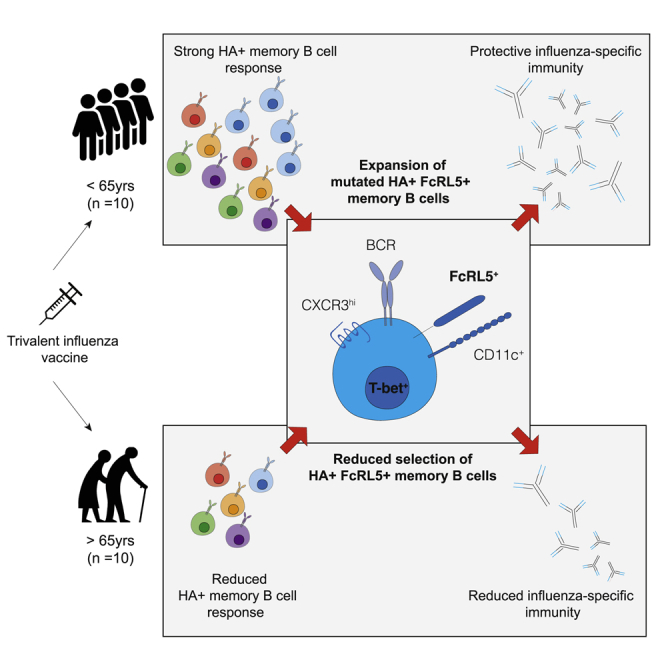
Influenza infection imparts an age-related increase in mortality and morbidity. The most effective countermeasure is vaccination; however, vaccines offer modest protection in older adults. To investigate how aging impacts the memory B cell response, we track hemagglutinin-specific B cells by indexed flow sorting and single-cell RNA sequencing (scRNA-seq) in 20 healthy adults that were administered the trivalent influenza vaccine. We demonstrate age-related skewing in the memory B cell compartment 6 weeks after vaccination, with younger adults developing hemagglutinin-specific memory B cells with an FcRL5+ “atypical” phenotype, showing evidence of somatic hypermutation and positive selection, which happened to a lesser extent in older persons. We use publicly available scRNA-seq from paired human lymph node and blood samples to corroborate that FcRL5+ atypical memory B cells can derive from germinal center (GC) precursors. Together, this study shows that the aged human GC reaction and memory B cell response following vaccination is defective.
Keywords: B cell, memory, vaccination, influenza, aging, antibody selection
Graphical abstract
Highlights
-
•
Heterogeneous HA-specific memory B cells expand post influenza vaccination
-
•
Older people have reduced expansion of HA+FcRL5+ B cells post immunization
-
•
HA+FcRL5+ B cells show evidence of germinal center selection
-
•
Positive selection of HA+FcRL5+ B cells is reduced in older individuals
Immune responses to vaccination wane with age. Burton et al. used single-cell RNA sequencing and flow cytometry of influenza-vaccine-specific B cells to delineate changes in B cell memory generation, antibody mutation, and their subsequent selection in older persons.
Introduction
Influenza is a global health challenge with a considerable health and economic impact each year (Putri et al., 2018), whereby older individuals are particularly vulnerable to severe disease (Paget et al., 2019). Older people have incomplete protection by vaccination, conferring an estimated 40% reduction in risk of influenza-like illness following immunization (Demicheli et al., 2018). An understanding of what underpins the age-related decline in protection from the influenza vaccine is an important step in developing rationally designed vaccines that are effective in the most vulnerable members of our communities (Pulendran and Davis, 2020).
The seasonal influenza vaccine is formulated annually to combat antigenic drift and shift within circulating influenza strains (Hilleman, 2002). Influenza infection is initiated when the influenza hemagglutinin (HA), a glycoprotein of the surface of the virion, binds sialic acid on host cells, facilitating viral entry. A key correlate of protection after influenza vaccination is the production of anti-HA antibodies that block this interaction and can neutralize the virus, stopping infection. The antibody response induced by seasonal influenza vaccines can be derived from multiple cellular pathways; from naive and/or memory B cells being (re-)activated to form either early short-lived extrafollicular plasmablasts or to enter the germinal center (GC) (Andrews et al., 2015; Avey et al., 2020; Henry et al., 2019; Tsang et al., 2014; Turner et al., 2020). Within the GC, B cells undergo clonal expansion and somatic hypermutation (SHM) of the genes encoding the B cell receptor, followed by affinity-based selection and differentiation into long-lived antibody-secreting cells or memory B cells that can provide protection against reinfection.
Healthy aging is associated with a change in the composition and function of the human immune system and impaired antibody production upon vaccination (Allen et al., 2020; Carr et al., 2016; Hill et al., 2021; Liston et al., 2016; Nakaya et al., 2015; Stebegg et al., 2020; Silva-Cayetano et al., 2020). Here, we use single-cell RNA sequencing (scRNA-seq) of HA-specific B cells after seasonal influenza vaccination to provide an in-depth understanding of the phenotype, clonality, and GC selection of vaccine-reactive B cells in older persons. We find the preferential expansion of a population of HA-binding atypical memory phenotype B cells in younger adults (22–36 years old) that does not occur to the same extent as in older people (67–86 years old). These atypical memory B cells show evidence of positive selection by the location and burden of somatic hypermutation in younger, but not older, adults, suggesting an impaired GC response in older persons. We provide support for the GC origin of a proportion of circulating atypical memory B cells upon influenza vaccination through clonal tracking of the progeny of human lymph node GC B cells in the blood. Together, these data provide evidence of an impaired GC reaction and memory B cell formation upon seasonal influenza vaccination in older people.
Results
Single-cell RNA sequencing of hemagglutinin-specific B cells before and after vaccination captures the diversity of the influenza-specific memory B cell population
To explore age-dependent changes in the humoral immune response, a cohort of healthy volunteers received the 2016–2017 trivalent seasonal influenza vaccine (TIV). Two age groups of volunteers were selected: 22–36 years old (n = 10) or 67–86 years old (n = 10). Venepuncture was performed immediately prior to vaccination (day 0), at day 7, and at day 42 after vaccination (Figure 1A), and sera and peripheral blood mononuclear cells (PBMCs) were collected to enable the analysis of antibody production and B cell subsets. All participants had H1N1 A/California09 neutralizing antibodies prior to vaccination, which were of similar titer between age groups (Figures 1B and S1A). We observed a significant increase in day 7 titers in the 22- to 36-year-old group, which was sustained at day 42 (Figure 1B). In the 67- to 86-year-olds, there was a non-significant trend toward increasing titers of neutralizing antibody over the first week post vaccination, consistent with previous studies (Henry et al., 2019; Nakaya et al., 2015). Consistent with lower antibody titers, fewer HA-specific antibody-secreting cells were detected in the blood of older people 7 days after vaccination (Figure 1C), with a similar trend for total vaccine-reactive plasma cells (Figure 1D).
Figure 1.

Single-cell sequencing of hemagglutinin-specific B cells to study the aged vaccine response
(A) Study design. Venepuncture performed on days 0 (just prior to 2016–2017 trivalent influenza vaccine immunization), 7, and 42. Peripheral blood mononuclear cells were isolated on the day of venepuncture and cryopreserved for later index sorting experiments.
(B) Hemagglutinin inhibition (HAI) assay titers from days 0, 7, and 42 are shown for 22- to 36-year-old or 67- to 86-year-old volunteers as open or grayed circles, respectively (n = 10 in both groups). Data are from one technical replicate (of two independent experiments).
(C and D) PBMC ELISpot at day 7 in both age groups for antibody-secreting cells after stimulation with HA (C) or TIV (D). Data are from eight experimental runs on separate days.
(E) Recombinant biotinylated hemagglutinin multimers conjugated with streptavidin-PE or streptavidin-APC allows the identification of hemagglutinin-specific B cells. Gated on live, singlet CD19+ lymphocytes. Full gating strategy is shown in Figure S1B.
(F) The proportion of hemagglutinin-binding B cells increases after vaccination, for both 22- to 36-year-olds or 67- to 86-year-olds. Proportion expressed as percentage of live B cells that did not bind free streptavidin. Data are from ten experimental runs on separate days.
(G) UMAP embedding of single-cell RNA sequencing from A/Cal09-specific B cells, n = 771 cells. UMAP projection based on the first 40 principal components using the features with the top 10% variance, after removal of low-quality cells (Figure S1) and size normalization by deconvolution. Louvain clustering finds five clusters. Sorts were performed on 10 days with all four conditions present. Ten library preparations were performed and sequenced as ten lanes.
(H) Cell-identity assignment based on published transcriptional profiles of 29 human immune subsets including the following B cell subsets: IgD+CD27− “naive,” IgD+CD27+ “non-switched Bmem,” IgD−CD27+ “switched Bmem,” IgD−CD27− “IgD−CD27−,” IgD−CD27+CD38+ plasmablasts “PB,” and plasmacytoid DCs. The following numbers of cells were identified: naïve, 120 cells; non-switched Bmem, 165 cells; switched Bmem, 144 cells; IgD−CD27− Bmem, 334 cells; plasmablast, 3 cells; plasmacytoid DCs, 1 cell. No cells were defined as T cells or members of other lymphoid or myeloid lineages.
(I–L) UMAP embedding as in (G), showing the logicle transformed index sort surface expression of IgD (I), CD27 (J), CD21 (K), and CD38 (L) proteins.
In (B), p values from paired two-tailed Wilcoxon signed-rank test (on log2 transformed data) are summarized: ns, p > 0.05; ∗p < 0.05. In (C) and (D), groups are compared with a two-tailed Mann-Whitney test. In (F), samples from the same individual are indicated with a gray line and p values shown are from a paired two-tailed Wilcoxon signed-rank test. In (G)–(J), the scales reflect the decimal log of the logicle transformed fluorescence intensity value.
To investigate how the composition of the memory B cell compartment is affected by age, we index-flow-sorted HA-specific B cells prior to and 42 days after seasonal influenza vaccination from all members of our cohort (Figure 1E, for gating strategy see Figure S1B). While both age groups increased the number of HA-specific B cells after vaccination (Figures 1F and S1C–S1E), the fold change (FC) after vaccination was larger in younger (median FC 3.07) than in older adults (median FC 2.04). We sequenced 952 individual HA-binding B cells using plate-based SMART-Seq (Picelli et al., 2014). After initial quality control (Figures S2A–S2D), we retained 789 individual B cells. Uniform manifold approximation and projection (UMAP) embedding identified a small outlier population of 18 cells that had a gene expression profile consistent with plasma cells, with high expression of PRDM1, IRF4, and XBP1 (Figures S2E–S2H). Analysis of their index sorting cell-surface phenotype showed high levels of CD38 and low CD20 (Figures S2I and S2J), with dim HA staining consistent with a plasma cell phenotype. These cells were excluded from downstream analyses to enable a focus on HA-specific B cells. After these quality control steps, 771 B cells were used for analysis, and no single person dominated the dataset at either time point (Figures S2K and S2L).
Within the transcriptomic profiles of HA-specific B cells, we found five clusters (Figure 1G) which could be separated from each other by several hundred putative marker genes (Figures S3A and S3B). To determine whether these five populations correspond to known B cell subsets, we used published single-cell transcriptional profiles of 29 different human immune subsets (Aran et al., 2019; Monaco et al., 2019) (Figure 1H). A single cell was called a plasmacytoid dendritic cell, whereas all others were classified as B cell subsets. To confirm this classification, we used our index sort information to confirm surface expression of selected proteins. Together, these suggested that UMAP cluster 4 (red, Figure 1G) were naive B cells, being both surface immunoglobulin D (IgD)+ (Figure 1I) and surface CD27− (Figure 1J). UMAP cluster 1 (blue, Figure 1G) was predominantly IgD−CD27− memory B (Bmem) cells by the transcriptional classifier (Figure 1H), and had low surface expression of CD21 protein (Figure 1K). The small number (three individual cells) of transcriptionally assigned plasmablasts (Figure 1H) expressed high levels of surface CD38 (Figure 1L), suggesting a cellular snapshot of partial differentiation toward plasma cells. These single-cell transcriptomes of HA-specific B cells therefore comprise both naive B cells and further differentiated subpopulations.
Single-cell transcriptomic profiles of hemagglutinin-specific B cells
To further assess the cellular identity of these UMAP clusters, we next examined putative marker genes for each cluster (Figures 2A, 2B, S3A, and S3B). To compare gene expression between UMAP clusters, we selected the 15 most significant comparisons between each cluster and any other (Figure 2A). We next assessed the three most discriminatory genes between each UMAP cluster and all others, alongside a supervised analysis with several biologically relevant B cell genes: activation markers (FCRL5, CD86, TNFRSF13B encoding TACI, FCER2, CD27, CD24), transcription factors (TBX21 encoding T-bet, BCL6, PRDM1, PAX5), chemokine receptors (CCR7, SELL, CXCR3, CXCR4), and components of the DNA repair and SHM machinery (XRCC6, AICDA) (Figures 2B and S3C). UMAP cluster 1 (blue, Figure 1E) was characterized by the expression of FCRL5, FCRL3, ITGAX, and CD86 (Figures 2A, 2B, and S3) and lack of CCR7 and SELL (Figures 2A, 2B, and S3). While TBX21 appears restricted to the FCRL5+ population (Figure 2B), pairwise comparisons for TBX21 do not reach statistical significance (false discovery rate [FDR] adjusted p = 0.15). This FCRL5+ population appears analogous to a population of atypical memory B cells seen after malaria challenge (Kim et al., 2019), increased in autoimmune disease (Rubtsov et al., 2011), and aging (Hao et al., 2011; Rubtsov et al., 2011), and similar to the influenza vaccine-responding cells described in younger persons (Horns et al., 2020). Naive B cells (UMAP cluster 4), expressed high levels of characteristic markers of naive B cells in other gene expression datasets: TCL1A (Nagumo et al., 2009), YBX3 (Horns et al., 2020; Longo et al., 2009), and IL4R (Figures 2A, 2B, and S2). Clusters 2, 3, and 5 were less distinct on UMAP embedding (Figure 1G) and less clearly defined by single putative marker genes (Figures 2A and 2B). For clarity within the text and figures, we refer to these clusters as MALAT1+ (FDR adjusted p = 3.53 × 10⁻¹⁶), LY9+ (FDR adjusted p = 1), and MARCKS+ (FDR adjusted p = 0.23), respectively.
Figure 2.

Transcriptional landscape is altered between young and old HA-specific memory B cells
(A) Heatmap showing expression of the top 15 features from t tests distinguishing each UMAP cluster from any other cluster (FDR < 0.01, log2 fold change >2). Each row is a feature (n = 76) and its gene symbol is shown. Each column is a single cell (n = 771). Cells are ordered by UMAP cluster, as shown in the color bar above the heatmap. The 15 features with the largest fold changes were selected with tied positions allowed, and a feature could appear in more than one comparison. Features that did not map to a gene symbol and duplicated features were removed prior to plotting. Log2 expression values are row-normalized and centered.
(B) Dot plot showing the expression of selected genes in each UMAP cluster. The size of the dot reflects the proportion of cells within that cluster which express the gene of interest. The color of each dot is scaled according to normalized expression of the given gene in that cluster. Genes were selected as follows: the top two genes from a t test comparison between each cluster from all other clusters (log2 fold change >0.5, FDR < 0.25); biologically relevant B cell genes: selected genes from (A), B cell transcription factors, DNA repair proteins, B cell chemokine receptors, and other B cell surface receptors.
(C) Diffusion coefficient (DC)-based pseudotime analysis from A/Cal09-specific B cells from day 42. Cells are shaded based on their position in pseudotime. Nodes are plotted in red and paths are shown by straight lines.
(D) Pseudotime analysis as in (C), with colors determined by the UMAP clusters in (A) and defined in Figure 1.
(E) Box plots of the numbers of cells within each UMAP cluster comparing day 0 and day 42 cell numbers sorted for 22- to 36-year-old and 67- to 86-year-old individuals. Clusters are labeled with putative surface marker genes shown in (B). p values from two-tailed paired Mann-Whitney tests are shown, after Benjamini-Hochberg correction for five tests.
(F) Volcano plots from differential abundance analysis for the whole study (“all”) or the two age groups individually. Shown are −log10 (Benjamini-Hochberg) FDR and log2 fold change (L2FC). Gray dashed lines are shown at −log10(0.05) and at L2FC ± 0.5.
To infer pathways of differentiation in circulating antigen-specific B cells, we performed trajectory analysis (Figures 2C and 2D). Pseudotime starts adjacent to naive B cells and progresses along two paths (Figure 2C). One path is toward the MALAT1+ cluster. The second path progresses through FCRL5+ cells and then to the three plasmablasts that are co-clustered with MARCKS+ cells, suggesting that FCRL5+ atypical Bmem cells differentiate from naive B cells. This cellular differentiation is unlikely to be direct; it could occur after naive cells home to the B cell follicle in the draining lymph node, and it is likely to involve intermediate phenotypes—perhaps GC B cells or their precursors—as we have sampled the circulating precursor and progeny populations in blood.
Of all the HA-specific B cells sequenced, there was an increased number of MARCKS+ Bmem and FCRL5+ atypical Bmem cells after vaccination, although the increase in FCRL5+ atypical Bmem cells was not significant in older persons (Figure 2E). To adjust for the number of cells sorted at each time point, we performed differential abundance analysis (Figure 2F), confirming an increase of MARCKS+ and FCRL5+ cells in 22- to 36-year-olds and not in 67- to 86-year-olds after vaccination. We confirmed this using miloR (Dann et al., 2022), a method for analysis of differential abundance of neighborhoods of cells that mitigates against misassigned cluster calls (Figure S4). A possible cause for the lack of an expansion of FCRL5+ cells in older individuals could be the presence of pre-existing memory cells which inhibit the development of an FCRL5+ subpopulation. However, we did not find any differences at day 0 between 22- to 36-year-olds and 67- to 86-year-olds in either the total or HA-specific memory B cell compartment (Figure S5). These data indicate that the aged immune system does not generate Bmem cells upon vaccination to the same extent as in younger people, including FCRL5+ atypical B cells that have previously been reported to accumulate in older individuals (Hao et al., 2011; Rubtsov et al., 2011).
FcRL5+ hemagglutinin-binding B cells have cellular heterogeneity after vaccination
Flow-cytometric analysis of an extended cohort of healthy adults immunized with TIV during the 2016–2017 season (18–36 years old, n = 11; 66–89 years old, n = 8; Figure 3A) was conducted to verify the RNA-seq data. Of the extended cohort, six younger and four older individuals overlapped with the original scRNA-seq participants (Figure S6 shows data from the non-scRNA-seq samples only). HA-specific B cells increased from day 0 to day 7 following vaccination to a similar frequency observed previously and to a lesser degree in older individuals (Figures 3B and S6B). Total plasmablasts increased 7 days post vaccination, with a trend toward a greater frequency within younger compared with older donors (Figures 3C and S6C). FcRL5+ HA-specific B cells significantly expanded from day 0 to day 7 post vaccination and were maintained by day 42 in younger donors (Figures 3D, 3E, and S6D). Older donors showed a comparatively smaller increase in HA-specific FcRL5+ B cells 7 days post vaccination, resulting in significantly fewer HA-specific FcRL5+ B cells by day 42 in older compared with younger donors (Figures 3F and S6E).
Figure 3.

FcRL5+ hemagglutinin-binding B cells have cellular heterogeneity after vaccination
(A) Hemagglutinin-specific B cells were analyzed using multiparameter spectral flow cytometry in a set of younger (18–36 years old, n = 11) and older (66–89 years old, n = 8) receiving trivalent influenza vaccination (three independent experiments).
(B) Representative plots and summary data showing the frequency of hemagglutinin-specific B cells at day 0 compared with day 42 post vaccination in younger (18–36 years old, n = 11) and older (66–89 years old, n = 8) receiving trivalent influenza vaccination (three independent experiments).
(C) Representative plots and summary data showing the frequency of total plasmablasts (CD27hiCD38hi) at baseline, 7, and 42 days post vaccination in younger (18–36 years old, n = 11; white dots) and older (66–89 years old, n = 8: gray dots) donors (three independent experiments).
(D) Example flow plot showing expression of FcRL5 on dual-staining hemagglutinin-specific B cells.
(E) Paired analysis of FcRL5+ hemagglutinin-specific B cells at baseline, 7 days, and 42 days post vaccination in younger (18–36 years old, n = 1; white dots) and older (66–89 years old, n = 8: gray dots) donors (three independent experiments).
(F) FcRL5+ hemagglutinin-specific B cells at baseline, 7 days, and 42 days post vaccination in younger (18–36 years old, n = 11; white dots) and older (66–89 years old, n = 8; gray dots) donors (three independent experiments).
(G) t-SNE clustering analysis of all hemagglutinin-specific B cells across the time course of vaccination in both younger (18–36 years old; n = 11) and older (66–89 years old; n = 8) donors (three independent experiments).
(H) Heatmap showing expression of markers defining seven clusters of hemagglutinin-specific B cells. Darker red shading indicates higher expression.
(I) t-SNE analysis in (G) stratified by age and time point before or after vaccination.
(J) Summary data showing the percentage prevalence of each cluster according to age group and days since vaccination.
(K) Prevalence of each cluster (clusters 1, 4, and 3) stratified by time point post vaccination and age.
In (B) and (E), p values are from Wilcoxon signed-rank tests. In (C) and (F), p values are from Mann-Whitney tests. In (K), p values are from a Kruskal-Wallis test.
To further investigate the phenotype and kinetics of these HA-specific B cells, we performed t-distributed stochastic neighbor embedding (t-SNE) analysis of HA-specific B cells at all sample time points in both younger and older donors. t-SNE identified seven clusters of circulating HA-specific B cells (Figures 3G and 3H). These clusters represented CD10+CD24hiCD38hi immature transitional B cells (Cluster 07), a CXCR4+ IRF4+ plasmablast-like population (Cluster 06), CD27+IgD−IgM− class-switched Bmem cells (Cluster 02), CD27+CD38+CD71+ B cells (Cluster 05) similar to antibody-secreting cells described elsewhere (Ellebedy et al., 2016), and CD27+CD71+T-betint cells (Cluster 04) with similarities to CD71+ Bmem cells described previously (Sutton et al., 2021). Two clusters were defined by high expression of FcRL5 and T-bet and showed temporal differences across the response to vaccination (Figures 3H–3K). These segregated into CXCR3hiCD11cintCD27+CD21int B cells (Cluster 01), which transiently increased 7 days post vaccination, and a CD11chiCD27−CD21− fraction (Cluster 03) that peaked by day 42 post vaccination (Figures 3H–3K). Of note, cluster 03 most closely resembled the FCRL5+ cluster described with scRNA-seq. Although the number of FcRL5+ cells was significantly reduced in older compared with younger donors, the proportion of each cluster within the antigen-specific pool was comparable between age groups (Figure 3K). These data suggest that atypical memory B cells may be a heterogeneous population with differing kinetics following vaccination.
Hemagglutinin-specific B cell receptor repertoires display age-associated differences
We next assessed the B cell receptor (BCR) of the sorted Bmem cells for age-associated differences. The MARCKS+ and FCRL5+ populations were largely class switched to IgG or IgA, and naive cells were predominantly IgM positive (Figures 4A and 4B). While naive cells express IgM and IgD transcripts, with surface IgD protein (Figure 1G), the IgM transcript has a higher expression per cell than IgD, favoring the assignment of naive cells as IgM+ in silico (Figures 4A and 4B). The distribution of V segment family usage at day 42 was altered between the two age groups (Figure 4C, p = 0.002 by Fisher’s test), with IGHV4 more frequently used in BCR heavy chains in younger individuals. V segment family usage was not altered between B cell subsets as defined by UMAP clusters (Figure 4D). We next assessed heterogeneity in the usage of V segments at the allele level, where we found age-related differences (Figure 4E, p = 0.019 by Fisher’s test). IGHV4-39 was enriched in HA-specific cells from 22- to 36-year-old participants and has been previously reported to be a common V segment used by several broadly neutralizing antibodies against pdm1H1N1 (Thomson et al., 2012). The most common IGHV allele in both age groups was IGHV3-23, a V segment associated with polyreactive HA antibodies (Guthmiller et al., 2020). The second most common allele in both age groups was IGHV1-69, the V segment most commonly used in broadly neutralizing antibodies (bnAbs) to influenza A strains (Lingwood et al., 2012; Chen et al., 2019). IGHV1-69 bnAbs have been described after viral illness (Wrammert et al., 2011) and seasonal influenza vaccination (Nakamura et al., 2013). The consensus properties are phenylalanine at position 54, within the CDR2; a preceding hydrophobic residue at position 53; and a tyrosine at positions 97, 98, 99, or elsewhere within CDR3 (Avnir et al., 2014). From these parameters we predicted the bnAb capabilities of the IGHV1-69+ B cells within our study (Figure 4F). These rare bnAb B cells appeared to expand in 22- to 36-year-olds after TIV but not in 67- to 86-year-olds (Figure 4G), with a tendency for the 22- to 36-year-olds to expand IGHV1-69 bnAb-expressing B cells with FCRL5+ atypical Bmem transcriptional profiles (Figure 4H). These data support the observation that serial TIV administration in aged individuals may not expand stem-directed bnAb (Andrews et al., 2015). Corresponding analyses for day 0 IGHV alleles implied a tendency to more cells bearing IGHV1-69 BCRs at day 0 in older individuals, and fewer IGHV3-23 (Figure S7), which must be interpreted cautiously, as the absolute numbers of circulating cells available for sequencing at day 0 is low (Figure S2K). These data suggest that older individuals have an altered vaccine-responding IGHV repertoire.
Figure 4.

Differences in heavy-chain V segment usage, including broadly neutralizing IGHV1-69, in aged individuals after TIV immunization
(A) UMAP embedding as previously, showing secreted immunoglobulin classes of that cell’s most abundant immunoglobulin heavy-chain transcript. Isotypes are combined to immunoglobulin class (e.g., IgG1, IgG2, IgG3, IgG4 grouped as IGHG): IGHA, n = 48 cells; IGHD, n = 12 cells; IGHG, n = 217 cells; IGHM, n = 112 cells; Un, unassigned n = 272 cells.
(B) For each UMAP cluster, the proportion of secreted immunoglobulin classes are plotted. Each immunoglobulin class is indicated with the same shading as in (A).
(C) V segment family usage in the immunoglobulin heavy chain at day 42 for younger and older individuals.
(D) V segment family usage by HA-specific immunoglobulin heavy chains at day 42 for younger and older individuals expressed as the proportion of the cells separated by each UMAP cluster.
(E) V allele usage in the immunoglobulin heavy chain at day 42 for younger and older individuals.
(F) Heatmap summarizing the presence of biophysical attributes characteristic of broadly neutralizing antibody for IGHV1-69 B cells. The presence of F54, a hydrophobic residue at 53 and a tyrosine at 97, 98, or 99 are shown. An antibody is expected to be a bnAb if F54, there is a hydrophobic residue at position 53, and a Y within the CDR3. Presence of a characteristic is shown by a green box, and empty boxes reflect its absence. On the left side of the panel, the age group of the cell is shown (cells from 18- to 36-year-olds and 65- to 98-year-olds in white and gray, respectively), and the day of the sample is shown (day 0 and day 42 in white and black, respectively). The individual identifiers are listed next to each row and some individuals.
(G) The proportion of B cells from each study day that encode IGHV1-69 bnAbs. Only those individuals with paired data from day 0 and day 42 are shown, which required >1 successfully filtered B cell with a productive heavy chain on both days. BnAbs were defined as shown in (F). Gray lines link the same individual. Paired two-tailed Mann-Whitney p values are shown.
(H) The proportion of IGHV1-69 B cells within each UMAP cluster for both age groups and on days 0 and 42 after TIV.
The stringency of selection somatic hypermutation variants is reduced in older persons
Within the GC, B cells undergo SHM followed by selection, enabling B cells with improved capacity to bind antigen to exit the GC as memory B cells or antibody-secreting cells. The SHM frequency and selection of HA-binding B cells was assessed in all B cell subsets. In both age groups there was an increase in the number of mutations in the heavy chain from day 0 to day 42, indicative of GC participation after vaccination (Figure 5A). At day 42, there were no differences at between 22- to 36-year-olds and 67- to 86-year-olds in the number of IgH mutations within framework (FR, Figure 5B) or complementarity-determining regions (CDR, Figure 5C). These data confirm that the processes of SHM are intact in vaccine-responding B cells from older vaccinees (Banerjee et al., 2002; Dunn-Walters, 2016; Lazuardi et al., 2005). The replacement (R) to silent (S) ratio in the heavy chain was higher in the CDR than in the FR regions, consistent with positive selection of mutations in the antigen-binding region (Mann-Whitney p = 1.3 × 10⁻³⁵ at day 42). There were no differences between age groups in the R/S ratios in the whole heavy chain (Figure 5D) or the FR (Figure 5E), or CDR regions at day 0 or day 42, when all HA-specific B cell types were analyzed together (Figures 5F and S8A–S8F).
Figure 5.

Somatic hypermutation is reduced in hemagglutinin-specific memory B cells from aged individuals after TIV immunization
(A) The number of nucleotide mutations within the antibody heavy chain is shown for each cell for days 0 and 42 and for older and younger individuals (n = 10/group).
(B and C) The number of nucleotide mutations within the antibody heavy chain is shown for each region at day 42 and for older and younger individuals for FR (framework regions, B) or CDR (complementarity-determining regions, C).
(D) The ratio of replacement/silent mutations within the antibody heavy chain is shown for each cell for days 0 and 42 and for older and younger individuals. The replacement/silent ratio was calculated as number of replacement mutations/(number of silent mutations + 0.01), as many cells had zero silent mutations and ≥1 replacement mutations.
(E and F) The ratio of replacement/silent mutations within the heavy chain is shown for each cell from day 42 from both age groups (n = 10/group).
(G and H) The number of mutations in the antibody heavy chain at day 42 plotted by age group for each UMAP cluster, for FR (G) or CDR (H).
(I and J) The ratio of replacement/silent mutations in the antibody heavy chain at day 42 plotted by age group for each UMAP cluster, for FR (I) or CDR (J). Data are from ten younger and ten older people.
In (G)–(J), each UMAP cluster is labeled and the colors correspond to its appearance in Figures 1, 2, and 4. For (E), (F), (I), and (J), the ratio of replacement/silent mutations was calculated as in (D) and plotted as a pseudolog. In (A)–(J), p values from two-tailed unpaired Mann-Whitney tests are shown. Where data are transformed for plotting (E, F, I, J), the test was performed on the untransformed data. The box plots show the median, and interquartile range (IQR), with whiskers extending to the furthest data point, up to a maximum of 1.5× IQR. In (E), (F), (I), and (J), the box plots correspond to the median and IQR of the transformed data.
To understand the mutation and selection of different HA-specific B cell subsets, we focused our SHM analyses on the two populations with the highest rate of class-switch recombination, MARCKS+ and FCRL5+, with the naive population as a control. The highest numbers of mutations were found in MARCKS+ and FCRL5+ clusters, with the lowest found in the cluster of naive cells (Figures S8G–S8J and S9). We found no difference between age groups in the number of IgH mutations in the FR or CDR in either Bmem subset (Figures 5G and 5H). While the R/S ratios within the framework regions were unchanged between age groups (Figure 5I), there was a decrease in the R/S ratios within the CDR in FCRL5+ B cells from older compared with younger individuals (Figure 5J). This indicated that positive selection of this B cell subset after vaccination was impaired in aging, similar to data from Peyer’s patches from older persons (Banerjee et al., 2002). Furthermore, these data suggest a potential GC origin of human FcRL5+CD21− atypical memory B cells after vaccination.
FCRL5+ B cells are antigen experienced and include GC emigrants
The attributes of selection and expansion of antigen-specific B cells are hallmarks of passage through the GC, prompting the hypothesis that FCRL5+ Bmem cells are a circulating output of the GC. To explore whether FCRL5+ Bmem cells are GC progeny requires paired sampling of the draining lymph node and blood at various time points post vaccination, with single-cell transcriptomics to both identify GC B cells and retrieve BCR sequences to fate-map GC B cells into their circulating daughter populations. We therefore reanalyzed the dataset of Turner et al. (2020), in which a healthy 29-year-old man underwent serial fine-needle aspirates (FNAs) of his axillary lymph node with paired venepuncture, immediately before and on days 5, 12, 28, and 60 after receiving a quadrivalent influenza vaccine (QIV). First, all FNA time points were analyzed and, within the B cell compartment (defined in Figures S10A and S10B), GC B cells were identified (Figures 6A and S10C). GC B cells were ∼3% of all B cells within the lymph node FNA (Figure 6A). We used the B cell receptors of day 12 GC B cells to find daughter B cells in the circulation and lymph node (Figure 6B). Around 3% of all day 12 lymph node B cells were found to share a BCR with GC B cells (Figure 6B). Next, we identified B cells within the IgD− PBMC samples (Figures S10D and S10E) and performed dimensionality reduction analysis (Figure 6C). We identified four clusters in the circulation, which we annotated based on the expression of B cell marker genes for naive B cells, resting memory B cells, plasma cells, and FCRL5+ Bmem cells (Figure 6D). Restricting our analysis to the circulating GC daughter cells identified in Figure 6B, we found that the circulating cells clonally related to the GC sampled at day 12 post vaccination were predominantly of an FCRL5+ Bmem phenotype (Figure 6E), with over 60% of all GC-derived circulating B cells having a Bmem phenotype at day 28 after QIV (Figure 6F). These circulating FCRL5+ Bmem cells have high levels of SHM, favoring replacement CDR mutations (Figures S10F and S10G). This reanalysis suggests that FCRL5+ Bmem cells can be GC derived.
Figure 6.

GC emigrant memory B cells are FCRL5+
(A) UMAP of B cells (n = 27,265 cells) from fine-needle aspirates (FNAs) of draining axillary lymph nodes from a single healthy volunteer on days 0, 5, 12, 28, and 60 after quadrivalent influenza vaccine (QIV), as reported by Turner et al. (2020).
(B) The B cell receptors detected in GC (GC) B cells on day 12 after QIV immunization are shared with earlier lymph node (LN) B cells, and are detectable in peripheral blood mononuclear cells (PBMC) that have been enriched for B cell memory (IgD−) at days 28 and 60 post vaccination.
(C) UMAP of circulating B cells (n = 21,568 cells) from IgD− enriched PBMCs at days 0, 5, 12, 28, and 60 after QIV. Clusters were identified by Louvain clustering and annotated based on (D).
(D) Dot plot showing the scaled normalized expression of selected genes used to annotate the clusters identified in (C).
(E) UMAP of circulating QIV-specific B cells from IgD− enriched PBMCs at day 28 which share a GC BCR, n = 38 cells.
(F) The percentage of QIV-specific B cells, present in the circulation at day 28, as in (E), is shown for each B cell cluster.
Discussion
Aging is associated with a decline in the efficacy and quality of the humoral immune response to infection and vaccination, resulting in incomplete protection from infection. In this study we use the trivalent influenza vaccine and HA labeling to track vaccine-specific B cells before and after immunization of younger and older persons. We show that the formation of Bmem cells is attenuated in individuals aged 67–86 years old, including the impaired formation of FCRL5+ B cells that have the transcriptional signature characteristic of T-bet+ B cells (Li et al., 2016), collectively referred to here as “atypical memory B cells.” Using publicly available paired PBMC and FNA single-cell sequencing (Turner et al., 2020), we suggest that a portion of FCRL5+ B cells are circulating progeny from the GC reaction. Together, our data show that atypical memory B cells expand to a lesser degree in older persons and show reduced evidence of positive selection, indicative of impaired GC function following vaccination in older people.
Populations of non-classical T-bet+ Bmem cells, commonly termed “atypical” or “age-associated” memory B cells, with impaired function compared with conventional CD27+ Bmem cells, have been described in the context of aging (Hao et al., 2011; Rubtsov et al., 2011), chronic infection (Burton et al., 2018; Moir et al., 2008; Portugal et al., 2015), and autoimmunity (Rubtsov et al., 2011). While HA-specific FcRL5+ B cells identified here display many overlapping features with dysfunctional B cells, our study and others (Andrews et al., 2015; Sutton et al., 2021) suggest that FcRL5+ B cells form part of a “typical” immune response following vaccination associated with robust recall responses to infection (Kim et al., 2019) and with intact capacity to undergo class-switch recombination (Weiss et al., 2009; Muellenbeck et al., 2013; Portugal et al., 2015; Li et al., 2016) and SHM (Muellenbeck et al., 2013; Portugal et al., 2015). These results contrast with accumulations of dysfunctional CD21low B cells associated with aging. We propose that this discrepancy is likely due to the investigation of vaccine-specific responses here, as opposed to the polyclonal B cell response.
Influenza vaccination has previously been shown to induce populations of antigen-specific CD21low B cells in younger cohorts (Andrews et al., 2015; Ellebedy et al., 2016; Lau et al., 2017), which are transcriptionally primed for plasma cell differentiation (Knox et al., 2017; Lau et al., 2017) and express high levels of T-bet (Johnson et al., 2020), often in conjunction with FcRL5 (Nellore et al., 2021). Our pseudotime analysis of vaccine-induced HA-specific memory B cells intimated a transcriptional trajectory of naive B cell differentiation into FcRL5+ memory B cells, then to cells of a pre-plasmablast phenotype, lending support to the hypothesis that FcRL5+ memory B cells give rise to antibody-secreting plasma cells (Kenderes et al., 2018).
FCRL5+ B cells from older individuals showed evidence of reduced positive selection, despite comparable levels of class-switch recombination and somatic hypermutation between older and younger individuals. These data support several reports suggesting that while the mechanism of somatic hypermutation is intact in aging, selection after mutation is impaired (Banerjee et al., 2002; Dunn-Walters, 2016; Lazuardi et al., 2005). Likely B cell extrinsic factors, such as the altered differentiation and phenotype of GC-T follicular helper (Tfh) cells in both aged humans and mice (Lefebvre et al., 2012; Stebegg et al., 2020; Webb et al., 2021), or reduced activation (Aydar et al., 2002) and ability of the aged follicular dendritic cell network to hold immune complexes on its surface (Turner and Mabbott, 2017), are responsible for the impaired selection in aging.
The routes to FcRL5 expression and acquisition of an atypical memory phenotype are incompletely understood and likely context specific (Burton and Maini, 2021). Our analysis of the data reported in Turner et al. (2020) found relatively low levels of FCRL5 transcript expression by GC B cells, suggesting that FCRL5 expression may be gained either by positively selected cells on their egress from the GC or by antigen-specific B cells after B:T cell interaction on the edge of the follicle. Persistent antigen stimulation, combined with type I interferon signaling and innate receptor sensing (Jenks et al., 2018; Portugal et al., 2015), are hypothesized to drive the polarization and differentiation of atypical memory B cells, either by directly altering differentiation programs within the B cell compartment or via an intermediary cell population. One such subset may be specialized Th1-polarized Tfh cells, shown to correlate with the frequency of CD21loCD27+ B cells following influenza vaccination (Koutsakos et al., 2018), with Tfh co-stimulation, interleukin-21, and interferon-γ among factors postulated to drive T-bet expression in B cells (Austin et al., 2019; Naradikian et al., 2016; Russell Knode et al., 2017). FcRL5 expression appears relatively stable, with antigen-specific FcRL5+ memory B cells shown to persist by 118 days following vaccination in mice (Kim et al., 2019).
Alternatively, T-bet+ B cells have been associated with activation of the extrafollicular response (Austin et al., 2019). In our study, HA-specific FcRL5+ B cells could be divided into a T-bet+CXCR3hiCD11cint and T-bet+CD11chiCD27−CD21− subpopulations that expanded with different kinetics throughout the response to vaccination. The transient expansion of T-bet+CXCR3hiCD11c+ B cells we observed at day 7 may therefore comprise a GC-independent memory subset, in line with similar data demonstrating expansion of T-bet+CD11c+(CXCR3+) B cells prior to and independently of the GC reaction (Song et al., 2022). Therefore, it is possible that “atypical Bmem” generation occurs via the extrafollicular and GC pathways in tandem, with their relative flux determining the fate of peripheral B cell subsets.
In summary, we report a defect in the differentiation and expansion of vaccine-specific Bmem following immunization in older persons. Importantly, this work identifies a defect in the expansion of FcRL5+ Bmem in older people following seasonal influenza vaccination. Understanding how Bmem cell formation and recall is altered with age is central to understanding how we can harness vaccinations to provide effective and durable protection against infection in older people, a population at high risk of mortality and morbidity from infections.
Limitations of the study
Here we analyzed hemagglutinin-binding B cells in order to focus on the response to acute vaccination rather than the entire memory B cell compartment that reflects an individual’s immune history, as this can be a confounder in studies seeking to understand aging. This focus comes with the challenge that circulating antigen-specific cells are rare, particularly before vaccination. Our study comprised three blood samples within a 42-day period, limiting sampling to 50 mL per bleed. The consequence of this is that there is a limit on the number of cells that can be analyzed. In our reanalysis of the dataset in Turner et al. (2020), we used the publicly available data from a single individual who was non-randomly selected for their high rate of shared BCRs between circulating and lymph node B cells at 1 week after QIV. BCR sharing was highly variable in the donors assessed (n = 3) (Turner et al., 2020), so it is possible that our reanalysis has an inflated estimate of clonal sharing.
STAR★Methods
Key resources table
| REAGENT or RESOURCE | SOURCE | IDENTIFIER |
|---|---|---|
| Antibodies | ||
| PE/Fire™ 810 anti-human CD197 (CCR7) Antibody | BioLegend | Clone: G043H7; RRID: AB_2894572; Cat#353269 |
| BUV661 Mouse Anti-Human CD11c | BD Biosciences | Clone: B-ly6; RRID: AB_2870241; Cat#612967 |
| BUV737 Mouse Anti-Human CD10 | BD Biosciences | Clone: HI10a; RRID: AB_2869630; Cat#612826 |
| CD14 Monoclonal Antibody (61D3), APC-eFluor™ 780 | eBioscience | Clone: 61D3; RRID: AB_1834358; Cat#47-0149-42 |
| CD16 Monoclonal Antibody (eBioCB16 (CB16)), APC-eFluor™ 780 | eBioscience | Clone: eBioCB16; RRID: AB_11220086; Cat#47-0168-42 |
| BUV615 Mouse Anti-Human CD19 | BD Biosciences | Clone: HIB19; RRID: AB_2875287; Cat#751273 |
| BUV496 Mouse Anti-Human CD19 | BD Biosciences | Clone: SJ25C1; RRID: AB_2744311; Cat#564655 |
| Brilliant Violet 605™ anti-human CD20 Antibody | BioLegend | Clone: 2H7; RRID: AB_2563398; Cat#302334 |
| Spark NIR™ 685 anti-human CD20 Antibody | BioLegend | Clone: 2H7; RRID: AB_2860775; Cat#302366 |
| BV480 Mouse Anti-Human CD21 | BD Biosciences | Clone: B-Ly4; RRID: AB_2743893; Cat#746613 |
| PE/Cyanine7 anti-human CD21 Antibody | BioLegend | Clone: Bu32; RRID: AB_2561576; Cat#354911 |
| CD24 Monoclonal Antibody (SN3), PE-Alexa Fluor™ 610 | Thermofisher | Clone: SN3; RRID: AB_10375871; Cat#MHCD2422 |
| BUV395 Mouse Anti-Human CD27 | BD Biosciences | Clone: L128; RRID: AB_2744349; Cat#563816 |
| Brilliant Violet 711™ anti-human CD27 Antibody | BioLegend | Clone: O323; RRID: AB_2563809; Cat#302834 |
| Spark Blue™ 550 anti-human CD3 Antibody | BioLegend | Clone: SK7; RRID: AB_2819984; Cat#344851 |
| CD3 Monoclonal Antibody (UCHT1), APC-eFluor™ 780 | eBioscience | Clone: UCHT1; RRID: AB_1272042; Cat#47-0038-42 |
| BUV805 Mouse Anti-Human CD38 | BD Biosciences | Clone: HB7; RRID: AB_2871359; Cat#742074 |
| Brilliant Violet 421™ anti-human CD38 Antibody | BioLegend | Clone: HIT2; RRID: AB_10983072; Cat#303526 |
| Mouse anti Human CD45RA | BioRad | Clone: F8-11-13; RRID: AB_871980; Cat#MCA88SBV570 |
| BB700 Mouse Anti-Human CD71 | BD Biosciences | Clone: M-A712; RRID: AB_2743458; Cat#746082 |
| FITC anti-human CD71 Antibody | BioLegend | Clone: CY1g4; RRID: AB_1236432; Cat#334103 |
| BV650 Mouse Anti-Human CD183 | BD Biosciences | Clone: 1C6/CXCR3; RRID: AB_2740303; Cat#740603 |
| PE/Cyanine5 anti-human CD184 (CXCR4) Antibody | BioLegend | Clone: 12G5; RRID: AB_314614; Cat#306508 |
| BUV563 Mouse Anti-Human FCRL5 (CD307e) | BD Biosciences | Clone: 509F6; RRID: AB_2873900; Cat#749598 |
| BUV395 Streptavidin | BD Biosciences | RRID: AB_2869553; Cat#564176 |
| BUV737 Mouse Anti-Human IgD | BD Biosciences | Clone: IA6-2; RRID: AB_2738894; Cat#564687 |
| APC/Fire™ 750 anti-human IgD Antibody | BioLegend | Clone: IA6-2; RRID: AB_2616988; Cat#348238 |
| IgM Antibody (IM373) [Alexa Fluor® 532] | NOVUS | Clone: IM373; RRID: AB_2909529; Cat#NBP2-34650AF532 |
| T-bet Monoclonal Antibody (eBio4B10 (4B10)), eFluor™ 450 | Thermofisher | Clone: 4B10; RRID: AB_2784727; Cat#48-5825-82 |
| BB790 Mouse Anti-IRF4 | BD Biosciences custom | Clone: Q9-343 |
| Biotin anti-human IgG Fc Antibody | Biolegend | Clone: HP6017; RRID:AB_11150771; Cat#409307 |
| Chemicals, peptides, and recombinant proteins | ||
| Fixable Viability Dye eFluor™ 780 | eBioscience | Lot#2290917; Cat#65-0865-14 |
| BD brilliant stain buffer | BD Biosciences | RRID: AB_2869750; Cat#563794; Lot: 0119708 |
| Biotinylated mutant Cal09-HA Haemagglutinin | Gifted by Adam Wheatley | N/A |
| Streptavidin-Biotinylated HRP Complex | Amersham | Cat#RPM1051; Batch: 195367 |
| APC-streptavidin | Thermofisher | Cat#S868 |
| PE-streptavidin | Thermofisher | Cat#S866 |
| Trypan Blue solution | Sigma-Aldrich | Cat#T8154 |
| Receptor Destroying Enzyme | Denka Seiken | N/A |
| Hemagglutinin HA (A/California/06/2009) | eEnzyme | GenBank accession: ACP41935; Cat#IA-11SW-005P |
| Critical commercial assays | ||
| Protease Inhibitor Cocktail Set I | Merck | Cat#539131 |
| MagniSort™ Human B Cell Enrichment Kit | eBioscience | Cat#8804-6867-74; Lot: 2345066 |
| SMART-Seq® HT Kit | Takara Clontech | Cat#634436 |
| Qubit dsDNA HS assay kit | Life Technologies | Cat#Q32854 |
| Nextera XT DNA Library Preparation Kit | Illumina | Cat#FC-131-1096 |
| Nextera Index Kit v2 Set A | Illumina | Cat#FC-131-2001 |
| eBioscience Foxp3/Transcription Factor Fixation/Permeabilisation Staining buffer set | ThermoFisher | Cat#00-5523-00 |
| KAPA Library Quantification Kits - Complete Kit (universal) | Kapa Biosystems | Cat#KK4824 |
| Deposited data | ||
| Raw sequence reads from Turner et al. (2020) | NCBI Gene Expression Omnibus (GEO) database | GEO: GSE148633 |
| Monaco et al. dataset | Monaco et al. 2019 | N/A |
| R code for the SMART-Seq gene expression and BCR analyses, 10×/Seurat analyses, and phenotypic data | github repository: https://github.com/lintermanlab/B_flu_scRNAseq | https://doi.org/10.5281/zenodo.7116358 |
| Single cell RNA sequencing data (SMART-Seq) | This paper; deposited in GEO. (https://www.ncbi.nlm.nih.gov/geo/) | GEO: GSE167823 |
| Singel cell RNA sequencing data of paired blood and lymph node sampling (10×) | Turner et al., 2020; deposited in GEO | GEO: GSE148633 |
| Software and algorithms | ||
| FlowJo v10.8 | Treestar | https://www.flowjo.com/ |
| R v3.6.1 & R v4.0.0 | www.r-project.org | N/A |
| RStudio v1.2.5001 | www.rstudio.com | N/A |
| miloR v0.99.18 | https://www.bioconductor.org/packages/release/bioc/html/miloR.html | Dann et al., 2022 |
| trimgalore v 0.6.6 | https://github.com/FelixKrueger/TrimGalore | N/A |
| HISAT2 v 2.1.0 | http://daehwankimlab.github.io/hisat2/ | Kim et al., 2015 |
| Rsubread v2.0.0 | https://bioconductor.org/packages/release/bioc/html/Rsubread.html | Liao et al., 2019 |
| Bioconductor | https://bioconductor.org | Huber et al., 2015 |
| Scater v1.14.5 | https://bioconductor.org/packages/release/bioc/html/scater.html | McCarthy et al., 2017 |
| Scran v1.14.5 | https://bioconductor.org/packages/release/bioc/html/scran.html | Lun et al., 2016 |
| SingleCellExperiment v1.8.0 | https://bioconductor.org/packages/release/bioc/html/SingleCellExperiment.html | Amezquita et al., 2020 |
| Igraph v1.2.4.2 | https://igraph.org | Csardi and Nepusz, 2006 |
| SingleR v1.0.6 | https://bioconductor.org/packages/release/bioc/html/SingleR.html | Aran et al., 2019 |
| destiny v3.0.1 | https://bioconductor.org/packages/release/bioc/html/destiny.html | Angerer et al., 2015 |
| edgeR v3.28.0 | https://bioconductor.org/packages/release/bioc/html/edgeR.html | Robinson et al., 2010 |
| flowCore v1.52.1 | https://bioconductor.org/packages/release/bioc/html/flowCore.html | Ellis et al., 2019 |
| ggcyto v1.18.0 | https://bioconductor.org/packages/release/bioc/html/ggcyto.html | Van et al., 2018 |
| immunarch v 0.6.6 | https://immunarch.com | Nazarov et al., 2020 |
| Seurat R package v3.2.2 | https://satijalab.org/seurat/index.html | Stuart et al., 2019 |
| Rmarkdown | N/A | Allaire et al., 2021; Xie et al., 2018, 2020 |
| VDJPuzzle | https://bitbucket.org/kirbyvisp/vdjpuzzle2/src/master/ | Rizzetto et al., 2018 |
| SRAtoolkit v2.10.8 | https://github.com/ncbi/sra-tools/ | N/A |
| cellranger count v5.0.0 | 10× Genomics | N/A |
| cellranger vdj v5.0.0 | 10× Genomics | N/A |
| Immcantation suite | https://immcantation.readthedocs.io/en/stable/ | Gupta et al., 2015 |
| TSNE and heatmap analysis | R v4.1.2 | Pasciuto et al., 2020 |
| Other | ||
| Chicken Blood Cells (Adult) in Alsever’s | TCS Biosciences | Cat#FB010AP |
| RPMI 1640 Medium | Life Technologies | Cat#21875-091 |
| Heat Inactivated Fetal Bovine Serum | Sigma-Aldrich | Cat#F9665 |
| Penicillin-Streptomycin | Life Technologies | Cat#15140-122 |
| TWEEN® 20 | Sigma-Aldrich | Cat#P1379 |
| Histopaque®-1077 | Sigma-Aldrich | Cat#10771 |
| L-Glutamine solution | Sigma-Aldrich | Cat#G7513 |
| DMSO | Sigma-Aldrich | Cat#34869 |
| AMPure XP beads | Beckman Coulter | Cat#A63881 |
Resource availability
Lead contact
Further information and requests for resources and reagents should be directed to and will be fulfilled by the lead contact, Edward Carr (Edward.carr@crick.ac.uk).
Materials availability
Materials generated from this study are available on request from the lead contact.
Experimental model and subject details
Influenza vaccination of healthy volunteers
Healthy volunteers aged 22–36 years old (n = 21) or 67–86 years old (n = 21) were immunised by the NIHR Cambridge BioResource. Individuals taking immunosuppressive drugs, or with active cancer were excluded, but we did not exclude individuals with controlled chronic conditions such as hypertension. Information on sex and gender identity was not collected as not relevant to the aims of this study. Individuals underwent venepuncture (day 0) and then the seasonal trivalent influenza vaccine was administered intramuscularly (formulated in line with the World Health Organisation’s 2016–17 Northern hemisphere recommendations: i. A/California/7/2009 (H1N1) pdm09-like virus; ii. an A/Hong Kong/4801/2014 (H3N2)-like virus; iii a B/Brisbane/60/2008-like virus). Venepuncture was repeated on days 7 and 42. All venepuncture samples were 50 mL and collected into silica-coated tubes (for serum, 4.5 mL) or EDTA-coated tubes (for cells, 5 x 9 mL tubes). All blood was collected in accordance with the latest revision of the Declaration of Helsinki and the Guidelines for Good Clinical Practice (ICH-GCP). Ethical approval for this study was provided by a UK local research ethics committee (REC reference 14/SC/1077). The Cambridge Bioresource has its own ethical approval (REC reference 04/Q0108/44). All volunteers provided written informed consent upon entry to the study.
Method details
PBMC isolation and cryopreservation
Peripheral blood mononuclear cells (PBMCs) were isolated by density centrifugation over Histopaque 1077 (Sigma-Aldrich), counted and cryopreserved in 90% FCS/10% DMSO (both Sigma-Aldrich). PBMC aliquots were frozen in a methanol bath (to freeze slowly ∼1 °C/min) in a −80°C freezer overnight. Once frozen, PBMC were transferred to liquid nitrogen for longer term storage. For the studies herein, we used aliquots of ∼107 PBMCs.
Hemagglutinin inhibition assays
Antibody titres pre and post vaccination were determined using the hemagglutination inhibition (HAI) assay using the standard World Health Organisation (WHO) protocol, as previously described (Chen et al., 2010). Briefly, serum was treated with receptor destroying enzyme (RDE; Denka Seiken Co.) by adding 1-part serum to 3 parts RDE and incubating at 37°C overnight, followed by RDE inactivation at 56°C for one hour. Treated serum was then serially diluted 1 in 2 with PBS in 96 well v-bottom plates (Nunc) in 50 μL volumes. 4 HA units of A/California/04/2009 (H1N1) virus produced in vitro in MDCK cells was added per well and incubated with serum samples for 30 min at room temperature. Then 50 μL of 0.5% chicken RBCs (TCS Biosciences) in PBS was added per well, plates agitated manually, and incubated for 30 min. HAI titres were read manually as the reciprocal of the final dilution for which complete inhibition of agglutination was observed.
PBMC ELISpots
MultiScreen-HA mixed cellulose ester plates (Millipore Merck) were coated under sterile conditions with either recombinant Hemagglutinin HA (A/California/06/2009, eEnzyme) at 15 ug/mL or Fluzone Trivalent 2016/2017 vaccine at 1:6 dilution. Plates were then washed with PBS and blocked with complete RPMI medium supplemented with 10% (v/v) FBS, 1% (v/v) Penicillin-Streptomycin for 1 h at 37°C for 1 h. PBMC samples in complete RPMI medium at 2 × 10⁵ cells/well in triplicate and were incubated at 37°C, 5% CO2 for 24 h, then washed with 0.05% (v/v) Tween20 PBS, PBS and H2O. Detection was performed with anti-human IgG Fc biotin (1:1500, Biolegend #409307), and streptavidin-HRP (1:1500, Amersham, RPM 1051 Batch 195367) in 0.5% (v/v) Tween20 + 0.1% BSA, followed by washing with 0.05% (v/v) Tween20 PBS, PBS and H2O. Plates were developed using the AEC staining kit (Sigma-Aldrich) according to the manufacturer’s instructions. The number of antibody-secreting cells (ASCs) was determined using a CTL ELISPOT reader (Cell Technologies) and the CTL ImmunoSpot Software (Cell Technologies).
Hemagglutinin specific bait
Hemagglutinin from the A/California09 strain was previously modified with a single point mutation Y98F to minimise its binding to sialic acid (Whittle et al., 2014) (reducing non-specific binding to cell surface glycoproteins) and then biotinylated as previously (Wheatley et al., 2016). Biotinylated mutant Cal09-HA (1.5 μg) was complexed with streptavidin conjugated to APC (8 μL; Thermofisher #S868) or PE (8 μL; Thermofisher #S866), in the presence of a protease inhibitor (1.5μL of the manufacturer’s recommended 100× re-suspension concentration; Merck #US1539131-1VL) in 115 μL of phosphate buffered saline (PBS). The Cal09-HA, PBS and protease inhibitor were mixed first and then the streptavidin conjugates added in 5 steps (1.6 μL each) every 15–20 min. The conjugated bait was stored in the dark at 4°C and used within 2 weeks, at 5μL/106 cells. We double-stained with streptavidin conjugates in two separate fluorophores for plate-based index sorting single B cells from the double-positive HA gate (Figure 1B; full gating strategy in Figure S1A). A ‘free’ streptavidin conjugated to irrelevant fluorophore was used to gate out B cells that bound the streptavidin component of the bait.
Index sorting of single cells with FACS
Cryopreserved PBMC were collected from liquid nitrogen stores and thawed on wet ice. As soon as the last ice crystals thawed, 1 mL of complete RPMI-1640, pre-warmed to 37°C, was added to the cryovial and the whole contents transferred to 49 mL of complete RPMI-1640 in a 50 mL tube. For complete RPMI-1640, RPMI was supplemented with +10% heat inactivated foetal calf serum, 100 U/mL penicillin and 100 μg/mL streptomycin and L-glutamine. The cells were centrifuged and re-suspended in complete media, pre-warmed to 37°C and allowed to rest for 1 h at 37°C prior to viability counting. Untouched B cells were enriched using negative magnetic separation (eBioscience 8804–6867), following the manufacturer’s instructions with 2% FCS/PBS. Viable PBMC were counted with Trypan Blue (Sigma-Aldrich) exclusion and a haemocytometer.
Negatively selected B cells were filtered using a 30 μm filter, counted and surface staining performed for 60 min in the dark at 4°C. Antibodies used are shown in the Key Resources Table. Staining was performed in BD brilliant buffer (BD #563794), in the presence of human IgG as a Fc receptor blocking agent. Cells were washed in PBS and resuspended in 200–250 μL of PBS for sorting.
Cells were index sorted on a BD FACSAria Fusion in cat 2 containment, with a 100 μm nozzle into a 96-well plate (BioRad #HSS9641), containing chilled (4°C) RNA lysis buffer (SMART-Seq HT lysis buffer, Takara Clontech, #634439). This contained the oligo-dT primer. Immediately after the sort was completed, a labelled foil lid (Axygen, PCR-AS-200) was applied to the plate, it was spun briefly in a table-top centrifuge and snap frozen in dry ice. Frozen plates were transferred to −80°C for storage.
For each cell sorting batch, paired day 0 and 42 samples were processed from an individual from the 22–36 yo group and an individual from the 67–86 yo group. All 4 biological conditions were represented in each sorting batch. There were 10 sorting batches. Day 0 samples were sorted for 16 individual HA-specific B cells, day 42 samples for 32 individual HA-specific B cells (giving 16 + 16 + 32 + 32 = 96 cells/cell sort batch). Each biological condition was sorted in its own pre-prepared 96 well plate containing lysis buffer, and snap frozen at the end of that sort (rather than wait until an entire 96 well plate was filled), to minimise time spent at 4°C. Any extra HA-specific B cells were collected on a fifth 96 well plate with any remaining lysis buffer.
Index sorting information was extracted from the FCS files using custom scripts based on the Bioconductor package flowCore (Ellis et al., 2019). Each sorted cell is given its own FCS file containing a single event. Our scripts extracted compensated, logicle transformed cell surface index data on a per cell basis, mapped to that cell’s eventual cDNA library (see next section). To analyze the flow cytometry phenotype of HA+ B cells in comparison to HA- B cells, the index FCS files, each containing a single event, were concatenated with their ‘master’ file into a combined file of all events from each biological sample. Flow plots are rendered with the ggcyto package (Van et al., 2018). Analysis of FCS files were performed using FlowJo v10 (Treestar).
Single cell RNA sequencing using SMART-Seq
Samples were processed to cDNA in batches. Each batch comprised of 4 partially filled 96 well plates of flow sorted cells, from the same sort batch: paired d0 and d42 samples from one individual from either age group. cDNA was generated as per the manufacturer’s instructions (SMART-Seq HT kit user manual, version/date 121218, kit # 634436), using 20 PCR cycles. cDNA was synthesised using four 96 well BioRad T1000 PCR machines in parallel, with a single master mix used across all 4 plates. After cDNA synthesis, the 4 plates were consolidated into a single 96 well plate for ongoing processing (1 cell/well; the cDNA is not yet indexed; with a record of final well positions of each cell). If a cDNA synthesis batch was << 96 cells (this was predictable from the sort results), then additional cells from a fifth flow sorted plate were also processed and consolidated into the final 96 well plate. In this case, a fifth BioRad T1000 was used at the cDNA synthesis step.
In total, 10 × 96 well cDNA plates were generated. The 10 cDNA plates were cleaned-up using AMPure XP beads (Beckman Coulter #A63881), deep 96 well plates (Abgene #AB-0765) and a magnetic plate stand (ThermoFisher #AM10027) as described in the SMART-Seq HT manual (dated 121218). Cleaned cDNA was stored in 96 well plates (BioRad #HSS9641) at −20°C. Quantification was performed using a Qubit dsDNA HS assay kit (Life Technologies, # Q32854) and Qubit spectrometer (Invitrogen #Q33226) of 12 wells of cDNA/plate, with cDNA from each of the four biological samples represented on the plate, as per the manufacturer’s guidelines. Each plate was diluted based on a dilution factor for a median concentration of input cDNA ∼200 ng/μL.
Nextera XT tagmentation and adaptor ligation was performed as described in the SMART-Seq HT manual, using the Nextera XT DNA Library Preparation Kit (Illumina, #FC-131-1096) and the Nextera Index Kit v2 Set A (Illumina, #FC-131-2001). Aliquots of the tagmented and adaptor ligation PCR product were pooled (Each 96 well plate was pooled into a single 1.5 mL microcentrifuge tube), and the pool was cleaned with AMPure XP beads as described in the SMART-Seq HT manual, using the 1.5 mL centrifuge tube magnetic stand (Takara, #621964). The final library concentrations and qualities were determined by both SYBR PCR (Kapa Biosystems, #KK4824) with a BioRad CFX qPCR machine and Bioanalyser (High Sensitivity DNA assay, Agilent). Libraries were sequenced on an Illumina NextSeq 500 with 75 bp paired end reads and a mid-output run (96 cells/run), yielding approximately one million aligned reads/cell.
Gene expression analysis of SMART-Seq data
Reads from demultiplexed fastq files were trimmed with trimgalore (v 0.6.6) and aligned to the human genome (Ensembl build GRCh38.87) using HISAT2 (v 2.1.0, Kim et al., 2015) with the options --sp 1000,1000. Aligned reads were quantified using featureCounts, as implemented in Rsubread (Subread v 2.0.0, Liao et al., 2019), and R 3.6.1. Downstream analyses were performed using Bioconductor (Huber et al., 2015) packages: scater (McCarthy et al., 2017), scran (Lun et al., 2016), and the SingleCellExperiment data infrastructure, as outlined here (Amezquita et al., 2020).
Gene expression data was obtained for 952 cells. The following quality control steps were applied, within each biological condition (22–36 yo d0; 22–36 yo d42; 67–86 yo d0; 67–86 yo d42), excluding cells meeting one or more of the following criteria: i. the number of detected transcripts >3× median absolute deviations (MAD) from the median ii. the percentage of reads that map to mitochondrial transcripts >3× MAD from the median iii. the percentage of the library that is occupied by the top 50 transcripts (a measure of low complexity libraries) > 3× from the median (Figures S2A–S2D). 117 samples were excluded for low library size (Figures S2A). 130 samples were excluded for low numbers of detected transcripts (Figures S2B). 36 samples were excluded for high proportions of mitochondrial transcripts (Figures S2C). 119 samples were excluded for low complexity libraries (Figures S2D). Cells could fail on several QC parameters. The total number of cells discarded was 163. Initially, highly variable genes (HVGs) were identified as the top 25% of variance, after normalisation for library size using deconvolution. The first 50 components from principal component analysis of these HVGs were used for UMAP embedding (McInnes et al., 2020). Clustering was performed with Louvain clustering in igraph (Csardi and Nepusz). After excluding cells on biological grounds (see Figures S1F–S1K), a new set of HVGs were defined, using the top 10% of variance and the first 40 principal components for UMAP. Cell assignment was performed with SingleR (Aran et al., 2019), and the Monaco et al. dataset (Monaco et al., 2019). For clarity, particularly around double-negative B cells, we have re-labelled the Monaco et al. B cell populations as follows [sorting strategy, label herein]: IgD+CD27-, naïve; IgD+CD27+, non-switched Bmem; IgD−CD27+, switched Bmem; IgD−CD27-, IgD−CD27- Bmem; IgD−CD27++CD38+, plasmablasts. Trajectory analysis was performed using the destiny package (Angerer et al., 2015). Differential abundance analysis was performed using edgeR (Robinson et al., 2010). We used the miloR package (v0.99.18) (Dann et al., 2022) to perform differential abundance testing using k-nearest neighbor graphs, which does not require cells to be discretised into clusters. For miloR we used R 4.0.0, with a SingleCellExperiment object constructed as above (in R 3.6.1).
BCR assembly from single cell SMART Seq data
We used VDJPuzzle (Rizzetto et al., 2018) to retrieve and annotate heavy and light chains from each individual B cell. This gives, per cell, annotated heavy chain and light chain alignments, and a report of detected mutations. Amino acid positions follow the Kabat numbering scheme. Where VDJPuzzle reported more than one chain, we report the chain with the highest expression level (for example, in ∼50% of naïve cells, identical V, D and J segments were assembled with an IgM or IgD heavy chain). For replacement:silent ratios of somatic hypermutation, these are pseudolog transformed prior to plotting. The pseudolog distribution becomes linear at around 1 and allows both the benefits of a log compression of large numbers and, unlike a log transformation, the retention of cells where R/S+0.01 = 0, due to R = 0. These analyses on the VDJPuzzle results were performed in R 3.6.1.
Analyses of 10× data
The published Turner et al. dataset (Turner et al., 2020) was downloaded as fastq from ENA (https://www.ebi.ac.uk/ena/browser/home), using aspera links retrieved from the SRA Explorer (http://sra-explorer.info/). Fastq files missing from ENA were re-created using fastq-dump from the SRAtoolkit (v2.10.8, http://ncbi.github.io/sra-tools/). Gene expression data was aligned and counted using cellranger count (v5.0.0, 10× Genomics) against the human genome (10× Genomics build GRCh38-1.2.0). Downstream analysis was performed with the Seurat R package (v3.2.2, (Stuart et al., 2019)). Quality control retained cells with: >200 features/cell & <7,000 features/cell & < 12.5% mitochondrial reads. Each sample was then normalised and the 2000 most variable features selected, after variance stabilised normalisation. For either FNA or IgD- PBMC samples, all time points were combined using ImmuneAnchors to minimise batch effects between replicates (first 30 dimensions used). To identify B cells with FNA or IgD- PBMC samples, we used 20 principal components for clustering, and FindClusters with a resolution of 0.05. B cells were selected on the basis of the expression of CD79A, MS4A1 and CD19 (Turner et al., 2020). Once identified, B cells were re-scaled and re-clustered with 20 principal components (FindClusters resolution = 0.05). GC B cells were identified as the FNA B cell cluster expressing BCL6, RGS13, MEF2B, STMN1, ELL3, SERPINA9 (Turner et al., 2020). Resting memory B cells were defined as B cells expressing TNFRSF13B, CD27 and CD24 (Turner et al., 2020).
VDJ repertoire data were pre-processed using cellranger vdj (v5.0.0, 10× Genomics), with the VDJ annotations from 10× Genomics (refdata-cellranger-vdj-GRCh38-alts-ensembl-5.0.0). Mutation analysis was performed with the Immcantation suite (Gupta et al., 2015), and replacement:silent ratios calculated and plotted as described above for the SMART-Seq dataset. Clonotype tracking was performed using the immunarch R package (Nazarov et al., 2020). Clonotypes were defined having identical IGHV, IGHJ, IGLV and IGLV alleles, and IgH and IgL CDR3 lengths.
Spectral flow cytometric analyses
Spectral flow cytometry was performed on a separate cohort of healthy individuals immunised with a trivalent influenza vaccine and sampled at baseline, 7 days- and 42 days- post immunisation, as above. Cryopreserved PBMC were defrosted in a 37°C water bath, and then immediately diluted into 9 mL of pre-warmed RPMI+10% Fetal Bovine serum (FBS). Cells were washed with 10 mL of FACS buffer (PBS containing 2% FBS and 1 mM EDTA) and resuspended in 500uL of FACS buffer. Cell numbers and viability were determined using a Countess automated cell counter (Invitrogen). 1×10⁷ viable cells were transferred to 96-well plates for antibody staining. Cells were washed once with FACS buffer, and stained with 100 μL of surface antibody mix (including B cell probes) for 2 h at 4°C. Cells were then washed twice with FACS buffer, and fixed with the eBioscience Foxp3/Transcription Factor Staining Buffer (ThermoFisher #00-5323-00) for 30 min at 4°C. For intracellular staining, cells were then washed once with 1× eBioscience Foxp3/Transcription Factor Permeabilisation buffer (ThermoFisher #00-8333-56) and stained with intracellular antibody mix in permeabilisation buffer at 4°C overnight. Following overnight staining, samples were washed twice with 1× permeabilisation buffer and resuspended in FACS buffer. Stained cells were acquired on a Cytek Aurora. Cells for single color controls were prepared in the same manner as the fully stained samples. Manual gating of flow cytometry data was done using FlowJo v10.8 software (TreeStar). TSNE and heatmap analysis were performed using R (v 4.1.2) using code that has previously been described (Pasciuto et al., 2020).
Quantification and statistical analysis
Statistical analyses were performed in R (v 3.6.1, www.r-project.org, v 4.0.0 for miloR) via RStudio (v1.2.5001; www.rstudio.com) or Prism 9 (GraphPad). The statistical test used is indicated in the relevant figure legend. R-derived figures were generated using Rmarkdown (Allaire et al., 2021; Xie et al., 2018, 2020) with pdf output.
Acknowledgments
The NIHR Cambridge Biomedical Research Center (BRC) is a partnership between Cambridge University Hospitals NHS Foundation Trust and the University of Cambridge, funded by the National Institute for Health Research (NIHR). We are indebted to the NIHR Cambridge BRC volunteers for their participation, and we thank the NIHR Cambridge BRC staff for their contribution in coordinating the vaccinations and venepuncture. We thank the staff of the Babraham Institute Flow Cytometry Facility, Bioinformatics Group, the Sequencing Facility, and Silvia Innocentin for their technical assistance. We thank Dr. Geoff Butcher for his comments on this project throughout. For the purpose of Open Access, the authors have applied a CC BY public copyright license to any Author Accepted Manuscript version arising from this submission. This study was supported by H2020 European Research Council funding awarded to M.A.L. (637801-TWILIGHT), Evelyn Trust funding (19/20) awarded to E.J.C. and M.A.L., and the Biotechnology and Biological Sciences Research Council (BBS/E/B/000C0427, BBS/E/B/000C0428, and the Campus Capability Core Grant to the Babraham Institute). A.R.B. is supported by a Sir Henry Wellcome Postdoctoral Fellowship (222793/Z/21/Z). D.L.H. is supported by a National Health and Medical Research Council Australia Early-Career Fellowship (APP1139911). E.J.C. is supported by the Francis Crick Institute, which receives its core funding from Cancer Research UK (CC2087), the UK Medical Research Council (CC2087), and the Wellcome Trust (CC2087). M.A.L. is an EMBO Young Investigator and Lister Institute Prize Fellow. This paper presents independent research supported by the NIHR Cambridge BRC. The views expressed are those of the authors and not necessarily those of the NIHR or the Department of Health and Social Care.
Author contributions
A.R.B. performed experiments, analyzed data, and wrote the manuscript. S.M.G. analyzed data. W.S.F. provided reagents and designed experiments. A.K.W. provided reagents. D.L.H. performed experiments, analyzed data, and wrote the manuscript. E.J.C. designed the study, performed experiments, analyzed data, performed bioinformatics analyses, wrote the manuscript, obtained funding, and provided clinical oversight. M.A.L. designed the study, performed experiments, wrote the manuscript, obtained funding, and oversaw the project.
Declaration of interests
The authors declare no competing interests.
Inclusion and diversity
One or more of the authors of this paper self-identifies as a member of the LGBTQIA+ community. One or more of the authors of this paper self-identifies as a gender minority in their field of research.
Published: November 8, 2022
Footnotes
Supplemental information can be found online at https://doi.org/10.1016/j.celrep.2022.111613.
Contributor Information
Edward J. Carr, Email: edward.carr@crick.ac.uk.
Michelle A. Linterman, Email: michelle.linterman@babraham.ac.uk.
Supplemental information
Data and code availability
-
•
Raw single cell sequencing data are deposited in GEO (https://www.ncbi.nlm.nih.gov/geo/) and are publicly available as of the date of publication under the accession GSE167823. The Turner et al. dataset (Turner et al., 2020) is available from GEO with the accession GSE148633. Other primary data, for example raw FCS files, are available from the authors upon reasonable request.
-
•
Corresponding R code for the SMART-Seq gene expression and BCR analyses, 10×/Seurat analyses, and phenotypic data is available at the github repository and is publicly available as of the date of publication: https://github.com/lintermanlab/B_flu_scRNAseq.
-
•
Any additional information required to reanalyze the data reported in this paper is available from the lead contact upon request.
References
- Allaire J.J., Xie Y., McPherson J., Luraschi J., Ushey K., Atkins A., Wickham H., Cheng J., Chang W., Iannone R. Dynamic Documents for R; 2021. rmarkdown. [Google Scholar]
- Allen J.C., Toapanta F.R., Chen W., Tennant S.M. Understanding immunosenescence and its impact on vaccination of older adults. Vaccine. 2020;38:8264–8272. doi: 10.1016/j.vaccine.2020.11.002. [DOI] [PMC free article] [PubMed] [Google Scholar]
- Amezquita R.A., Lun A.T.L., Becht E., Carey V.J., Carpp L.N., Geistlinger L., Marini F., Rue-Albrecht K., Risso D., Soneson C., et al. Orchestrating single-cell analysis with Bioconductor. Nat. Methods. 2020;17:137–145. doi: 10.1038/s41592-019-0654-x. [DOI] [PMC free article] [PubMed] [Google Scholar]
- Andrews S.F., Huang Y., Kaur K., Popova L.I., Ho I.Y., Pauli N.T., Henry Dunand C.J., Taylor W.M., Lim S., Huang M., et al. Immune history profoundly affects broadly protective B cell responses to influenza. Sci. Transl. Med. 2015;7:316ra192. doi: 10.1126/scitranslmed.aad0522. [DOI] [PMC free article] [PubMed] [Google Scholar]
- Angerer P., Haghverdi L., Büttner M., Theis F.J., Marr C., Buettner F. destiny: diffusion maps for large-scale single-cell data in R. Bioinformatics. 2015;32:1241–1243. doi: 10.1093/bioinformatics/btv715. [DOI] [PubMed] [Google Scholar]
- Aran D., Looney A.P., Liu L., Wu E., Fong V., Hsu A., Chak S., Naikawadi R.P., Wolters P.J., Abate A.R., et al. Reference-based analysis of lung single-cell sequencing reveals a transitional profibrotic macrophage. Nat. Immunol. 2019;20:163–172. doi: 10.1038/s41590-018-0276-y. [DOI] [PMC free article] [PubMed] [Google Scholar]
- Austin J.W., Buckner C.M., Kardava L., Wang W., Zhang X., Melson V.A., Swanson R.G., Martins A.J., Zhou J.Q., Hoehn K.B., et al. Overexpression of T-bet in HIV infection is associated with accumulation of B cells outside germinal centers and poor affinity maturation. Sci. Transl. Med. 2019;11:eaax0904. doi: 10.1126/scitranslmed.aax0904. [DOI] [PMC free article] [PubMed] [Google Scholar]
- Avey S., Mohanty S., Chawla D.G., Meng H., Bandaranayake T., Ueda I., Zapata H.J., Park K., Blevins T.P., Tsang S., et al. Seasonal variability and shared molecular signatures of inactivated influenza vaccination in young and older adults. J. Immunol. 2020;204:1661–1673. doi: 10.4049/jimmunol.1900922. [DOI] [PMC free article] [PubMed] [Google Scholar]
- Avnir Y., Tallarico A.S., Zhu Q., Bennett A.S., Connelly G., Sheehan J., Sui J., Fahmy A., Huang C.y., Cadwell G., et al. Molecular signatures of Hemagglutinin stem-directed heterosubtypic human neutralizing antibodies against influenza A viruses. PLoS Pathog. 2014;10:e1004103. doi: 10.1371/journal.ppat.1004103. [DOI] [PMC free article] [PubMed] [Google Scholar]
- Aydar Y., Balogh P., Tew J.G., Szakal A.K. Age-related depression of FDC accessory functions and CD21 ligand-mediated repair of co-stimulation. Eur. J. Immunol. 2002;32:2817–2826. doi: 10.1002/1521-4141(2002010)32:10<2817::AID-IMMU2817>3.0.CO;2-Z. [DOI] [PubMed] [Google Scholar]
- Banerjee M., Mehr R., Belelovsky A., Spencer J., Dunn-Walters D.K. Age- and tissue-specific differences in human germinal center B cell selection revealed by analysis of IgVH gene hypermutation and lineage trees. Eur. J. Immunol. 2002;32:1947–1957. doi: 10.1002/1521-4141(200207)32:7<1947::AID-IMMU1947>3.0.CO;2-1. [DOI] [PubMed] [Google Scholar]
- Burton A.R., Maini M.K. Human antiviral B cell responses: emerging lessons from hepatitis B and COVID-19. Immunol. Rev. 2021;299:108–117. doi: 10.1111/imr.12953. [DOI] [PMC free article] [PubMed] [Google Scholar]
- Burton A.R., Pallett L.J., McCoy L.E., Suveizdyte K., Amin O.E., Swadling L., Alberts E., Davidson B.R., Kennedy P.T., Gill U.S., et al. Circulating and intrahepatic antiviral B cells are defective in hepatitis B. J. Clin. Invest. 2018;128:4588–4603. doi: 10.1172/JCI121960. [DOI] [PMC free article] [PubMed] [Google Scholar]
- Carr E.J., Dooley J., Garcia-Perez J.E., Lagou V., Lee J.C., Wouters C., Meyts I., Goris A., Boeckxstaens G., Linterman M.A., Liston A. The cellular composition of the human immune system is shaped by age and cohabitation. Nat. Immunol. 2016;17:461–468. doi: 10.1038/ni.3371. [DOI] [PMC free article] [PubMed] [Google Scholar]
- Chen F., Tzarum N., Wilson I.A., Law M. VH1-69 antiviral broadly neutralizing antibodies: genetics, structures, and relevance to rational vaccine design. Curr. Opin. Virol. 2019;34:149–159. doi: 10.1016/j.coviro.2019.02.004. [DOI] [PMC free article] [PubMed] [Google Scholar]
- Chen G.L., Lamirande E.W., Jin H., Kemble G., Subbarao K. Safety, immunogencity, and efficacy of a cold-adapted A/Ann Arbor/6/60 (H2N2) vaccine in mice and ferrets. Virology. 2010;398:109–114. doi: 10.1016/j.virol.2009.12.003. [DOI] [PMC free article] [PubMed] [Google Scholar]
- Csardi G., Nepusz T. The igraph software package for complex network research. InterJournal, complex systems. 2006;1695:1–9. 5. [Google Scholar]
- Dann E., Henderson N.C., Teichmann S.A., Morgan M.D., Marioni J.C. Differential abundance testing on single-cell data using k-nearest neighbor graphs. Nat. Biotechnol. 2022;40:245–253. doi: 10.1038/s41587-021-01033-z. [DOI] [PMC free article] [PubMed] [Google Scholar]
- Demicheli V., Jefferson T., Di Pietrantonj C., Ferroni E., Thorning S., Thomas R.E., Rivetti A. Vaccines for preventing influenza in the elderly. Cochrane Database Syst. Rev. 2018;2:CD004876. doi: 10.1002/14651858.CD004876.pub4. [DOI] [PMC free article] [PubMed] [Google Scholar]
- Dunn-Walters D.K. The ageing human B cell repertoire: a failure of selection? Clin. Exp. Immunol. 2016;183:50–56. doi: 10.1111/cei.12700. [DOI] [PMC free article] [PubMed] [Google Scholar]
- Ellebedy A.H., Jackson K.J.L., Kissick H.T., Nakaya H.I., Davis C.W., Roskin K.M., McElroy A.K., Oshansky C.M., Elbein R., Thomas S., et al. Defining antigen-specific plasmablast and memory B cell subsets in human blood after viral infection or vaccination. Nat. Immunol. 2016;17:1226–1234. doi: 10.1038/ni.3533. [DOI] [PMC free article] [PubMed] [Google Scholar]
- Ellis B., Haaland P., Hahne F., Meur N.L., Gopalakrishnan N., Spidlen J., Jiang M., Finak G. “flowCore: a Bioconductor package for high throughput flow cytometry”. PMID 19358741. 2019 doi: 10.1186/1471-2105-10-106. [DOI] [PMC free article] [PubMed] [Google Scholar]
- Gupta N.T., Vander Heiden J.A., Uduman M., Gadala-Maria D., Yaari G., Kleinstein S.H. Change-O: a toolkit for analyzing large-scale B cell immunoglobulin repertoire sequencing data. Bioinformatics. 2015;31:3356–3358. doi: 10.1093/bioinformatics/btv359. [DOI] [PMC free article] [PubMed] [Google Scholar]
- Guthmiller J.J., Lan L.Y.-L., Fernández-Quintero M.L., Han J., Utset H.A., Bitar D.J., Hamel N.J., Stovicek O., Li L., Tepora M., et al. Polyreactive broadly neutralizing B cells are selected to provide defense against pandemic threat influenza viruses. Immunity. 2020;53:1230–1244.e5. doi: 10.1016/j.immuni.2020.10.005. [DOI] [PMC free article] [PubMed] [Google Scholar]
- Hao Y., O’Neill P., Naradikian M.S., Scholz J.L., Cancro M.P. A B-cell subset uniquely responsive to innate stimuli accumulates in aged mice. Blood. 2011;118:1294–1304. doi: 10.1182/blood-2011-01-330530. [DOI] [PMC free article] [PubMed] [Google Scholar]
- Henry C., Zheng N.-Y., Huang M., Cabanov A., Rojas K.T., Kaur K., Andrews S.F., Palm A.-K.E., Chen Y.-Q., Li Y., et al. Influenza virus vaccination elicits poorly adapted B cell responses in elderly individuals. Cell Host Microbe. 2019;25:357–366.e6. doi: 10.1016/j.chom.2019.01.002. [DOI] [PMC free article] [PubMed] [Google Scholar]
- Hill D.L., Whyte C.E., Innocentin S., Lee J.L., Dooley J., Wang J., James E.A., Lee J.C., Kwok W.W., Zand M.S., et al. Impaired HA-specific T follicular helper cell and antibody responses to influenza vaccination are linked to inflammation in humans. Elife. 2021;10:e70554. doi: 10.7554/eLife.70554. [DOI] [PMC free article] [PubMed] [Google Scholar]
- Hilleman M.R. Realities and enigmas of human viral influenza: pathogenesis, epidemiology and control. Vaccine. 2002;20:3068–3087. doi: 10.1016/S0264-410X(02)00254-2. [DOI] [PubMed] [Google Scholar]
- Horns F., Dekker C.L., Quake S.R. Memory B cell activation, broad anti-influenza antibodies, and bystander activation revealed by single-cell transcriptomics. Cell Rep. 2020;30:905–913.e6. doi: 10.1016/j.celrep.2019.12.063. [DOI] [PMC free article] [PubMed] [Google Scholar]
- Huber W., Carey V.J., Gentleman R., Anders S., Carlson M., Carvalho B.S., Bravo H.C., Davis S., Gatto L., Girke T., et al. Orchestrating high-throughput genomic analysis with Bioconductor. Nat. Methods. 2015;12:115–121. doi: 10.1038/nmeth.3252. [DOI] [PMC free article] [PubMed] [Google Scholar]
- Jenks S.A., Cashman K.S., Zumaquero E., Marigorta U.M., Patel A.V., Wang X., Tomar D., Woodruff M.C., Simon Z., Bugrovsky R., et al. Distinct effector B cells induced by unregulated toll-like receptor 7 contribute to pathogenic responses in systemic lupus erythematosus. Immunity. 2018;49:725–739.e6. doi: 10.1016/j.immuni.2018.08.015. [DOI] [PMC free article] [PubMed] [Google Scholar]
- Johnson J.L., Rosenthal R.L., Knox J.J., Myles A., Naradikian M.S., Madej J., Kostiv M., Rosenfeld A.M., Meng W., Christensen S.R., et al. The transcription factor T-bet resolves memory B cell subsets with distinct tissue distributions and antibody specificities in mice and humans. Immunity. 2020;52:842–855.e6. doi: 10.1016/j.immuni.2020.03.020. [DOI] [PMC free article] [PubMed] [Google Scholar]
- Kenderes K.J., Levack R.C., Papillion A.M., Cabrera-Martinez B., Dishaw L.M., Winslow G.M. T-Bet+ IgM memory cells generate multi-lineage effector B cells. Cell Rep. 2018;24:824–837.e3. doi: 10.1016/j.celrep.2018.06.074. [DOI] [PMC free article] [PubMed] [Google Scholar]
- Kim C.C., Baccarella A.M., Bayat A., Pepper M., Fontana M.F. FCRL5+ memory B cells exhibit robust recall responses. Cell Rep. 2019;27:1446–1460.e4. doi: 10.1016/j.celrep.2019.04.019. [DOI] [PMC free article] [PubMed] [Google Scholar]
- Kim D., Langmead B., Salzberg S.L. HISAT: a fast spliced aligner with low memory requirements. Nat. Methods. 2015;12:357–360. doi: 10.1038/nmeth.3317. [DOI] [PMC free article] [PubMed] [Google Scholar]
- Knox J.J., Buggert M., Kardava L., Seaton K.E., Eller M.A., Canaday D.H., Robb M.L., Ostrowski M.A., Deeks S.G., Slifka M.K., et al. T-bet+ B cells are induced by human viral infections and dominate the HIV gp140 response. JCI Insight. 2017;2:92943. doi: 10.1172/jci.insight.92943. [DOI] [PMC free article] [PubMed] [Google Scholar]
- Koutsakos M., Wheatley A.K., Loh L., Clemens E.B., Sant S., Nüssing S., Fox A., Chung A.W., Laurie K.L., Hurt A.C., et al. Circulating TFH cells, serological memory, and tissue compartmentalization shape human influenza-specific B cell immunity. Sci. Transl. Med. 2018;10:eaan8405. doi: 10.1126/scitranslmed.aan8405. [DOI] [PubMed] [Google Scholar]
- Lau D., Lan L.Y.-L., Andrews S.F., Henry C., Rojas K.T., Neu K.E., Huang M., Huang Y., DeKosky B., Palm A.-K.E., et al. Low CD21 expression defines a population of recent germinal center graduates primed for plasma cell differentiation. Sci. Immunol. 2017;2:eaai8153. doi: 10.1126/sciimmunol.aai8153. [DOI] [PMC free article] [PubMed] [Google Scholar]
- Lazuardi L., Jenewein B., Wolf A.M., Pfister G., Tzankov A., Grubeck-Loebenstein B. Age-related loss of naïve T cells and dysregulation of T-cell/B-cell interactions in human lymph nodes. Immunology. 2005;114:37–43. doi: 10.1111/j.1365-2567.2004.02006.x. [DOI] [PMC free article] [PubMed] [Google Scholar]
- Lefebvre J.S., Maue A.C., Eaton S.M., Lanthier P.A., Tighe M., Haynes L. The aged microenvironment contributes to the age-related functional defects of CD4 T cells in mice. Aging Cell. 2012;11:732–740. doi: 10.1111/j.1474-9726.2012.00836.x. [DOI] [PMC free article] [PubMed] [Google Scholar]
- Li H., Borrego F., Nagata S., Tolnay M. Fc receptor-like 5 expression distinguishes two distinct subsets of human circulating tissue-like memory B cells. J. Immunol. 2016;196:4064–4074. doi: 10.4049/jimmunol.1501027. [DOI] [PubMed] [Google Scholar]
- Liao Y., Smyth G.K., Shi W. The R package Rsubread is easier, faster, cheaper and better for alignment and quantification of RNA sequencing reads. Nucleic Acids Res. 2019;47:e47. doi: 10.1093/nar/gkz114. [DOI] [PMC free article] [PubMed] [Google Scholar]
- Lingwood D., McTamney P.M., Yassine H.M., Whittle J.R.R., Guo X., Boyington J.C., Wei C.-J., Nabel G.J. Structural and genetic basis for development of broadly neutralizing influenza antibodies. Nature. 2012;489:566–570. doi: 10.1038/nature11371. [DOI] [PMC free article] [PubMed] [Google Scholar]
- Liston A., Carr E.J., Linterman M.A. Shaping variation in the human immune system. Trends Immunol. 2016;37:637–646. doi: 10.1016/j.it.2016.08.002. [DOI] [PubMed] [Google Scholar]
- Longo N.S., Lugar P.L., Yavuz S., Zhang W., Krijger P.H.L., Russ D.E., Jima D.D., Dave S.S., Grammer A.C., Lipsky P.E. Analysis of somatic hypermutation in X-linked hyper-IgM syndrome shows specific deficiencies in mutational targeting. Blood. 2009;113:3706–3715. doi: 10.1182/blood-2008-10-183632. [DOI] [PMC free article] [PubMed] [Google Scholar]
- Lun A.T.L., McCarthy D.J., Marioni J.C. A step-by-step workflow for low-level analysis of single-cell RNA-seq data with Bioconductor. F1000Res. 2016;5:2122. doi: 10.12688/f1000research.9501.2. [DOI] [PMC free article] [PubMed] [Google Scholar]
- McCarthy D.J., Campbell K.R., Lun A.T.L., Wills Q.F. Scater: pre-processing, quality control, normalization and visualization of single-cell RNA-seq data in R. Bioinformatics. 2017;33:1179–1186. doi: 10.1093/bioinformatics/btw777. [DOI] [PMC free article] [PubMed] [Google Scholar]
- McInnes L., Healy J., Melville J. UMAP: uniform manifold approximation and projection for dimension reduction. arXiv. 2020 doi: 10.48550/arXiv.1802.03426. Preprint at. [DOI] [Google Scholar]
- Moir S., Ho J., Malaspina A., Wang W., DiPoto A.C., O’Shea M.A., Roby G., Kottilil S., Arthos J., Proschan M.A., et al. Evidence for HIV-associated B cell exhaustion in a dysfunctional memory B cell compartment in HIV-infected viremic individuals. J. Exp. Med. 2008;205:1797–1805. doi: 10.1084/jem.20072683. [DOI] [PMC free article] [PubMed] [Google Scholar]
- Monaco G., Lee B., Xu W., Mustafah S., Hwang Y.Y., Carré C., Burdin N., Visan L., Ceccarelli M., Poidinger M., et al. RNA-seq signatures normalized by mRNA abundance allow absolute deconvolution of human immune cell types. Cell Rep. 2019;26:1627–1640.e7. doi: 10.1016/j.celrep.2019.01.041. [DOI] [PMC free article] [PubMed] [Google Scholar]
- Muellenbeck M.F., Ueberheide B., Amulic B., Epp A., Fenyo D., Busse C.E., Esen M., Theisen M., Mordmüller B., Wardemann H. Atypical and classical memory B cells produce Plasmodium falciparum neutralizing antibodies. J. Exp. Med. 2013;210:389–399. doi: 10.1084/jem.20121970. [DOI] [PMC free article] [PubMed] [Google Scholar]
- Nagumo H., Abe J., Kano H., Taki S., Yamazaki K., Yamazaki T., Kobayashi N., Koike K., Sugane K., Saito H., Agematsu K. Distinct response in maintenance of human naive and memory B cells via IL-21 receptor and TCL1/Akt pathways. Cell. Immunol. 2009;256:56–63. doi: 10.1016/j.cellimm.2009.01.005. [DOI] [PubMed] [Google Scholar]
- Nakamura G., Chai N., Park S., Chiang N., Lin Z., Chiu H., Fong R., Yan D., Kim J., Zhang J., et al. An in vivo human-plasmablast enrichment technique allows rapid identification of therapeutic influenza A antibodies. Cell Host Microbe. 2013;14:93–103. doi: 10.1016/j.chom.2013.06.004. [DOI] [PubMed] [Google Scholar]
- Nakaya H.I., Hagan T., Duraisingham S.S., Lee E.K., Kwissa M., Rouphael N., Frasca D., Gersten M., Mehta A.K., Gaujoux R., et al. Systems analysis of immunity to influenza vaccination across multiple years and in diverse populations reveals shared molecular signatures. Immunity. 2015;43:1186–1198. doi: 10.1016/j.immuni.2015.11.012. [DOI] [PMC free article] [PubMed] [Google Scholar]
- Naradikian M.S., Myles A., Beiting D.P., Roberts K.J., Dawson L., Herati R.S., Bengsch B., Linderman S.L., Stelekati E., Spolski R., et al. Cutting edge: IL-4, IL-21, and IFN-γ interact to govern T-bet and CD11c expression in TLR-activated B cells. J. Immunol. 2016;197:1023–1028. doi: 10.4049/jimmunol.1600522. [DOI] [PMC free article] [PubMed] [Google Scholar]
- Nellore A., Zumaquero E., Scharer C.D., King R.G., Tipton C.M., Fucile C.F., Mi T., Mousseau B., Bradley J.E., Zhou F., et al. Influenza-specific effector memory B cells predict long-lived antibody responses to vaccination in humans. bioRxiv. 2021 doi: 10.1101/643973. Preprint at. 643973. [DOI] [PMC free article] [PubMed] [Google Scholar]
- Paget J., Spreeuwenberg P., Charu V., Taylor R.J., Iuliano A.D., Bresee J., Simonsen L., Viboud C., Global Seasonal Influenza-associated Mortality Collaborator Network and GLaMOR Collaborating Teams∗ Global mortality associated with seasonal influenza epidemics: new burden estimates and predictors from the GLaMOR Project. J. Glob. Health. 2019;9:020421. doi: 10.7189/jogh.09.020421. [DOI] [PMC free article] [PubMed] [Google Scholar]
- Pasciuto E., Burton O.T., Roca C.P., Lagou V., Rajan W.D., Theys T., Mancuso R., Tito R.Y., Kouser L., Callaerts-Vegh Z., et al. Microglia require CD4 T cells to complete the fetal-to-adult transition. Cell. 2020;182:625–640.e24. doi: 10.1016/j.cell.2020.06.026. [DOI] [PMC free article] [PubMed] [Google Scholar]
- Picelli S., Faridani O.R., Björklund A.K., Winberg G., Sagasser S., Sandberg R. Full-length RNA-seq from single cells using Smart-seq2. Nat. Protoc. 2014;9:171–181. doi: 10.1038/nprot.2014.006. [DOI] [PubMed] [Google Scholar]
- Portugal S., Tipton C.M., Sohn H., Kone Y., Wang J., Li S., Skinner J., Virtaneva K., Sturdevant D.E., Porcella S.F., et al. Malaria-associated atypical memory B cells exhibit markedly reduced B cell receptor signaling and effector function. Elife. 2015;4:e07218. doi: 10.7554/eLife.07218. [DOI] [PMC free article] [PubMed] [Google Scholar]
- Pulendran B., Davis M.M. The science and medicine of human immunology. Science. 2020;369:eaay4014. doi: 10.1126/science.aay4014. [DOI] [PMC free article] [PubMed] [Google Scholar]
- Putri W.C.W.S., Muscatello D.J., Stockwell M.S., Newall A.T. Economic burden of seasonal influenza in the United States. Vaccine. 2018;36:3960–3966. doi: 10.1016/j.vaccine.2018.05.057. [DOI] [PubMed] [Google Scholar]
- Rizzetto S., Koppstein D.N.P., Samir J., Singh M., Reed J.H., Cai C.H., Lloyd A.R., Eltahla A.A., Goodnow C.C., Luciani F. B-cell receptor reconstruction from single-cell RNA-seq with VDJPuzzle. Bioinformatics. 2018;34:2846–2847. doi: 10.1093/bioinformatics/bty203. [DOI] [PubMed] [Google Scholar]
- Robinson M.D., McCarthy D.J., Smyth G.K. edgeR: a Bioconductor package for differential expression analysis of digital gene expression data. Bioinformatics. 2010;26:139–140. doi: 10.1093/bioinformatics/btp616. [DOI] [PMC free article] [PubMed] [Google Scholar]
- Rubtsov A.V., Rubtsova K., Fischer A., Meehan R.T., Gillis J.Z., Kappler J.W., Marrack P. Toll-like receptor 7 (TLR7)–driven accumulation of a novel CD11c+ B-cell population is important for the development of autoimmunity. Blood. 2011;118:1305–1315. doi: 10.1182/blood-2011-01-331462. [DOI] [PMC free article] [PubMed] [Google Scholar]
- Russell Knode L.M., Naradikian M.S., Myles A., Scholz J.L., Hao Y., Liu D., Ford M.L., Tobias J.W., Cancro M.P., Gearhart P.J. Age-associated B cells express a diverse repertoire of VH and vκ genes with somatic hypermutation. J. Immunol. 2017;198:1921–1927. doi: 10.4049/jimmunol.1601106. [DOI] [PMC free article] [PubMed] [Google Scholar]
- Silva-Cayetano A., Foster W.S., Innocentin S., Belij-Rammerstorfer S., Spencer A.J., Burton O.T., Fra-Bidó S., Le Lee J., Thakur N., Conceicao C., et al. A booster dose enhances immunogenicity of the COVID-19 vaccine candidate ChAdOx1 nCoV-19 in aged mice. Med (N Y) 2020;2:243–262.e8. doi: 10.1016/j.medj.2020.12.006. [DOI] [PMC free article] [PubMed] [Google Scholar]
- Song W., Antao O.Q., Condiff E., Sanchez G.M., Chernova I., Zembrzuski K., Steach H., Rubtsova K., Angeletti D., Lemenze A., et al. Development of Tbet- and CD11c-expressing B cells in a viral infection requires T follicular helper cells outside of germinal centers. Immunity. 2022;55:290–307.e5. doi: 10.1016/j.immuni.2022.01.002. [DOI] [PMC free article] [PubMed] [Google Scholar]
- Stebegg M., Bignon A., Hill D.L., Silva-Cayetano A., Krueger C., Vanderleyden I., Innocentin S., Boon L., Wang J., Zand M.S., et al. Rejuvenating conventional dendritic cells and T follicular helper cell formation after vaccination. Elife. 2020;9:e52473. doi: 10.7554/eLife.52473. [DOI] [PMC free article] [PubMed] [Google Scholar]
- Stuart T., Butler A., Hoffman P., Hafemeister C., Papalexi E., Mauck W.M., 3rd, Hao Y., Stoeckius M., Smibert P., Satija R., Satija R. Comprehensive integration of single-cell data. Cell. 2019;177:1888–1902.e21. doi: 10.1016/j.cell.2019.05.031. [DOI] [PMC free article] [PubMed] [Google Scholar]
- Sutton H.J., Aye R., Idris A.H., Vistein R., Nduati E., Kai O., Mwacharo J., Li X., Gao X., Andrews T.D., et al. Atypical B cells are part of an alternative lineage of B cells that participates in responses to vaccination and infection in humans. Cell Rep. 2021;34:108684. doi: 10.1016/j.celrep.2020.108684. [DOI] [PMC free article] [PubMed] [Google Scholar]
- Thomson C.A., Wang Y., Jackson L.M., Olson M., Wang W., Liavonchanka A., Keleta L., Silva V., Diederich S., Jones R.B., et al. Pandemic H1N1 influenza infection and vaccination in humans induces cross-protective antibodies that target the Hemagglutinin stem. Front. Immunol. 2012;3:87. doi: 10.3389/fimmu.2012.00087. [DOI] [PMC free article] [PubMed] [Google Scholar]
- Tsang J.S., Schwartzberg P.L., Kotliarov Y., Biancotto A., Xie Z., Germain R.N., Wang E., Olnes M.J., Narayanan M., Golding H., et al. Global analyses of human immune variation reveal baseline predictors of postvaccination responses. Cell. 2014;157:499–513. doi: 10.1016/j.cell.2014.03.031. [DOI] [PMC free article] [PubMed] [Google Scholar]
- Turner V.M., Mabbott N.A. Structural and functional changes to lymph nodes in ageing mice. Immunology. 2017;151:239–247. doi: 10.1111/imm.12727. [DOI] [PMC free article] [PubMed] [Google Scholar]
- Turner J.S., Zhou J.Q., Han J., Schmitz A.J., Rizk A.A., Alsoussi W.B., Lei T., Amor M., McIntire K.M., Meade P., et al. Human GCs engage memory and naive B cells after influenza vaccination. Nature. 2020;586:127–132. doi: 10.1038/s41586-020-2711-0. [DOI] [PMC free article] [PubMed] [Google Scholar]
- Nazarov V., immunarch.bot. Rumynskiy E. Zenodo; 2020. immunomind/immunarch: 0.6.5: basic single-cell support. [Google Scholar]
- Van P., Jiang W., Gottardo R., Finak G. ggCyto: next generation open-source visualization software for cytometry. Bioinformatics. 2018;34:3951–3953. doi: 10.1093/bioinformatics/bty441. [DOI] [PMC free article] [PubMed] [Google Scholar]
- Webb L.M.C., Fra-Bido S., Innocentin S., Matheson L.S., Attaf N., Bignon A., Novarino J., Fazilleau N., Linterman M.A. Ageing promotes early T follicular helper cell differentiation by modulating expression of RBPJ. Aging Cell. 2021;20:e13295. doi: 10.1111/acel.13295. [DOI] [PMC free article] [PubMed] [Google Scholar]
- Weiss G.E., Crompton P.D., Li S., Walsh L.A., Moir S., Traore B., Kayentao K., Ongoiba A., Doumbo O.K., Pierce S.K. Atypical memory B cells are greatly expanded in individuals living in a malaria-endemic area. J. Immunol. 2009;183:2176–2182. doi: 10.4049/jimmunol.0901297. [DOI] [PMC free article] [PubMed] [Google Scholar]
- Wheatley A.K., Kristensen A.B., Lay W.N., Kent S.J. HIV-dependent depletion of influenza-specific memory B cells impacts B cell responsiveness to seasonal influenza immunisation. Sci. Rep. 2016;6:26478. doi: 10.1038/srep26478. [DOI] [PMC free article] [PubMed] [Google Scholar]
- Whittle J.R.R., Wheatley A.K., Wu L., Lingwood D., Kanekiyo M., Ma S.S., Narpala S.R., Yassine H.M., Frank G.M., Yewdell J.W., et al. Flow cytometry reveals that H5N1 vaccination elicits cross-reactive stem-directed antibodies from multiple ig heavy-chain lineages. J. Virol. 2014;88:4047–4057. doi: 10.1128/JVI.03422-13. [DOI] [PMC free article] [PubMed] [Google Scholar]
- Wrammert J., Koutsonanos D., Li G.-M., Edupuganti S., Sui J., Morrissey M., McCausland M., Skountzou I., Hornig M., Lipkin W.I., et al. Broadly cross-reactive antibodies dominate the human B cell response against 2009 pandemic H1N1 influenza virus infection. J. Exp. Med. 2011;208:181–193. doi: 10.1084/jem.20101352. [DOI] [PMC free article] [PubMed] [Google Scholar]
- Xie Y., Allaire J.J., Grolemund G. Boca Raton, Florida: Chapman and Hall/CRC; 2018. R Markdown: The Definitive Guide. [Google Scholar]
- Xie Y., Dervieux C., Riederer E. Boca Raton, Florida: Chapman and Hall/CRC; 2020. R Markdown Cookbook. [Google Scholar]
Associated Data
This section collects any data citations, data availability statements, or supplementary materials included in this article.
Supplementary Materials
Data Availability Statement
-
•
Raw single cell sequencing data are deposited in GEO (https://www.ncbi.nlm.nih.gov/geo/) and are publicly available as of the date of publication under the accession GSE167823. The Turner et al. dataset (Turner et al., 2020) is available from GEO with the accession GSE148633. Other primary data, for example raw FCS files, are available from the authors upon reasonable request.
-
•
Corresponding R code for the SMART-Seq gene expression and BCR analyses, 10×/Seurat analyses, and phenotypic data is available at the github repository and is publicly available as of the date of publication: https://github.com/lintermanlab/B_flu_scRNAseq.
-
•
Any additional information required to reanalyze the data reported in this paper is available from the lead contact upon request.