

Abstract
Determining the risk posed by PFAS leaching from soil to groundwater requires quantification of the magnitude and temporal/spatial variability of PFAS mass discharge from the vadose zone, which is governed in part by the concentrations of PFAS in soil porewater. Porewater concentrations are impacted and mediated by the properties of the PFAS and soil, multiple transport and fate processes, and site conditions. The objective of this research was to delineate the relationship between soil porewater concentrations and soil concentrations, based on a comprehensive model of PFAS mass distribution within a soil sample volume. Measured parameters representing solid-phase sorption and air-water interfacial adsorption are used to illustrate the impact of soil and PFAS properties on the distribution of representative PFAS between soil and soil porewater. Literature data reported for soil and soil porewater concentrations of several PFAS obtained from outdoor lysimeter experiments are used to test the distribution model. Soil-to-porewater concentration ratios predicted with the model compared very well to the measured concentration ratios. The nondimensional distribution coefficient that describes the distribution of PFAS mass amongst all domains within a soil sample was observed to be a function of PFAS molecular size. Numerical simulations conducted for a model fire-training source area were used to illustrate the ranges in magnitude of soil versus porewater concentrations for representative field conditions. The results of the measured and simulated data sets demonstrated the importance of air-water interfacial adsorption for the distribution of the longer-chain PFAS within soil samples. PFAS soil porewater concentrations are anticipated to range from ng/L to mg/L depending upon soil concentrations, which in turn depend upon the nature of the site.
Keywords: PFOS, PFOA, Perfluorinated, Sorption, Air-water Interfacial adsorption, Leaching
1. Introduction
Per and polyfluoroalkyl substances (PFAS) have been demonstrated to be widespread in soils across the globe (Brusseau et al., 2020). PFAS concentrations are often, but not always, observed to be highest near the surface and to diminish with depth. This is particularly the case for longer-chain PFAS. This distribution has been observed for different types of source sites, including sites impacted by fire-fighting foam applications (Filipovic et al., 2015; Baduel et al., 2017; Dauchy et al., 2019; Brusseau et al., 2020), manufacturing facilities (Davis et al. 2007), and land application of biosolids (Washington et al., 2010; Sepulvado et al. 2011; Pepper et al., 2021; Johnson, 2022). In addition, the concentrations of PFAS in soils are typically significantly higher than those in underlying groundwater, often by orders of magnitude (Anderson et al., 2019; Brusseau et al., 2020). These observations demonstrate that soils are a primary reservoir of PFAS at numerous sites. A critical concern for these sites is the potential for leaching of PFAS from soil, through the vadose zone, to groundwater, as illustrated by field-site investigations (Xiao et al., 2015; Baduel et al., 2017; Weber et al., 2017; Hoisaeter et al., 2019; Dauchy et al., 2019) and mathematical-modeling studies (Guo et al., 2020; Silva et al., 2020; Zeng et al., 2021).
The transport of PFAS in soils and the vadose zone is complex, as it is influenced by several potentially nonlinear, rate-limited interconnected processes. Transport experiments, mathematical-modeling studies, and field investigations have for example illustrated the impacts of solid-phase sorption, adsorption at air-water interfaces, and precursor transformation on PFAS migration (e,g., Gellrich et al., 2012; Vierke et al., 2014; Lyu et al., 2018; Brusseau et al., 2019a, 2019b; Hoisaeter et al., 2019; McLachlan et al., 2019; Guelfo et al., 2020; Guo et al., 2020; Silva et al., 2020; Brusseau et al., 2021; Nickerson et al., 2021). Determining the risk posed by PFAS leaching to groundwater requires quantification of the magnitude and temporal/spatial variability of PFAS mass discharge from the vadose zone. This mass discharge is governed by fluid discharge and the concentrations of PFAS in soil porewater, the latter of which is mediated by operative retention and transformation processes.
PFAS soil porewater concentrations and associated mass discharge can be quantified through the application of mathematical models. Comprehensive models that incorporate mechanistic representations of all relevant processes are important for determining the impact and importance of the various processes influencing transport. However, their application requires significant information for parameter input, which is not always practical. An alternative is the use of screening-level models that have reduced input requirements. For example, a screening model employing analytical solutions for predicting long-term leaching of PFAS has been recently developed (Guo et al., 2022). While the level of input is reduced, there remains the need for characterization efforts to supply required parameters.
Direct measurement of PFAS concentrations in soil porewater is an alternative approach for characterizing mass discharge (Anderson et al., 2021; Quinnan et al., 2021). Porewater sampling can be used in lieu of, or preferably in conjunction with, mathematical modeling for site characterization. Effective use of porewater concentration data requires an understanding of the distribution of PFAS mass within a volume element of soil, and the relationship between soil and porewater concentrations. This relationship is more complex for PFAS compared to most other types of solutes due to the adsorption of PFAS at air-water interfaces, and the dependence of air-water interfacial area on water content and soil properties. This relationship between soil and soil porewater concentrations has not yet been investigated.
The objective of this research is to delineate the relationship between soil porewater concentrations and soil concentrations, based on a comprehensive model of PFAS mass distribution within a soil sample volume. Measured parameters representing solid-phase sorption and air-water interfacial adsorption are used to illustrate the impact of soil and PFAS properties on the distribution of PFAS between soil and soil porewater. Literature data reported for soil and soil porewater concentrations of several PFAS obtained from outdoor lysimeter experiments are used to test the distribution model. Soil-to-porewater concentration ratios predicted with the model are compared to the measured concentration ratios. Numerical simulations conducted for a model fire-training source area are used to illustrate the magnitude of soil versus porewater concentrations for representative field conditions. The importance of air-water interfacial adsorption for mediating the distribution of PFAS within a soil sample is examined using the simulated and measured data sets.
2. Theory
We are interested in the distribution of PFAS among all possible domains within a volume sample of soil in the presence of a variety of phases including air (soil atmosphere), water (porewater), solids, nonaqueous-phase liquid (NAPL), and colloidal and other suspended and dissolved matter. This distribution is described and quantified using the comprehensive retention model of Brusseau (Brusseau, 2018; Brusseau et al., 2019a). The total mass of a select PFAS constituent in a volume of soil is given by:
| [1] |
where Mt is total mass in the volume of sample (M), Cp is the porewater concentration (M/L3), Cs represents the mass of PFAS sorbed by the soil solids (soil-solids concentration, M/M), Ca is the concentration in the soil atmosphere (M/L3), Cn is the concentration in NAPL present in the sample (M/L3), Caw represents the mass adsorbed at the air-water interface (air-water interfacial concentration (M/L2), Cnw represents the mass adsorbed at the NAPL-water interface (NAPL-water interfacial concentration (M/L2), Can represents the mass adsorbed at the air-NAPL interface (air-NAPL interfacial concentration (M/L2), Cc represents the mass associated with colloidal and other suspended and dissolved matter in solution (M/M), Aaw is the total air-water interfacial area (L2), Anw is the total NAPL-water interfacial area (L2), Aan is the total air-NAPL interfacial area (L2), Vw is the volume of porewater (L3), Va is the volume of air (L3), Vn is the volume of NAPL (L3), Ms is the mass of soil solids (M), and Mc is the mass of colloidal material (M).
Normalizing the phase volumes, phase masses, and interfacial areas by the total sample volume, Vt, and introducing the equilibrium distribution coefficients results in transformation of equation 1 to:
| [2] |
where Kd* is the nonlinear solid-phase adsorption coefficient (cm3/g), Kn is the NAPL-water partition coefficient (−), Ka is the air-water partition coefficient (Henry’s coefficient, −), Kaw* is the nonlinear air-water interfacial adsorption coefficient (cm3/cm2), Knw* is the nonlinear NAPL-water interfacial adsorption coefficient (cm3/cm2), Kan* is the nonlinear air-NAPL interfacial adsorption coefficient (cm3/cm2), Kc* is the nonlinear distribution coefficient for sorption by the colloids (cm3/g), aaw is the specific air-water interfacial area (cm2/cm3), anw is the specific NAPL-water interfacial area (cm2/cm3), aan is the specific air-NAPL interfacial area (cm2/cm3), ρb is porous-medium bulk density (g/cm3), θa is volumetric air content (cm3/cm3), θn is volumetric NAPL content (cm3/cm3), and θw is volumetric water content (cm3/cm3). By phase balance, θw + θa + θn = n, where n is porosity. Note that Xc is the concentration of colloidal material in porewater (g/cm3), defined as:
| [3] |
Both solid-phase sorption and fluid-fluid interfacial adsorption of PFAS may be nonlinear under certain conditions. The nonlinearity of solid-phase sorption is often represented with the Freundlich isotherm. With this approach, the impact of nonlinearity on the magnitude of sorption can be represented by Kd* = KfCp0(N−1), where Kf and N are the Freundlich coefficients and Cp0 is the aqueous concentration of interest. This approach may also be applied to sorption by colloidal matter. When sorption is linear, Kd* = Kd and Kc* = Kc, where the coefficients without asterisks represent constants. A standard approach for representing nonlinear fluid-fluid interfacial adsorption is through use of the Szyszkowski-Langmuir equation, which leads to (using the air-water system as the example): Kaw* = Γm/(Cp+a), where Γm is the maximum surface excess (=γ0b/RT), R is the universal gas constant, T is temperature, γ0 is the surface tension when Cp is zero, and a and b are constants from the Szyszkowski equation that describes surface tension as a function of aqueous concentration. This treatment can also be applied to represent nonlinear NAPL-water and air-NAPL interfacial adsorption processes. Fluid-fluid interfacial adsorption may be treated as linear at lower concentrations (e.g., Brusseau et al., 2021). Under these conditions, Kaw* = Kaw, Knw* = Knw, and Kan* = Kan, where the coefficients without asterisks represent constants. The specific concentrations at which fluid-fluid interfacial adsorption may be treated as linear depends upon the particular PFAS and properties of the porewater solution (Brusseau, 2019a). Partitioning between bulk water, NAPL, and air phases is commonly treated as linear.
The terms in parentheses in equation 2 can be defined as the nondimensional distribution coefficient, denoted as Rd:
| [4] |
This term is very similar to the retardation factor developed for aqueous-phase transport of PFAS undergoing retention by all of the relevant processes (Brusseau et al., 2019a). The one difference is the treatment of PFAS mass associated with colloidal matter suspended or dissolved in porewater, which was incorporated into the mobile solution phase for development of the retardation factor for transport. With the introduction of Rd, equation 2 becomes:
| [5] |
The total concentration of the select PFAS, Ct (M/M), is defined as Mt/Ms. Substituting equation 5 gives:
| [6] |
The ratio of total concentration to porewater concentration is therefore:
| [7] |
Inspection of equation 7 reveals that Rd represents the ratio of total mass present in the soil sample to the mass present as dissolved solute in porewater. The term represents the ratio of porewater volume to soil-solids mass and can be thought of as a unit conversion term. Note that the term has units of L3/M. A dimensionless ratio can be developed by use of a volume-based total concentration, Ctv (M/L3), defined as Mt/Vt. Ct and Ctv are related by the soil bulk density. Ct is the focus of the present study given that mass-based soil concentrations are the reporting standard.
Equations 2 and 4–7 represent all possible phases in which PFAS can potentially reside within a soil sample. However, several of the phases are unlikely to be relevant for many conditions. For example, many PFAS of concern have low vapor pressures and are thus not measurably present in the vapor phase. In addition, many sites are unlikely to have NAPL present in the vadose zone. Inspection of equation 2 shows that the impact of retention by sorption to colloidal material in porewater will be relatively insignificant for moderate to low concentrations of colloids and for smaller sorption coefficients. Under these preceding conditions, Rd can be simplified to:
| [8] |
Examining this reduced form will be the focus of the present investigation.
3. Methods
This study comprises four components. For the first component, the ratio of total soil concentration to soil porewater concentration as a function of water saturation will be investigated for representative primary PFAS of concern. This will be accomplished by using measured and estimated parameter values to calculate Rd values using equation 8, and then using these values in equation 7. Three perfluorocarboxylic acids (PFCAs) of different chain length will be used to examine chain-length effects. These three are perfluorobutanoic acid (PFBA), perfluorooctanoic acid (PFOA), and perfluorotridecanoic acid (PFTDA). Perfluorooctane sulfonic acid (PFOS) will also be included in the analysis. A natural sand will be used as the porous medium for these calculations to focus on the impact of air-water interfacial adsorption. Measured values for aaw are available for this sand from our prior experiments (Brusseau and Guo, 2021), as are Kd and Kaw values for the selected PFAS (Van Glubt et al., 2021). These values are reported in Tables 1 and 2. The calculations are conducted employing constant Kaw values, representing systems with PFAS concentrations in the μg/L range or lower.
Table 1.
PFAS Parameter Values
| PFAS | Kaw (cm) | Kd-Sand (cm3/g) | Kd-Eustis (cm3/g) | Kd-Vinton (cm3/g) | Kd-Soila (cm3/g) |
|---|---|---|---|---|---|
| PFBA | 0.00003 | 0.07 | - | - | 0.03 |
| PFHxA | 0.0002 | - | - | - | 0.19 |
| PFOA | 0.003 | 0.15 | - | - | 1.0 |
| PFNA | 0.014 | - | - | - | 2.5 |
| PFDA | 0.07 | - | - | - | 7.9 |
| PFUnDA | 0.128 | - | - | - | 28 |
| PFTrDA | 0.26 | 2.8 | - | - | 154 |
| PFBS | 0.00017 | - | - | - | 0.12 |
| PFOS | 0.05 | 0.25 | 1.9 | 1.9 | 5.7 |
| Data Source | Brusseau & Van Glubt, 2021 | Van Glubt et al., 2021 | Brusseau et al., 2019b | Brusseau et al., 2019b | Brusseau, 2019b |
Medium for the Felizeter et al. (2021) study
Table 2.
Air-Water Interfacial Area Values
| Porous Medium | Range of Sw Valuesb | Range of aaw Valuesc (cm−1) |
|---|---|---|
| Sand | 0.2–1 | 0–419 |
| Eustis | 0.2–1 | 0–656 |
| Vinton | 0.2–1 | 0–1026 |
| Soila | 0.51–0.68 | 428–866 |
Medium for the Felizeter et al. (2021) study
Sw is water saturation
Air-water interfacial area is a function of water saturation
The second component focuses on determining Ct/Cp ratios for PFOS as a function of water saturation for three porous media for which PFOS has different magnitudes of solid-phase sorption and that have different magnitudes of air-water interfacial area. Measured values for aaw are available for the three media from our prior experiments (Brusseau and Guo, 2021; El Ouni et al., 2021), and are reported in Table 2. Measured Kd values for PFOS for the three media are reported in Table 1. Freundlich N values reported for sorption of PFCAs by soils and sediments are typically in the range of 0.7–1 (see recent compilation reported in Van Glubt et al., 2021), thereby exhibiting relatively moderate nonlinearity. Hence, solid-phase sorption will be treated as linear for the purposes of the first and second components. This treatment has minimal impact on the results.
The third component of the study employs literature data reported for soil and soil porewater concentrations of several PFAS obtained from outdoor lysimeter experiments (Felizeter et al. 2021). These measured data are used to test the distribution model by comparing soil-to-porewater concentration ratios predicted with the model to the measured concentration ratios. Four edible crops (radish, lettuce, pea, and maize) were grown in outdoor lysimeters packed with soil spiked with a mixture of 13 PFAS at 4 concentrations (nominal 0.1, 1, 5, and 10 mg/kg-dw for each PFAS). The PFAS mixture comprised 11 PFCAs, PFOS, and perfluorobutane sulfonic acid (PFBS). The lysimeters were installed in the ground outside, and subject to natural precipitation events as well as additional irrigation. PFAS concentrations were measured in soil, soil porewater, and different plant tissues at harvest. Soil water contents were also reported.
Values for Rd defined in equation 8 were determined using measured and estimated parameter values as follows. The soil employed has an organic-carbon content of 1%. Prior research has indicated that soil organic carbon generally controls sorption of PFCAs and PFOS for soils and sediments with organic-carbon contents in this range and higher (e.g., Higgins and Luthy, 2006; Milinovic et al., 2015; Brusseau et al., 2019b). Therefore, Kd values were estimated from the standard Kd = Koc foc approach, with use of measured Koc values (Brusseau, 2019). Measured values for Kaw were taken from Brusseau and Van Glubt (2021). Values for aaw were estimated using measured data reported for several porous media comprising a range of textures (Peng and Brusseau, 2005; Brusseau and Guo, 2021; El Ouni et al., 2021).
The fourth component of the study comprises two sets of numerical simulations for a model fire-training source area. The first set focuses on the long-term distribution of PFAS in the vadose zone and the magnitudes of soil versus porewater concentrations for representative field conditions, while the second set illustrates the impact of a precipitation event on short-term changes in . The mathematical model that was employed to conduct the numerical simulations accounts for transient variably saturated flow, surfactant-induced flow, nonlinear and rate-limited solid-phase sorption, and nonlinear and rate-limited air-water interfacial adsorption (Guo et al., 2020). A 30-year period of operation is used wherein PFAS are released to the vadose zone due to regular fire training activities. This is followed by a post-operation period where the release of PFAS is stopped. The measured properties for a well-characterized soil (Vinton) are used to represent a homogeneous vadose zone.
Three representative PFAS (PFPeA, PFOA, and PFOS) are considered. The PFAS are released to the vadose zone in a 1% diluted AFFF solution at concentrations of 0.23 mg/L, 0.9 mg/L, and 100 mg/L, respectively, for PFPeA, PFOA, and PFOS. Real rainfall and evaporation data at 30-min resolution from a site in New Jersey are used to represent the climatic conditions for a humid region. The details of the model setup and other input parameters are the same as those used in the numerical simulations reported in Guo et al (2022). The analysis in the present study focuses on the post-operation period. In addition to the long-term numerical simulations, a set of short-term (10 day) simulations is conducted to analyze the dynamic changes of porewater concentration and the ratio of total to porewater concentration during and immediately after a relatively large storm. The PFAS concentration at the end of the 30-year contamination period is used as the initial condition for these short-term simulations.
4. Results and Discussion
4.1. The Ct versus Cp relationship as a function of PFAS, soil properties, and water saturation
Inspection of equation 8 reveals that relative distribution of PFAS between the different domains within a soil sample, represented by Rd, is a function of both properties of the PFAS and properties of the soil. It has been demonstrated that both Kd and Kaw are functions of the molecular size of PFAS (e.g., Higgins and Luthy, 2006; Brusseau, 2019a, 2019b). The magnitude of sorption will also be a function of the geochemical properties of the soil, such as the constituent contents and compositions (e.g., organic carbon, clay minerals, metal oxides). The magnitude of air-water interfacial adsorption will be mediated by the amount of air-water interface present, which is a function in part of soil properties (grain size, solid surface area). Finally, it is observed that Rd is a function water content for a given soil and PFAS, both directly through the θw terms and indirectly through the dependence of aaw on water content. It is well established that aaw increases with decreasing θw (e.g., Kim et al., 1997; Anwar et al., 2000; Peng and Brusseau, 2005; Brusseau and Guo, 2021; El Ouni et al., 2021). As a result of these functionalities for Rd, the ratio between Ct and Cp is a function of PFAS molecular size, soil properties, and water content. These dependencies are illustrated in this section.
The Ct/Cp relationship as a function of water saturation is presented in Figure 1 for the four selected PFAS. Ct/Cp is observed to be less than one for PFBA and PFOA over the entire range of water saturation. Inspection of equation 7 reveals that for sufficiently small Rd values, Ct/Cp will be less than one due to the impact of the term (which is always <1). The Ct/Cp decreases with decreasing water saturation for PFBA. This is due to the minimal impact of air-water interfacial adsorption on PFBA distribution within the sample. As a result, the increase in Rd that results from decreasing water saturation is less than the corresponding decrease in the term. Conversely, the Ct/Cp increases with decreasing water saturation for PFOA. This is due to a substantial increase in Rd accruing to the impact of air-water interfacial adsorption and the increase in the magnitude of air-water interfacial area with decreasing water saturation.
Figure 1.
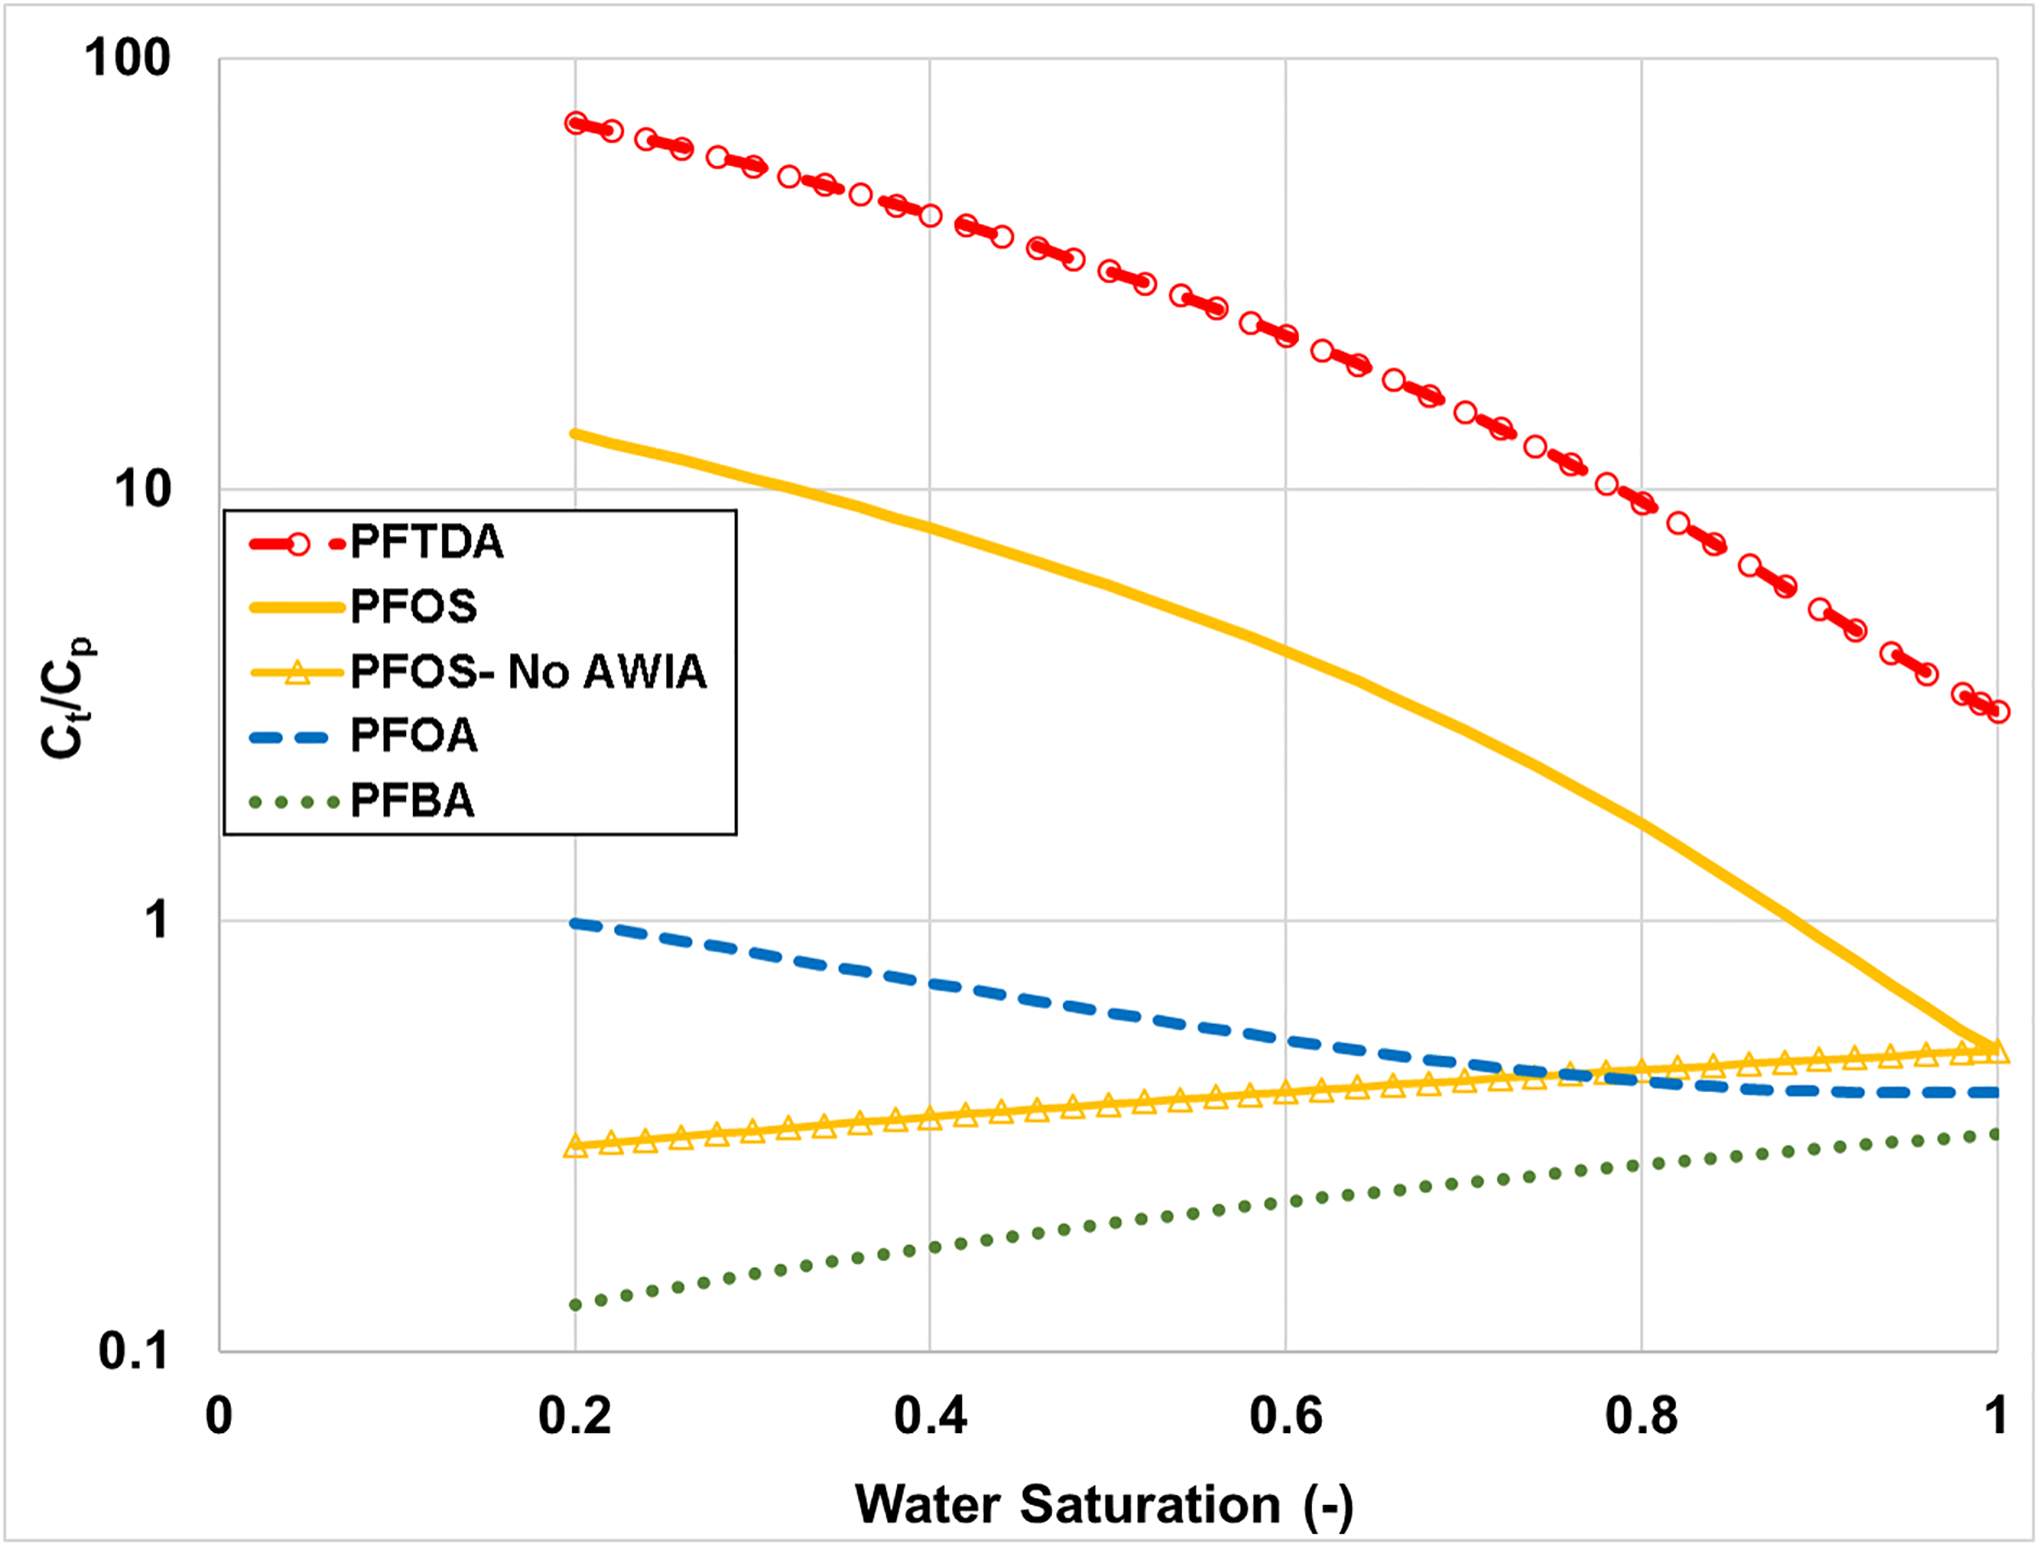
Ratio of total soil concentration (Ct) to porewater concentration (Cp) of an individual PFAS for four representative PFAS. Parameters used are representative of the sand. AWIA represents air-water interfacial adsorption.
In contrast to PFBA and PFOA, the Ct/Cp values for PFTDA and PFOS are >1 for all and almost all water saturations, respectively. This is a result of the larger magnitudes of solid-phase sorption for PFOS and particularly PFTDA (see respective Kd values in Table 1). Ct/Cp increases with decreasing water saturation for PFTDA and PFOS due to the impact of air-water interfacial adsorption as described above for PFOA.
The Ct/Cp relationship for PFOS as a function of water saturation is presented in Figure 2 for three porous media. The Ct/Cp values are largest for the Vinton soil at any given water saturation because this medium has the largest magnitude of air-water interfacial area (Table 2). Conversely, the Ct/Cp values are smallest for the sand due to the smaller Kd and aaw values.
Figure 2.
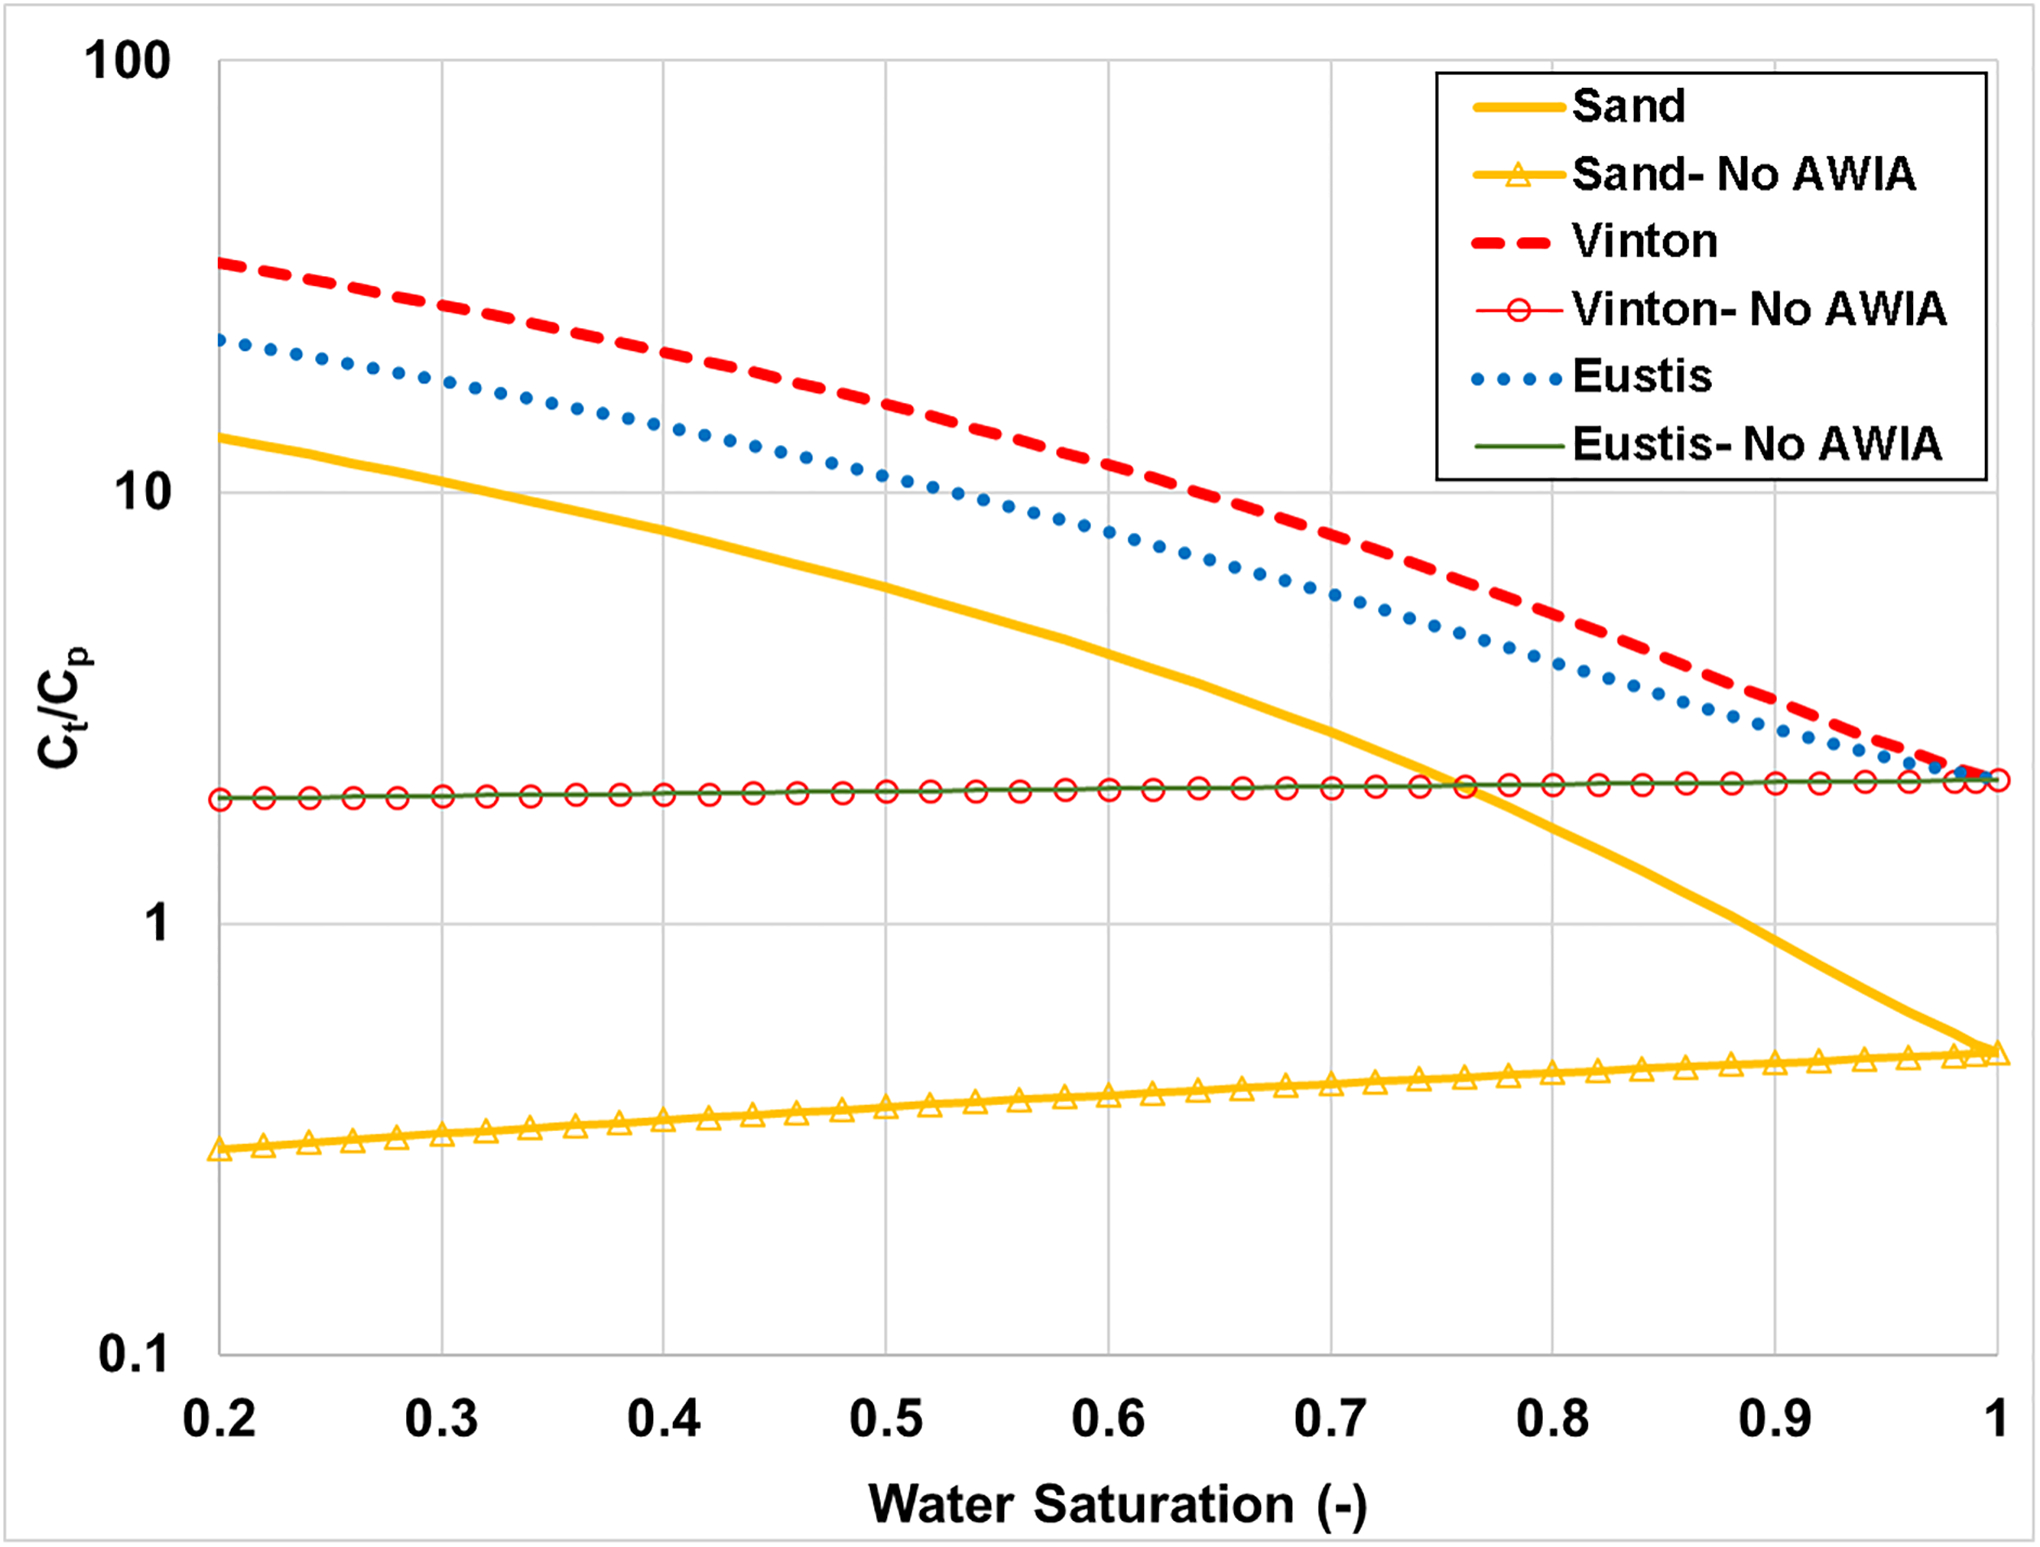
Ratio of total soil concentration (Ct) to porewater concentration (Cp) for PFOS in three porous media. AWIA represents air-water interfacial adsorption.
The specific impact of air-water interfacial adsorption, and the underlying influence of the decrease in water saturation on the relative significance of this process, is illustrated by comparing the PFOS Ct/Cp values for the cases with and without air-water interfacial adsorption in Figures 1 and 2. The divergence between the paired sets of curves progressively increases as water saturation decreases in all cases. Similar results are observed for PFTDA (data not shown). These results highlight the impact of air-water interfacial adsorption on the distribution of longer-chain PFAS within soil samples. This retention process will significantly influence porewater concentrations under certain conditions.
4.2. Prediction of measured soil-to-porewater concentration ratios
The outdoor lysimeter study of Felizeter et al. (2021) represents one of the first to present field-based measurements of PFAS porewater concentrations. The measured porewater concentrations range from 0.1 to ~4000 μg/L depending upon the individual PFAS (Table 3). The measured soil concentrations (Cs) range from ~0.3 to ~8000 μg/kg. The measured soil concentrations are designated as Cs to differentiate them from the theoretical Ct term, as will be discussed in more detail in section 4.5.
Table 3.
Porewater Data from the Felizeter et al. (2021) Study
| PFAS | Cp (ug/L) | Rd Measureda |
|---|---|---|
| PFBA | 36–225 | 1.0 |
| PFHxA | 0.4–127 | 3.2 |
| PFOA | 3–3994 | 11.6 |
| PFNA | 0.2–1777 | 52.7 |
| PFDA | 0.1–293 | 248 |
| PFUnDA | 42–6000 | 702 |
| PFTDA | 5–81 | 1785 |
| PFBS | 3–175 | 7.4 |
| PFOS | 3–548 | 195 |
Calculated for this study using the raw data reported in Felizeter et al. (2021)
The measured Cs and Cp data reported in the study were used to determine measured Cs/Cp values. Inspection of Table 3 shows that the measured Cs/Cp values are <1 for the shortest-chain PFAS and >1 for the longer-chain PFAS, consistent with the results presented in Figure 1. This again is due to the different magnitudes of retention experienced by the short-chain versus long-chain PFAS under the extant conditions of the experiment. Measured Rd values were calculated with equation 7 using the measured Cs/Cp values, and are presented in Table 3. The measured Rd values range by more than three orders of magnitude, from 1 for PFBA to 1777 for PFTDA. The values are observed to be a function of PFAS size. This is illustrated by Figure 3, wherein log Rd is shown to be a linear function of PFAS molar volume. This is consistent with prior research demonstrating that both log Kd and Log Kaw for PFAS are functions of molar volume (Brusseau, 2019a, 2019b).
Figure 3.
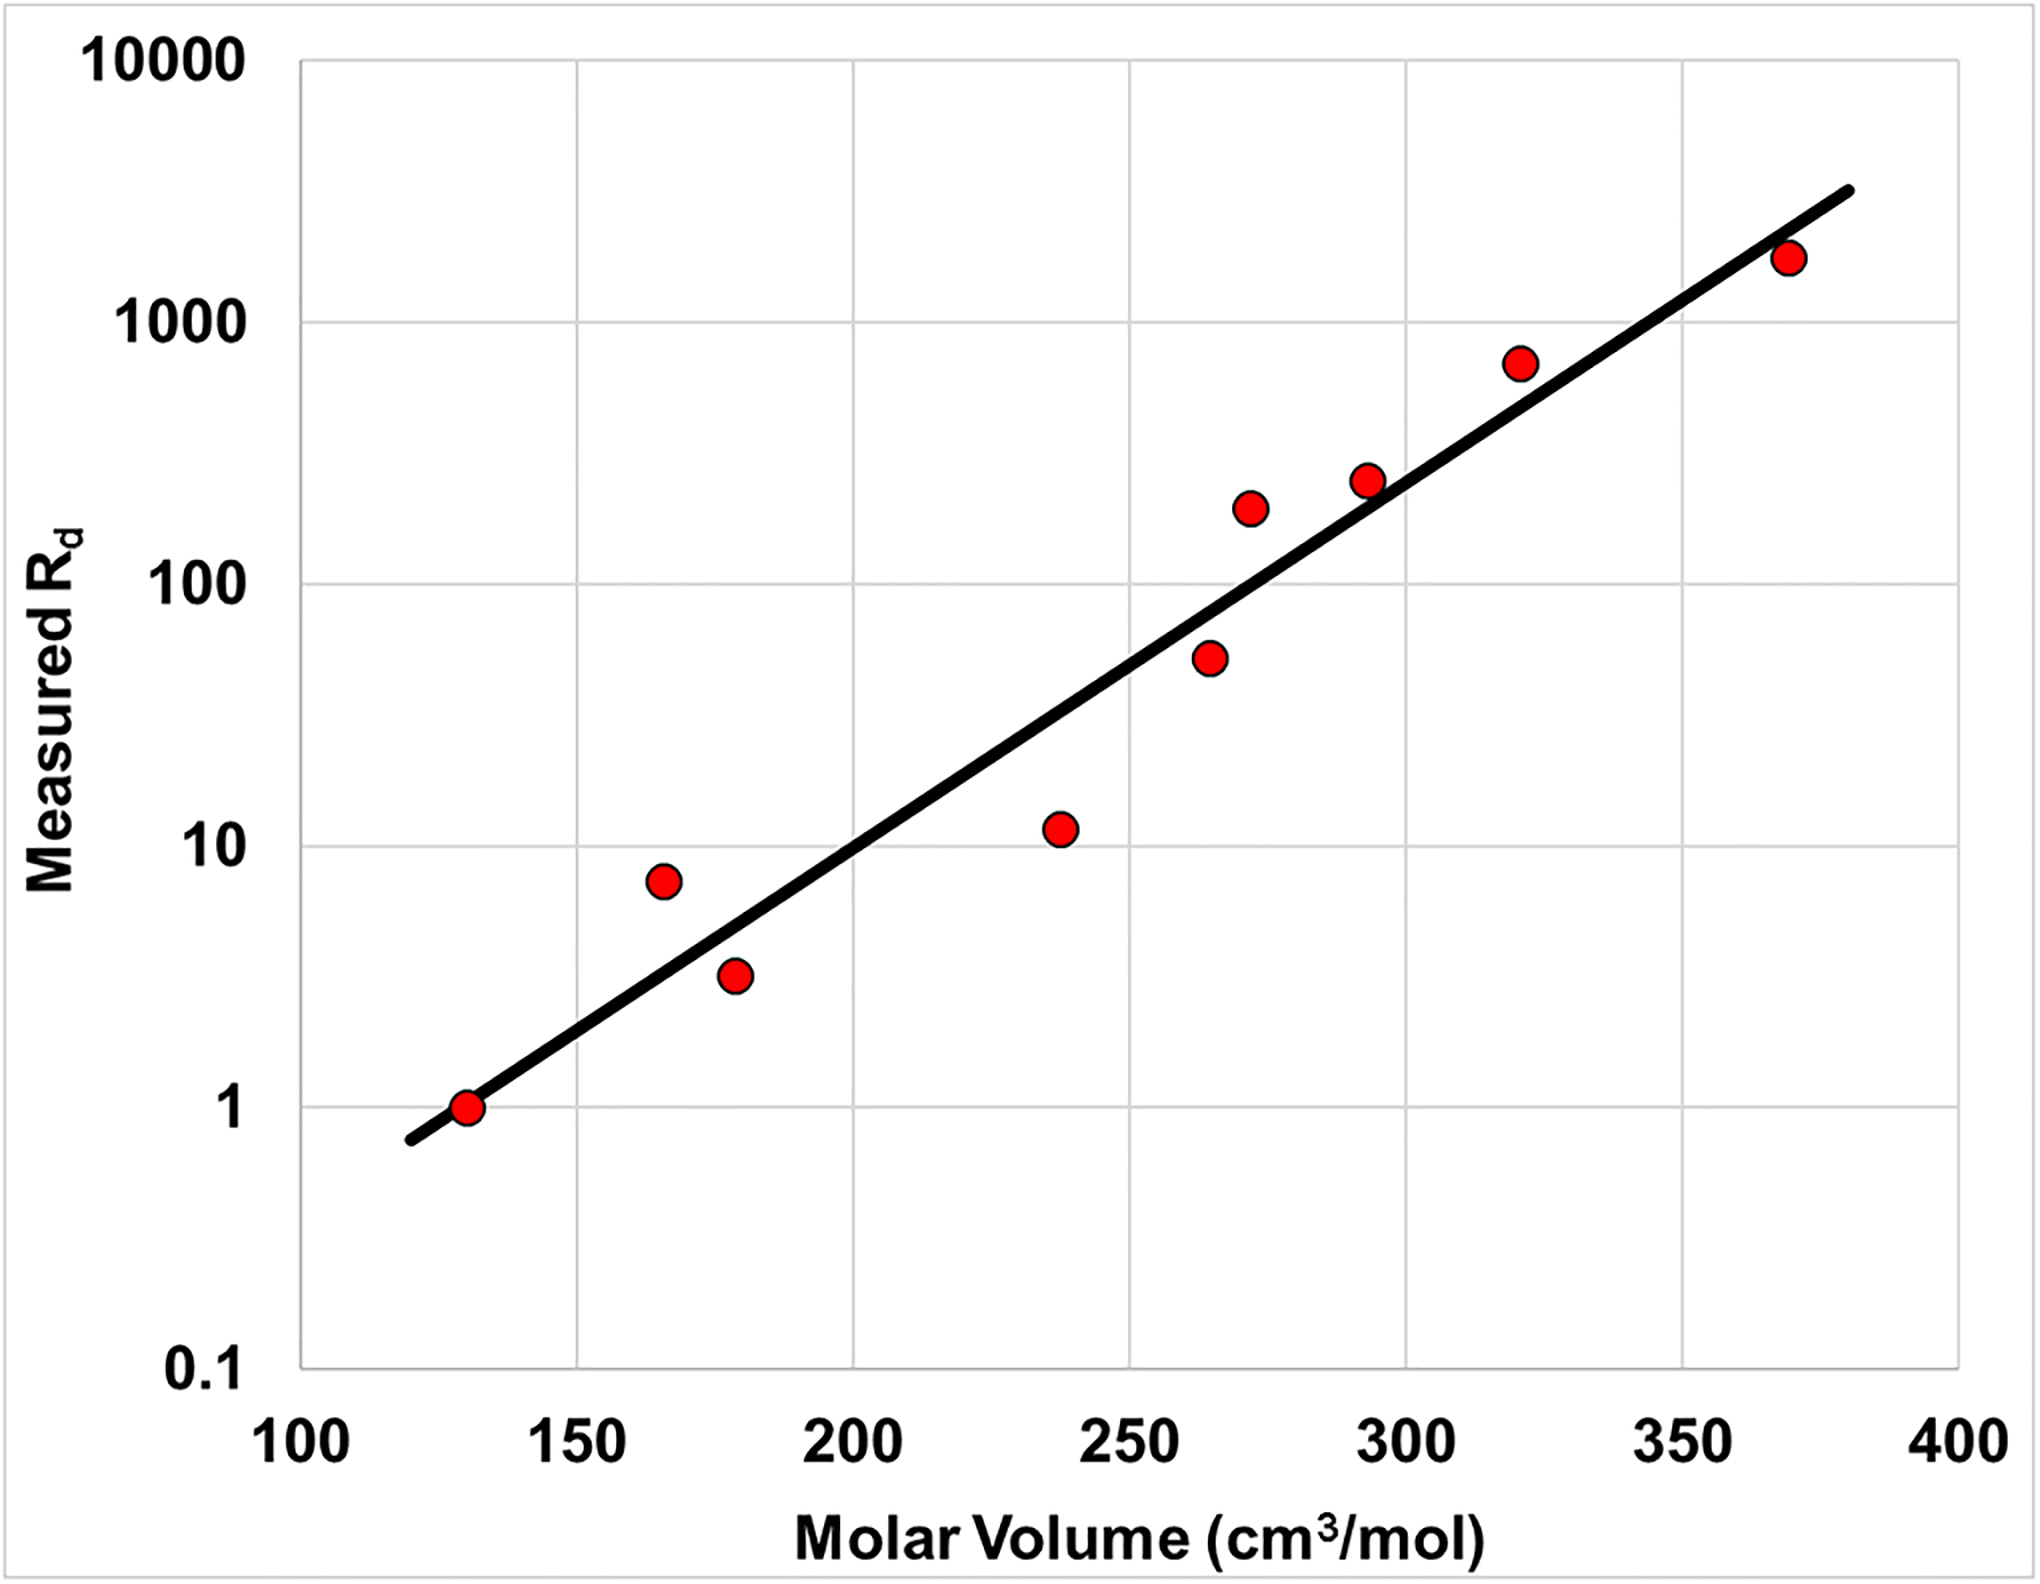
Measured nondimensional distribution coefficients, Rd, as a function of PFAS molar volume. Measured values determined from raw data reported in Felizeter et al., (2021).
Predicted Ct/Cp values were produced with the distribution model using equation 7. This was accomplished with the use of independently-obtained parameters to determine Rd for each PFAS with equation 8. The predicted Ct/Cp values are compared to the measured Cs/Cp values in Figure 4 for two cases, one incorporating air-water interfacial adsorption and one without. The predicted values that incorporate air-water interfacial adsorption match very well to the measured values for all PFAS except PFBS. The excellent predictions of the measured data indicate that the model provides a reasonable representation of PFAS mass distribution within the soil samples. The importance of air-water interfacial adsorption for the longer-chain PFAS is illustrated by the significant differences in the predicted values for the two cases with and without air-water interfacial adsorption.
Figure 4.
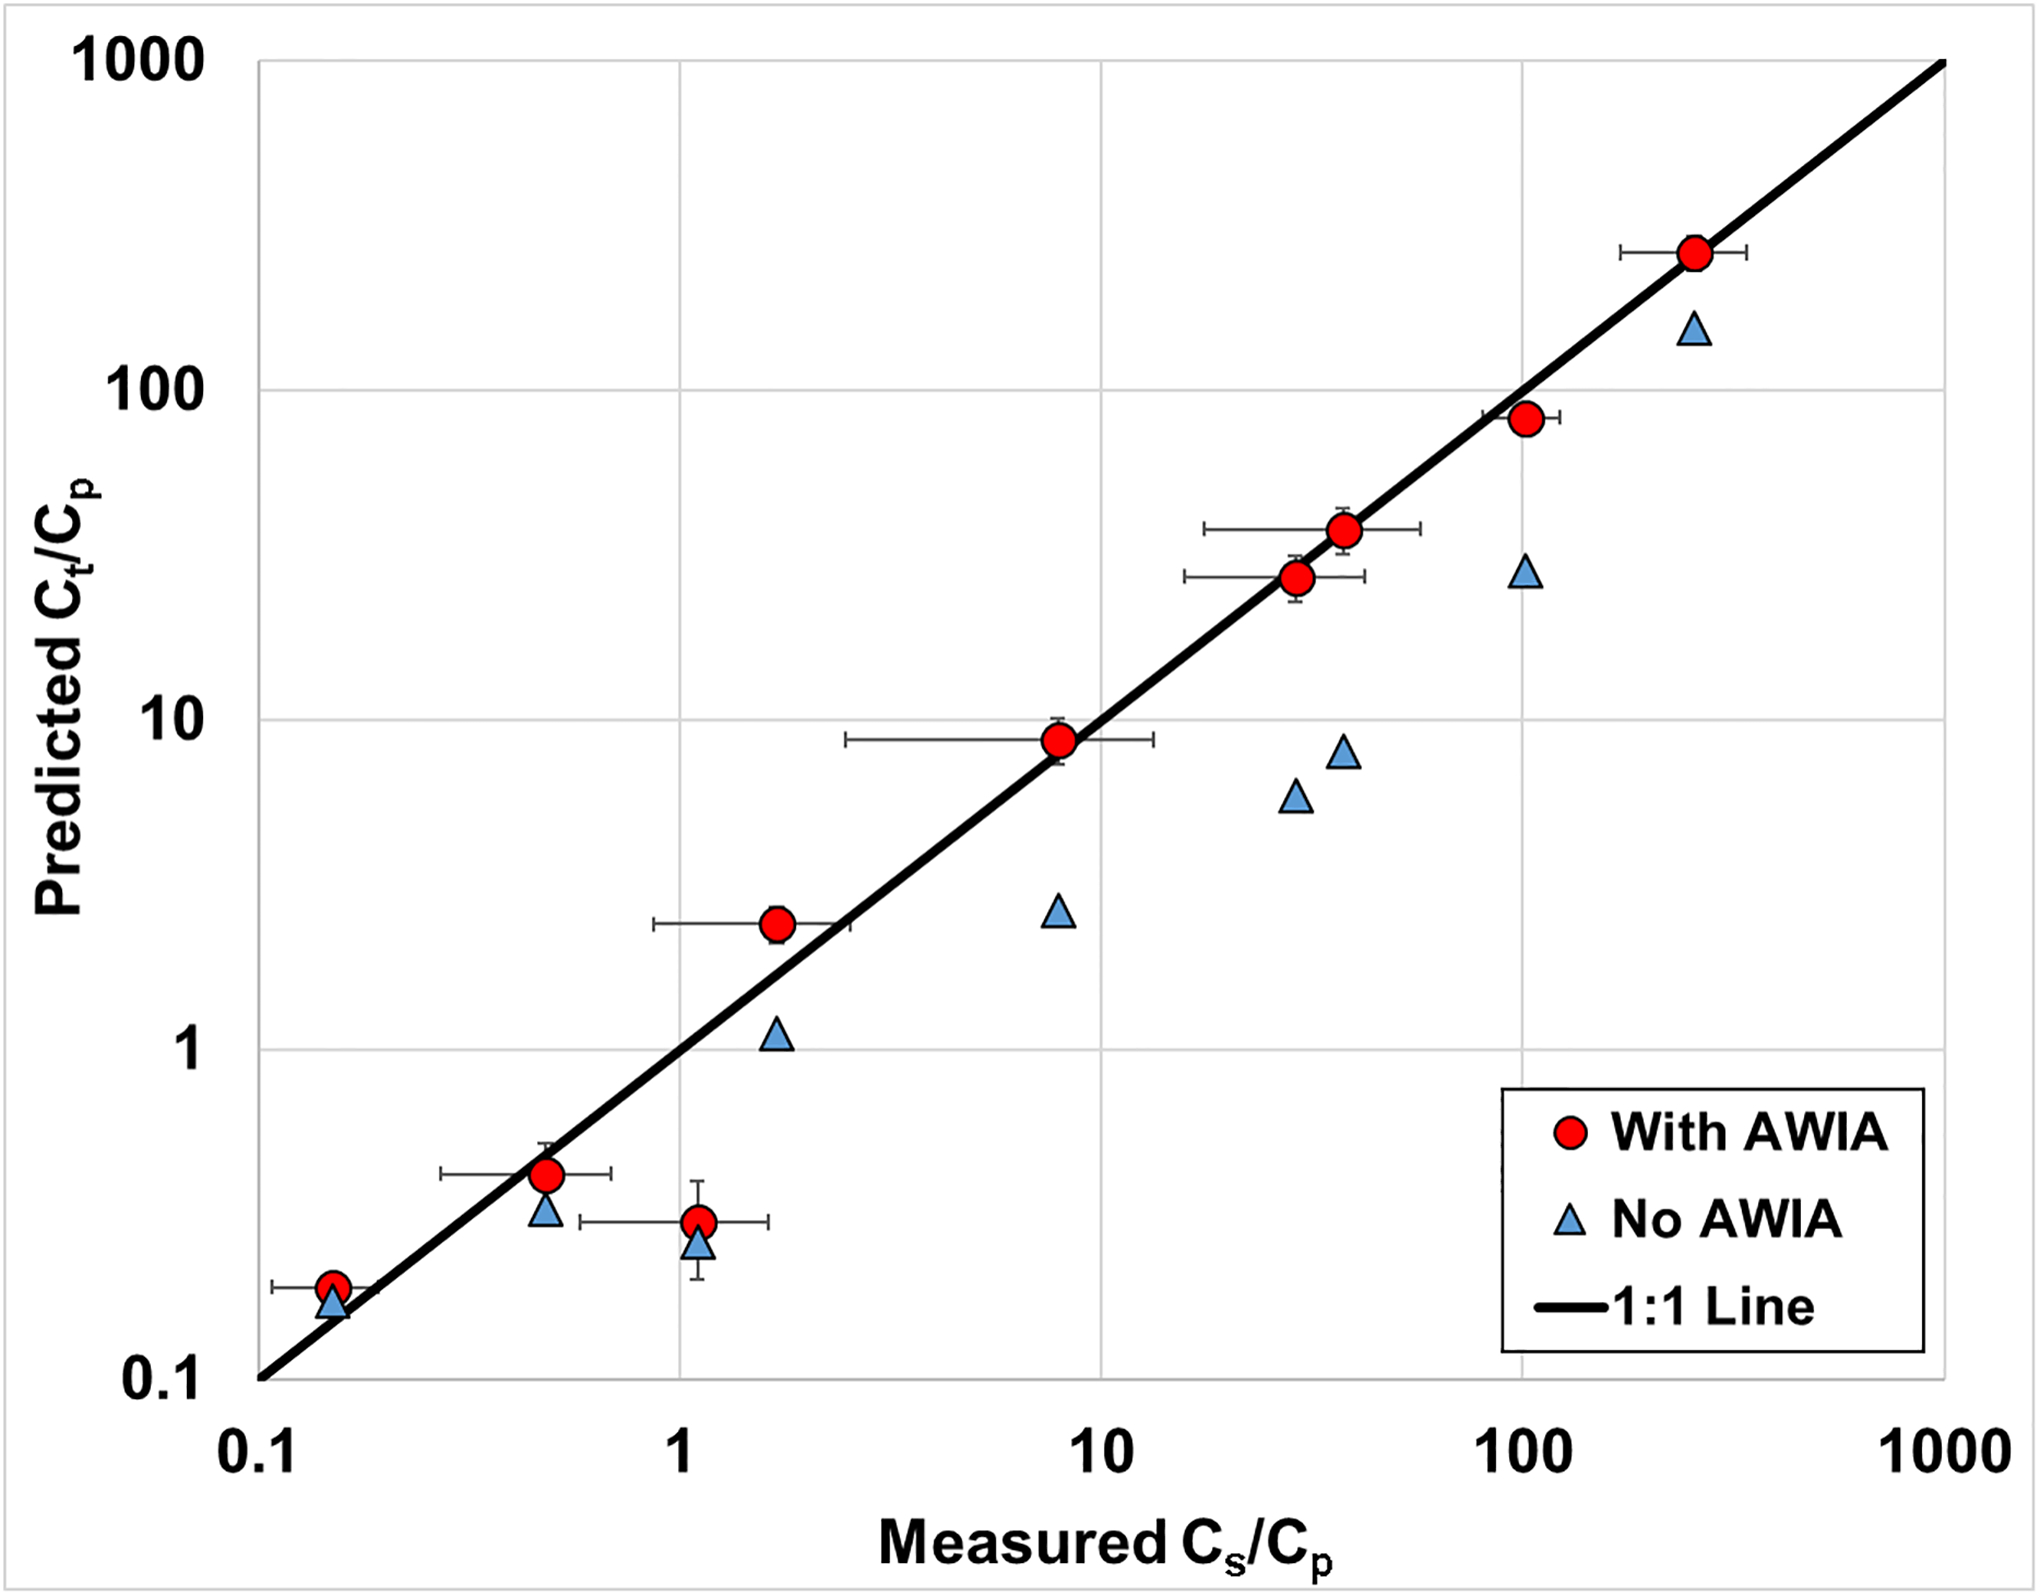
Comparison of predicted and measured porewater concentrations for several PFAS (Table 3). Measured data determined from raw data reported in Felizeter et al., (2021). AWIA represents air-water interfacial adsorption. The error bars represent 95% confidence intervals. The one outlier data point (red circle) is PFBS.
In considering the deviation between predicted and measured values observed for PFBS, it is critical to note that air-water interfacial adsorption is predicted to have minimal impact on PFBS distribution for this soil. Hence, the deviation may be due in part to an inaccurate representation of solid-phase sorption (inaccurate Kd). In addition, the measured values for all PFAS exhibit a degree of variability. This is related in part to variability in the water contents of the individual treatments, which ranged from 0.20 to 0.27, and inherent experimental uncertainty.
4.3. The Ct versus Cp relationship under dynamic short-term and long-term field conditions
The predicted Ct and Cp values, along with the relationships, simulated for long-term field conditions at a model fire training area site are presented in Figure 5. The total soil concentrations after the 30 years of site operation are observed to range from approximately 1 μg/kg for PFPeA to ~50 μg/kg for PFOA to ~25 mg/kg for PFOS (Figure 5). These concentrations are consistent with PFAS soil-concentration ranges observed at AFFF-impacted sites (Brusseau et al., 2020). The porewater concentrations after the 30 years of operation range from approximately 5 μg/L for PFPeA to 18 μg/L for PFOA to 1300 μg/L for PFOS. These are consistent with porewater concentrations reported at AFFF-impacted sites (Davis et al. 2021; Quinnan et al., 2021). Both PFPeA and PFOA have migrated to the bottom of the simulated vadose zone within the 30 year operation period. Conversely, the PFOS front has migrated to only a 250-cm depth in this timeframe due to its significantly greater retention. The Ct and Cp values for all three PFAS decrease over the post-operation period due to leaching. The downward migration of the contaminant plume is clearly observed for PFOS, with the peaks of both Ct and Cp migrating to successively greater depths over the 50-year post-operation period.
Figure 5.
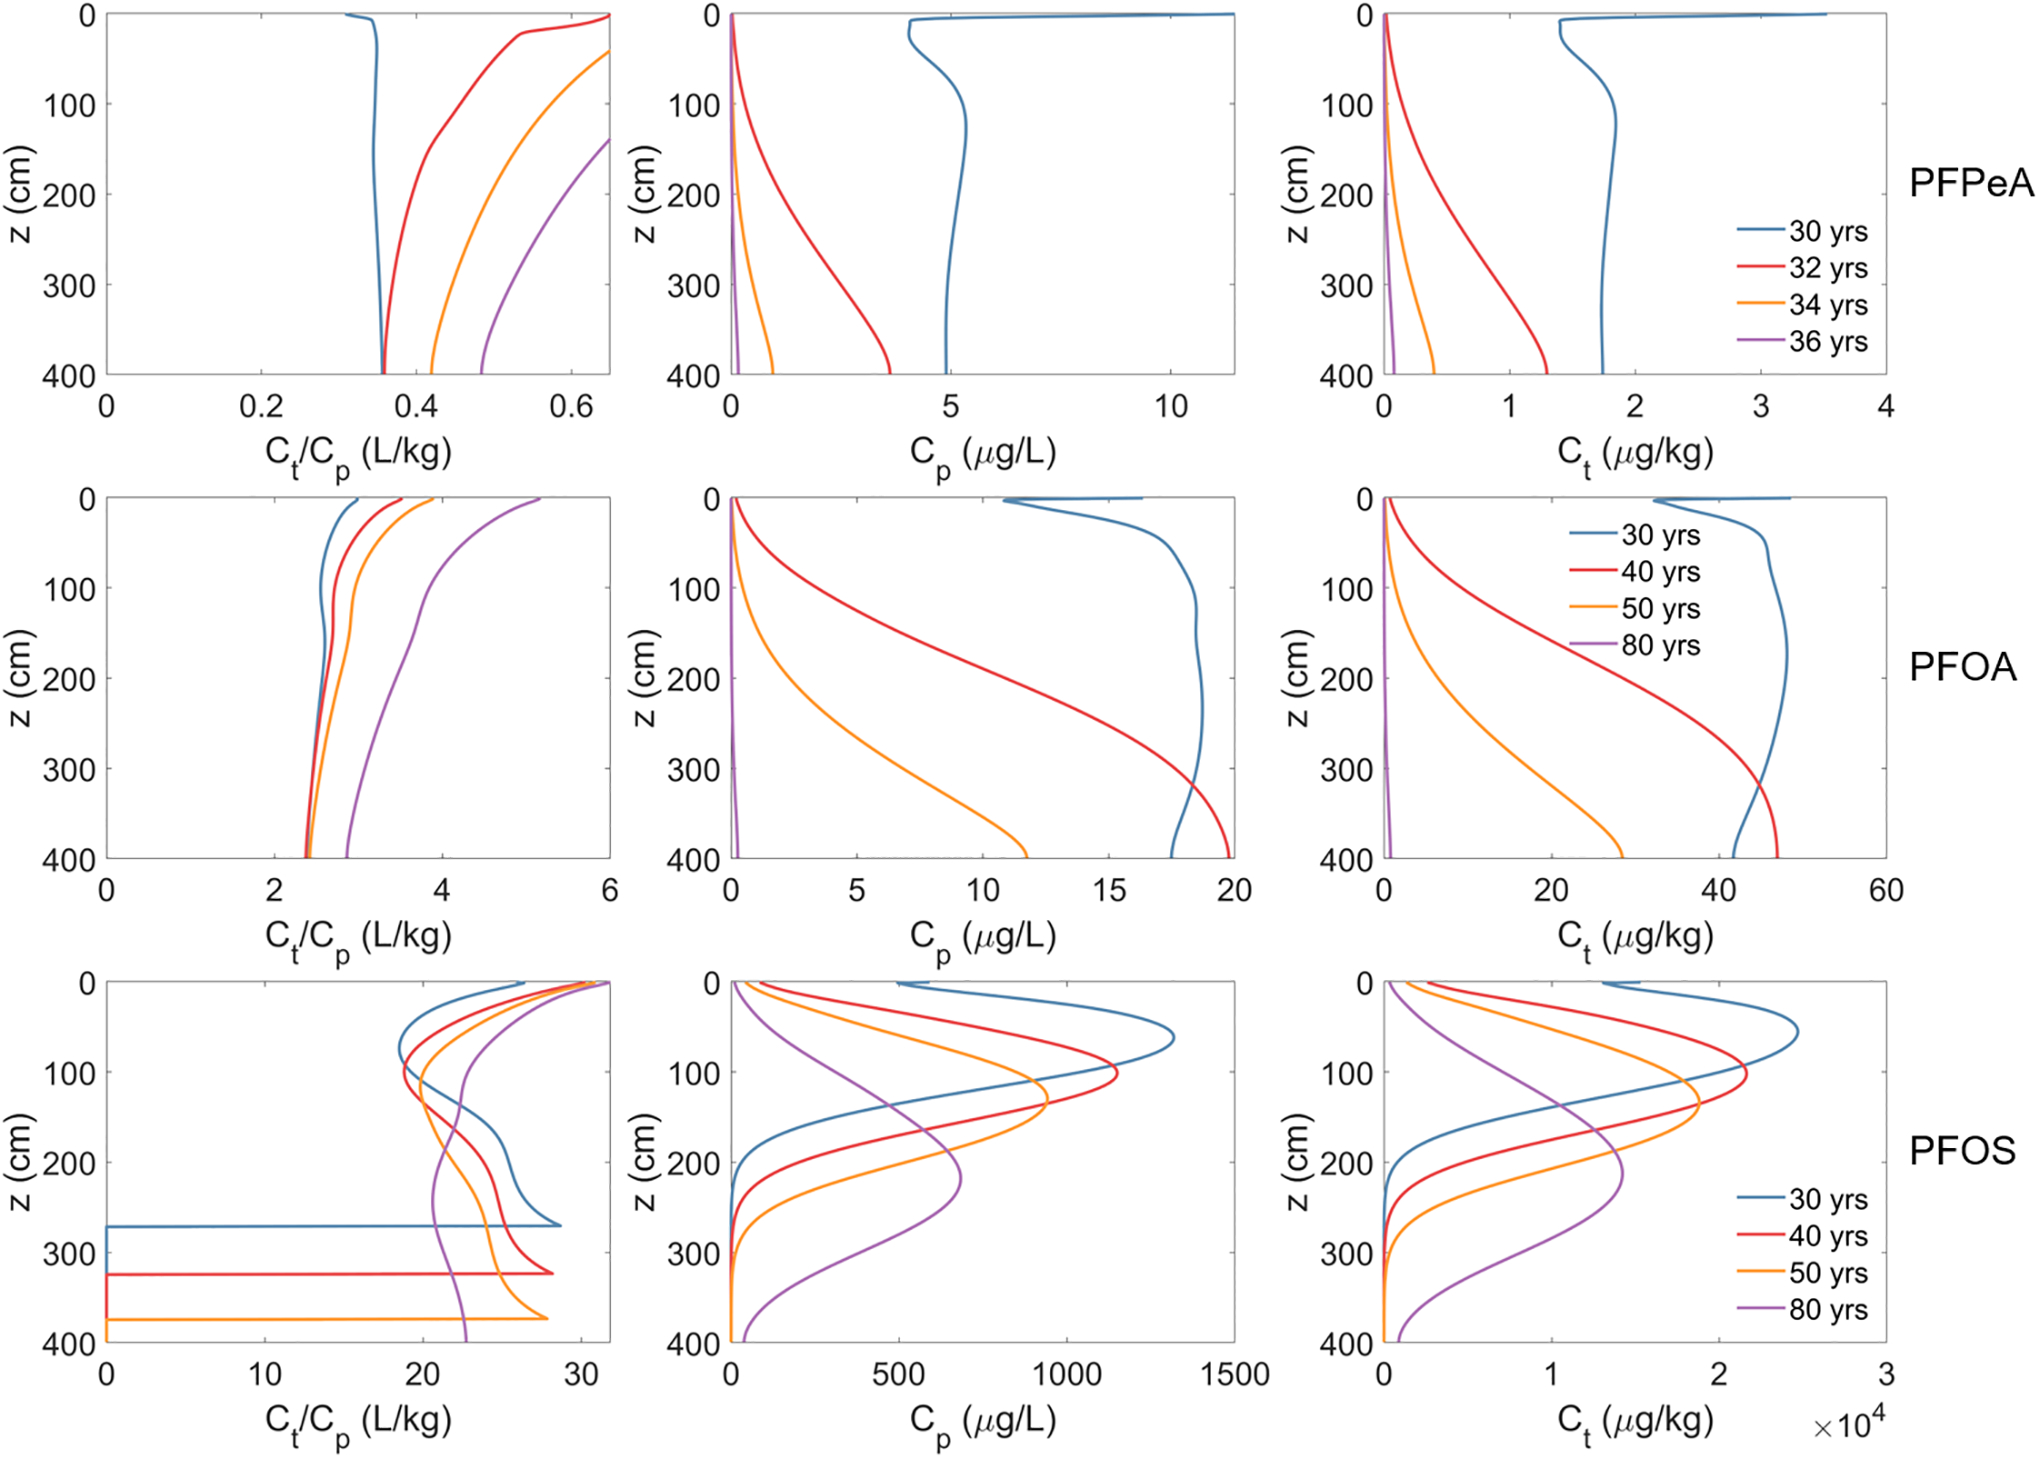
Ratio of total soil concentration (Ct) to porewater concentration (Cp) (left column), Cp (center column), and Ct (right column) from the long-term simulations of PFAS leaching in a model fire training area site during the post contamination period (i.e., after fire training activities stopped). The three rows denote the results for PFPeA, PFOA, and PFOS, respectively.
The Ct/Cp values vary greatly among the three PFAS—the ratio for PFOS is almost 10 and 100 times those for PFOA and PFPeA, respectively (Figure 5). Consistent with Equation 8, the variation is caused primarily by the differences in the relative magnitudes of retention due to solid-phase sorption and air-water interfacial adsorption. Inspection of Figure 5 shows that the Ct/Cp changes in space and time for each PFAS. The changes are driven by spatial and temporal changes in concentration due to the migration of the plume, and accompanying changes in the magnitudes of retention related to nonlinearity of solid-phase sorption and/or air-water interfacial adsorption. The water content changes minimally over time for these long-term simulations (data not shown), and therefore does not measurably impact the observed results.
The Ct/Cp increases with time throughout the depth profile for PFPeA and PFOA, and for the upper ~120 cm for PFOS. This results from the temporal decrease in porewater concentrations and the resultant increase in the magnitude of sorption and/or air-water interfacial adsorption. For PFPeA and PFOA, the porewater concentrations are several orders of magnitude below the concentrations at which air-water interfacial adsorption becomes essentially linear. Thus, the change in Ct/Cp is primarily due to nonlinearity of solid-phase sorption. Conversely, the porewater concentration for PFOS is much higher and the changes in Ct/Cp are caused primarily by nonlinear air-water interfacial adsorption. The PFOS Ct/Cp decreases over time in the deeper interval, reflecting the increase in concentration as the solute front migrates into this interval. The Ct/Cp goes to zero for PFOS in the bottom region of the domain. This occurs where the total and porewater concentrations are zero because the plume has not yet entered that depth interval. This is observed only for PFOS because it has much greater retention than PFOA and PFPeA, and therefore the PFOS front has not yet migrated to the bottom of the interval as noted above.
The short-term simulations (Figure 6) clearly show that different magnitudes of change occur for soil and porewater concentrations for the different PFAS. Significant changes in total soil concentrations are observed for PFPeA during the simulated 10-day storm event. Conversely, there is minimal change in Ct for PFOA and PFOS. This disparity reflects a greater amount of leaching affecting PFPeA due to its significantly lower retention in comparison to PFOA and especially PFOS. In contrast to the relative changes in Ct, the greatest changes in porewater concentrations are observed for PFOS and PFOA whereas minimal changes are observed for PFPeA. As a result, the Ct/Cp varies significantly for the former two, up to 50% for PFOA and up to ~5 times for PFOS, and minimally for PFPeA.
Figure 6.
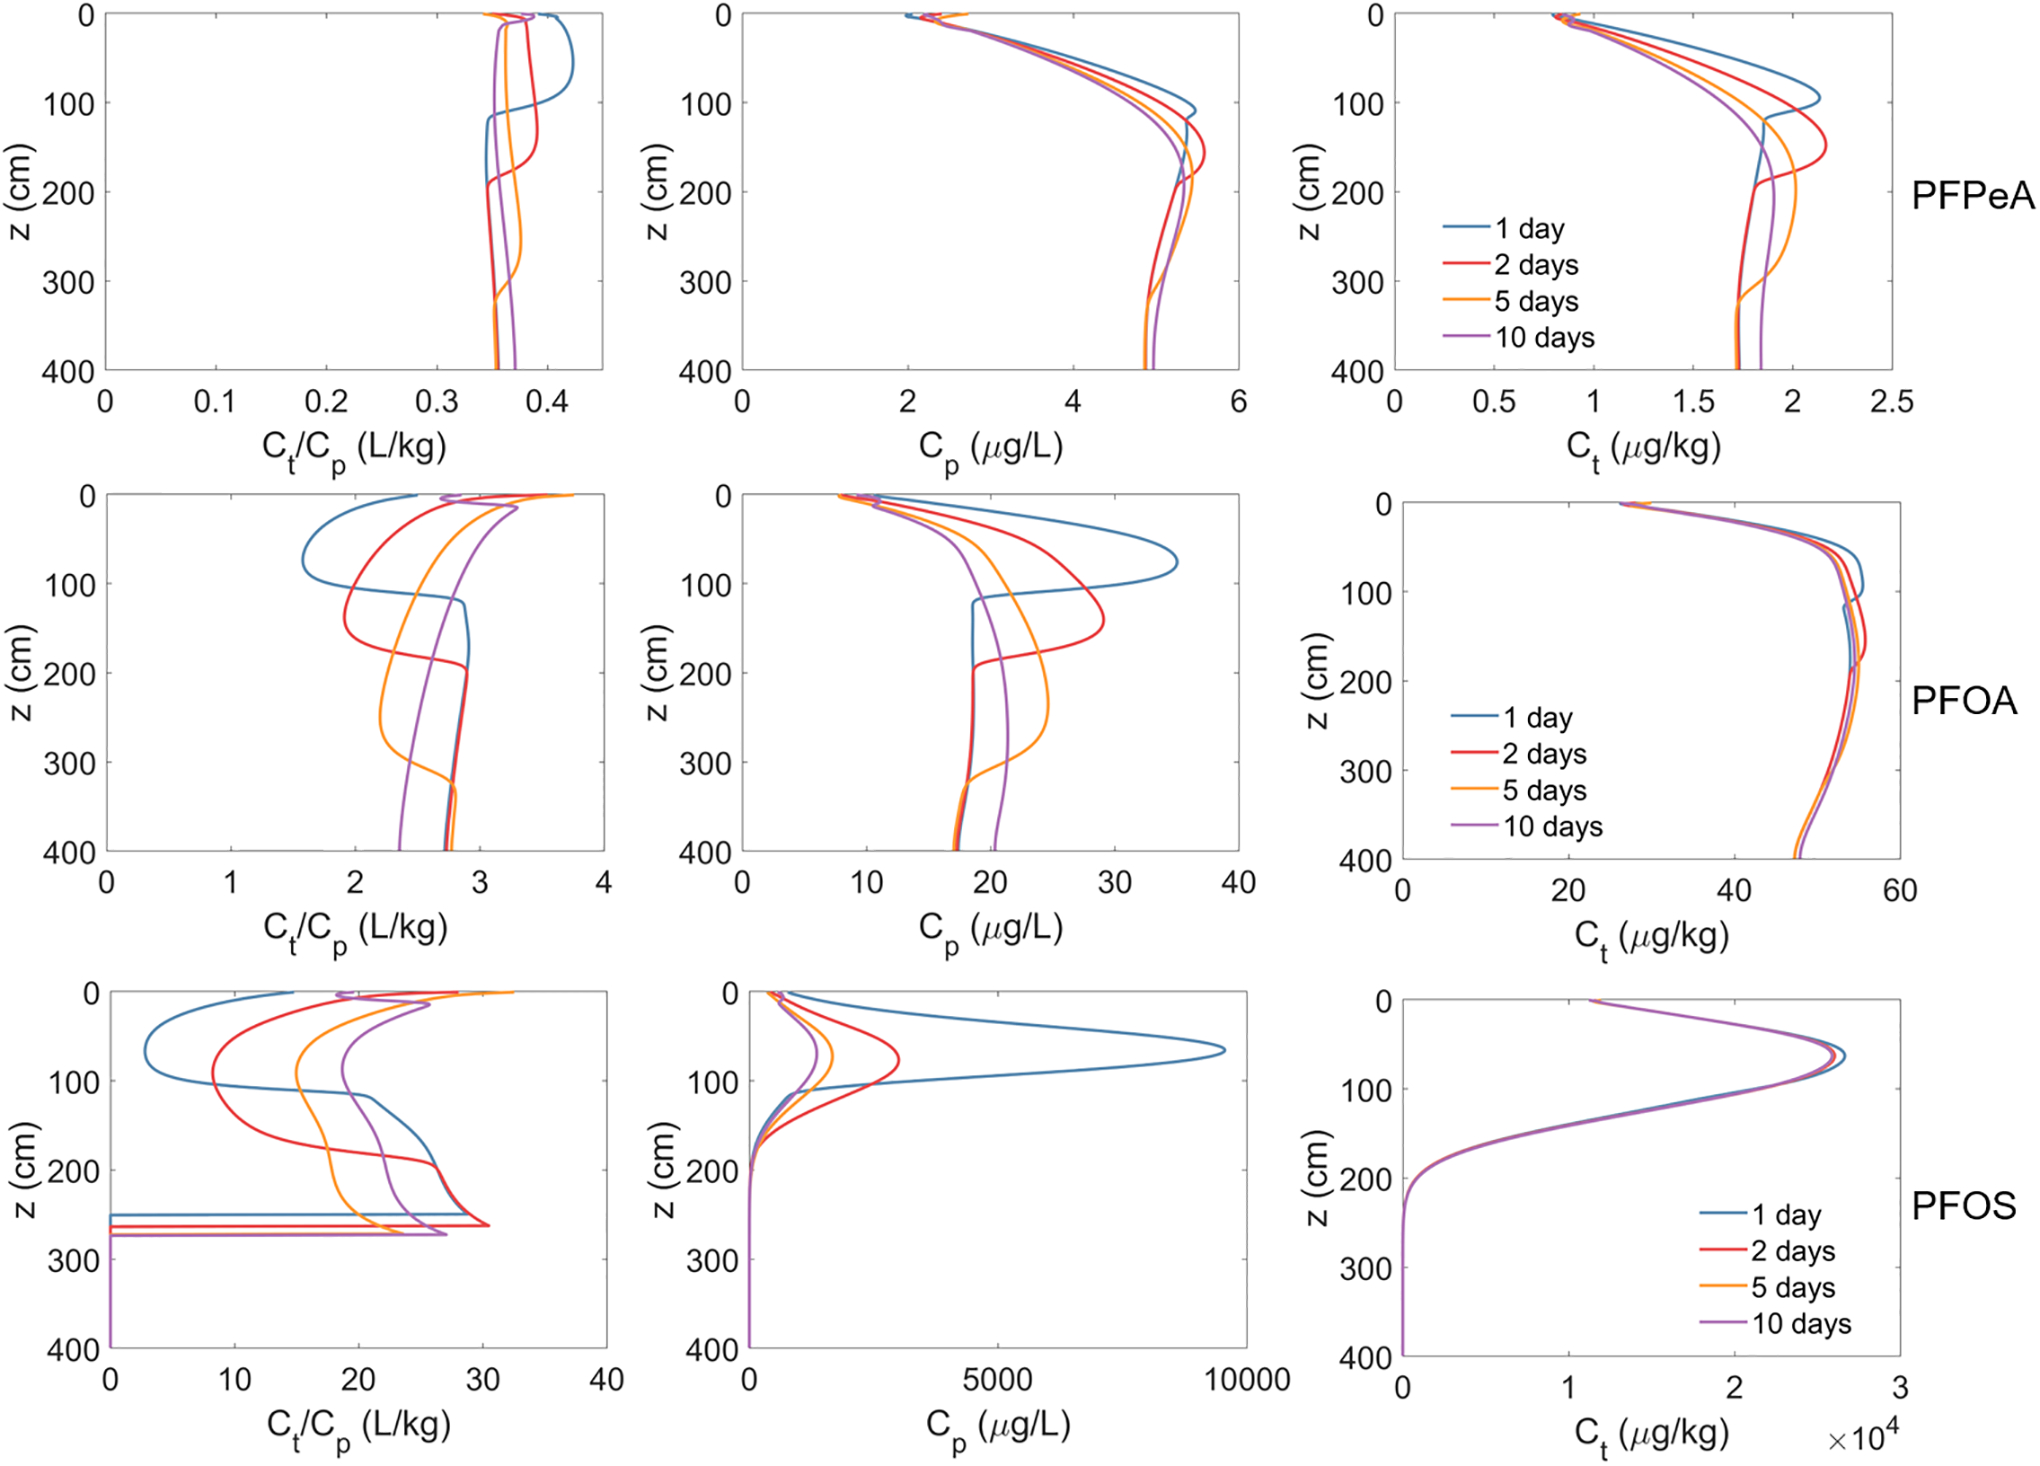
Ratio of total soil concentration (Ct) to porewater concentration (Cp) (left column), Cp (center column), and Ct (right column) from the short-term simulations of PFAS leaching in a model fire training area site. Simulated PFAS concentration in the vadose zone at the end of the contamination period is used as the initial conditions and no PFAS were released to the vadose zone during the simulations. The simulated 60-day period contains one of the largest rainfall events over a period of ten years. The three rows denote the results for PFPeA, PFOA, and PFOS, respectively.
The changes observed for Cp and Ct/Cp are caused by changes in the local water saturation during the infiltration/redistribution event and the subsequent changes in air-water interfacial area caused by these transient water-content conditions (Figure 7). Inspection of Figure 7 shows that the increased water saturation due to the wetting front infiltration destroys air-water interfacial area. As a result, the PFAS adsorbed at the air-water interfaces are subsequently released to the porewater, causing an increase in the porewater concentration. Large changes in Cp and Ct/Cp are observed for PFOA and PFOS because air-water interfacial adsorption provides a significant contribution to total retention. Smaller changes are observed for PFPeA because air-water interfacial adsorption provides a much smaller contribution to total retention. These dynamic changes of porewater concentration due to transient water infiltration are consistent with those reported in our prior work (Guo et al., 2020; Zeng et al., 2021). The transient changes in porewater concentration and the Ct/Cp have important implications for designing and operating porewater sampling lysimeters.
Figure 7.
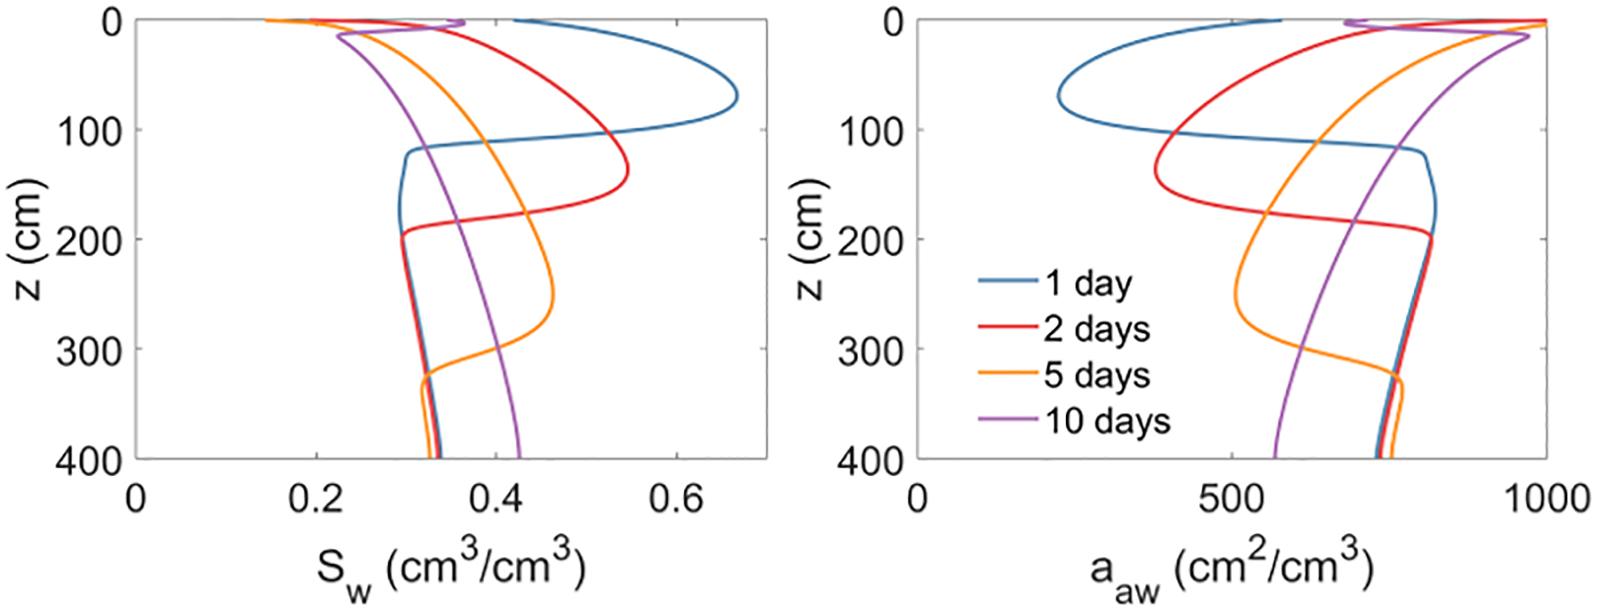
Spatial profiles of water saturation and specific air-water interfacial area during the 10-day period of short-term simulations. The results for the PFPeA simulations are presented here, but the water saturation and air-water interfacial area for the PFOA and PFOS simulations are almost the same as surfactant-induced flow has a relatively minor impact.
4.4. Field measured soil versus porewater concentrations
One of the first full-scale field applications of direct soil porewater sampling for PFAS was reported by Quinnan et al. (2021). This study comprised a test of high-resolution site characterization methods for quantifying PFAS concentrations and mass discharge for an aqueous film-forming foam (AFFF) source area at an Army Airfield facility. Three sampling lysimeters were installed in the vadose zone of the source area. The area was irrigated prior to porewater sample collection to facilitate sample collection. The sections within which each of the lysimeters resided received different magnitudes and rates of irrigation. Soil samples were collected from the intervals in which the lysimeters were installed to provide paired sample sets. The samples were analyzed for 13 PFAS, including PFOS and PFOA. This discussion will focus on the results presented for lysimeter LS-3R and the associated soil samples, which was in the section that received the lowest rate of irrigation.
The highest PFAS soil concentrations were reported for PFOS, which was ~300 μg/kg for the selected section. In comparison, concentrations of 1.8, 1.5, and 1.2 μg/kg were reported for PFNA, PFOA, and PFHxS, respectively, for the same section. The highest PFAS concentrations in soil porewater were also reported for PFOS, 6 μg/L for the selected lysimeter. Concentrations of 0.3, 1, and 1.1 μg/L were reported for PFNA, PFOA, and PFHxS, respectively. Values for Cs/Cp were calculated using the reported concentration pairs. The values range from 51 for PFOS, 6 for PFNA, to values of 1–2 for the shorter-chain PFAS (PFOA, PFHpA, PFHxA, PFPeA, PFHxS, PFHxA). The ratios are observed to be larger for the longer-chain PFAS and smaller for the shorter-chain PFAS, which is consistent with the analyses presented above.
4.5. Practical implications
There are multiple implications to the results of this study. One aspect is the relationship between soil concentrations and total concentrations. If the soil sample is collected in a manner that retains all PFAS mass, then Cs would be equivalent to Ct. Conversely, Cs would be anticipated to be lower than Ct if some fraction of mass is lost during sample collection and processing. Generally, for PFAS with low vapor-pressures, the primary potential source of mass loss may be anticipated to occur via partial drainage of porewater during sample collection and processing. From equations 4 and 8, 1/Rd represents the fraction of PFAS mass present in porewater. For Rd >20, the mass present in porewater represents <5% of the total mass. Hence, it is observed that the loss of some portion of porewater during sample collection and processing will not significantly influence the representativeness of the soil concentrations for samples for which Rd values are relatively large. However, measured Cs values will not be fully representative of Ct when porewater loss occurs for conditions with smaller Rd values. The issue of PFAS recovery during sample processing is a separate issue that can of course affect actual Cs values measured.
The distribution model presented herein can be used to examine the anticipated range of concentrations of PFAS in porewater, based on measured soil concentrations. Brusseau et al. (2020) conducted a meta-analysis of measured PFAS soil concentrations and observed concentrations ranged over many orders of magnitude, depending in part on the type of site. For example, soil concentrations up to 100s of mg/kg have been reported for AFFF-impacted sites. Hence, the associated porewater concentrations for these sites can be anticipated to be in the range of μg/L to mg/L depending upon the specific PFAS and the soil properties and conditions.
Guo et al. (2020) conducted long-term numerical simulations for a model fire-training source area for representative field conditions. Porewater concentrations ranging up to 10’s of mg/L were obtained for PFOS, for a simulated release concentration of 1,000 mg/L. The simulations presented in section 4.3 produced porewater concentrations ranging up to ~1 mg/L for a simulated release concentration of 100 mg/L. As noted in the preceding section, Quinnan et al. (2021) reported porewater concentrations for PFOS ranging up to 6 μg/L for an AFFF-impacted site. Davis et al. (2021) reported a porewater concentration of ~16 mg/L for total PFAS for an AFFF-impacted site. These results are consistent with the concentrations anticipated for sites with relatively high soil concentrations.
In contrast to primary-source sites that typically have relatively high soil concentrations, PFAS porewater concentrations are anticipated to be significantly lower for secondary-source sites such as locations receiving land application of biosolids or treated wastewater. Porewater concentrations are anticipated to be lower still for sites for which no known PFAS sources are nearby. For example, the median of maximum reported PFOS soil concentrations was 2.7 μg/kg for sites with no known nearby PFAS sources (Brusseau et al., 2020). Porewater concentrations are anticipated to be in the ng/L to lower μg/L range for such sites. Discussion of relevant porewater concentrations for transport investigations and risk assessments need to account for these anticipated ranges in concentrations.
5. Conclusion
The objective of this research was to delineate the relationship between soil porewater concentrations and soil concentrations, based on a comprehensive model of PFAS mass distribution within a soil sample volume. The distribution model was used to illustrate the impact of PFAS chain length and soil properties on the ratio of soil concentration to soil porewater concentration. For a given soil, the ratio is greater for longer-chain PFAS. And, for a given PFAS, it is larger for soils with greater sorption capacities and larger air-water interfacial areas. For a given soil and PFAS for which air-water interfacial adsorption is important, the ratio increases with decreasing water content due to the increase in air-water interfacial area.
Measured data reported in the literature for soil and soil porewater concentrations of several PFAS obtained from outdoor lysimeter experiments were used to test the distribution model. Soil-to-porewater concentration ratios predicted with the model compared very well to the measured concentration ratios. The nondimensional distribution coefficient that describes the distribution of PFAS mass among all domains within a soil sample was observed to be a function of PFAS molecular size. Numerical simulations conducted for a model fire-training source area were used to illustrate the magnitudes of soil versus porewater concentrations for representative field conditions. The results of the measured and simulated data sets demonstrated the importance of air-water interfacial adsorption for the distribution of the longer-chain PFAS within soil samples. This work has demonstrated the relationship between porewater concentrations and soil concentrations and the factors that influence the distribution of PFAS within a soil sample. Soil concentrations are what are typically reported for site investigations. However, porewater concentrations represent the mass that is directly subject to migration and mass discharge to groundwater. In addition, porewater concentrations generally comprise what is readily bioavailable to plant roots and soil microorganisms. Thus, the importance of understanding this relationship is evident. PFAS soil porewater concentrations are anticipated to range from ng/L to mg/L depending on soil concentrations, which in turn depend on the nature of the site. These ranges in concentrations need to be accounted for in discussions of relevant porewater concentrations for transport and fate investigations and risk assessments. The distribution model presented herein is anticipated to be useful for developing and enhancing conceptual site models and for conducting site investigations, risk assessments, and remediation-feasibility studies.
Acknowledgements
This research was supported by the Superfund Research Program of the NIEHS (P42 ES 4940), the Hydrologic Sciences Program of the NSF (2023351), and the Environmental Security Technology Certification Program (Project ER21–5041). We thank the reviewers for their constructive comments.
References
- Anderson RH. 2021. The case for direct measures of soil-to-groundwater contaminant mass discharge at AFFF-impacted sites. Environ. Sci. Technol 2021, 55, 6580–6583. [DOI] [PubMed] [Google Scholar]
- Anderson RH, Adamson DT, Stroo HF, 2019. Partitioning of poly-and perfluoroalkyl substances from soil to groundwater within aqueous film-forming foam source zones. J. Contam. Hydrol 220, 59–65. [DOI] [PubMed] [Google Scholar]
- Anwar AHMF, Bettahar M, Matsubayashi U, 2000. A method for determining airwater interfacial area in variably saturated porous media. J. Contam. Hydrol 43, 129–146. [Google Scholar]
- Baduel C, Mueller JF, Rotander A, Corfield J, and Gomez-Ramos MJ, 2017. Discovery of Novel Per and Polyfluoroalkyl Substances (PFASs) at a Fire Fighting Training Ground and Preliminary Investigation of Their Fate and Mobility. Chemosphere, 185, 1030–1038. [DOI] [PubMed] [Google Scholar]
- Brusseau ML, 2018. Assessing the potential contributions of additional retention processes to PFAS retardation in the subsurface. Sci. Total Environ 613–614,176–185. [DOI] [PMC free article] [PubMed] [Google Scholar]
- Brusseau ML, 2019a. The influence of molecular structure on the adsorption of PFAS to fluid-fluid interfaces: Using QSPR to predict interfacial adsorption coefficients. Water Res 152, 148–158. [DOI] [PMC free article] [PubMed] [Google Scholar]
- Brusseau ML, 2019b. Estimating the relative magnitudes of adsorption to solid-water and air/oil-water interfaces for per- and poly-fluoroalkyl substances. Environ. Pollut 254, article 113102. [DOI] [PMC free article] [PubMed] [Google Scholar]
- Brusseau ML and Guo B, 2021. Air-water interfacial areas relevant for transport of per and poly-fluoroalkyl substances. Water Res, 207, 117785. [DOI] [PMC free article] [PubMed] [Google Scholar]
- Brusseau ML and Van Glubt S, 2021. The influence of molecular structure on PFAS adsorption at air-water interfaces in electrolyte solutions. Chemosphere 281, 130829. [DOI] [PMC free article] [PubMed] [Google Scholar]
- Brusseau ML, Yan N, Van Glubt S, Wang Y, Chen W, Lyu Y, Dungan B, Carroll KC, Holguin FO, 2019a. Comprehensive retention model for PFAS transport in subsurface systems. Water Res 148, 41–50. [DOI] [PMC free article] [PubMed] [Google Scholar]
- Brusseau ML, Khan N, Wang YK, Yan N, Van Glubt S, Carroll KC, 2019b. Nonideal transport and extended elution tailing of PFOS in soil. Environ. Sci. Technol 53, 10654–10664. [DOI] [PMC free article] [PubMed] [Google Scholar]
- Brusseau ML, Anderson RH, Guo B, 2020. PFAS concentrations in soils: Background levels versus contaminated sites. Sci. Total Environ 740, article 140017. [DOI] [PMC free article] [PubMed] [Google Scholar]
- Brusseau ML, Guo B, Huang D, Yan N and Lyu Y, 2021. Ideal versus nonideal transport of PFAS in unsaturated porous media. Water Research, 202, article 117405. [DOI] [PMC free article] [PubMed] [Google Scholar]
- Dauchy X, Boiteux V, Colin A, Hémard J, Bach C, Rosin C,Munoz J, 2019. Deep seepage of per- and polyfluoroalkyl substances through the soil of a firefighter training site and subsequent groundwater contamination. Chemosphere 214, 729–737. [DOI] [PubMed] [Google Scholar]
- Davis K, Aucoin M, Larsen B, Kaiser M, & Hartten A, 2007. Transport of ammonium perfluorooctanoate in environmental media near a fluoropolymer manufacturing facility. Chemosphere, 67(10), 2011–2019. [DOI] [PubMed] [Google Scholar]
- Davis GB, Wallis I, Kookana R, Navarro D, Rayner JL, and Prommer H, 2021. Key unsaturated zone soil processes for PFAS mobility and retention: principles and understanding CSIRO, Australia. Report for the PFAS Investigation & Management Branch, Department of Defence. [Google Scholar]
- El Ouni A, Guo B, Zhong H, Brusseau ML, 2021. Testing the validity of the miscible-displacement interfacial tracer method for measuring air–water interfacial area: Independent benchmarking and mathematical modeling. Chemosphere 263, Article 128193. [DOI] [PMC free article] [PubMed] [Google Scholar]
- Felizeter S, Jürling H, Kotthoff M, De Voogt P, and McLachlan MS, 2021. Uptake of perfluorinated alkyl acids by crops: Results from a field study. Environ. Sci. Proc. Impacts, 23, 1158. [DOI] [PubMed] [Google Scholar]
- Filipovic M, Woldegiorgis A, Norström K, Bibi M, Lindberg M, Österås A, 2015. Historical usage of aqueous film forming foam: a case study of the widespread distribution of perfluoroalkyl acids from a military airport to groundwater, lakes, soils and fish. Chemosphere 129, 39–45. [DOI] [PubMed] [Google Scholar]
- Gellrich V, Stahl T, and Knepper TP 2012. Behavior of perfluorinated compounds in soils during leaching experiments. Chemosphere, 87, 1052–1056. [DOI] [PubMed] [Google Scholar]
- Guelfo JL,Wunsch A, Mccray J, Stults JF, Higgins CP, 2020. Subsurface transport potential of perfluoroalkyl acids (PFAAs): column experiments and modeling. J. Contam. Hydrol, 233, 9–20. [DOI] [PubMed] [Google Scholar]
- Guo B, Zeng J, Brusseau ML, 2020. A Mathematical Model for the Release, Transport, and Retention of Per- and Polyfluoroalkyl Substances (PFAS) in the Vadose Zone. Water Resour. Res 56 (2), 21. [DOI] [PMC free article] [PubMed] [Google Scholar]
- Guo B, Zeng J, Brusseau ML and Zhang Y, 2022. A screening model for quantifying PFAS leaching in the vadose zone and mass discharge to groundwater. Advances in Water Resources Article 104102. [Google Scholar]
- Higgins CP, Luthy RG, 2006. Sorption of perfluorinated surfactants on sediments. Environ. Sci. Technol 40 (23), 7251–6. [DOI] [PubMed] [Google Scholar]
- Høisæter Å, Pfaff A, Breedveld GD, 2019. Leaching and transport of PFAS from aqueous film-forming foam (AFFF) in the unsaturated soil at a firefighting training facility under cold climatic conditions. J. Contam. Hydrol 222, 112–122. [DOI] [PubMed] [Google Scholar]
- Johnson GR, 2022. PFAS in soil and groundwater following historical land application of biosolids. Water Research, 211, Article 118035. [DOI] [PubMed] [Google Scholar]
- Kim H, Rao PSC, Annable MD, 1997. Determination of effective air-water interfacial area in partially saturated porous media using surfactant adsorption. Water Resour. Res 33 (12), 2705–2711. [Google Scholar]
- Lyu Y, Brusseau M, Chen W, Yan N, Fu X, Lin X, 2018. Adsorption of PFOA at the air-water Interface during transport in unsaturated porous media. Environ. Sci. Technol 52, 7745–7753. [DOI] [PMC free article] [PubMed] [Google Scholar]
- McLachlan MS, Felizeter S, Klein M, Kotthoff M, and Voogt P. 2019. Fate of a perfluoroalkyl acid mixture in an agricultural soil studied in lysimeters, Chemosphere, 223, 180–187. [DOI] [PubMed] [Google Scholar]
- Milinovic J, Lacorte S, Vidal M, Rigol A, 2015. Sorption behaviour of perfluoroalkyl substances in soils. Sci. Total Environ 511, 63–71. [DOI] [PubMed] [Google Scholar]
- Nickerson A, Rodowa AE, Adamson DT, Field JA, Kulkarni PR, Kornuc JJ and Higgins CP, 2021. Spatial trends of anionic, zwitterionic, and cationic PFASs at an AFFF-impacted site. Environ. Sci. Technol, 55, 313–323. [DOI] [PubMed] [Google Scholar]
- Peng S and Brusseau ML, 2005. Impact of soil texture on air-water interfacial areas in unsaturated sandy porous media. Water Resour. Res 41, Article W03021. [Google Scholar]
- Pepper IL, Brusseau ML, Prevatt FJ, and Escobar BA. Incidence of PFAS in soil following long-term application of class B biosolids. Sci. Total Environ, 793, Article 148449. [DOI] [PubMed] [Google Scholar]
- Quinnan J, Rossi M, Curry P, Lupo M, Miller M, Korb H, Orth C, Hasbrouck K, 2021. Application of PFAS‐ mobile lab to support adaptive characterization and flux‐ based conceptual site models at AFFF releases. Remediation, 31, 7–26. [Google Scholar]
- Quinnan J, Curry P, Lupo M, Miller M, Rossi M, 2021. Validation of Streamlined Mobile Lab-Based Real Time PFAS Analytical Methods. Final Report ESTCP Project ER19–5203, May 2021 [Google Scholar]
- Sepulvado J, Blaine A, Hundal L, & Higgins C, 2011. Occurrence and fate of perfluorochemicals in soil following the land application of municipal biosolids. Environ. Sci. Technol, 45, 8106–8112. [DOI] [PubMed] [Google Scholar]
- Silva JAK, Simůnek J, and McCray JE, 2020. A modified HYDRUS model for simulating PFAS transport in the vadose zone. Water 12, 2758. [Google Scholar]
- Van Glubt S, Brusseau ML, Yan N, Huang DD, Khan N & Carroll KC, 2021. Column versus Batch Methods for Measuring PFOS and PFOA Sorption to Geomedia. Environ. Pollut 268, 115917. [DOI] [PMC free article] [PubMed] [Google Scholar]
- Vierke L, Möller A, and Klitzke Ss. 2014. Transport of perfluoroalkyl acids in a water-saturated sediment column investigated under near-natural conditions. Environ. Poll 186, 7–13. [DOI] [PubMed] [Google Scholar]
- Washington J, Yoo H, Ellington J, Jenkins T, & Libelo E, 2010. Concentrations, distribution, and persistence of perfluoroalkylates in sludge-applied soils near Decatur, Alabama, USA. Environ. Sci. Technol, 44(22), 8390–8396. [DOI] [PubMed] [Google Scholar]
- Weber AK, Barber LB, LeBlanc DR, Sunderland EM, Vecitis CD, 2017. Geochemical and hydrologic factors controlling subsurface transport of polyand perfluoroalkyl substances, Cape Cod, Massachusetts. Environ. Sci. Technol 51, 4269–4279. [DOI] [PubMed] [Google Scholar]
- Xiao F, Simcik MF, Halbach TR, Gulliver JS, 2015. Perfluorooctane sulfonate (PFOS) and perfluorooctanoate (PFOA) in soils and groundwater of a U.S. metropolitan area: migration and implications for human exposure. Water Res 72, 64–74. [DOI] [PubMed] [Google Scholar]
- Zeng J, Brusseau ML and Guo B, 2021. Model validation and analyses of parameter sensitivity and uncertainty for modeling long-term retention and leaching of PFAS in the vadose zone. J. Hydrology, 603, p.127172. [Google Scholar]