

Abstract
BACKGROUND:
Previous studies show that obesity predisposes patients to higher risks of adverse pregnancy outcomes. Data on the relationship between increasing degrees of obesity and risks of severe maternal morbidity, including mortality, are limited.
OBJECTIVE:
We examined the association of increasing classes of obesity, especially super obesity, with the risk of severe maternal morbidity and mortality at the time of delivery hospitalization.
STUDY DESIGN:
Using New York City linked birth certificates and hospital discharge data, we conducted a retrospective cohort study. This study identified delivery hospitalizations for singleton, live births in 2008–2012. Women were classified as having obesity (class I, II, III, or super obesity), as opposed to normal weight or overweight, based on prepregnancy body mass index. Cases of severe maternal morbidity were identified based on International Classification of Diseases, Ninth Revision diagnosis and procedure codes according to Centers for Disease Control and Prevention criteria. Multivariable logistic regression was used to evaluate the association between obesity classes and severe maternal morbidity, adjusting for maternal sociodemographic characteristics.
RESULTS:
During 2008–2012, there were 570,997 live singleton births with available information on prepregnancy body mass index that met all inclusion criteria. After adjusting for maternal characteristics, women with class II (adjusted odds ratio, 1.14; 95% confidence interval, 1.05–1.23), class III (adjusted odds ratio, 1.34; 95% confidence interval, 1.21–1.49), and super obesity (adjusted odds ratio, 1.99; 95% confidence interval, 1.57–2.54) were all significantly more likely to have severe maternal morbidity than normal and overweight women. Super obesity was associated with specific severe maternal morbidity indicators, including renal failure, air and thrombotic embolism, blood transfusion, heart failure, and the need for mechanical ventilation.
CONCLUSION:
There is a significant dose-response relationship between increasing obesity class and the risk of severe maternal morbidity at delivery hospitalization. The risks of severe maternal morbidity are highest for women with super obesity. Given that this is a modifiable risk factor, women with prepregnancy obesity should be counseled on the specific risks associated with pregnancy before conception to optimize their pregnancy outcomes.
Keywords: maternal mortality, morbid obesity, obesity, severe maternal morbidity
Introduction
More than one-third (35% or 78.6 million) of adults in the United States have obesity.1 Obesity is defined as a body mass index (BMI) of 30 kg/m2 or higher.1 Obesity leads to multiple preventable conditions, including hypertension, diabetes, cardiovascular disease, and stroke. Women who are overweight (BMI, 25–29.9 kg/m2) or obese are more likely to suffer from complications in pregnancy. A 2015 study in California showed that women with obesity had a significantly higher risk for pregnancy-related mortality owing to cardiovascular disease and venous thromboembolism.2 In this population, women with morbid obesity (BMI >40) were at highest risk of pregnancy-related mortality.2 A review by Campbell et al3 of maternal mortality during delivery hospitalization in New York City from 1995 to 2003 showed that women with obesity were 190% more likely to die during delivery hospitalization than women without obesity.
For every maternal death, there are many more severe complications that are associated with pregnancy, labor, and delivery that do not result in death. These events are identified as severe maternal morbidity (SMM).4
A preliminary analysis from Michigan found that pregnancy-related deaths were 3.7 times more common in the obese vs nonobese population.5 The rates of women with a BMI of >40 and >50 has increased by over 70% in the last 20 years in the United States population.6 The surgical literature has included the class of super obesity, defined as BMI >50 kg/m2 or 225% of ideal body weight.7 Rates of super obesity have rapidly increased over time.8 Studies on the super obese population in obstetrics demonstrate a 5-fold increased risk of maternal intensive care unit admission;9 5-fold increased risk of neonatal morbidity; and increased risks of wound complications, postpartum hemorrhage, prolonged hospital stay, preeclampsia, cesarean delivery, and macrosomia.10–13 In addition, there is a dose-response relationship in the relationship between BMI and adverse perinatal outcomes for both the neonate and the mother.9,10 Lisonkova et al14 examined the association between increasing BMI categories and SMM events and found that women with higher BMI were at increased risk of SMM events.
However, data are limited regarding the impact of super obesity on the overall risk of SMM and on the individual Centers for Disease Control and Prevention (CDC) SMM indicators.
In our study, we sought to examine the effects of increasing classes of obesity and super obesity on SMM and mortality at the time of delivery hospitalization in a racially and ethnically diverse population.
Materials and Methods
We conducted a retrospective cohort study on all singleton births from 20 to 45 weeks of gestation in New York City from 2008 to 2012, using birth certificate records linked to hospital discharge data from the Statewide Planning and Resource Cooperative System. Information regarding mother’s age, race, and pregnancy information were derived from the birth certificate, and information regarding length of stay, diagnoses, and procedure codes were obtained from the hospital discharge data. A more detailed description of the data sources, linkage, and match rate is reported elsewhere.15 This study was considered exempt by the Yale University Human Investigations Committee.
Women who had missing information regarding prepregnancy weight, height, or BMI were excluded. We also excluded women with a BMI that was implausible, per the criteria from the National Center for Health Statistics, based on maternal height outside of 1 to 8 feet and 1 to 11 inches and maternal weight outside of 50 to 400 pounds.16 In addition, women were only included if they were of reproductive age (ie, 15–55 years old).
Collection of information on maternal height and prepregnancy weight was through the birth certificate. Prepregnancy BMI was calculated as weight in kilograms divided by height in meters squared, using self-reported height and prepregnancy weight.16 Women were categorized into the following 6 groups based on prepregnancy BMI: underweight (BMI <18.5 kg/m2), normal and overweight (BMI, 18.5–29.9 kg/m2), class I obesity (BMI, 30–34.9 kg/m2), class II obesity (BMI, 35–39.9 kg/m2), class III obesity (BMI, 40–49.9 kg/m2), and super obesity (BMI ≥50 kg/m2).
Outcome measures
The United States CDC has endorsed a surveillance algorithm that utilizes diagnosis and procedure codes recorded at discharge to identify delivery hospitalizations that were thought to indicate severe life-threatening diagnoses and procedures associated with those diagnoses.17,18 These codes can be used to identify women who have suffered an SMM event but survived and those who have suffered a maternal death.
SMM was measured by a composite binary indicator (yes or no) for whether the woman experienced in-hospital death or any of the 21 severe maternal complications (such as eclampsia, amniotic fluid embolism, and sepsis) or life-saving procedures as determined by the CDC.18 The morbidity was considered present if one of the associated International Classification of Diseases, Ninth Revision, Clinical Modification (ICD-9-CM) codes was identified in the discharge diagnosis, present on the birth certificate, or both or if a maternal death occurred. Per the original algorithm to identify SMM by Callaghan et al,17 we excluded hospitalizations with a length of stay less than the 90th percentile, calculated separately for vaginal, primary, and repeat cesarean deliveries to obtain the most conservative estimate for SMM. However, all hospitalizations that resulted in death or transfer, in addition to severe complications identified by procedure codes, were included, regardless of the length of stay.17
Maternal demographics and socioeconomic status were examined as covariates and potential confounders. Maternal information derived from birth certificates included age, parity, race or ethnicity, level of education, insurance status, neighborhood poverty level, adequacy of prenatal care based on the Kotelchuck index,19 and tobacco use during pregnancy. Neighborhood-based poverty was defined based on household income data from the American Community Survey collected by the United States Census Bureau and linked with the delivery record by census tract of residence.15 Age was categorized as <20, 20 to 29, 30 to 34, 35 to 39, 40 to 44, and ≥45 years (Table 1). Medical comorbidities, including pregestational diabetes, chronic hypertension, and chronic heart disease (as defined by ICD-9 codes), and mode of delivery (utilizing birth certificate information) were also examined but not adjusted for in the statistical analysis as they are considered to be part of the causal pathway leading to SMM.
TABLE 1.
Maternal demographics and baseline characteristics
| Demographics and characteristics | UnderweightBMI <18.5 (%) | Normal weight/overweightBMI 18.5–29.9 (%) | Class 1 obesityBMI 30–≤35 (%) | Class 2 obesityBMI 35–≤40 (%) | Class 3 obesityBMI 40–≤50 (%) | Super obesityBMI ≥50 (%) | P value |
|---|---|---|---|---|---|---|---|
| N | 31,697 | 445,398 | 59,167 | 22,162 | 11,277 | 1296 | |
| Deliveries | 5.6 | 78.0 | 10.4 | 3.9 | 2.0 | 0.2 | |
| Maternal age, y | |||||||
| <20 | 7.4 | 5.8 | 5.4 | 4.8 | 4.5 | 2.5 | <.001 |
| 20–29 | 53.0 | 44.4 | 46.1 | 47.9 | 48.0 | 48.2 | |
| 30–34 | 24.6 | 28.1 | 26.4 | 26.0 | 26.4 | 28.5 | |
| 35–39 | 12.2 | 16.8 | 16.6 | 16.0 | 16.1 | 15.1 | |
| 40–44 | 2.6 | 4.5 | 5.0 | 5.1 | 4.7 | 5.5 | |
| >45 | 0.2 | 0.4 | 0.4 | 0.3 | 0.4 | 0.2 | |
| Race and ethnicity | |||||||
| Black non-Hispanic | 13.3 | 18.3 | 33.6 | 39.3 | 44.0 | 55.3 | <.001 |
| White non-Hispanic | 32.9 | 32.9 | 18.1 | 16.0 | 14.6 | 11.4 | |
| Puerto Rican | 5.2 | 6.7 | 12.1 | 15.0 | 17.0 | 17.3 | |
| Hispanic (other) | 13.7 | 24.0 | 28.7 | 24.9 | 20.9 | 13.5 | |
| Asian or Pacific Islander | 32.8 | 16.3 | 5.8 | 3.0 | 1.7 | 0.8 | |
| Other | 0.5 | 0.4 | 0.4 | 0.4 | 0.2 | 0.5 | |
| Non-Hispanic, ≥2 races | 1.4 | 1.3 | 1.2 | 1.3 | 1.5 | 1.0 | |
| Missing or unknown | 0.1 | 0.1 | 0.1 | 0.1 | 0.1 | 0.2 | |
| Smoked during pregnancy | 0.9 | 0.9 | 1.5 | 1.7 | 2.3 | 3.2 | <.001 |
| Maternal education | |||||||
| Less than HS | 23.7 | 22.6 | 28.2 | 27.7 | 27.6 | 28.3 | <.001 |
| HS | 22.8 | 22.0 | 25.9 | 26.7 | 26.2 | 29.5 | |
| Some college | 19.3 | 20.8 | 27.2 | 29.0 | 31.0 | 31.0 | |
| College graduate or higher | 34.0 | 34.4 | 18.5 | 16.3 | 15.0 | 10.9 | |
| Missing | 0.2 | 0.2 | 0.3 | 0.4 | 0.3 | 0.3 | |
| Insurance | |||||||
| Private | 37.8 | 39.8 | 28.1 | 27.7 | 27.3 | 23.7 | <.001 |
| Medicaid | 58.6 | 56.2 | 66.8 | 67.4 | 67.9 | 71.3 | |
| Other | 1.4 | 1.6 | 2.2 | 2.0 | 1.9 | 1.9 | |
| Self-pay | 1.3 | 1.3 | 1.6 | 1.5 | 1.6 | 1.5 | |
| Missing | 0.5 | 0.5 | 0.6 | 0.6 | 0.5 | 0.8 | |
| Neighborhood poverty level | |||||||
| <10% (low poverty) | 16.1 | 15.1 | 9.2 | 8.9 | 8.8 | 8.0 | <.001 |
| 10%–20% | 30.2 | 29.3 | 26.3 | 24.5 | 22.9 | 20.8 | |
| 20%–<30% | 27.4 | 25.9 | 29.1 | 29.5 | 29.3 | 30.0 | |
| >30% (high poverty) | 19.4 | 21.8 | 30.1 | 32.0 | 34.7 | 37.1 | |
| Non-New York City residents or missing | 7.0 | 8.0 | 5.4 | 5.0 | 4.3 | 4.1 | |
| Prenatal care adequacy | |||||||
| Inadequate | 17.1 | 16.4 | 18.9 | 18.7 | 19.5 | 22.5 | <.001 |
| Intermediate | 10.9 | 11.7 | 10.6 | 10.4 | 10.4 | 10.7 | |
| Adequate | 42.4 | 42.6 | 37.7 | 36.9 | 34.9 | 30.3 | |
| Intensive | 26.2 | 25.8 | 28.5 | 29.4 | 30.3 | 30.9 | |
| Missing | 3.4 | 3.5 | 4.3 | 4.6 | 4.8 | 5.7 | |
| Parity | |||||||
| 0 | 56.8 | 47.3 | 36.3 | 36.3 | 36.5 | 36.9 | <.001 |
| 1 previous | 43.1 | 52.7 | 63.6 | 63.6 | 63.3 | 63.0 | |
| Missing | 0.1 | 0.1 | 0.1 | 0.1 | 0.2 | 0.2 | |
| Delivery method | |||||||
| Primary cesarean delivery | 15.0 | 18.6 | 22.4 | 25.8 | 28.8 | 32.1 | <.001 |
| Repeat cesarean delivery | 6.0 | 10.8 | 17.6 | 20.1 | 23.2 | 26.5 | |
| Vaginal delivery | 77.4 | 68.7 | 57.9 | 52.2 | 46.2 | 39.9 | |
| Vaginal birth after cesarean | 1.2 | 1.7 | 1.9 | 1.8 | 1.6 | 1.9 | |
| Missing | 0.4 | 0.2 | 0.2 | 0.1 | 0.2 | 0.2 | |
| Pregestational diabetesa | 0.2 | 0.5 | 1.6 | 2.5 | 3.8 | 4.4 | <.001 |
| Chronic hypertensiona | 0.3 | 1.2 | 4.2 | 7.0 | 11.0 | 17.2 | <.001 |
| Chronic heart diseasea | 0.5 | 0.4 | 0.3 | 0.2 | 0.2 | 0.3 | <.001 |
BMI, body mass index; HS, high school.
These comorbidities were not included in the adjusted analysis.
Statistical analysis
We examined bivariate associations between maternal characteristics and BMI categories using χ2 tests. We performed multivariable logistic regression to assess the risk of SMM in women who were underweight, class I obese, class II obese, class III obese, and super obese using normal and overweight as the referent group. Models were run for SMM overall, SMM excluding transfusion, and each individual morbidity. Covariates that were significant in bivariate analysis with a P value <.05 were included in the multivariable model. Results were reported using adjusted odds ratios (aORs) with 95% confidence intervals (CIs). All covariates were significant based on this criterion and thus were retained in the final multivariable logistic regression, with the exception of medical comorbidities and mode of delivery. Analyses were conducted using SAS 9.3 (SAS Institute Inc, Cary, NC).
Results
There were 588,232 live singleton births in New York City from 2008 to 2012. After excluding women without available information on prepregnancy BMI (n=7316), multiple gestations (n=9309), implausible gestational age (n=125), or maternal age (n=384), our final analytical sample included a total of 570,997 women (Figure). Approximately 1.2% of deliveries were excluded because of missing information regarding prepregnancy BMI.
FIGURE. Population sample.
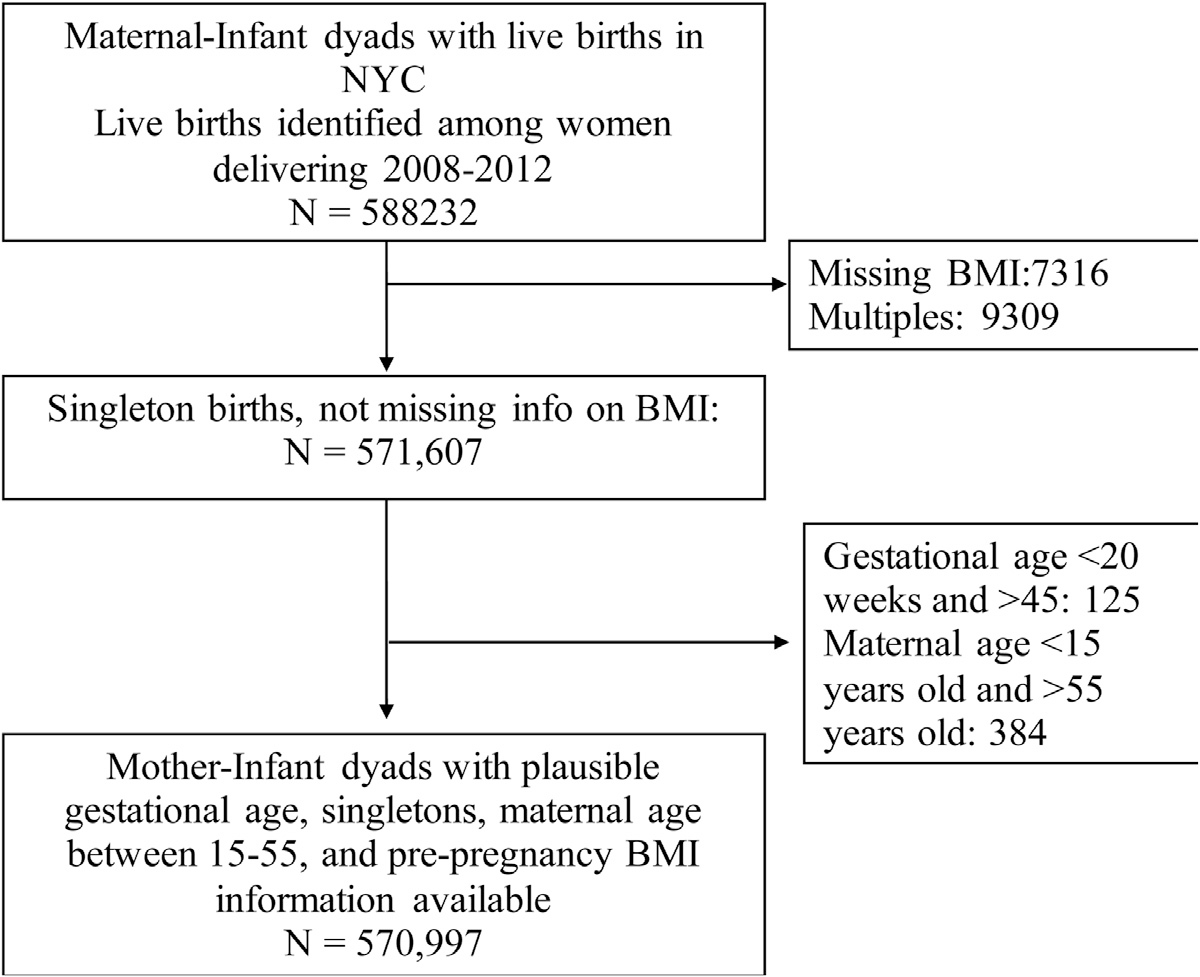
BMI, body mass index; NYC, New York City.
The overall rate of SMM in our sample was 20.3 per 1000 deliveries. In terms of BMI, 5.6% (31,697) of our study population were categorized as underweight, 78% (445,398) were normal weight and overweight, 10.4% (59,167) had class I obesity, 3.9% (22,162) had class II obesity, 2.0% (11,277) had class III obesity, and 0.2% (1200) had super obesity. Approximately 4% (466) of all SMM events occurred in women with class III or super obesity. Our study consisted of 30% non-Hispanic White individuals, 21% non-Hispanic Black, 32% Puerto Rican or Hispanic, and the remaining 17% were Asian, multiracial, or other. The sociodemographic characteristics of women stratified by BMI are presented in Table 1. All factors were found to be significantly associated with prepregnancy BMI.
Increasing BMI classes were associated with an increase in the percentage of non-Hispanic Black individuals, with the class III obese group composed of 44% non-Hispanic Black individuals and the super obese group composed of 55% non-Hispanic Black individuals. In addition, when examining insurance status, all classes of obesity consisted of >65% Medicaid patients. This percentage increases with increasing classes of obesity.
Women with increasing classes of obesity were additionally found to have significantly higher rates of pregestational diabetes, chronic hypertension, and chronic heart disease. The underweight group had a 77.4% rate of vaginal delivery and a 15.0% rate of primary cesarean delivery, compared with a 39.9% rate of vaginal delivery and a 32.1% rate of primary cesarean delivery in the super obese group. The remaining women in each group had either a repeat cesarean delivery or a vaginal birth after cesarean (Table 1). The rates of vaginal delivery declined with increasing levels of obesity, and the rates of cesarean delivery increased.
The overall rate of SMM was lowest in women with underweight BMI (16.69 per 1000 deliveries) and highest in women with super obesity (55.56 per 1000 deliveries).
After adjusting for maternal characteristics, women with class II (aOR, 1.14; 95% CI, 1.05–1.24), class III (aOR, 1.34; 95% CI, 1.21–1.49), and super obesity (aOR, 1.99; 95% CI, 1.57–2.54) were all significantly more likely to have SMM than normal and overweight women. Women who were underweight (aOR, 0.99; 95% CI, 0.90–1.08) or who had class I obesity (aOR, 1.06; 95% CI, 1.00–1.12) did not have increased odds of SMM. The odds of increased SMM remained significant when transfusion-related SMM was excluded (Table 3).
When evaluated by individual morbidities, women with class III obesity had significantly higher odds of acute renal failure (aOR, 2.01; 95% CI, 1.22–3.32), heart failure during procedure (aOR, 4.95; 95% CI, 1.11–5.07), blood transfusion (aOR, 1.23; 95% CI, 1.07–1.43), ventilation (aOR, 4.25; 95% CI, 2.41–7.49), adult respiratory distress syndrome (aOR, 2.08; 95% CI, 1.31–3.30), eclampsia (aOR, 2.46; 95% CI, 1.44–4.21), pulmonary edema/acute heart failure (aOR, 2.38; 95% CI, 1.45–3.90), severe anesthesia complications (aOR, 3.85; 95% CI, 1.82–8.15), and sepsis (aOR, 2.25; 95% CI, 1.29–3.91) when compared with women without obesity (Table 3).
Women with super obesity had significantly higher odds of acute renal failure (aOR, 4.42; 95% CI, 1.80–10.81), heart failure during procedure or surgery (aOR, 13.68; 95% CI, 4.17–44.87), air and thrombotic embolism (aOR, 5.61; 95% CI, 1.76–17.90), blood transfusion (aOR, 1.74; 95% CI, 1.24–2.45), and ventilation (aOR, 15.15; 95% CI, 6.86–33.45) when compared with women without obesity.
Discussion
Principal findings
This large population-based study of singleton births in New York City from 2008 to 2012 found that women with class II, class III, and super obesity were all at significantly increased risk of SMM during delivery hospitalization. Increasing classes of obesity were also significantly associated with individual SMM events defined using the CDC indicators.
Results
Based on our findings, there is a significant dose-response relationship between increasing obesity class and risk of SMM at the time of delivery hospitalization. These risks seem to be highest in women with BMI >40, specifically those women with class III and super obesity. The odds of increased SMM remained significant even when transfusions were excluded. These findings are consistent with previous studies regarding the increased risks of adverse maternal outcomes in obese women.2,3,9,14 Similar results were seen in the study by Lisonkova et al,14 which evaluated all deliveries (n=743,630) in Washington state from 2004 to 2013. They specifically looked at individuals with class I, class II, and class III obesity and found that increasing obesity classes had higher risks of acute renal failure, eclampsia, respiratory morbidity, anesthesia complications, and sepsis.14 However, the population was 73% non-Hispanic White women, whereas our study looked at a more diverse urban population with 30% non-Hispanic White women, 21% non-Hispanic Black women, and the remaining 49% Asian, Hispanic, 2 or more races, or other. This is a unique contribution to the existing body of literature, as increasing BMI and super obesity are an emerging public health crisis, and this study specifically examines the risks of SMM in the subpopulation of women with a BMI >50 kg/m2 and does so with a racially and ethnically diverse population.
Clinical implications
Obesity is a disease that requires a holistic approach to treatment and, when treated, can be a potentially modifiable risk factor for adverse pregnancy outcomes. Women who suffer from obesity should be counseled, ideally in the preconception period, regarding the specific maternal risks associated with pregnancy and options for weight loss, which lead to improved perinatal outcomes. A modest reduction in weight loss (5%–7%) can significantly improve pregnancy outcomes, and women should be counseled on diet and exercise interventions before pregnancy.20 Studies have also shown that bariatric surgery leads to decreased risk of gestational diabetes, hypertensive disorders of pregnancy, and large for gestational age infants when compared with women with obesity.21–23
Obesity itself is associated with increased odds of SMM, and this is known to be associated with increasing rates of maternal mortality, increased hospital costs, and increased length of stay.17 Emerging literature has also revealed that SMM may also be associated with increased risk of long term sequelae, specifically severe postpartum psychiatric diagnoses.24
Strengths and limitations
This study has several strengths given its large size and ethnically and socioeconomically diverse urban population. The size of our study sample created a robust database that allowed for comparisons between the classes of obesity and among SMM morbidities. Furthermore, the ethnically and socioeconomically diverse urban population may make it generalizable to other urban areas. In addition, we were able to evaluate the specific risks of SMM and SMM indicators in the super obese population, which is a unique but steadily increasing subgroup of women in the obstetrical population.
Our study also has limitations. First, birth certificate data are known to vary in quality depending on what characteristics are being evaluated.25 We also used birth certificate data, which utilize self-reported height and weight at first prenatal visit, and this may underestimate the true incidence of prepregnancy obesity. However, risk of bias based on underestimating prepregnancy weight is low.26 A previous evaluation found that New York City birth certificates were 100% complete in regard to variables such as hospital discharge data, but only approximately 95% specific and 72% sensitive regarding maternal and neonatal characteristics,27 which may have caused underreporting of various morbidities. By linking birth certificate and hospital discharge data, the quality of data on clinical outcomes was significantly improved.28 However, there are also potential errors in diagnostic coding and misclassification in maternal demographics. In addition, our study only captured those instances of SMM that occurred within the immediate postpartum period during delivery hospitalization and potentially underestimates the true incidence of SMM. Our analysis is also altered by the presence of missing data and the elimination of some patients with missing data, but this was only 1.2% of patients. There is also the possibility of multiple deliveries to one patient over the time period, and although the data set accounted for not including multiple deliveries in the same patient during the time period, it is possible that this could have occurred. Finally, this is a retrospective cross-sectional study, which does not imply causality.
Research implications
The etiology of this increased risk of SMM associated with obesity is still not clearly understood and may be due to a multitude of factors. It is plausible that the increased risk of comorbid conditions owing to underlying obesity likely plays a role. In addition, it is difficult to determine the role of cesarean delivery in SMM because it is unclear in most cases if SMM lead to cesarean delivery or cesarean delivery led to the SMM event. There is also likely a low-level chronic inflammatory response that leads to abnormal inflammatory cell interactions at the level of the uteroplacental interface during early pregnancy and leads to adverse perinatal outcomes.29
Further research is needed to investigate how these risks can possibly be mitigated, including targeting weight loss programs and interventions for reproductive age women and adolescents with obesity before conception, early screening for cardiovascular and respiratory morbidity in the preconception and antepartum period, and examining our existing thromboembolism prevention protocols.
Conclusions
Maternal morbidity and mortality continue to rise in the United States and are often preventable.2 Identification of potentially modifiable risk factors, prevention of the development of obesity, and early screening for underlying comorbidities in a high risk population are crucial steps in preventing maternal deaths and improving maternal healthcare in the United States.
Supplementary Material
TABLE 2.
Adjusted odds ratiosa of severe maternal morbidity with and without transfusion by prepregnancy body mass index
| SMM | Underweight (BMI <18.5), aOR (95% CI) | Class I obesity (BMI 30–34.9), aOR (95% CI) | Class II obesity (BMI 35–39.9), aOR (95% CI) | Class III obesity (BMI 40–49.9), aOR (95% CI) | Super obesity (BMI ≥50), aOR (95% CI) |
|---|---|---|---|---|---|
| Acute renal failure | 1.24 (0.75–2.04) | 1.26 (0.92–1.72) | 1.32 (0.84–2.08) | 2.01 (1.22–3.32)b | 4.42 (1.80–10.81)b |
| Adult respiratory distress syndrome | 0.72 (0.39–1.32) | 0.94 (0.67–1.31) | 1.41 (0.93–2.14) | 2.08 (1.31 –3.30)b | 1.56 (0.39–6.29) |
| Disseminated intravascular coagulation | 0.77 (0.55–1.09) | 0.79 (0.63–1.00) | 1.06 (0.78–1.45) | 0.75 (0.45–1.23) | 1.16 (0.37–3.62) |
| Eclampsia | 0.86 (0.45–1.63) | 1.05 (0.71 –1.56) | 0.79 (0.40–1.55) | 2.46 (1.44–4.21)b | 1.28 (0.18–9.19) |
| Heart failure during procedure or surgery | 0.58 (0.14–2.41) | 1.52 (0.82–2.82) | 2.37 (1.11 –5.07)b | 4.95 (2.38–10.29)b | 13.68 (4.17–44.87)b |
| Puerperal cerebrovascular disorders | 0.87 (0.35–2.14) | 0.65 (0.36–1.20) | 0.41 (0.13–1.29) | 2.02 (0.97–4.20) | 3.96 (0.96–16.25) |
| Pulmonary edema or acute heart failure | 0.27 (0.08–0.83) | 1.07 (0.74–1.53) | 1.51 (0.95–2.39) | 2.38 (1.45–3.90)b | 1.94 (0.48–7.88) |
| Severe anesthesia complications | 1.41 (0.61–3.27) | 1.95 (1.17–3.25)b | 2.52 (1.28–4.96)b | 3.85 (1.82–8.15)b | 4.13 (0.57–30.09)b |
| Sepsis | 0.94 (0.51 –1.74) | 1.63 (1.17–2.27)b | 1.48 (0.89–2.45) | 2.25 (1.29–3.91)b | 1.21 (0.17–8.69) |
| Air and thrombotic embolism | 1.22 (0.57–2.65) | 1.14 (0.71–1.82) | 1.42 (0.76–2.67) | 1.69 (0.78–3.67) | 5.61 (1.76–17.90)b |
| Blood transfusion | 0.93 (0.82–1.05) | 1.03 (0.95–1.11) | 1.11 (0.99–1.24) | 1.23 (1.07–1.43)b | 1.74 (1.24–2.45)b |
| Hysterectomy | 0.74 (0.46–1.21) | 0.96 (0.74–1.26) | 1.24 (0.86–1.78) | 1.29 (0.79–2.12) | 1.85 (0.59–5.81) |
| Ventilation | 0.77 (0.28–2.11) | 1.1 (0.64–1.86) | 1.58 (0.81 –3.08) | 4.25 (2.41 –7.49)b | 15.15 (6.86–33.45)b |
| Mortality | 1.22 (0.28–5.22) | 0.18 (0.02–1.31) | 0.44 (0.06–3.24) | 1.66 (0.39–7.12) | 5.92 (0.79–44.67) |
| Total SMM events | 0.99 (0.90–1.08) | 1.06 (1.00–1.12) | 1.14 (1.05–1.24)b | 1.34 (1.21 –1.49)b | 1.99 (1.57–2.54)b |
The following SMM cases were not included in the table because there were too few cases for estimation: acute myocardial infarction, amniotic fluid embolism, aneurysm, cardiac arrest/ventricular fibrillation, conversion of cardiac rhythm, shock, sickle cell disease with crisis, temporary tracheostomy.
aOR, adjusted odds ratio; BMI, body mass index; CI, confidence interval; DIC, XXX; SMM, severe maternal morbidity.
Adjusted for maternal age, race and ethnicity, education level, insurance, neighborhood poverty level, parity, smoking, and prenatal care adequacy.
Indicates statistically significant results.
AJOG MFM at a Glance.
Why was this study conducted?
This study aimed to quantify the short-term risks of severe maternal morbidity (SMM) during delivery hospitalization for patients with obesity. This is especially clinically relevant now as the incidence of obesity increases in our patient population.
Key findings
Class II (adjusted odds ratio [aOR], 1.14; 95% confidence interval [CI], 1.05–1.24), class III (aOR, 1.34; 95% CI, 1.21–1.49), and super obese (aOR, 1.99; 95% CI, 1.57–2.54) women were all significantly more likely to have SMM than normal and overweight women. Super obesity was associated with renal failure, air and thrombotic embolism, blood transfusion, heart failure, and mechanical ventilation.
What does this add to what is known?
This study specifically addresses risks of SMM in the super obese population during delivery hospitalization.
Footnotes
The authors report no conflict of interest.
The findings of the article were presented at the 40th annual meeting of the Society for Maternal-Fetal Medicine, Grapevine, TX, February 7, 2020.
Supplementary materials
Supplementary material associated with this article can be found, in the online version, at doi:10.1016/j.ajogmf.2021.100420.
Contributor Information
Marissa H. Platner, Department of Gynecology and Obstetrics, Emory University School of Medicine, Atlanta, GA.
Christina M. Ackerman, Department of Obstetrics, Gynecology and Reproductive Sciences, Yale School of Medicine, New Haven, CT.
Renata E. Howland, Department of Epidemiology, Columbia University Mailman School of Public Health, New York City, NY.
Jessica Illuzzi, Department of Obstetrics, Gynecology and Reproductive Sciences, Yale School of Medicine, New Haven, CT.
Uma M. Reddy, Department of Obstetrics, Gynecology and Reproductive Sciences, Yale School of Medicine, New Haven, CT.
Ghada Bourjeily, Department of Medicine, Warren Alpert Medical School, Brown University, Providence, RI.
Xiao Xu, Department of Obstetrics, Gynecology and Reproductive Sciences, Yale School of Medicine, New Haven, CT.
Heather S. Lipkind, Department of Obstetrics, Gynecology and Reproductive Sciences, Yale School of Medicine, New Haven, CT.
References
- 1.Ogden CL, Carroll MD, Flegal KM. Prevalence of obesity in the United States. JAMA 2014;312:189–90. [DOI] [PubMed] [Google Scholar]
- 2.Main EK, McCain CL, Morton CH, Holtby S, Lawton ES. Pregnancy-related mortality in California: causes, characteristics, and improvement opportunities. Obstet Gynecol 2015;125: 938–47. [DOI] [PubMed] [Google Scholar]
- 3.Campbell KH, Savitz D, Werner EF, et al. Maternal morbidity and risk of death at delivery hospitalization. Obstet Gynecol 2013;122:627–33. [DOI] [PubMed] [Google Scholar]
- 4.Callaghan WM, Grobman WA, Kilpatrick SJ, Main EK, D’Alton M. Facility-based identification of women with severe maternal morbidity: it is time to start. Obstet Gynecol 2014;123: 978–81. [DOI] [PMC free article] [PubMed] [Google Scholar]
- 5.Mariona FG. Does maternal obesity impact pregnancy-related deaths? Michigan experience. J Matern Fetal Neonatal Med 2017;30: 1060–5. [DOI] [PubMed] [Google Scholar]
- 6.Sturm R, Hattori A. Morbid obesity rates continue to rise rapidly in the United States. Int J Obes (Lond) 2013;37:889–91. [DOI] [PMC free article] [PubMed] [Google Scholar]
- 7.Mason EE, Doherty C, Maher JW, Scott DH, Rodriguez EM, Blommers TJ. Super obesity and gastric reduction procedures. Gastroenterol Clin North Am 1987;16:495–502. [PubMed] [Google Scholar]
- 8.Sturm R. Increases in morbid obesity in the USA: 2000–2005. Public Health 2007;121: 492–6. [DOI] [PMC free article] [PubMed] [Google Scholar]
- 9.Smid MC, Dotters-Katz SK, Vaught AJ, Vladutiu CJ, Boggess KA, Stamilio DM. Maternal super obesity and risk for intensive care unit admission in the MFMU Cesarean Registry. Acta Obstet Gynecol Scand 2017;96:976–83. [DOI] [PubMed] [Google Scholar]
- 10.Kim T, Burn SC, Bangdiwala A, Pace S, Rauk P. Neonatal morbidity and maternal complication rates in women with a delivery body mass index of 60 or higher. Obstet Gynecol 2017;130:988–93. [DOI] [PubMed] [Google Scholar]
- 11.Marshall NE, Guild C, Cheng YW, Caughey AB, Halloran DR. Maternal superobesity and perinatal outcomes. Am J Obstet Gynecol 2012;206:417.. e1–6. [DOI] [PMC free article] [PubMed] [Google Scholar]
- 12.Mbah AK, Kornosky JL, Kristensen S, et al. Super-obesity and risk for early and late preeclampsia. BJOG 2010;117:997–1004. [DOI] [PubMed] [Google Scholar]
- 13.Alanis MC, Goodnight WH, Hill EG, Robinson CJ, Villers MS, Johnson DD. Maternal super-obesity (body mass index >or = 50) and adverse pregnancy outcomes. Acta Obstet Gynecol Scand 2010;89:924–30. [DOI] [PMC free article] [PubMed] [Google Scholar]
- 14.Lisonkova S, Muraca GM, Potts J, et al. Association between prepregnancy body mass index and severe maternal morbidity. JAMA 2017;318:1777–86. [DOI] [PMC free article] [PubMed] [Google Scholar]
- 15.Severe maternal morbidity in New York City, 2008–2012. New York, NY: New York City Department of Health and Mental Hygiene; 2016. [Google Scholar]
- 16.Branum AM, Kirmeyer SE, Gregory EC. Prepregnancy body mass index by maternal characteristics and state: data from the birth certificate, 2014. Natl Vital Stat Rep 2016;65: 1–11. [PubMed] [Google Scholar]
- 17.Callaghan WM, Creanga AA, Kuklina EV. Severe maternal morbidity among delivery and postpartum hospitalizations in the United States. Obstet Gynecol 2012;120:1029–36. [DOI] [PubMed] [Google Scholar]
- 18.Centers for Disease Control and Prevention. Severe maternal morbidity in the United States. Available at: http://www.cdc.gov/reproductivehealth/MaternalInfantHealth/SevereMaternalMorbidity.html. Accessed March 7, 2016.
- 19.Kotelchuck M. An evaluation of the Kessner adequacy of prenatal Care Index and a proposed adequacy of prenatal Care Utilization Index. Am J Public Health 1994;84:1414–20. [DOI] [PMC free article] [PubMed] [Google Scholar]
- 20.ACOG Practice Bulletin No 156: obesity in pregnancy. Obstet Gynecol 2015;126. e112–26. [DOI] [PubMed] [Google Scholar]
- 21.Abenhaim HA, Alrowaily N, Czuzoj-Shulman N, Spence AR, Klam SL. Pregnancy outcomes in women with bariatric surgery as compared with morbidly obese women. J Matern Fetal Neonatal Med 2016;29:3596–601. [DOI] [PubMed] [Google Scholar]
- 22.Galazis N, Docheva N, Simillis C, Nicolaides KH. Maternal and neonatal outcomes in women undergoing bariatric surgery: a systematic review and meta-analysis. Eur J Obstet Gynecol Reprod Biol 2014;181:45–53. [DOI] [PubMed] [Google Scholar]
- 23.Johansson K, Cnattingius S, Näslund I, et al. Outcomes of pregnancy after bariatric surgery. N Engl J Med 2015;372:814–24. [DOI] [PubMed] [Google Scholar]
- 24.Lewkowitz AK, Rosenbloom JI, Keller M, et al. Association between severe maternal morbidity and psychiatric illness within 1 year of hospital discharge after delivery. Obstet Gynecol 2019;134:695–707. [DOI] [PMC free article] [PubMed] [Google Scholar]
- 25.Northam S, Knapp TR. The reliability and validity of birth certificates. J Obstet Gynecol Neonatal Nurs 2006;35:3–12. [DOI] [PubMed] [Google Scholar]
- 26.Headen I, Cohen AK, Mujahid M, Abrams B. The accuracy of self-reported pregnancy-related weight: a systematic review. Obes Rev 2017;18:350–69. [DOI] [PubMed] [Google Scholar]
- 27.Howland RE, Madsen AM, Toprani A, Gambatese M, Mulready-Ward C, Begier E. How well do birth records serve maternal and child health programs? Birth registration system evaluation, New York City, 2008–2011. Matern Child Health J 2015;19:1559–66. [DOI] [PubMed] [Google Scholar]
- 28.Lydon-Rochelle MT, Holt VL, Cárdenas V, et al. The reporting of pre-existing maternal medical conditions and complications of pregnancy on birth certificates and in hospital discharge data. Am J Obstet Gynecol 2005;193: 125–34. [DOI] [PubMed] [Google Scholar]
- 29.St-Germain LE, Castellana B, Baltayeva J, Beristain AG. Maternal obesity and the uterine immune cell landscape: the shaping role of inflammation. Int J Mol Sci 2020;21:3776. [DOI] [PMC free article] [PubMed] [Google Scholar]
Associated Data
This section collects any data citations, data availability statements, or supplementary materials included in this article.