Abstract
Introduction:
As access to antiretroviral therapy (ART) for people with HIV (PWH) in the Republic of South Sudan (RSS) increases, viral load (VL) suppression is critical to protect global HIV response investments. We describe VL scale-up between 2017–2020 in the RSS President’s Emergency Plan for AIDS Relief (PEPFAR)-supported program.
Methods:
President’s Emergency Plan for AIDS Relief (PEPFAR) South Sudan developed a VL scale-up plan and tools spanning the VL cascade: pre-test, test and post-test and included assessment of clinical facility and laboratory readiness; clinical and laboratory forms and standard operating procedures for test ordering, specimen collection, processing, results return and utilization; procedures to map clients, monitor turn-around-times (TAT), and an electronic system to monitor VL performance.
Results:
Between 2017 to 2020, VL monitoring was established in 58 facilities, with 59,600 VL samples processed, and improvements in TAT (150–28 days) and rejection rates (1.9%–0.8%). VL documentation improved for dates of ART initiation, VL test request and dispatch, and HIV regimen. Total average time from high VL to repeat VL decreased from 15.9 months to 6.4 months in 2017 and 2019, respectively.
Conclusions:
A concerted approach to VL scale-up has been fundamental as South Sudan strives towards UNAIDS 95-95-95 targets for PWH on ART.
Keywords: HIV, viral load, dried blood spot, antiretroviral therapy, enhanced adherence counseling
Introduction
The Republic of South Sudan (RSS) became an independent nation from Sudan on 9 July 2011 after decades of civil war. However, it descended into crisis in December 2013, and again in July 2016, resulting in the displacement of millions of individuals, with over 2.2 million refugees and asylum seekers as of July 2020.1 The toll of the conflict and insecurity resulted in significant death, displacement, and destruction of limited existing infrastructure, adversely affecting the health system and access to health services. Compounding threats from poverty, famine, and disease make the RSS one of the most challenging environments to work in and realize the impact of any investments.
The overarching goal of the President’s Emergency Plan for AIDS Relief (PEPFAR) program in RSS, in collaboration with the Global Fund for AIDS, Tuberculosis and Malaria (GFATM), is to support the national HIV program to provide quality services to all in need.2 The national people with HIV (PWH) burden estimate in 2016 was approximately 170,000 (130,000–210,000), with an adult HIV prevalence of 2.2% (1.7–2.8%).3 Fewer than 20,000 PWH were on antiretroviral therapy (ART) by the end of 2016.4 Spectrum 2020 estimates 180,000 PWH (140,000–230,000), with an adult HIV prevalence of 2.3%.4 ART coverage was 12% (9–15%) in 2016 and remains low at around 23% (18–29%) in 2020.3 Challenges to achieve HIV epidemic control are tied to issues that continue to afflict the RSS: insecurity, population displacement, extreme poverty, weak infrastructure, limited human resources, organizational capacity and coordination, poor health literacy, stigma, and threats from other infectious diseases. These issues have the potential to negatively impact PWH case identification, treatment, retention, and viral suppression. Despite these challenges, PEPFAR South Sudan aims to change the HIV epidemic trajectory and make strides towards the UNAIDS goals of 95-95-95, where 95% of PWH know their HIV status; 95% who know their status are on ART; and 95% on ART have suppressed viral load (VL)4 through access to HIV services, optimized ART, support for treatment continuity, VL monitoring and suppression.
As patients were placed on ART, the need to monitor their treatment using VL to detect and manage VL non-suppression became urgent. Potential threats from treatment failure, HIV drug resistance and limited treatment options heightened the urgency for routine VL monitoring in the RSS. Given the country did not previously have access to VL, the RSS was able to thoughtfully plan its VL scale-up. In June 2016, a stakeholder meeting was convened to identify the requirements for leadership, coordination, and systems for a VL operational plan. A framework for solutions, adapted from the United States Department of Defense, took into consideration the domains of doctrine, organization, training, materiel, leadership and education, personnel, and facilities (DOTMLPF) required to accomplish the mission of VL scale-up with quality and efficiency.5 Emphasis was placed on close coordination between clinical, laboratory, and data disciplines, understanding their critical interdependence for success as measured by VL coverage (VLC) and VL suppression (VLS), and data quality of these two metrics. Herein, we describe the VL scale-up approach in the RSS and highlight the development, adaptation and application of facility and laboratory standardized tools and measurements for the program to monitor its HIV treatment performance.
Methods
President’s Emergency Plan for AIDS Relief South Sudan took a multi-pronged VL scale-up approach by developing, applying, and utilizing findings from tools that helped to identify gaps and barriers, inform requirements and measure its progress. The Ministry of Health (MOH) established a multidisciplinary VL task force in 2017 and developed a VL scale-up plan and tools that span the VL cascade pre-test, test and post-test. Viral load monitoring forms included VL requisition form (VLRF), which captures key variables such as age, sex, pregnancy/breastfeeding (BF) status, ART regimen, date of sample collection; sample tracking register; chain of custody; VL dispatch; and VL result forms. Tools’ implementation allowed routinely collected data to monitor key process and outcome indicators such as number of samples collected, samples tested, and turn-around time (TAT) and rejection rates. Turn-around time was measured as the sum of the time from VL test ordering (request) to VL sample collection (collect), collection to receipt (collect to receipt), receipt to testing (receipt to test) and testing to results dispatch (test to dispatch). Clinical and laboratory VL standard operating procedures (SOPs) were developed to standardize processes for VL test ordering, dried blood spot (DBS) sample collection, storage and transport, reception and storage, sample rejection, rejection notification and re-collection, handling of VL results, tracking pending results, and management of suppressed versus nonsuppressed/high VL (HVL) results (≥1000 cp/mL). Similarly, job aids for sample collection, storage, and transport, and population-specific VL monitoring (e.g. non-pregnant adults, pregnant females, and children) were created. Ongoing clinical and laboratory mentorship to address performance issues such as the need for retraining on DBS collection to reduce specimen rejection, VLRF completion and HVL actions, among others was established.
Prior to the inception of VL sample collection, the MOH circulated a memo, articulating the justification for VL monitoring and the national plan for VL scale-up, with a call to action for site-level preparedness and commitment. Dried blood spot sample type was chosen over plasma primarily due to limited cold chain capabilities. The samples were initially transported to Kenya for processing until the RSS established its own VL testing capacity using the Abbott RealTime HIV-1 (m2000sp) assay at the HIV Reference Laboratory (HRL) at the National Public Health Laboratory (NPHL) in Juba in 2018.
The sample HIV/TB transport network has relied on donor support and uses motor bikes, public service vehicles, commercial and humanitarian flights to support sample movement and VL results return (outside of Juba). Sample tracking tools to monitor sample flow include sample and result delivery log sheets, chain of custody form, sample dispatch and sample reception logbook. Along with the development and implementation of VL-specific forms and SOPs, five primary tools and approaches were used to document progress: the facility readiness assessment (FRA), laboratory scorecard, facility mapping exercise, HVL register, and VL results sample management (VLSM) system.
The FRA tool was used to conduct a situational analysis of the facilities’ readiness as measured by the systems in place for routine VL monitoring of patients on ART and provided a standardized approach to measure the baseline VL situation. Scores were assigned according to the extent elements were in place (e.g. VL monitoring algorithms, MOH VL requisition form, staff responsibilities, SOPs for VL ordering, documentation, VL results’ utilization for patient management, patient education for VL literacy, procedures for DBS collection, preparation, packaging, and transport). Scores were calculated by dividing the total number of positive responses by questions for each area. Readiness levels were based on score percentages for each section and ranged from level 0 to level 4, corresponding with the degree of facility readiness for VL monitoring and the need for remediation in specific areas.
The laboratory scorecard was used to assess the RSS VL testing laboratory, the HRL at the NPHL, readiness for VL testing. The scorecard used a point system for VL cascade elements to include pre-test (e.g. personnel, facility/environment, safety, waste management, procurement/inventory, and sample management); test (e.g. equipment, process controls); and post-test (e.g. documentation, internal quality audits, and quality indicators).
Facility mapping was performed to understand the flow of clients, samples and data, and individuals responsible for VL-specific tasks at each service delivery point including VL eligibility determination, sample collection, results return and utilization for patient management. Mapping was reviewed to identify areas for improved client-centered approaches and site compliance with VL monitoring standards. SOPs were developed for management of non-suppressed VL results. Providers were trained on Enhanced Adherence Counseling (EAC) using sub-population specific tools (e.g. EAC flip charts for non-pregnant adults, pregnant and BF women, children, and adolescents) and the HVL form was used to document client-specific ART adherence barriers and jointly developed interventions to improve adherence.
A paper-based HVL register was developed to track actions and outcomes for non-suppressed PWH with HVL, and captured patient age, sex, pregnancy/BF status, VL sample collection dates, results, dates of EAC, repeat VL sample collection date and result, ART regimen switch and repeat VL measurement date and result among those who switched. An electronic version of the HVL (eHVL) register was developed to monitor site HVL cascades, measuring compliance with and timeliness of expected interventions. The eHVL register auto-populated patient information to track individuals who were overdue for EAC or repeat VL.
A VL sample management system (VLSM)/laboratory information system was established to capture and monitor VL data and was analyzed along with routinely collected PEPFAR program data through the monitoring, evaluation, and reporting6 system to assess performance trends in VLC, VLS, TAT and sample rejection rates. Proxy VLC was defined as the percentage of PWH on ART for at least 3 months with a documented VL in the past 12 months and uses as the denominator the number of patients on ART from two quarters prior. VL suppression was defined as the percentage of PWH on ART with a documented VL in the past 12 months with a VL result <1000 copies/ml. Program and site performance were reviewed during VL task force meetings to focus resources and interventions.
Ethics
This evaluation of public health programs used de-identified, aggregate data; there were no perceived ethical risks to care recipients, therefore no informed consent was obtained. This project received ethical approval from the RSS Ministry of Health, Research Ethics Review Board and was reviewed in accordance with the U.S. Centers for Disease Control and Prevention (CDC) human research protection procedures and was determined to be research, but CDC investigators did not interact with human subjects or have access to identifiable data or specimens for research purposes.
Results
VL performance
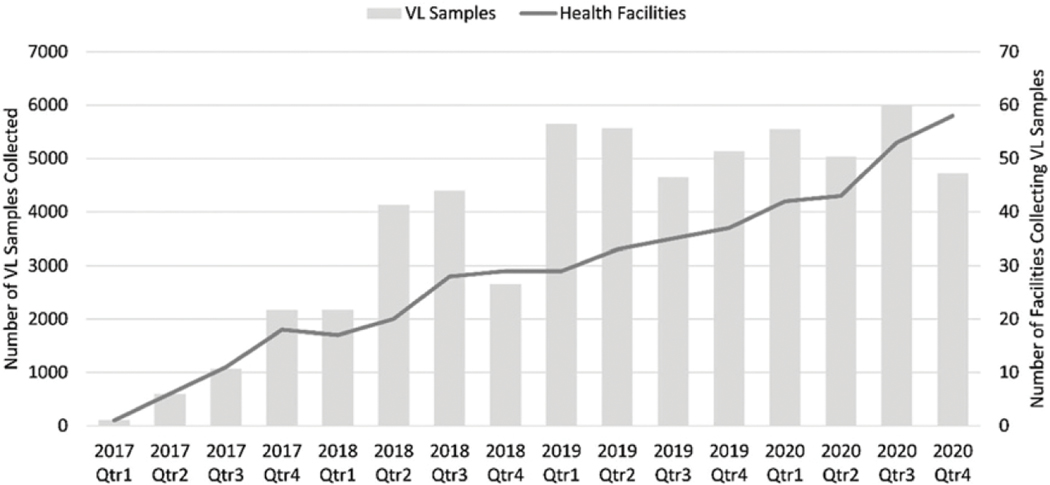
Viral load sample collection began in March 2017, with one facility collecting 110 samples in that year. Routine VL monitoring was established in May 2018. By December 2020, a total of 58 sites had VL sample collection capacity, with the HRL testing 59,600 samples between 2017 and 2020 (Figure 1).
Figure 1.
VL sample and health facility reporting over time, 2017–2020.
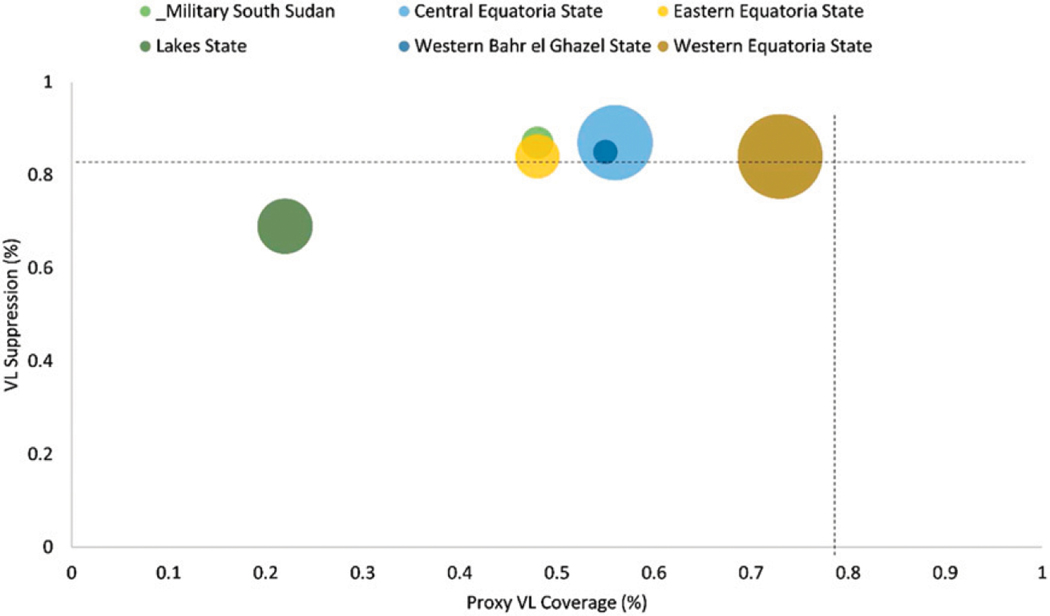
VLC was highest for October-December 2019 at 72% and for 2020 ranged between 56–68% (Figure 2), dropping from the late 2019 peak likely due to COVID-19 disruptions. Between October-December 2020, site VLS ranged between 49–100%; 38% had VLS ≥90%, 57% had VLS 70–89%, and 4% had VLS 50–69%, 2% had VLS <50%. VL suppression in 2020 ranged between 83–86% (Figure 2).
Figure 2.
VL coverage and VL suppression by state, South Sudan, October–December 2020 (n = 21,302).
Key performance indicators
Turnaround time and sample rejection.
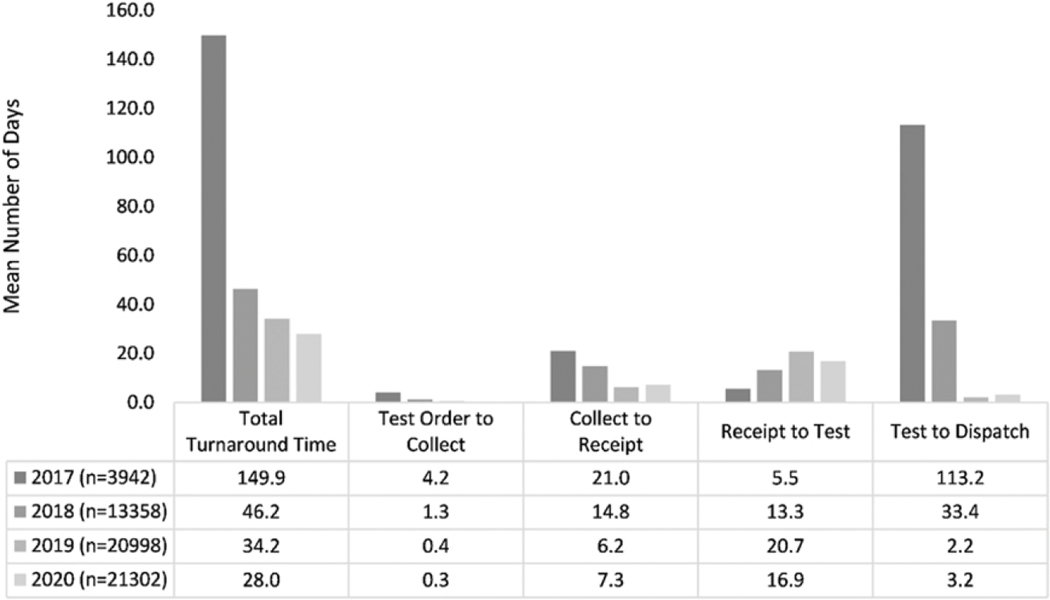
Despite the different modes of sample transportation, the mean overall TAT decreased from 149.9 days in 2017 to 28 days in 2020. The longest 2020 TAT interval of 16.9 days was observed for VL sample receipt by HRL to testing (Figure 3).
Figure 3.
Mean viral load turnaround time by year, 2017–2020.
By RSS State, the mean TAT in 2020 for Central Equatoria, Eastern Equatoria, Lakes and Western Bahr-el-Ghazel was 27.4, 26.8, 37, and 21.3 days, respectively (not shown). Sample rejection rates were consistently less than 2%, with an overall average rejection rate of 0.8% (471/59, 600) for the period 2017–2020 with declines over this period from 1.9% in 2017, 0.9% in 2018, 0.5% in 2019, to 0.7% in 2020.
Facility readiness assessment
Twenty-two facilities were assessed using the VL scale-up clinical FRA tool between July 2016 and June 2018. The mean average FRA clinical component score was 39% (range, 0%–81%). At the time of data collection, 4 facilities had just started VL monitoring while other facilities were in the early stages. Approximately one third (35%) of facilities had identified key individuals to handle VL-related tasks. None of the facilities had VL information collection or results management SOPs. Most (85%) facilities reported VL sample collection from adults, with (65%) reporting sample collection from children under 15 years of age. The average FRA laboratory component score was 56% (range, 14%–63%), with the most common facility laboratory-related deficiencies in the availability of sample collection commodities, including powder-free gloves, zip-lock bags to store samples, spill kits, and DBS humidity indicator cards. No facilities reported access to cold chain to support VL sample collection or the ability to monitor sample temperatures. Assessment findings were debriefed with site staff, including the in-charge, ART clinicians, laboratory, and other staff, and with the laboratory and clinical implementing partner for prioritization of deficiencies and site corrective actions.
VL laboratory scorecard
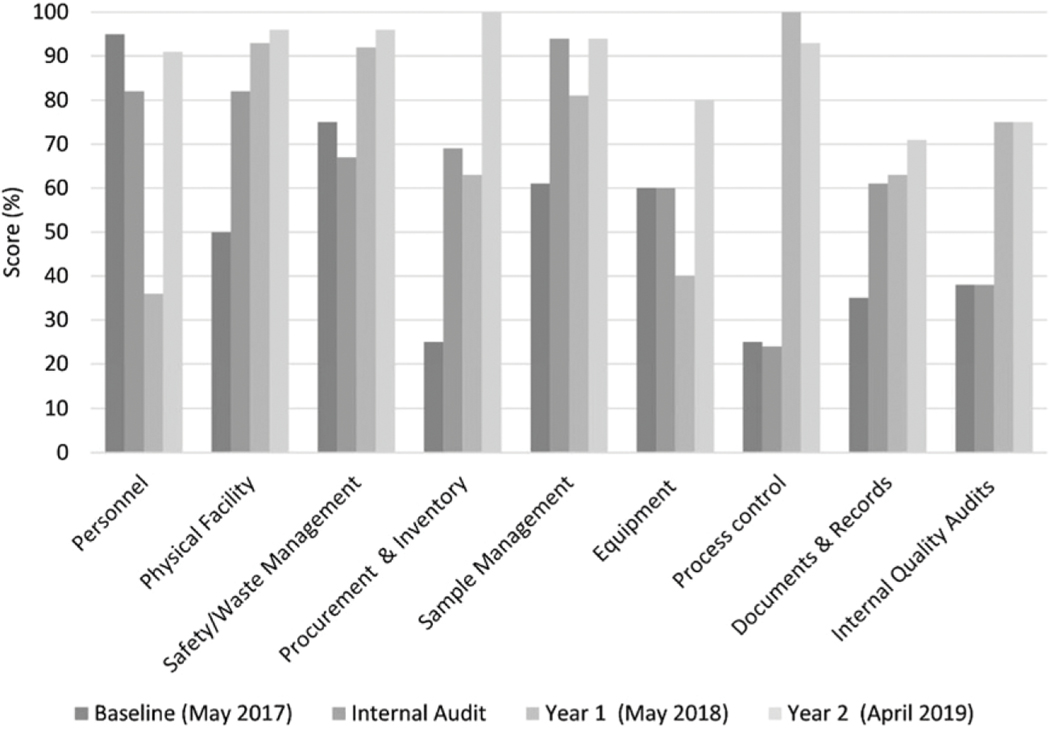
The VL laboratory scorecard was used to identify gaps in pre-testing, testing and post testing at the HRL. The scorecard assessment was carried out three times, over the course of 3 years (Figure 4).
Figure 4.
Laboratory scorecard results, 2017–2019.
HRL profile and scores were determined at baseline in May 2017, and subsequently in May 2018 and April 2019. Improvements over time were observed in all 9 areas measured. Process control (0–95%), equipment (0–80%), and internal quality audits (10–75%) showed the greatest increases in 2 years. Findings were reviewed with HRL laboratory personnel (e.g. laboratory manager, quality officer and other laboratory staff), with the implementing partner and MOH to develop a gap/barrier-driven improvement plan towards accreditation by an international accrediting organization.
Facility mapping
Facility mapping was carried out for 17 facilities and showed the flow of clients, VL samples, and locations of VL-related data and human resources. Mapping was used to optimize client centered VL services and included modifications such as the prioritization of the movement of VL samples over patients with co-location of VL sample collection where ART services occur, expanding collection days and times, and other procedural changes to prevent missed opportunities for VL sample collection in eligible clients, results’ notification, and EAC delivery. Additionally, site VL focal persons were established, and facility staff roles and responsibilities were clarified such that each facility knew who was responsible for actions such as VL results return, tracking pending results and HVL management.
High VL management
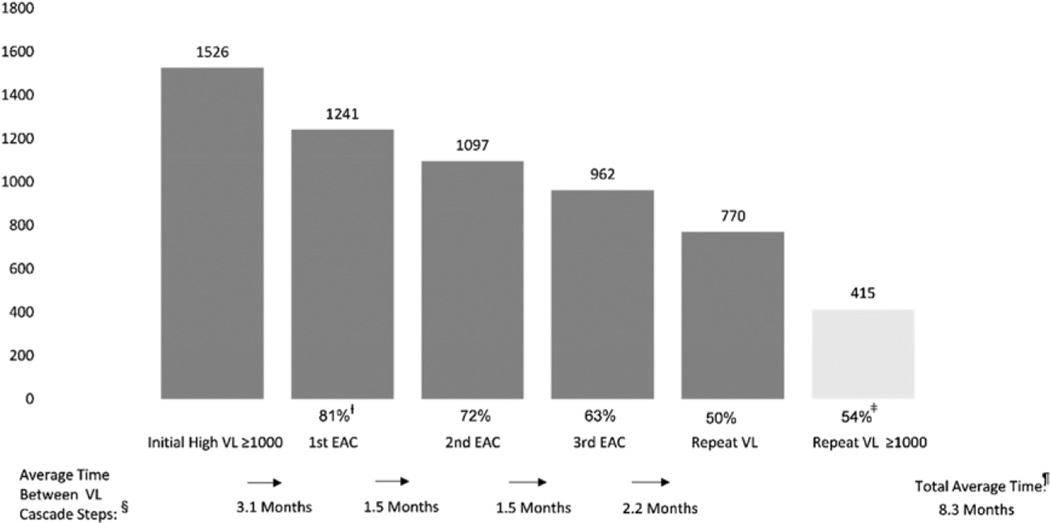
Between October 2017-December 2019, HVL cascade analyses identified challenges in time from initial HVL to first EAC, compliance with EAC sessions and repeat VL sample collection post EAC 3, and VL re-suppression. As an illustration, in 2018, the average time from initial HVL to EAC 1 was 3.1 months, from EAC 1 to EAC 2 and EAC 2 to EAC 3, 1.5 months each, and from EAC 3 to repeat VL, 2.2 months (Figure 5).
Figure 5.
High Vl cascade, 2018.ƚ Percentages reflect intervention compliance for PWH with VL results ≥1000 copies per mL for first EAC, second EAC and third EAC, and repeat VL measurement using the number of individuals with high VL as the denominator.ǂ Repeat VL ≥ 1000 copies per mL percentage is of PWH with repeat VL results.§ Average time between VL cascade steps is measured in months. Total average time from initial high VL to repeat VL is measured in months.
The total average time from HVL to repeat VL after EAC decreased from 12.3 months to 8.3 months and 5.6 months from 2017 to 2019, respectively.
The use of the eHVL register allowed for the analysis of HVL cascades for specific time periods, by age, sex, or pregnancy and BF status and site. Determining which patients by age and sex were more likely to receive EAC or achieve re-suppression was facilitated using the eHVL register and sub-population HVL cascade analyses were used to focus root cause identification and quality improvement (QI) interventions. Additionally, data on PWH who were missing specific interventions (e.g. EAC, repeat VL testing, ARV regimen change consideration) allowed for more efficient and specific patient tracking and follow-up.
Viral load sample management system
A Microsoft Excel spreadsheet was initially used for VL results documentation, with the establishment of the VLSM in March 2017, where Excel collected data were imported. VLSM data quality improved over time for ART regimen, date of ART initiation, request date, test and dispatch date, though pregnancy and BF status were still missing 4 and 3%, respectively and the date of ART initiation missing 3% in 2020 (Table 1). There was a 16% reduction in missing data among key variables in VLSM between 2017 and 2020.
Table 1.
Percent of data missing in VLSM by year, ƚ 2017–2020.
| VLSM variable | 2017 (%) | 2018 (%) | 2019 (%) | 2020 (%) | % Change (%) |
|---|---|---|---|---|---|
|
| |||||
| Age | 0 | 0 | 0 | 0 | 0% |
| Sex | 0 | 0 | 0 | 0 | 0% |
| Regimen | 4 | 2 | 2 | 2 | −2% |
| Date of ART initiation | 91 | 1 | 2 | 3 | −88% |
| Date of sample collection | 0 | 0 | 0 | 0 | 0% |
| Pregnant status | 2 | 6 | 6 | 4 | 2% |
| Breastfeeding status | 3 | 6 | 5 | 3 | 1% |
| Request date | 7 | 3 | 0 | 0 | −7% |
| Test date | 2 | 1 | 1 | 1 | 0% |
| Dispatch date | 65 | 1 | 0 | 0 | −65% |
% Change 2020 relative to 2017, with negative value representing higher completeness.
The VLSM data were used for performance review, along with other data to inform sites’ VLC, VLS rates, TAT, rejection rates and rejection reasons. The VL task force met to discuss performance and process optimization and continued VL expansion. Facilities utilized VL data to identify gaps along the VL cascade (VL demand creation, test ordering, specimen collection and transport, specimen processing, results transmission, documentation, and utilization for patient management), and identified QI driven actions for site-level improvements.
Discussion
The RSS scaled up VL in a deliberate manner through the systematic development, adaptation, and implementation of VL tools, SOPs and job aids, and laid a foundation to improve VLC, VLS, and quality of testing. Identification of VL cascade gaps and data-driven performance issues remain important to VL scale-up efforts. In 2020, the number of facilities offering ARTservices had increased 7-fold since the introduction of VL monitoring in 2017. Since 2017, the number of PWH eligible for VL monitoring grew to over 29, 000 and continues to grow. Disparities between VLC and VLS among states and sites exist, reminding us of ongoing program challenges. To meet the increasing VL testing demand, the HRL continues to improve its processes in all areas pre-test, test, and post-test. The use of dried blood spot as a sample type facilitates decentralization of specimen collection and has been used to increase VL access in resource-limited settings.7
The PEPFAR South Sudan program hired HIV/TB field officers and regional coordinators who are assigned a limited number of closely located sites. The field officers oversee all aspects of the HIV/TB program including VL, and through regular site visits and a granular site management strategy guided by continuous data and performance review, use a team approach that includes the site, implementing partner, field officer and PEPFAR staff, to improve VLC and VLS. A weekly site dashboard was developed to monitor HIV cascade parameters including the number of individuals eligible for VL who had their samples collected and the number of HVL clients who received EAC, and with site HVL cascades, help inform quality improvement activities.
Active tracking and interventions for PWH on ARTwith VL non-suppression (≥1000 cp/mL) remain a program priority and will be increasingly supported by a community cadre who work closely with the client and facility towards the goals of adherence, treatment continuity and viral suppression. Efforts to decentralize VL-related services are also ongoing along with investments in human resources for health to ensure facility, laboratory and community level VL services’ quality assurance.
Conclusions
Life-long HIV treatment and durable VLS for individual and public health benefit require closing the testing gap such that all eligible PWH receive VL monitoring and all non-suppressed results are acted on. The commitment and partnership of the government, its communities and people towards improved patient HIV treatment literacy, retention and data utilization for continuous QI remain pivotal for success. Despite the odds against VL scale-up, client-centered models of service delivery that include improved client HIV and VL literacy, ARV optimization, multi-month dispensing, accessible VL monitoring and quality interventions for VL non-suppression will help RSS meet the challenge of achieving the third 95 fast-track UNAIDS target for PWH on ART who are virally suppressed.
Acknowledgements
We would like to acknowledge the National HIV Reference Laboratory (NHRL), Kenya support with VL testing prior to in-country capacity establishment, the clients, implementing partners, field officers, US Agency for International Development, US Department of Defense, and MOH.
Funding
The author(s) disclosed receipt of the following financial support for the research, authorship, and/or publication of this article: This work was supported by the President’s Emergency Plan for AIDS Relief through the Centers for Disease Control and Prevention. The findings and conclusions in this report are those of the authors and do not necessarily represent the official position of the funding agencies. Applicable federal law for ethical review include: 45 C.F.R. part 46.102(l)(2), 21 C.F.R. part 56; 42 U.S.C. §241(d); 5 U.S.C. §552a; 44 U.S.C. §3501 et seq.
Nomanclature
- ART
Antiretroviral therapy
- ARV
Antiretroviral
- DBS
Dried blood spot
- EAC
Enhanced Adherence Counseling
- eHVL
Electronic high viral load
- FRA
Facility readiness assessment
- GFATM
Global Fund for AIDS, Tuberculosis and Malaria
- HRL
HIV Reference Laboratory
- HVL
High viral load
- MOH
Ministry of Health
- NPHL
National Public Health Laboratory
- PEPFAR
President’s Emergency Plan for AIDS Relief
- PWH
People with HIV
- RSS
Republic of South Sudan
- SOPs
Standard operating procedures
- TAT
Turn-around-time
- UNAIDS
Joint United Nations Programme on HIV/AIDS
- VL
Viral load
- VLC
Viral load coverage
- VLS
Viral load suppression
- VLSM
Viral load sample management
- WHO
World Health Organization
Footnotes
Declaration of conflicting interests
The author(s) declared no potential conflicts of interest with respect to the research, authorship, and/or publication of this article.
References
- 1.The World Bank. Population, total South Sudan, https://data.worldbank.org/indicator/SP.POP.TOTL?locations=SS (accessed 16 September 2021). [Google Scholar]
- 2.PEPFAR. PEPFAR blueprint: Creating an AIDS-free generation. Washington, DC: US Department of State, https://2009-2017.state.gov/r/pa/prs/ps/2012/11/201195.html (2012, accessed 25 August 2021). [Google Scholar]
- 3.UNAIDS. Fast-track. Ending the AIDS epidemic by 2030, https://www.unaids.org/sites/default/files/media_asset/JC2686_WAD2014report_en.pdf (2014, accessed 14 February 2021).
- 4.. SPECTRUM. https://aidsinfo.unaids.org/ (2020, accessed 25 August 2021).
- 5.Joint Staff, Washington, DC. Charter of the joint requirements oversight council (JROC) and implementation of the joint capabilities integration and development system (JCIDS) CJCSI 5123.01H 31, https://acqnotes.com/wp-content/uploads/2018/11/CJCSI-5123.01H-Charter-of-the-Joint-Requirements-Oversight-Council-JROC-and-Implementation-of-the-JCIDS-31-Aug-2018.pdf (2018, accessed 18 July 2021). [Google Scholar]
- 6.PEPFAR/US Department of State document. PEPFAR monitoring, evaluation and reporting (MER) indicators, https://www.state.gov/pepfar-fy-2021-mer-indicators/ (accessed 25 August 2021).
- 7.Pannus P, Claus M, Gonzalez MM, et al. Sensitivity and specificity of dried blood spots for HIV-1 viral load quantification: a laboratory assessment of 3 commercial assays. Medicine (Baltimore) 2016; 95(48): e5475. DOI: 10.1097/MD.0000000000005475. [DOI] [PMC free article] [PubMed] [Google Scholar]


