PURPOSE
Variability in computed tomography images intrinsic to individual scanners limits the application of radiomics in clinical and research settings. The development of reproducible and generalizable radiomics-based models to assess lesions requires harmonization of data. The purpose of this study was to develop, test, and analyze the efficacy of a radiomics data harmonization model.
MATERIALS AND METHODS
Radiomic features from biopsy-proven untreated hepatic metastasis (N = 380) acquired from 167 unique patients with pancreatic, colon, and breast cancers were analyzed. Radiomic features from volume-match 551 samples of normal liver tissue and 188 hepatic cysts were included as references. A novel linear mixed effect model was used to identify effects associated with lesion size, tissue type, and scanner model. Six separate machine learning models were then used to test the effectiveness of radiomic feature harmonization using multivariate analysis.
RESULTS
Proposed model identifies and removes scanner-associated effects while preserving cancer-specific functional dependence of radiomic features on the tumor size. Data harmonization improves the performance of classification models by reducing the scanner-associated variability. For example, the multiclass logistic regression model, LogitBoost, demonstrated the improvement in sensitivity in the range from 15% to 40% for each type of liver metastasis, whereas the overall model accuracy and the kappa coefficient increased by 5% and 8% accordingly.
CONCLUSION
The model removed scanner-associated effects while preserving cancer-specific functional dependence of radiomic features.
INTRODUCTION
Colorectal cancer, pancreatic cancer (PC), and breast cancers (BCs) are responsible for nearly 25% of all cancer deaths. The liver is the most common site of visceral metastasis for each of these malignancies.1 Up to 70% of patients with colorectal cancer and up to 50% of patients with PC or BC will develop liver metastasis at some point during their disease. Computed tomography (CT) is important in assessing both baseline disease tumor burden and response to therapy in each of these malignancies.2 Clinically, assessment is commonly performed with qualitative or quantitative anatomic imaging biomarkers such as lesion size, descriptors of enhancement, or presence of necrosis. However, oncologic imaging is expected to be affected by advanced image analysis leveraging machine learning (ML) and deep learning methods.3 Convergence of imaging and big-data techniques can significantly contribute to the development of personalized medicine. For example, radiomics offers a more thorough tumor description on the basis of high-throughput quantification of the intralesion and interlesion heterogeneity4-6 related to tumor biology and microenvironment.7 Application of radiomics with ML in oncology has demonstrated promising results in classification and prognostic studies and may eventually be adapted to assess tumor response to therapy.8-10
CONTEXT
Key Objective
Are predictive models based on radiomics and machine-learning sensitive to individual computed tomography scanners?
Knowledge Generated
A new radiomics data harmonization model can effectively identify and remove computed tomography scanner–associated effects.
Relevance
Data harmonization can preserve the cancer-specific association of radiomic features on the tumor size and improve the performance of machine learning classification models.
Despite remarkable advances, radiomics faces various challenges.7,11 The high sensitivity of radiomic features to various texture patterns plays an important role in the development of radiomics models.12 However, radiomic features are also sensitive to image acquisition factors, such as scanner model, imaging protocols, and reconstruction algorithm.13-15 These factors may affect various radiomic features differently16-18 complicating the development of reproducible and generalizable radiomics-based models across clinical sites and institutions.19
Harmonization of radiomic features is required to ensure accuracy and reproducibility of radiomics models in multicenter clinical site settings.20 The two most common harmonization methods are standardization of image acquisition and postacquisition harmonization. Standardization of image acquisition protocol is a common practice in clinical trials.21 Although this helps to reduce variability in data, it is insufficient for radiomics analysis in studies that are performed on different CT scanners because variability in image acquisition contributes to a systematic bias in radiomics data. Harmonization of radiomic features implies a batch-effect correction to remove the bias associated with image acquisition factors.20 For example, a statistical method called Combat on the basis of an empirical Bayes framework was developed to adjust the batch effect in genetic data22 and was applied in various radiomics studies.23-26 However, Combat does not eliminate the bias; instead, it provides a uniform distortion across all classes. Moreover, Combat requires a representative sampling that could be a limiting factor in multicenter trials with a small number of patients per center. To allow radiomics to be used on a larger scale both within and among institutions, a postacquisition harmonization step is required. We propose a novel model that performs radiomics data harmonization across different CT scanners with preservation of radiomic features of tumor subtype and size.27-32
MATERIALS AND METHODS
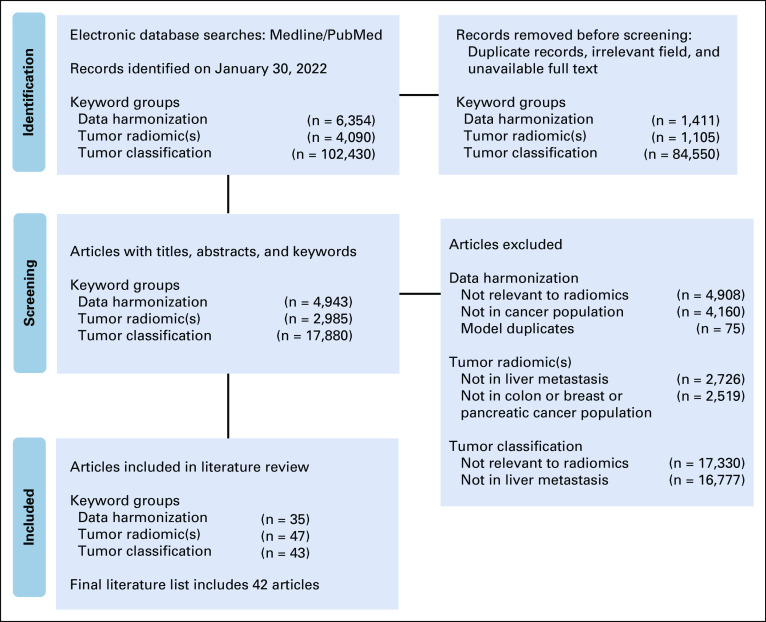
This retrospective cohort study was approved by the Institutional Review Board and was granted a waiver of Health Insurance Portability and Accountability Act authorization and a waiver of written informed consent. The research methods were performed in accordance with the Declaration of Helsinki. A literature search was performed using PubMed in accordance with the guidelines from the Preferred Reporting Items for Systematic Review and Meta-Analysis group (Appendix Fig A1).
Patients
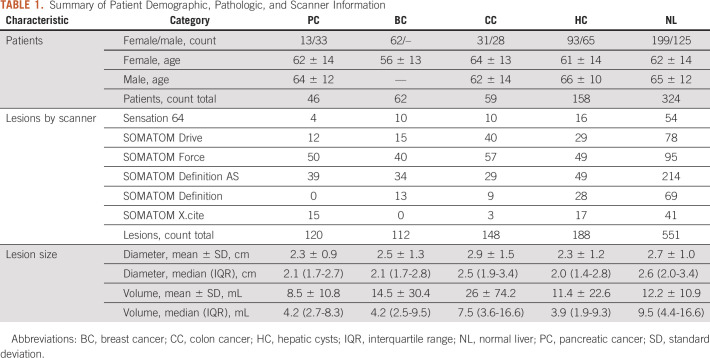
A multisite single-enterprise database was queried for patients with untreated pathologically proven metastatic liver tumors from January 2015 through January 2020. The inclusion criteria for this study were (1) patients with at least one pathologically proven lesion representing metastatic liver disease from PC, colon (CC), or BC; (2) presence of a pretreatment contrast-enhanced portal venous phase CT scan; and (3) at least one segmentable hepatic metastasis. Patients were excluded from analysis for the following reasons: (1) previous history of cancer and or prior cancer treatments, (2) multiple cancers of different types, (3) no evidence of malignancy in the biopsy of liver metastasis, (4) infiltrative unsegmentable liver lesions, and (5) radiologically apparent background liver disease such as morphologic cirrhosis, depositional liver diseases, and/or fatty liver. A total of 384 patients with liver metastasis were initially identified. Application of inclusion criteria resulted in a total of 167 patients (106 females and 61 males, Table 1).
TABLE 1.
Summary of Patient Demographic, Pathologic, and Scanner Information
CT Scanners
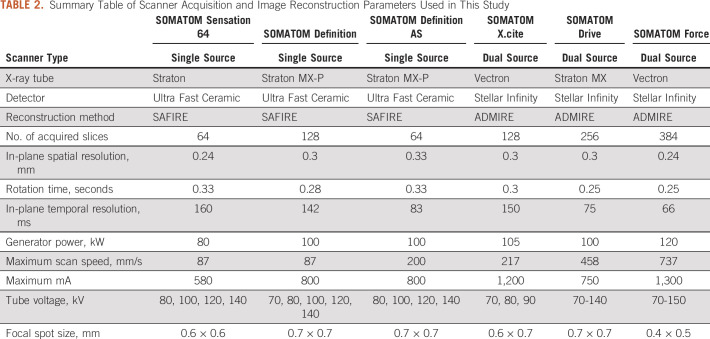
All imaging was performed on CT scanners from only a single vendor (Siemens, Erlangen, Germany). Six Siemens CT scanners were used to image study subjects with variable acquisition techniques and protocols (Table 2).
TABLE 2.
Summary Table of Scanner Acquisition and Image Reconstruction Parameters Used in This Study
Tumor Image Segmentation and Radiomic Feature Extraction
Lesion segmentation was performed manually by a single radiologist (author M.A.S.S.) with 3 years of radiology and 2 years of quantitative and radiomics analysis experience using LIFEx software, version 6.30 (Orsay, France).33 Up to three well-defined and well-separated liver metastases with the longest diameter ≥ 10 mm were selected in each patient. A range of 2-3 mm of perilesional rim was included in the volume of interest. A total of 380 lesions from 167 patients with metastatic liver disease were segmented and submitted for radiomics analysis. In addition, 188 hepatic cysts (HC) from 158 patients without liver metastasis and 551 size-matched samples of normal liver (NL) tissue from 324 patients including patients with liver metastasis and cysts were considered as reference lesions. Patient and lesion characteristics are shown in Table 1. Image processing, radiomics parameters, software details, and an additional discussion on the topic of tumor segmentation are provided in Appendix 1.
Data Harmonization Model
Although each scanner has distinct imaging properties, it is only possible to identify a systematic bias in comparison of one scanner with another. Therefore, first, a reference group was assembled by selecting patients with identical tumor types who were imaged on a unique CT scanner for patients with metastatic liver disease from one type of cancer. Next, a linear mixed-effects (LME) model was applied.34 The main advantage of LME is that for each group it is assumed to have an individual association between radiomic features and tumor size. This association is considered consisting of two components: fixed effects common to all patients from all groups and random effects specific to each patient and therefore varying between different groups.
LME analysis was performed for three fixed-effect variables: cancer or tissue type (T), scanner (S), and VOI volume (V). The volume was considered as a primary variable. The type and scanner were considered as fixed factors, which could affect the intercept and slope of the linear model. Therefore, the LME model could be summarized as follows:
| (1) |
Equation 1 describes a linear relationship between the radiomic feature and tumor volume. It includes fixed effects which defines the reference group, , where is the intercept and is the slope. Additional components describe random effects associated with scanners and tissue types, specifically random intercepts, rS and rT, and random slopes, and . Once all random effects are calculated, all radiomic features were harmonized by removing random effects associated with the scanners:
| (2) |
where is a new harmonized radiomic feature adjusted with the scanner from the reference group. This approach allows change in the reference group to a new group with reharmonization of all radiomic features accordingly. In addition, this model can be expanded to more variables linked to different image acquisition parameters, for example CT x-ray energy.
ML Classifiers and Performance Measures
To assess the performance of proposed data harmonization model, we examined the accuracy of classification of liver metastasis from different cancer types using the original and harmonized data sets. Principal component analysis was applied to visualize the grouping of features and to assess the explained variation in both data sets. Multivariate analysis of radiomic features for predicting lesion type was performed using six ML models: Support Vector Machine, Random Forest, Weighted Subspace Random Forest, Boosted Logistic Regression, Stochastic Gradient Boosting, and Extreme Gradient Boosting. Performance of each ML model for predicting lesion type was determined by calculating the sensitivity, specificity, positive predictive value, and negative predicative value.
RESULTS
An association between CT-based 3-dimensional radiomic features and the tumor size was seen using the linear mixed-effect model. Radiomic features dependent on region of interest size showed discrimination between each tumor type and between cysts and NL volumes of interest (Fig 1). Appendix Table A1 shows the coefficient of determination, R2, for each best fitting model used for feature normalization.
FIG 1.
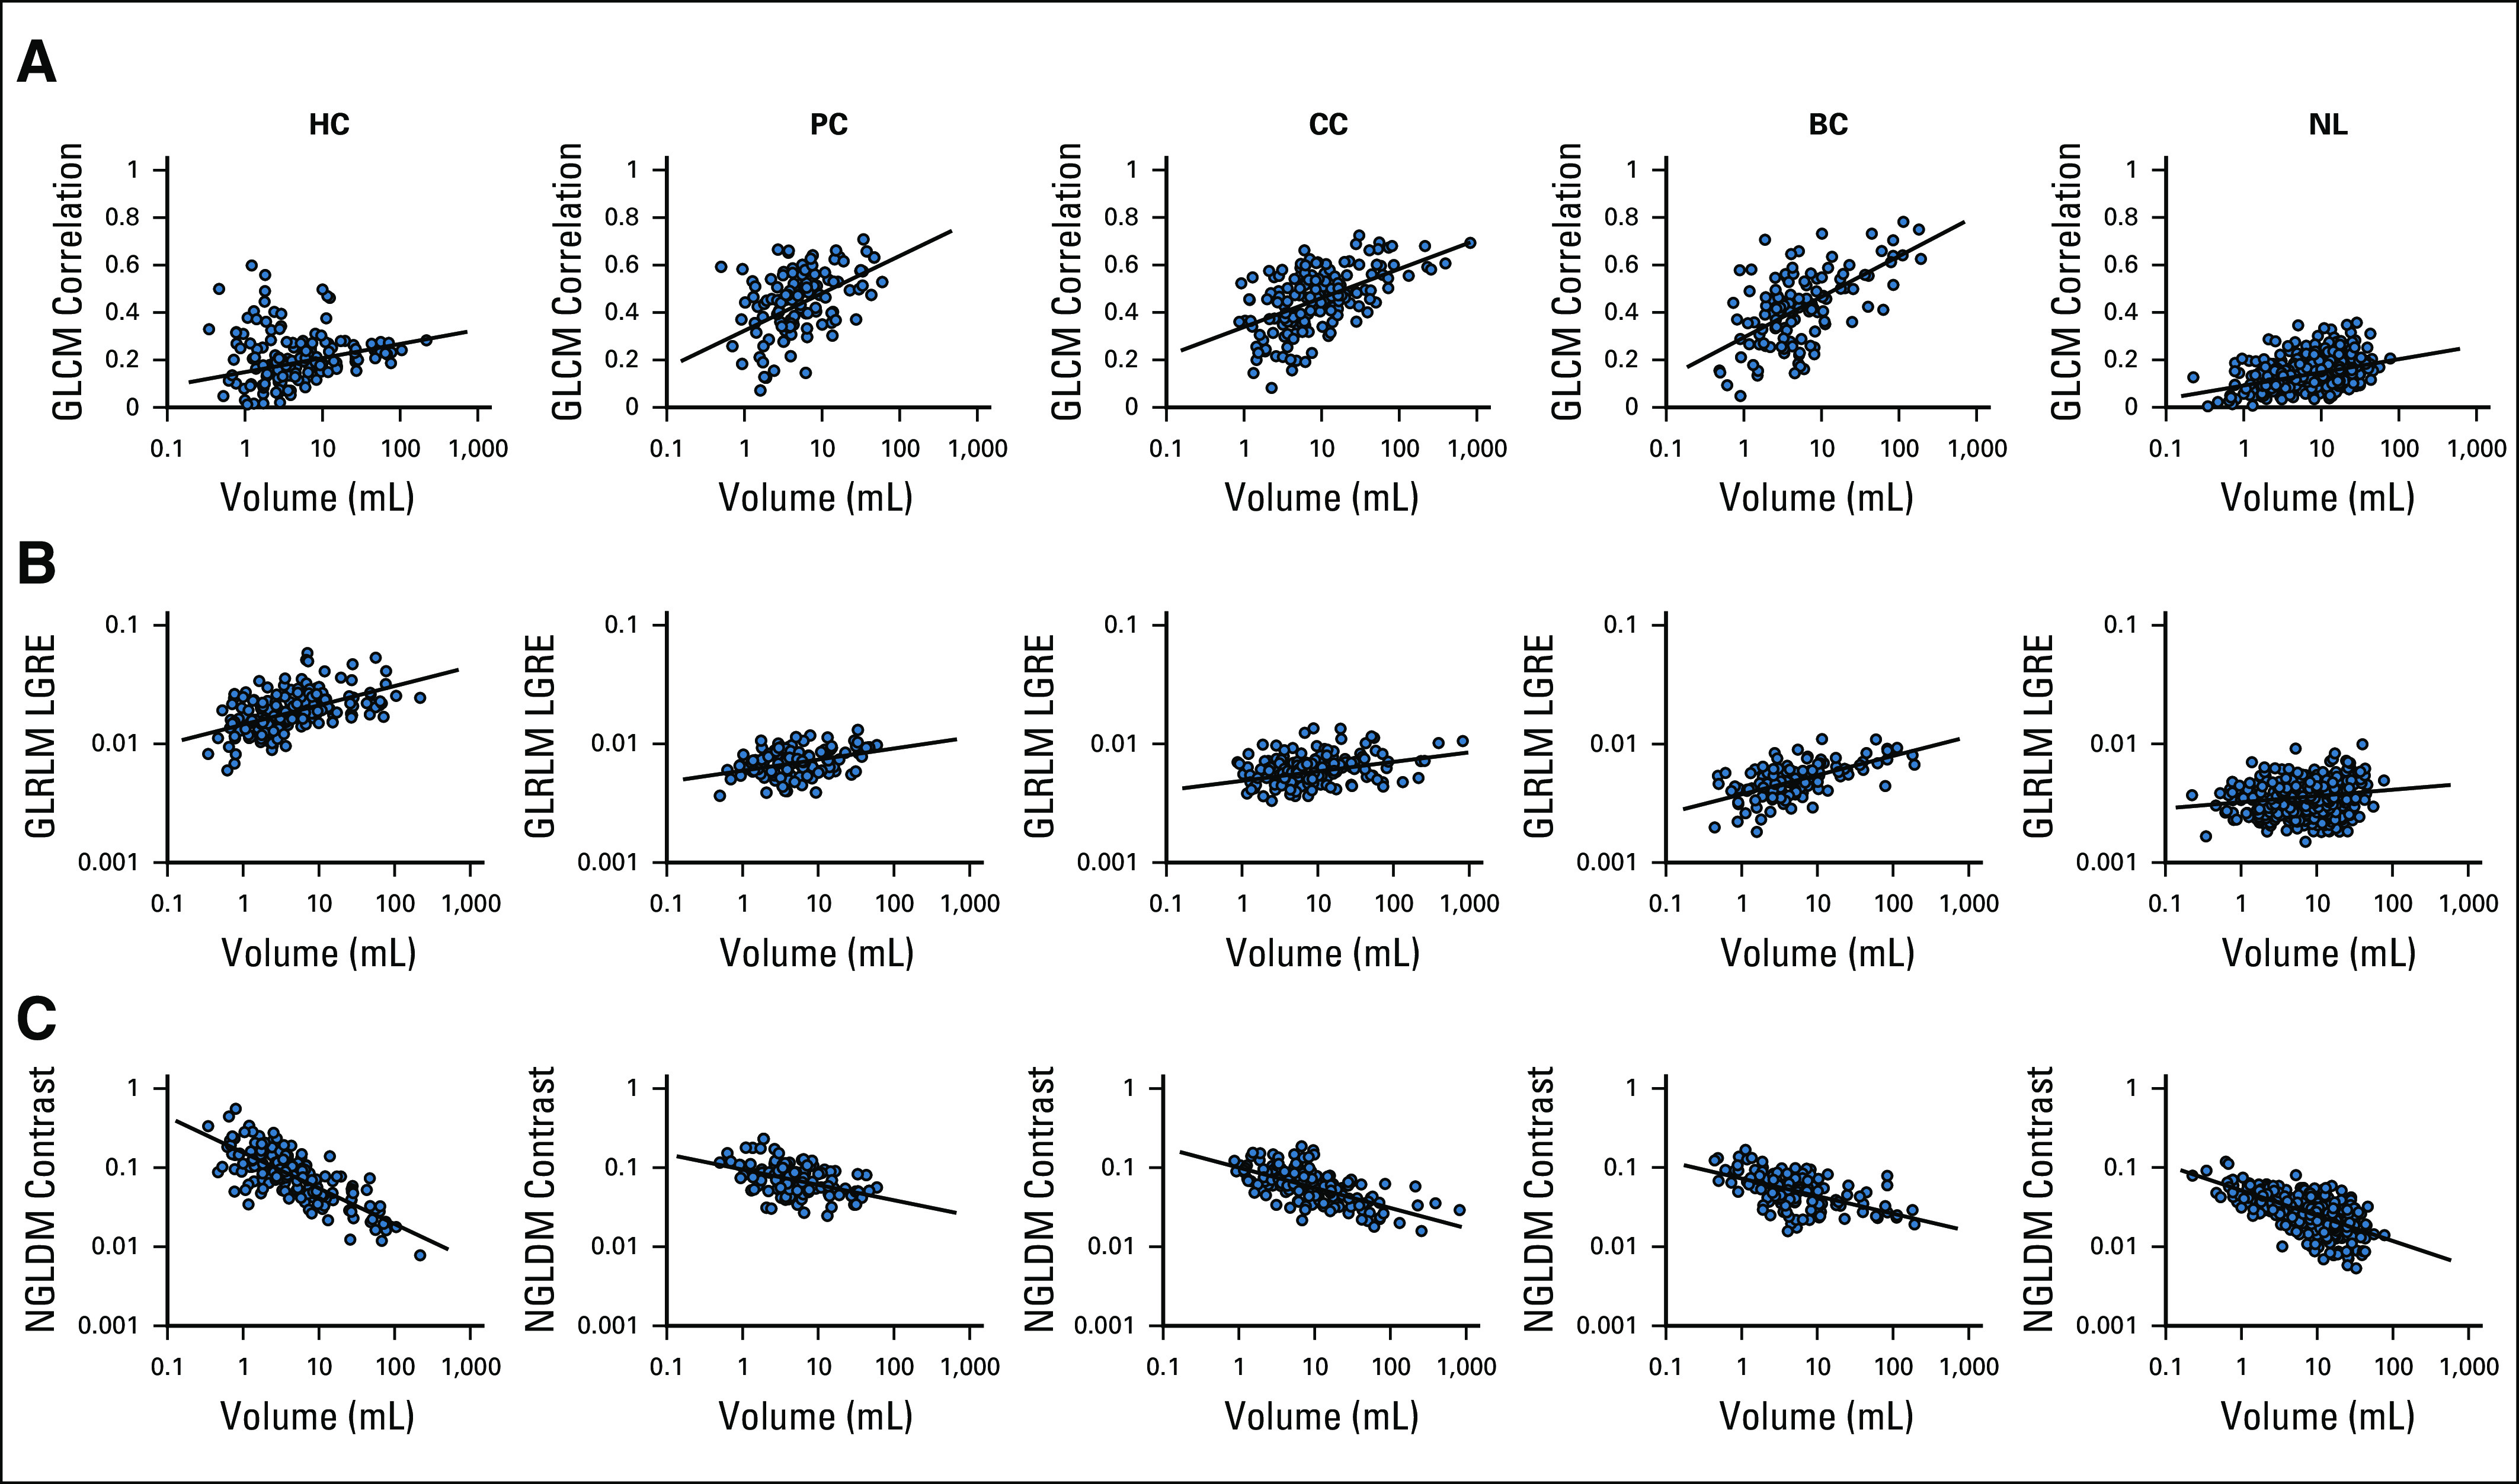
CT-based 3D radiomic features as a function of VOI's volume for hepatic metastasis from BC, CC, and PC, as well as liver cysts and normal liver: (A) GLCM correlation, (B) GLRLM LGRE, and (C) NGLDM contrast. 3D, 3-dimensional; BC, breast cancer; CC, colon cancer; GLCM, gray-level co-occurrence matrix; GLRLM, gray-level run length matrix; HC, hepatic cysts; NGLDM, neighborhood gray-level different matrix; NL, normal liver; PC, pancreatic cancer; VOI, volume of interest.
Figure 2 demonstrates the significance of the LME analysis as a heat map of P values of fixed and random effects for all radiomic features. The first two top rows of the heat map show the significance of fixed effects, the intercept and the slope, and , for the reference group. The reference group includes the liver metastasis from the BC and the Siemens Sensation 64 scanner. Following two groups of rows, the intercepts Type[.] from the group and the slopes Volume*Type[.] from the group show the significance of random effects associated with different tissue types. These random effects demonstrate a robust statistical significance across all types of lesions for almost all radiomic features. The random effects associated with the scanners, the intercepts Scanner[.] from the group and the slopes Volume*Scanner[.] from the group, also demonstrate statistical significance for various radiomic features. However, they show larger variability most likely because of a smaller number of data points in some scanner groups (Table 2). It should be mentioned here that significance of at least one of the LME parameters, the slope or the intercept, is necessary for differentiation of radiomic feature from the reference and the nonreference groups.
FIG 2.
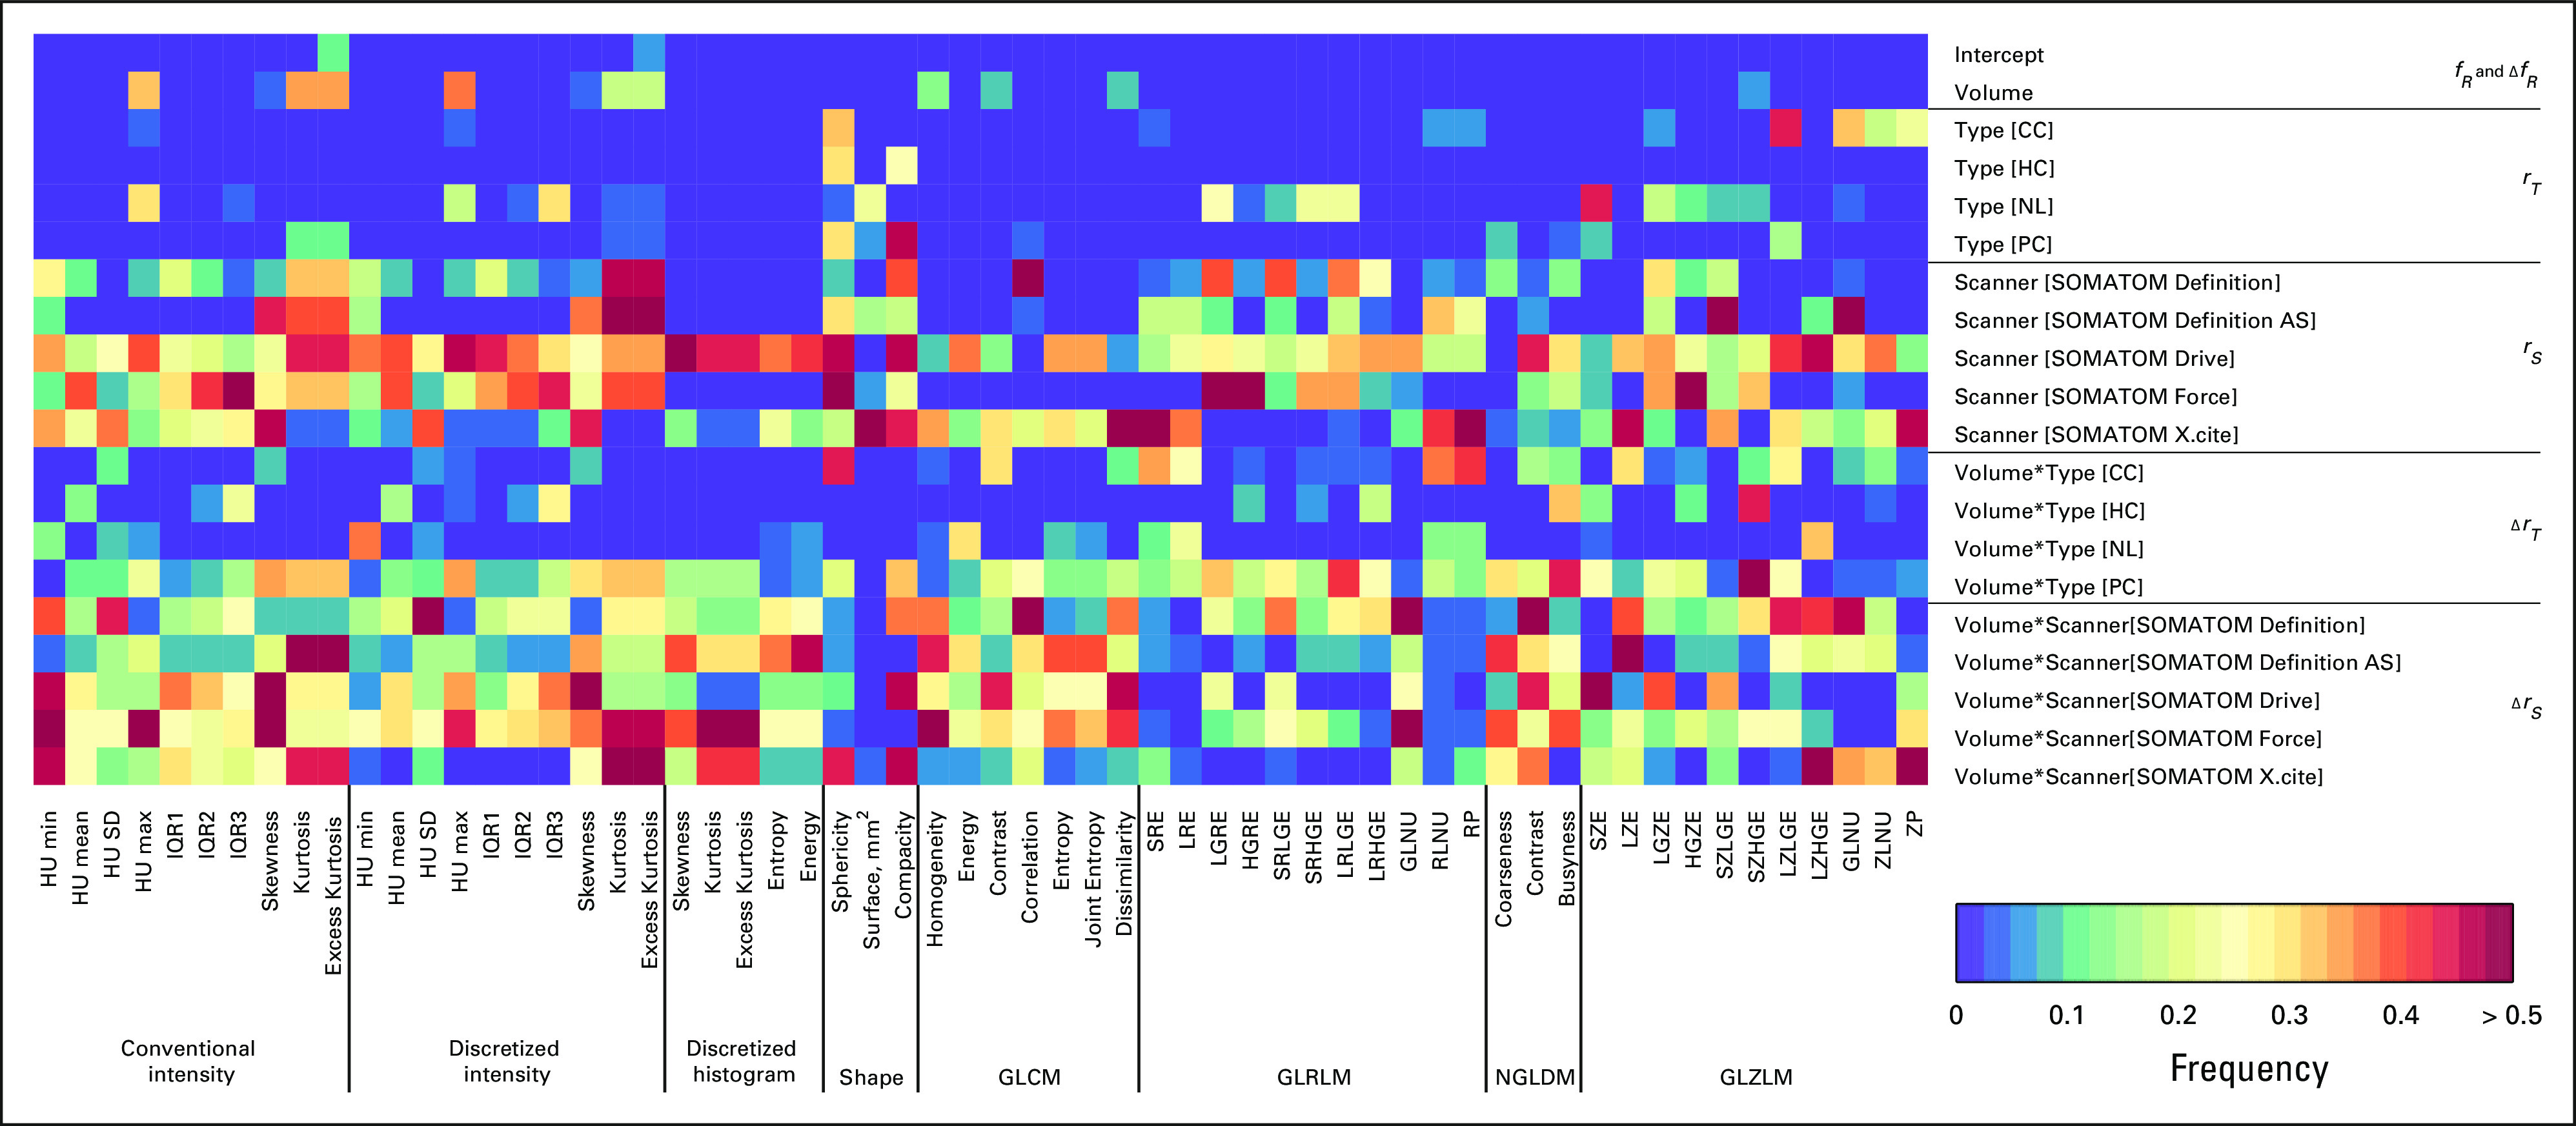
Heat map representing color-coded statistical significance of fixed and random effects in LME analysis. Rows correspond to individual components of fixed or random effects. Columns correspond to individual radiomic features. CC, colon cancer; GLCM, gray-level co-occurrence matrix; GLRLM, gray-level run length matrix; GLZLM, gray-level zone length matrix; HC, hepatic cysts; HU, Hounsfield Unit; IQR, interquartile range; LME, linear mixed-effects; NGLDM, neighborhood gray-level different matrix; NL, normal liver; PC, pancreatic cancer.
After removing random effects associated with the scanners from the nonreference group, the results of the LME regression analysis for gray level co-occurrence matrix entropy are plotted in Figure 3. After data harmonization, all lines coincide with each other and are aligned with the reference line. It is important to note that the data harmonization preserves the intrinsic association between the radiomic features and the tumor size for each cancer type. Supplemental materials include examples of LME analysis for other radiomic features.
FIG 3.
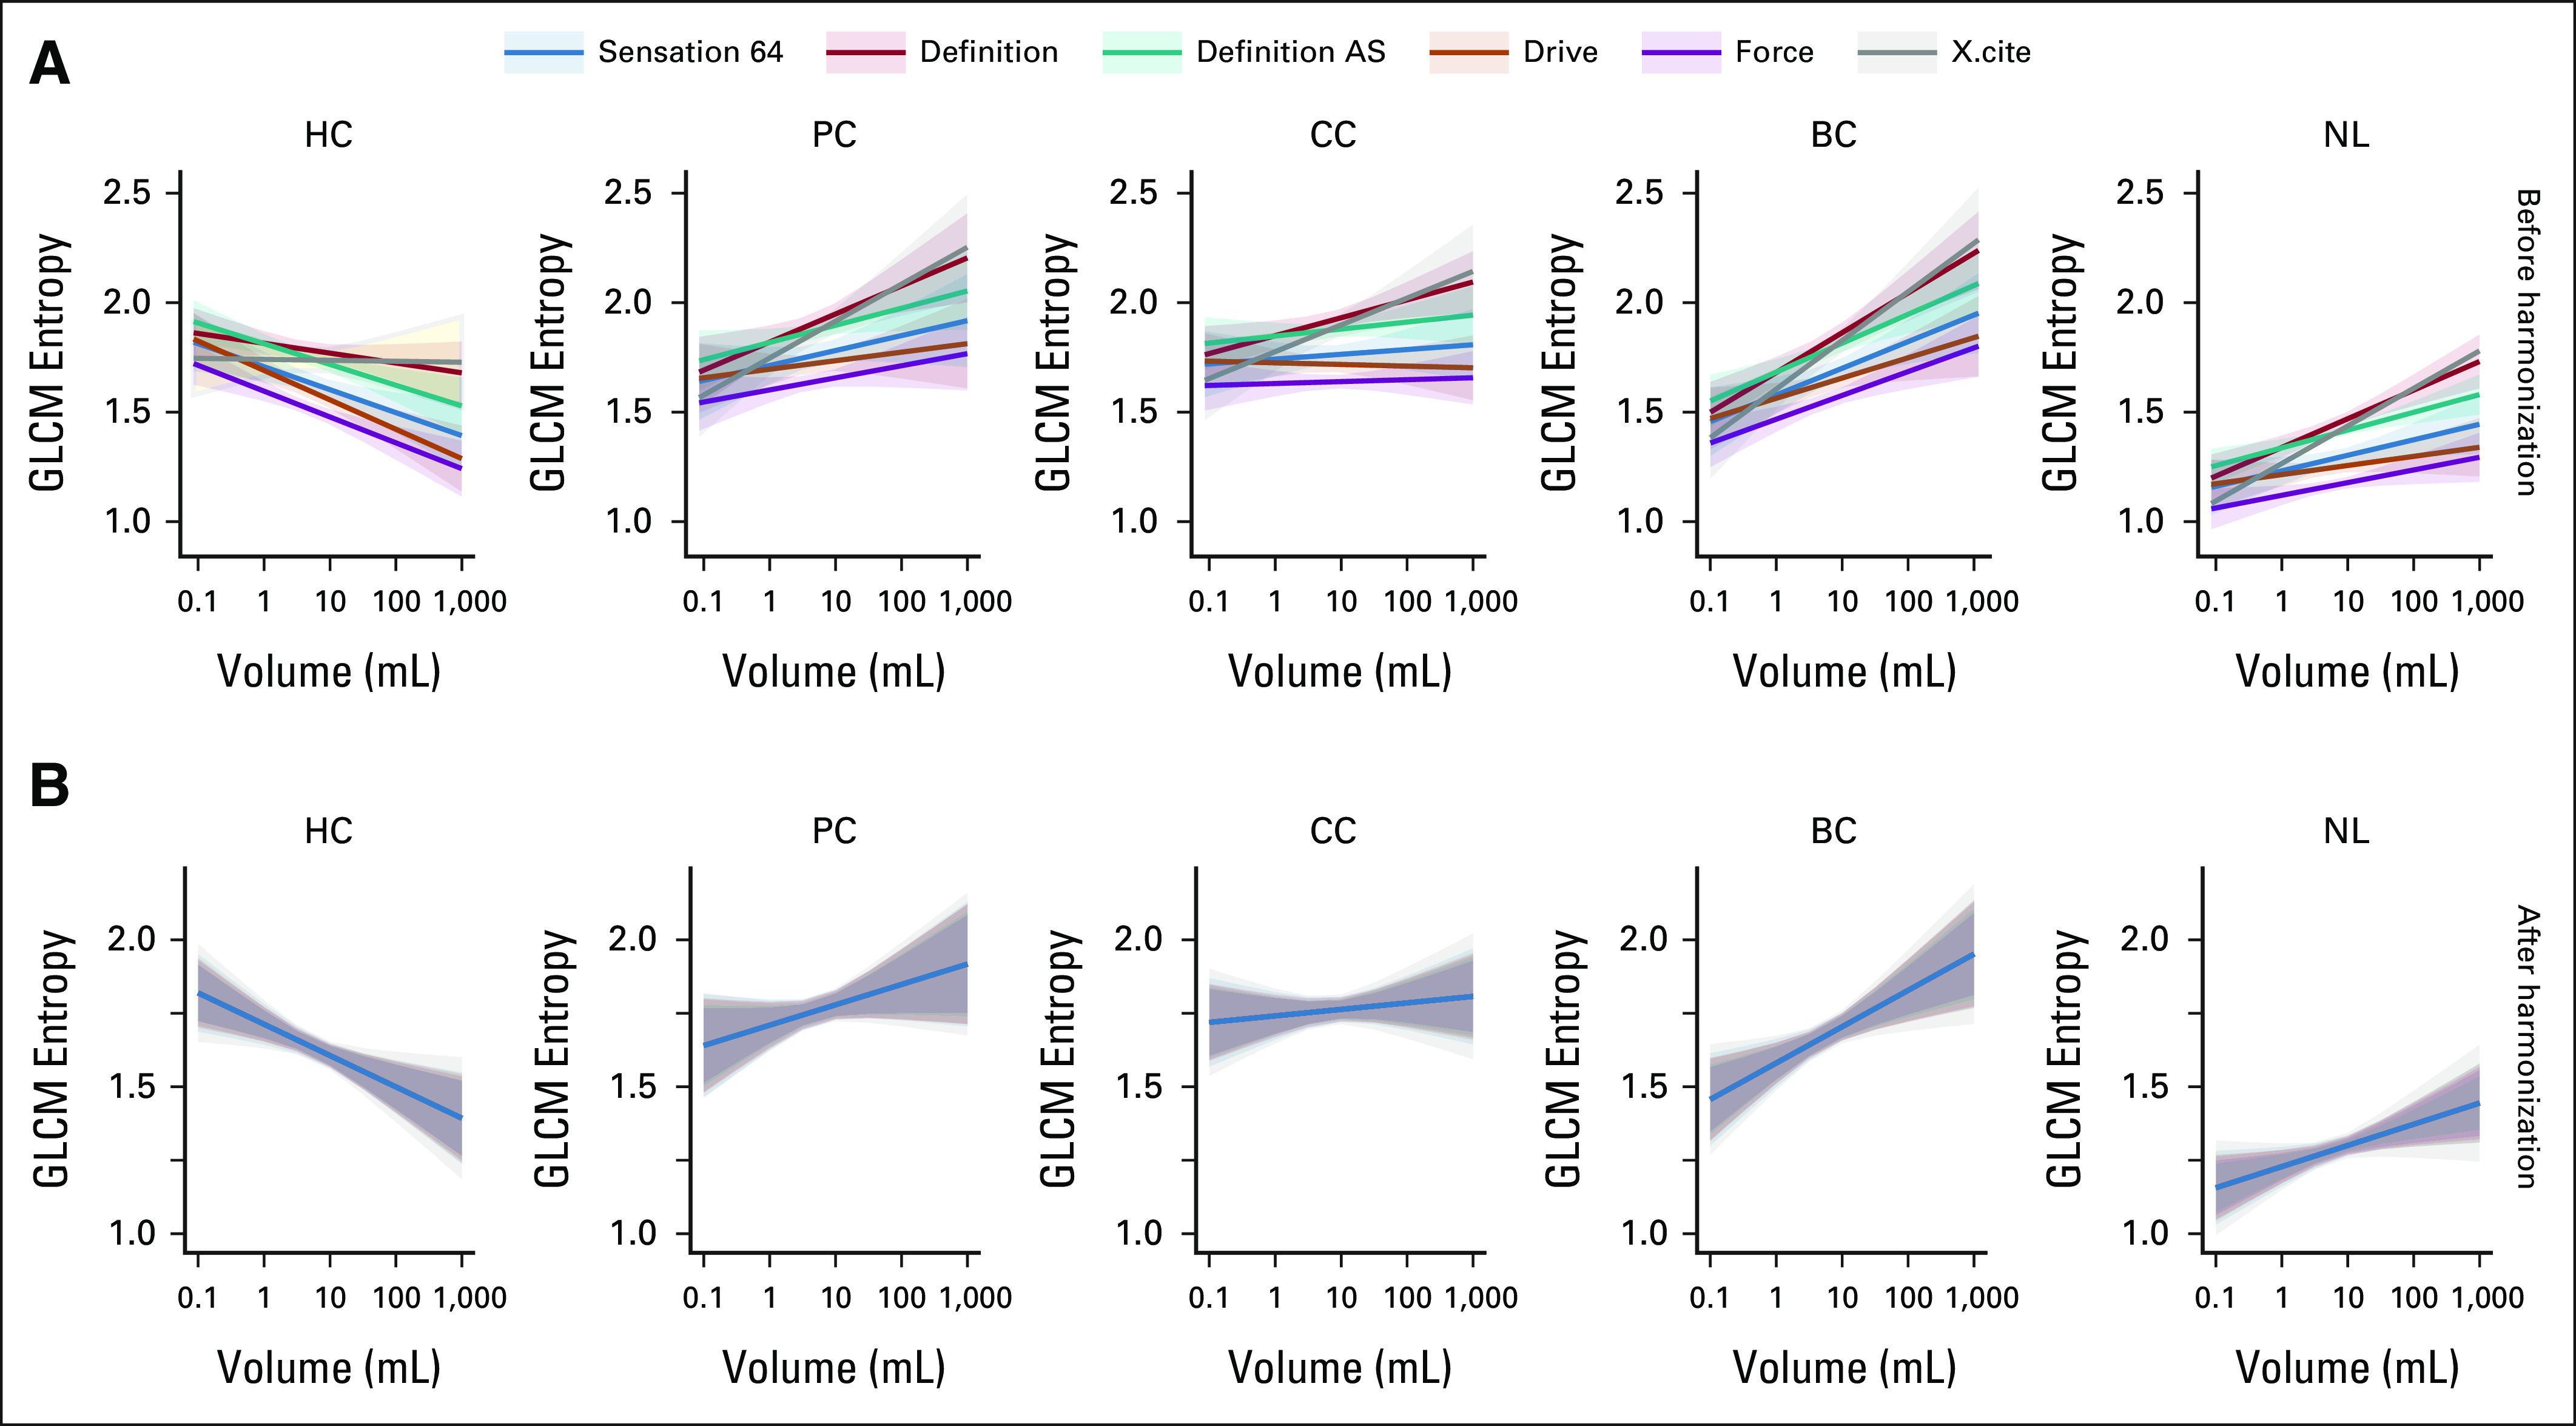
Graphical representation of LME regression analysis for GLCM entropy. Solid lines and shaded 95% CI areas are shown for each type of scanner and are colored differently. (A) and (B) The results for each type of liver lesion are combined in columns. The esults from nonharmonized and harmonized data sets are shown in rows. BC, breast cancer; CC, colon cancer; GLCM, gray level co-occurrence matrix; HC, hepatic cyst; LME, linear mixed-effects; NL, normal liver; PC, pancreatic cancer.
Principal components analysis of both nonharmonized and harmonized datasets showed all types of liver lesions visually grouped, regardless of their proximity to each other and some overlap of confidence ellipses (Appendix Fig A2). Three groups of liver metastasis were found to be arranged between the NL parenchyma and cysts. The data harmonization led to visible shrinkage of the 95% confidence ellipses. The confidence area decreased by 38% for HC, 19% for PC, 24% for CC, 44% for BC, and 30% for NL consequently. In the case of the multivariate analysis of the whole data sets, the explained variance for the first two PC components increased from 51.5% to 58.2% after data harmonization.
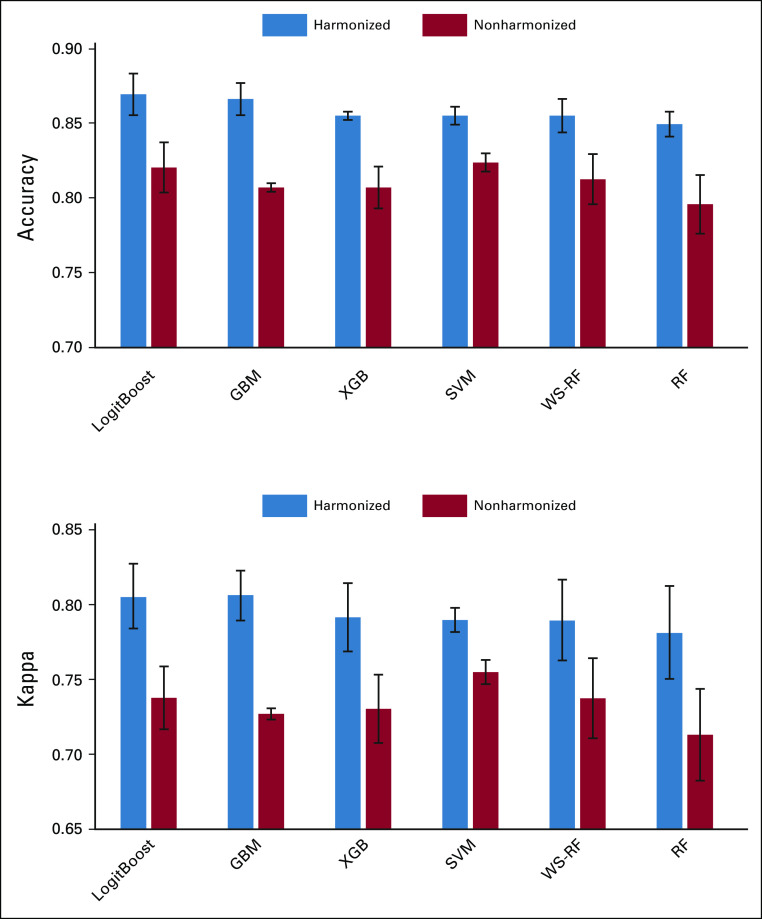
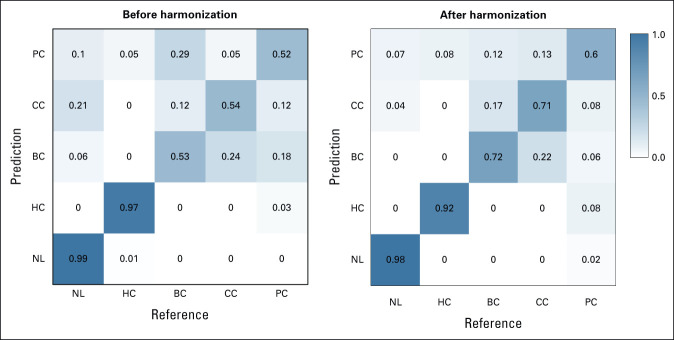
Six distinct ML models were compared to assess their performance in terms of predicting the lesion type using the original and harmonized data sets. As illustrated in Figure 4, the overall accuracy of all six models were above 0.8, and the kappa coefficient was above 0.7 for the nonharmonized data set. After data harmonization, the overall accuracy improved by additional 0.03-0.06 and the kappa coefficient by 0.04-0.08. The predictive performances of the logistic regression model, LogitBoost, demonstrated the best performance and improvements in the model performance after data harmonization. The overall accuracy before harmonization was 0.85 with 95% CI (0.8 to 0.9) and the kappa coefficient was 0.77. After data harmonization, the overall accuracy increased to 0.89 with 95% CI (0.84 to 0.93), and the kappa coefficient increased to 0.83. The confusion matrix of the LogitBoost model for predicting the lesion type in the test set is shown in Appendix Figure A3. It shows very high accuracy in differentiation of liver cysts and NL parenchyma and low performance for all types of liver metastasis using the original nonharmonized data set. Data harmonization improves the sensitivity from 0.53 to 0.75 for liver metastasis from BC, from 0.54 to 0.71 for liver metastasis from CC and from 0.52 to 0.6 for liver metastasis from PC. The confusion matrix–related metrics are shown in Appendix Table A2.
FIG 4.
The overall accuracy and the kappa coefficient for six ML models obtained from nonharmonized and harmonized data sets. GBM, Gradient Boosting; ML, machine learning; RF, Random Forest; SVM, Support Vector Machine; WS-RF, Weighted Subspace Random Forest; XGB, Extreme Gradient Boosting.
DISCUSSION
The advances in ML and artificial intelligence research have allowed the development of novel analytic methods in radiology, especially oncologic imaging.35,36 These methods can be leveraged to further improve and personalize the medical decision making. However, standardization of quantitative imaging18 and harmonization of data collected in multicenter studies are required for radiomics to advance into clinical practice and clinical trials.7
We developed and validated a novel method for radiomics data harmonization of hepatic metastasis in three common cancer types. The method uses association between tumor size and radiomic features to remove scanner effects while preserving cancer-specific functional dependence of radiomic features on tumor size. As in previous studies, we have shown that this association can be quantified by the LME model to identify the effects linked to tissue type and unique scanner parameters.32,37 We demonstrated that the regression parameters vary between different scanners. The approach evaluates the effect of each scanner in comparison with the reference scanner and harmonizes the radiomics data set by subtracting scanner associated effects. The method allows the reference scanner to be changed and the same data set to be reharmonized for a new reference scanner. This approach allows for comparison of results from different studies that use different reference scanners initially. Additionally, the proposed model uses reference tissue, for example NL parenchyma and HC in studies of liver metastasis to increase overall accuracy.
To demonstrate the effectiveness of data harmonization, we analyzed the radiomics data set of 380 liver metastases from BC, CC, and PC in addition to 551 volume-matched samples of NL and 188 HC imaged on six different scanners. Principal component analysis demonstrated shrinkage of 95% confidence ellipses in the range from 20% to 40% after data harmonization, suggesting a reduction in variability associated with different scanners. In comparative analysis of six unique ML models, we demonstrated the improvement in classification of lesion type after data harmonization. The six models were selected to show the internal validity of the data as the results converged regardless of the model used. Data harmonization improved sensitivity while maintaining high specificity reflecting the overlapping similarity of liver metastasis.
Removal of scanner effects while preserving cancer-specific functional dependence of radiomic features on the tumor size is essential for the development of radiomics-based therapy response assessment. Tumor shrinkage is considered a surrogate endpoint of chemotherapy efficacy.38,39 Development of radiomics-based models that account for changes in tumor texture associated with the tumor size could improve response assessment and potentially allow for treatment personalization. This is a future direction of this work. Our study supports some prior findings showing the association between the tumor size and radiomic features.28-30,32 However, we also found that this association may have been underestimated in other prior reports. For example, Ibrahim et al40 reported no significant correlations between the tumor volume and the majority of radiomic features. This conclusion may be explained by the fact that the Pearson coefficient is a measure of linear correlations, whereas many radiomic features exhibit nonlinear relationships with the tumor size.30,32
The Image Biomarker Standardization Initiative provides an important standardization of radiomics workflow.18 It covers image processing and feature computation steps. Incorporation of data harmonization is the next logical step that should be a research focus of at least equal importance. It requires development and independent validation of such methods as well as reassessment of reproducibility and validity of radiomic features after data harmonization step. It is important to note that the harmonization models could differ depending between imaging modalities. In contrary to CT and positron emission tomography, where the voxel intensities correspond to underlying tissue properties (radiodensity or metabolic activity defined by positron emission tomography uptake), the magnetic resonance imaging intensities do not have a specific physical meaning and vary from patient to patient and between scanners. To overcome this issue, magnetic resonance imaging intensity normalization is required before radiomics analysis.41 A rigorous examination and unbiased validation of all these models and methods is required for developing common recommendations and guidelines.
The study had several limitations. First, the sample size was relatively small because of the strict requirements of untreated pathologically proven metastatic liver disease. This study only considered liver metastases derived from breast, colon, and pancreatic cancers, which can affect model generalizations. Other types of liver tumors such as those from lung cancer, ovarian cancer, skin cancers and primary hepatocellular carcinoma should be considered to improve the model performance. In addition, the model analysis should be further expanded to other types of cancer, including primary tumors of different origin. Additionally, we differentiated scanners by model. Future studies should consider various image acquisition parameters in addition to the scanner model. Furthermore, only a single CT vendor was included in the analysis. All imaging was performed on Siemens CT scanners because of a widespread multisite presence and the strict inclusion criteria that resulted in limited search outcome for other vendors. A multicenter study including broader selection of scanner vendors and models should be performed to evaluate this limitation. The predictive ML model demonstrated moderate discrimination power most likely because of overlapping similarity of liver metastases and a small set of radiomic features. Further investigation should be performed to explore more comprehensive radiomics models including the application of wavelet filters and other image transform methods. All these limitations should be considered when interpreting our results.
In summary, a novel radiomics model was developed that removed scanner-associated effects while preserving cancer-specific functional dependence of radiomic features on the tumor size.
APPENDIX 1. Image Processing and Machine Learning
Tumor Image Segmentation
Liver metastases generally occur in noncirrhotic liver and develop varying degrees of hepatic arterial blood supply. Rim enhancement appears in hypervascular and hypovascular metastases with a frequency varying from cancer to cancer. RECIST 1.1 guidelines recommends the inclusion of the rim in tumor measurements. On the other hand, hepatocellular carcinoma occurs most often in people with chronic liver diseases. Hepatocellular carcinoma shows typical hypervascular patterns, with clear-cut enhancement in the predominantly arterial phase and rapid washout in the portal venous phase. Development of a multicancer model requires an approach that considers properties of tumors from different cancers. In our study, a range of 2-3 mm of perilesional rim was included in the volume of interest of all lesions.
Radiomics of perilesional rim or cirrhotic liver is another important topic of research that requires a separate study. The presence of cirrhotic liver parenchyma surrounding the tumor requires a parallel analysis of the tumor and tumor surrounding perilesional space. This approach was successfully employed in lung cancer radiomics studies.42 Therefore, it could be beneficial for radiomics analysis of liver metastasis.
Image Processing and Radiomics Parameters
Spatial resampling of images was set to a voxel size of 1 × 1 × 5 mm3.
The absolute gray-level discretization was performed within the volume of interest in the range of intensity values varying from –50 Hounsfield Unit (HU) to 300 HU using a fixed number of bins equal to 64 and a fixed bin size equal to 10 HU.
3-dimensional radiomic features from the intensity-based statistics, intensity histogram, discretized intensity statistics, discretized intensity histogram, gray-level co-occurrence matrix, gray-level run length matrix, neighborhood gray-level different matrix, and gray-level zone size matrix classes were calculated.
Linear Mixed-Effects Model
To use a linear regression analysis, first, we examined the associations between the radiomic features and the tumor volume by using five fitting models: linear, logarithmic, inverse, power, and exponential.32 The coefficient of determination, R-squared, was used to evaluate goodness of fit. The best fitting model for each feature was selected on the basis of the highest R-squared and passing the normality test of residuals. For each feature, a transformation corresponding to the best fitting model was applied to perform a linear regression analysis. The contribution of all fixed and random factors and interaction effects were tested for significance.
Machine Learning Workflow
The radiomics data set was partitioned into a training set (80%) and a test set (20%). Five-fold cross-validation repeated five times was used to estimate the model performance. Comparison of the predicted and actual lesion types was determined by creating a confusion matrix. The overall accuracy and the Cohen's kappa statistic were averaged over cross-validation iterations.
Data Harmonization and Data Protection
Many challenges in the field of data protection and privacy arise from the rapid pace of technological developments. Collaborative data sharing models have a great potential for the development of new models. Openly available anonymized imaging data sets that include segmentation masks and clinical and genetic data allow a quick testing and comparison of results between different models. For example, the National Cancer Institute supported The Cancer Imaging Archive (TCIA) plays a big role in early research including testing and validation of new models. On the other hand, Federated Learning approach enables secured and privacy-preserving cross-institutional research. It could be difficult to use it in early research settings. However, it is the most optimal strategy for large multicenter studies and clinical trials.
Software
A robust linear mixed-effects model was used to minimize outlier effects by using the robustlmm package from the open statistical computing environment R version 4.0.3.43
Machine learning classifications models were developed using Caret (version 6.0-79) R-package.44
A P value < .05 was considered statistically significant.
TABLE A1.
Radiomics Data Transformation Model and the R-Square Change

TABLE A2.
The Confusion Matrix-Related Statistical Metrics
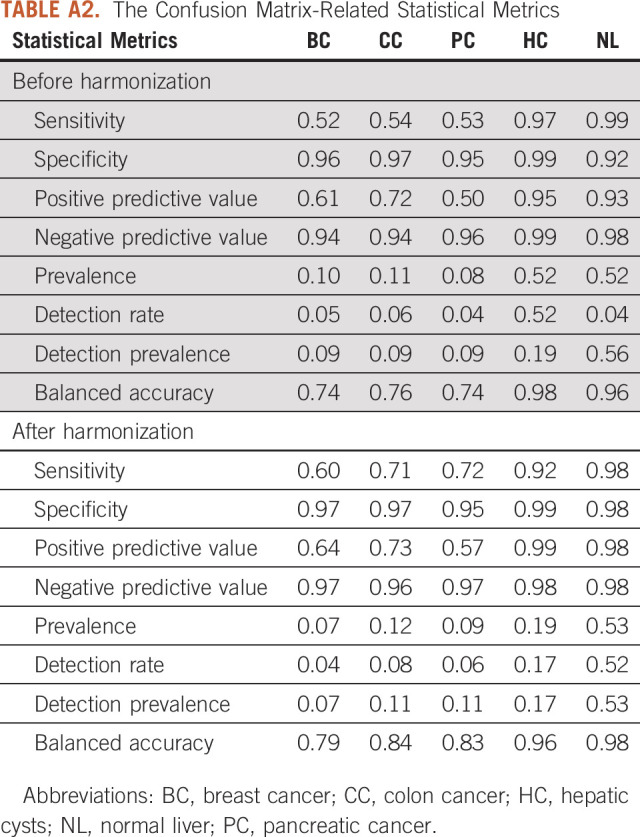
FIG A1.
Flowchart outlining the protocol adopted in this systematic review on the basis of the Preferred Reporting Items for Systematic Reviews and Meta-Analyses three-phase flow diagram. Search was conducted in three main areas: data harmonization, tumor radiomics, and tumor classification.
FIG A2.
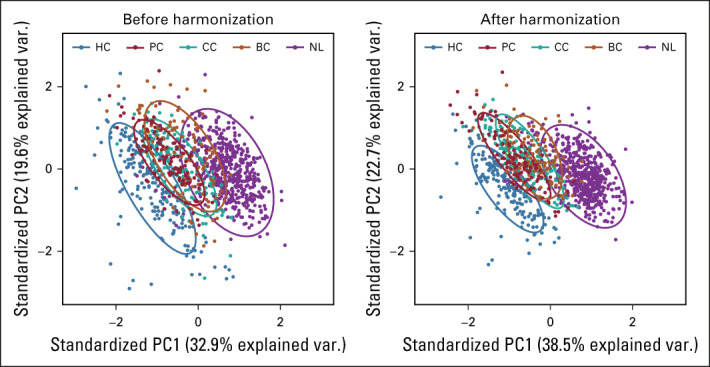
PCA and summary distribution in metastatic liver disease scatter plots of top two principal components of the radiomic features across the two labels (clusters) using untransformed data or data transformed. BC, breast cancer; CC, colon cancer; HC, hepatic cysts; NL, normal liver; PC, pancreatic cancer; PCA, principal component analysis.
FIG A3.
The confusion matrix of the Logit Boost model was obtained in the test set that had a total of 204 records, of which 14 were from BC, 23 from CC, 35 from HC, 109 from NL, and 23 were from PC. BC, breast cancer; CC, colon cancer; HC, hepatic cysts; NL, normal liver; PC, pancreatic cancer.
Linda C. Kelahan
Research Funding: Canon Medical System
Rishi Agrawal
Speakers' Bureau: Boehringer Ingelheim
Ryan J. Avery
Honoraria: Invicro
Benjamin Liu
Research Funding: Bayer (Inst)
Young K. Chae
Consulting or Advisory Role: Foundation Medicine, Boehringer Ingelheim, Biodesix, Counsyl, AstraZeneca, Guardant Health, Takeda, Roche/Genentech, Immuneoncia, Hanmi, Lilly, Tempus, Lunit
Speakers' Bureau: Genentech/Roche, Merck, AstraZeneca, Lilly, Jazz Pharmaceuticals, G1 Therapeutics
Research Funding: AbbVie, Bristol Myers Squibb, Lexent Bio, Freenome, Biodesix
Travel, Accommodations, Expenses: Hanmi
Riad Salem
Consulting or Advisory Role: Eisai, Bard Medical, Cook Medical, Boston Scientific, Sirtex Medical, AstraZeneca, QED Therapeutics, Genentech/Roche, Siemens
Research Funding: Boston Scientific (Inst)
Al B. Benson
Consulting or Advisory Role: Merck Sharp & Dohme, Array BioPharma, Bristol Myers Squibb, Samsung Bioepis, Pfizer, HalioDx, AbbVie, Janssen Oncology, Natera, Apexigen, Artemida Pharma, Xencor, Therabionic, Mirati Therapeutics, Boston Scientific, Hutchmed
Research Funding: Infinity Pharmaceuticals (Inst), Merck Sharp & Dohme (Inst), Taiho Pharmaceutical (Inst), Bristol Myers Squibb (Inst), Celgene (Inst), Rafael Pharmaceuticals (Inst), MedImmune (Inst), Xencor (Inst), Astellas Pharma (Inst), Amgen (Inst), SynCoreBio (Inst), Elevar Therapeutics (Inst), Tyme Inc (Inst), st pharm (Inst), ITM Solucin (Inst)
No other potential conflicts of interest were reported.
AUTHOR CONTRIBUTIONS
Conception and design: Moataz A.S. Soliman, Michael Magnetta, Hatice Savas, Ryan J. Avery, Vahid Yaghmai, Yuri S. Velichko
Provision of study materials or patients: Young K. Chae, Yuri S. Velichko
Collection and assembly of data: Moataz A.S. Soliman, Ryan J. Avery, Yue Xue, Yuri S. Velichko
Data analysis and interpretation: Moataz A.S. Soliman, Linda C. Kelahan, Michael Magnetta, Rishi Agrawal, Ryan J. Avery, Pascale Aouad, Benjamin Liu, Young K. Chae, Riad Salem, Al B. Benson, Yuri S. Velichko
Manuscript writing: All authors
Final approval of manuscript: All authors
Accountable for all aspects of the work: All authors
AUTHORS' DISCLOSURES OF POTENTIAL CONFLICTS OF INTEREST
The following represents disclosure information provided by authors of this manuscript. All relationships are considered compensated unless otherwise noted. Relationships are self-held unless noted. I = Immediate Family Member, Inst = My Institution. Relationships may not relate to the subject matter of this manuscript. For more information about ASCO's conflict of interest policy, please refer to www.asco.org/rwc or ascopubs.org/cci/author-center.
Open Payments is a public database containing information reported by companies about payments made to US-licensed physicians (Open Payments).
Linda C. Kelahan
Research Funding: Canon Medical System
Rishi Agrawal
Speakers' Bureau: Boehringer Ingelheim
Ryan J. Avery
Honoraria: Invicro
Benjamin Liu
Research Funding: Bayer (Inst)
Young K. Chae
Consulting or Advisory Role: Foundation Medicine, Boehringer Ingelheim, Biodesix, Counsyl, AstraZeneca, Guardant Health, Takeda, Roche/Genentech, Immuneoncia, Hanmi, Lilly, Tempus, Lunit
Speakers' Bureau: Genentech/Roche, Merck, AstraZeneca, Lilly, Jazz Pharmaceuticals, G1 Therapeutics
Research Funding: AbbVie, Bristol Myers Squibb, Lexent Bio, Freenome, Biodesix
Travel, Accommodations, Expenses: Hanmi
Riad Salem
Consulting or Advisory Role: Eisai, Bard Medical, Cook Medical, Boston Scientific, Sirtex Medical, AstraZeneca, QED Therapeutics, Genentech/Roche, Siemens
Research Funding: Boston Scientific (Inst)
Al B. Benson
Consulting or Advisory Role: Merck Sharp & Dohme, Array BioPharma, Bristol Myers Squibb, Samsung Bioepis, Pfizer, HalioDx, AbbVie, Janssen Oncology, Natera, Apexigen, Artemida Pharma, Xencor, Therabionic, Mirati Therapeutics, Boston Scientific, Hutchmed
Research Funding: Infinity Pharmaceuticals (Inst), Merck Sharp & Dohme (Inst), Taiho Pharmaceutical (Inst), Bristol Myers Squibb (Inst), Celgene (Inst), Rafael Pharmaceuticals (Inst), MedImmune (Inst), Xencor (Inst), Astellas Pharma (Inst), Amgen (Inst), SynCoreBio (Inst), Elevar Therapeutics (Inst), Tyme Inc (Inst), st pharm (Inst), ITM Solucin (Inst)
No other potential conflicts of interest were reported.
REFERENCES
- 1.Van de Velde C, Sugarbaker PH: Liver Metastasis: Basic Aspects, Detection and Management. Dordrecht, the Netherlands, Springer Netherlands, 2012 [Google Scholar]
- 2.Benson AB, Venook AP, Al-Hawary MM, et al. : Colon cancer, version 2.2021, NCCN clinical practice guidelines in oncology. J Natl Compr Canc Netw 19:329-359, 2021 [DOI] [PubMed] [Google Scholar]
- 3.Ghosh D, Mastej E, Jain R, et al. : Causal inference in radiomics: Framework, mechanisms, and algorithms. Front Neurosci 16:884708, 2022 [DOI] [PMC free article] [PubMed] [Google Scholar]
- 4.Kumar V, Gu Y, Basu S, et al. : Radiomics: The process and the challenges. Magn Reson Imaging 30:1234-1248, 2012 [DOI] [PMC free article] [PubMed] [Google Scholar]
- 5.Lambin P, Rios-Velazquez E, Leijenaar R, et al. : Radiomics: Extracting more information from medical images using advanced feature analysis. Eur J Cancer 48:441-446, 2012 [DOI] [PMC free article] [PubMed] [Google Scholar]
- 6.Tomaszewski MR, Gillies RJ: The biological meaning of radiomic features. Radiology 298:505-516, 2021 [DOI] [PMC free article] [PubMed] [Google Scholar]
- 7.Lambin P, Leijenaar RTH, Deist TM, et al. : Radiomics: The bridge between medical imaging and personalized medicine. Nat Rev Clin Oncol 14:749-762, 2017 [DOI] [PubMed] [Google Scholar]
- 8.Aerts HJWL: The potential of radiomic-based phenotyping in precision medicine: A review. JAMA Oncol 2:1636-1642, 2016 [DOI] [PubMed] [Google Scholar]
- 9.Gillies RJ, Schabath MB: Radiomics improves cancer screening and early detection. Cancer Epidemiol Prev Biomarkers 29:2556-2567, 2020 [DOI] [PMC free article] [PubMed] [Google Scholar]
- 10.Borhani AA, Catania R, Velichko YS, et al. : Radiomics of hepatocellular carcinoma: Promising roles in patient selection, prediction, and assessment of treatment response. Abdom Radiol (NY) 46:3674-3685, 2021 [DOI] [PubMed] [Google Scholar]
- 11.Papadimitroulas P, Brocki L, Christopher Chung N, et al. : Artificial intelligence: Deep learning in oncological radiomics and challenges of interpretability and data harmonization. Phys Med 83:108-121, 2021 [DOI] [PubMed] [Google Scholar]
- 12.Limkin EJ, Sun R, Dercle L, et al. : Promises and challenges for the implementation of computational medical imaging (radiomics) in oncology. Ann Oncol 28:1191-1206, 2017 [DOI] [PubMed] [Google Scholar]
- 13.Mackin D, Fave X, Zhang L, et al. : Measuring computed tomography scanner variability of radiomics features. Invest Radiol 50:757-765, 2015 [DOI] [PMC free article] [PubMed] [Google Scholar]
- 14.Lu L, Ehmke RC, Schwartz LH, et al. : Assessing agreement between radiomic features computed for multiple CT imaging settings. PLoS One 11:e0166550, 2016 [DOI] [PMC free article] [PubMed] [Google Scholar]
- 15.Berenguer R, Pastor-Juan MDR, Canales-Vázquez J, et al. : Radiomics of CT features may Be nonreproducible and redundant: Influence of CT acquisition parameters. Radiology 288:407-415, 2018 [DOI] [PubMed] [Google Scholar]
- 16.Fave X, Zhang L, Yang J, et al. : Impact of image preprocessing on the volume dependence and prognostic potential of radiomics features in non-small cell lung cancer. Transl Cancer Res 5:349-363, 2016 [Google Scholar]
- 17.Welch ML, McIntosh C, Haibe-Kains B, et al. : Vulnerabilities of radiomic signature development: The need for safeguards. Radiother Oncol 130:2-9, 2019 [DOI] [PubMed] [Google Scholar]
- 18.Zwanenburg A, Vallières M, Abdalah MA, et al. : The image biomarker standardization initiative: Standardized quantitative radiomics for high-throughput image-based phenotyping. Radiology 295:328-338, 2020 [DOI] [PMC free article] [PubMed] [Google Scholar]
- 19.Muehlematter UJ, Daniore P, Vokinger KN: Approval of artificial intelligence and machine learning-based medical devices in the USA and Europe (2015–20): A comparative analysis. Lancet Digital Health 3:e195-e203, 2021 [DOI] [PubMed] [Google Scholar]
- 20.Mali SA, Ibrahim A, Woodruff HC, et al. : Making radiomics more reproducible across scanner and imaging protocol variations: A review of harmonization methods. J Pers Med 11:842, 2021 [DOI] [PMC free article] [PubMed] [Google Scholar]
- 21.Morgan B: Opportunities and pitfalls of cancer imaging in clinical trials. Nat Rev Clin Oncol 8:517-527, 2011 [DOI] [PubMed] [Google Scholar]
- 22.Johnson WE, Li C, Rabinovic A: Adjusting batch effects in microarray expression data using empirical Bayes methods. Biostatistics 8:118-127, 2007 [DOI] [PubMed] [Google Scholar]
- 23.Orlhac F, Boughdad S, Philippe C, et al. : A postreconstruction harmonization method for multicenter radiomic studies in PET. J Nucl Med 59:1321-1328, 2018 [DOI] [PubMed] [Google Scholar]
- 24.Da-ano R, Masson I, Lucia F, et al. : Performance comparison of modified ComBat for harmonization of radiomic features for multicenter studies. Sci Rep 10:10248, 2020 [DOI] [PMC free article] [PubMed] [Google Scholar]
- 25.Li Y, Ammari S, Balleyguier C, et al. : Impact of preprocessing and harmonization methods on the removal of scanner effects in brain MRI radiomic features. Cancers (Basel) 13:3000, 2021 [DOI] [PMC free article] [PubMed] [Google Scholar]
- 26.Ibrahim A, Refaee T, Primakov S, et al. : The effects of in-plane spatial resolution on CT-based radiomic features’ stability with and without ComBat harmonization. Cancers 13:1848, 2021 [DOI] [PMC free article] [PubMed] [Google Scholar]
- 27.Orlhac F, Soussan M, Maisonobe J-A, et al. : Tumor texture analysis in 18F-FDG PET: Relationships between texture parameters, histogram indices, standardized uptake values, metabolic volumes, and total lesion glycolysis. J Nucl Med 55:414-422, 2014 [DOI] [PubMed] [Google Scholar]
- 28.Hatt M, Majdoub M, Vallières M, et al. : 18F-FDG PET uptake characterization through texture analysis: Investigating the complementary nature of heterogeneity and functional tumor volume in a multi–cancer site patient cohort. J Nucl Med 56:38-44, 2015 [DOI] [PubMed] [Google Scholar]
- 29.Dercle L, Ammari S, Bateson M, et al. : Limits of radiomic-based entropy as a surrogate of tumor heterogeneity: ROI-area, acquisition protocol and tissue site exert substantial influence. Sci Rep 7:7952, 2017 [DOI] [PMC free article] [PubMed] [Google Scholar]
- 30.Shafiq-Ul-Hassan M, Zhang GG, Latifi K, et al. : Intrinsic dependencies of CT radiomic features on voxel size and number of gray levels. Med Phys 44:1050-1062, 2017 [DOI] [PMC free article] [PubMed] [Google Scholar]
- 31.Shafiq-ul-Hassan M, Latifi K, Zhang G, et al. : Voxel size and gray level normalization of CT radiomic features in lung cancer. Sci Rep 8:10545, 2018 [DOI] [PMC free article] [PubMed] [Google Scholar]
- 32.Velichko YS, Mozafarykhamseh A, Trabzonlu TA, et al. : Association between the size and 3D CT-based radiomic features of breast cancer hepatic metastasis. Acad Radiol 28:e93-e100, 2021 [DOI] [PMC free article] [PubMed] [Google Scholar]
- 33.Nioche C, Orlhac F, Boughdad S, et al. : A freeware for tumor heterogeneity characterization in PET, SPECT, CT, MRI and US to accelerate advances in radiomics. J Nucl Med 58:1316, 2017 [Google Scholar]
- 34.Fox J: Applied Regression Analysis and Generalized Linear Models. Thousand Oaks, CA, Sage Publications, 2015 [Google Scholar]
- 35.Rajpurkar P, Chen E, Banerjee O, et al. : AI in health and medicine. Nat Med 28:31-38, 2022 [DOI] [PubMed] [Google Scholar]
- 36.Geady C, Keller H, Siddiqui I, et al. : Bridging the gap between micro- and macro-scales in medical imaging with textural analysis—A biological basis for CT radiomics classifiers? Phys Med 72:142-151, 2020 [DOI] [PubMed] [Google Scholar]
- 37.Ger RB, Zhou S, Chi P-CM, et al. : Comprehensive investigation on controlling for CT imaging variabilities in radiomics studies. Sci Rep 8:13047, 2018 [DOI] [PMC free article] [PubMed] [Google Scholar]
- 38.Eisenhauer EA, Therasse P, Bogaerts J, et al. : New response evaluation criteria in solid tumours: Revised RECIST guideline (version 1.1). Eur J Cancer 45:228-247, 2009 [DOI] [PubMed] [Google Scholar]
- 39.Therasse P, Arbuck SG, Eisenhauer EA, et al. : New guidelines to evaluate the response to treatment in solid tumors. J Natl Cancer Inst 92:205-216, 2000 [DOI] [PubMed] [Google Scholar]
- 40.Ibrahim A, Widaatalla Y, Refaee T, et al. : Reproducibility of CT-based hepatocellular carcinoma radiomic features across different contrast imaging phases: A proof of concept on SORAMIC trial data. Cancers (Basel) 13:4638, 2021 [DOI] [PMC free article] [PubMed] [Google Scholar]
- 41.Isaksson LJ, Raimondi S, Botta F, et al. : Effects of MRI image normalization techniques in prostate cancer radiomics. Phys Med 71:7-13, 2020 [DOI] [PubMed] [Google Scholar]
- 42.Dou TH, Coroller TP, van Griethuysen JJM, et al. : Peritumoral radiomics features predict distant metastasis in locally advanced NSCLC. PloS One 13:e0206108, 2018 [DOI] [PMC free article] [PubMed] [Google Scholar]
- 43.Koller M: robustlmm: An R package for robust estimation of linear mixed-effects models. J Stat Soft 75:1-24, 2016 [Google Scholar]
- 44.Kuhn M, Wing J, Weston S, et al. : Package “caret.” 2020, https://cran.r-project.org/web/packages/caret/


