

Abstract
Bioprinting-associated shear stress and hydrostatic pressure can negatively affect the functionality of dispensed cells. We hypothesized that these mechanical stimuli can potentially affect the angiogenic potential of human umbilical vein endothelial cells (HUVECs). A numerical simulation model was used to calculate the shear stress during microvalve-based droplet ejection. The impact of different levels of applied pressure and the resulting shear stress levels on the angiogenic potential of HUVECs was investigated after up to 14 days of cultivation. In vitro results showed that bioprinting-associated stress not only has short-term but also long-term effects. The short-term viability results indicate a 20% loss in post-printing cell viability in samples printed under the harshest conditions compared to those with the lowest shear stress level. Further, it was revealed that even in two-dimensional culture, HUVECs were able to form a capillary-like network organization regardless of bioprinting pressure. In three-dimensional culture experiments; however, the HUVECs printed at 3 bar were not able to form tubular structures due to their exposure to high shear stress levels. In conclusion, this study provides new insights into how the bioprinting process should be conducted to control printing-associated shear stress and hydrostatic pressure to preserve the functionality and angiogenetic potential of HUVEC.
Keywords: Bioprinting, Shear stress, Hydrostatic pressure, Fluid-dynamic finite element analysis, Angiogenesis
1. Introduction
The application of additive manufacturing techniques in the field of tissue engineering enables the build-up of geometrically complex, three-dimensional (3D) cell-laden structures that can be matured into functional tissues[1,2]. However, due to the limited diffusion range within the hydrogel used in this process, it is essential to ensure nutrient and oxygen supply within such printed structures. The ability of some cell types to self-assemble into capillary-like network structures before implantation holds great promise as an essential step toward a fully bioprinted and pre-vascularized tissue replacement[3-5]. As previously reported, the formation of capillary-like cell structures can be achieved in a co-culture of human umbilical vein endothelial cells (HUVECs) and a supporting cell type such as human mesenchymal stromal cells (hMSCs) or human dermal fibroblasts[6,7]. High concentrations of viable and functional cells are among the main prerequisites for successful formation of such tubular structures, which represent the first step in the formation of a biofunctional vasculature in vitro. It is, therefore, essential to determine the set of bioprinting parameters that will avoid a critical drop in post-printing cell viability, as well as long-term negative effects on functionality and angiogenic potential.
Various bioprinting techniques have previously been described, such as micro-extrusion and drop-on-demand (DoD), that differ in various aspects such as printing resolution and the mechanisms governing how vascular structures are generated as well as their size[8,9]. However, in most bioprinting procedures the cells are subjected to shear stress, which in turn diminishes cell viability after printing and potentially also affects post-printing cell functionality[10]. However, because the amplitude and time course of shear stress can vary among these techniques, it is essential to fully understand potential side effects of the printing process on the cells. Investigating the impact of printing-induced shear stress on cells should involve a rheological characterization of printing suspensions, a simulation and quantification of the stress condition for the cells during the printing process, and extensive, conclusive, and thoroughly planned cell culture studies specifically designed with respect to cell and tissue type. In this study considering the geometry of a commonly used mechanical microvalve, we performed a finite element analysis (FEA) simulation to analyze the mechanical load in terms of shear stress and hydrostatic pressure during drop ejection in DoD bioprinting. As an input material characteristic, the measured viscosity of alginate solution at a concentration of 1.5% (w/v) is used and a power-law function is applied to model its non-Newtonian shear-thinning behavior.
Blaeser et al. previously reported a theoretical model based on simplified assumptions and geometry to calculate the induced shear stress during DoD bioprinting[10]. However, our FEA-based simulation model in the present paper considers the actual geometry of the printing valve (including moving and stationary pistons and conical shape of nozzle inlet with actual curves) and therefore provides more reliable results as well as a more complete picture of the shear stress which is dependent on the applied upstream pressure during the bioprinting process. Moreover, our developed model enabled us to calculate flow parameters in each single geometrical point; this is not possible using analytical integral models. In addition to shear stress modeling and quantification, we also experimentally investigated the impact of printing-associated shear stress and hydrostatic pressure on cell viability and function in long-term cell culture experiments. First, the viability of the HUVECs was measured after they were expelled from the printer. Then, immune expression of cell specific proteins and the capillary-like network formation of printed HUVECs in a two-dimensional (2D) environment were compared to results obtained from non-printed control samples. Finally, post-printing tubular formation of HUVECs was assessed in co-culture with hMSC in 3D agarose-collagen hydrogels after a period of 14 days. We hypothesized that bioprinting of pre-vascularized 3D constructs is feasible without affecting the cell function and angiogenic potential of HUVECs at a well-tuned hydrostatic pressure and resulting shear stress.
2. Materials and methods
2.1. Cell isolation
Human mesenchymal stromal cells (hMSCs) were isolated from the femoral heads of patients receiving hip joint arthroplasty after informed consent approved by the Ethics Committee of the Faculty of Medicine, RWTH Aachen University (EK 300/13). A cell suspension was prepared by flushing the spongiosa several times with hMSC growth medium (Mesenpan, PAN Biotech, Aidenbach, Germany) containing 2% v/v fetal calf serum (PAN Biotech, Aidenbach, Germany), 1% v/v penicillin/streptomycin (Gibco, Invitrogen, Carlsbad, USA), and 1% v/v growth supplement (PAN Biotech, Aidenbach, Germany). After centrifugation (1,200 rpm for 5 min; CT6EL, Hitachi Koki, Tokyo, Japan) and removal of the supernatant, the cells were plated inside two T75 culture flasks (CELLSTAR TC, sterile, Greiner Bio-One, Frickenhausen, Germany). The flasks were incubated at 37°C und 5% v/v CO2. Non-adherent cells were removed during the first media change after 24 h. Starting that day, the media were changed twice a week.
HUVECs were isolated from umbilical cords and provided by the Department of Gynecology and Perinatal Medicine (RWTH Aachen University Hospital) as approved by the local ethics committee (EK 218/14). HUVECs were isolated following established protocols[6,7]. Briefly, the umbilical cords were rinsed in phosphate-buffered saline (PBS) for 5 min. To remove coagulated blood, the veins were flushed with PBS and then filled with collagenase solution (Collagenase Type I, 400 U/ml dissolved in Hank’s Balanced Salt Solution + CaCl2, + MgCl2, both Gibco by Life Technologies, Carlsbad, USA) and closed with a clip at both ends. The umbilical cord was then placed on a petri dish, covered, and incubated for 30 min (37°C and 5 % v/v CO2). The clips were removed and fresh PBS was used to flush the vein. The cell suspension was collected in a Falcon tube and centrifuged (1200 rpm for 5 min; CT6EL, Hitachi Koki, Tokyo, Japan). The supernatant was removed from the tube and the remaining cell pellet was suspended with 10 ml medium (EBM-2 Basal Medium and EGM-2 Endothelial Growth SingleQuot Kit Supplement and Growth Factors, Lonza, Basel, Switzerland). The cells were transferred to gelatin-coated cell culture flasks (CELLSTAR TC, sterile, Greiner Bio-One, Frickenhausen, Germany; Gelatin from porcine skin, gel strength 300, Type A, Sigma-Aldrich, St. Louis, USA) and incubated at 37°C and 5% v/v CO2. From then on, the medium was changed twice a week.
2.2. Preparation of hydrogel and PI-FDA solutions
The agarose (agarose low gelling temperature, BioReagent for molecular biology, Sigma-Aldrich, St. Louis, USA) and alginate (alginic acid sodium salt from brown algae, BioReagent, suitable for immobilization of microorganisms, Sigma-Aldrich, St. Louis, USA) solutions were prepared in sterile demineralized water or sterile PBS (Gibco by Life Technologies, Carlsbad, USA), respectively. The hydrogel solutions were prepared by autoclaving (agarose) or by stirring overnight (alginate). Whereas agarose gel was used in combination with collagen for the 3D cell culture experiments, alginate solution was used in the printing procedures due to its ease of handling and its temperature-independent and thus controllable gelation behavior. The collagen solution was prepared by mixing eight parts of collagen (FibriCol, Type I Bovine Collagen Solution, 10 mg/ml, Advanced BioMatrix, San Diego, USA) with two parts medium and neutralizing with 1 M sodium hydroxide. PI-FDA solution was used for live-dead staining. For this step, 0.025 g propidium iodide (PI; 95 % HPLC, Sigma-Aldrich, St. Louis, USA) was dissolved in 5 ml Ringer’s solution and 0.05 g fluorescein diacetate (FDA; Sigma-Aldrich, St. Louis, USA) was dissolved in 10 ml acetone. 10 µl of the prepared PI and FDA solutions were separately mixed with 600 µl Ringer’s solution in micro test tubes.
2.3. Numerical simulation
Ansys CFX 19.2, a software that uses finite element method to solve the governing equations, was used for the numerical simulations. For this purpose, the fluid was considered incompressible, isothermal condition was imposed, and the maximum RMS residual error of 10−4 was chosen. We set a high-resolution scheme for the advection term discretization and a second order backward Euler scheme for the transient term discretization[11]. The geometry of a mechanical microvalve (SMLD 300G, Fritz Gyger AG, Gwatt, Switzerland; valve diameter 150 µm) was considered for the simulation. This valve consists of a stationary piston, a moving piston, and a spring that ensures microvalve closure. By imposing a high upstream pressure, the cell suspension is placed under pressure and as soon as the valve opens, a drop is ejected. For the numerical simulation, we used a non-uniform mesh with higher mesh density at the entrance of the nozzle and boundary layer mesh at the walls. To ensure the use of proper element size, the grid study was performed on at least three cases of fine, medium, and coarse meshes considering the wall shear stress as a sensitive parameter. Transient simulation within the valve opening time (4,500 µs) was considered and the total flow rate during this period (drop volumetric size) was compared with experimental measurements (see below). Two different upstream pressures (0.5 and 3 bar) were considered for the simulations.
2.4. Viscometry
Viscosity data were used as input for the simulation of the alginate flowing inside the microvalve. A cell-alginate suspension was prepared (alginate concentration 1.5% w/v) with a cell concentration of 1 million cells/ml (HUVEC). Viscosity measurements were performed on a rotational viscometer (Kinexus ultra+, Malvern Instruments Ltd., Malvern, United Kingdom) using a 4° cone geometry. The shear rate was continuously increased according to a defined range from 0.01 to at least 1,000 s−1 within a period of 3 min during which the viscosity and shear stress were measured.
2.5. Droplet volume
The measurement of the droplet volume and all other printing experiments were conducted on a custom-made microvalve-based 3D printer for DoD bioprinting of hydrogel-cell suspensions, as previously described[10]. Droplet measurements were performed as follows. Empty micro test tubes (1.5 ml) were weighed and then loaded with 20 droplets of hydrogel suspension (1 million cells/ml for alginate 1.5% w/v) at different printing pressures (0.5 and 3.0 bar). The opening time of the microvalve was set to 4500 ms and was not changed during the measurement (SMLD 300G, Fritz Gyger AG, Gwatt, Switzerland; valve diameter 150 µm, schematic view of the valve in Figure 1C). Subsequently, the test tubes were weighed again, and the average droplet volume was calculated by dividing the difference in weight by the number of dispensed droplets and the density of water at 25°C. Due to the low gel concentrations, it was assumed that the density of the hydrogel solution used was comparable to that of water.
Figure 1.

Simulation of alginate 1.5% w/v flowing within the microvalve. (A) Droplet size at different pressures calculated using simulation and measured experimentally (n = 3). (B) Calculated maximum and average wall shear stress at the nozzle wall of the microvalve at different pressures obtained from numerical simulation results. (C) Schematic representative of the three streamlines (lines 1, 2, and 3) used to report pressure and shear stress in microvalve. (D and E) The pressure and shear stress along three streamlines at pressure difference of 0.5 bar. (F and G) The pressure and shear stress along three streamlines at pressure difference of 3 bar. Note that the maximum shear stresses in (E) are much lower than the maximum wall shear stress shown in (B) as the streamlines are in a distance from the nozzle walls. In (D and F), the pressure on streamlines 1,2 and 3 are overlapped.
2.6. Post-printing cell viability
An alginate solution with a concentration of 1.5% w/v was prepared containing 1 million cells/ml (HUVEC). This cell-alginate suspension was then transferred to the cartridge of the 3D printer, which had previously been disinfected with ethanol (70% v/v). Then, the cell suspension was dispensed through a magnetic microvalve (SMLD 300G, Fritz Gyger, Gwatt, Switzerland; valve diameter 150 mm) at different pressures (0.25, 0.5, 0.75, 1.0, 1.25, 1.5, 2.0, 2.5, and 3.0 bar) with an opening time of 4500 µs. At each printing pressure that was set, 20 µl of the cell suspension was collected in an empty micro test tube. Subsequently, 7.5 µl was taken from each sample, pipetted onto a microscope slide, and mixed with an equal volume of PI-FDA solution. The samples were then covered with a round cover slip. Imaging was performed using a fluorescence microscope (Axio Imager M2M, Carl Zeiss, Oberkochen) at five-fold magnification. For each sample, three images were taken at different positions. Non-printed cell-alginate suspension that was taken from the printing cartridge served as control.
2.7. Expression of cell-specific markers
A cell-alginate suspension containing 1 million cells/ml (HUVEC) was prepared and dispensed dropwise through a microvalve (SMLD 300G, Fritz Gyger AG, Gwatt, Switzerland; valve diameter 150 µm) at different printing pressures (0.5 and 3.0 bar). The valve opening time was kept constant at 4500 µs. At each pressure, 400 µl of the printed cell-alginate suspension was diluted with 3.6 ml cell culture medium. Then, the cell suspension was transferred to 24-well plates and incubated at 37°C und 5 % v/v CO2. To qualitatively assess the immunoexpression of the cultivated cells, the supernatant of each sample was removed on day 7 and the cells fixated for 15 min using a 4% PFA solution. The cells were washed with PBS. The primary antibodies were diluted 1:100 in 3% bovine serum albumin (BSA) solution and 50 µl of the primary antibody solution was pipetted into each well (one primary antibody per well). The cell culture plates were incubated for 1 h and then washed with PBS at room temperature (3 times for 15 min). Accordingly, the secondary antibodies were diluted 1:100 in a 3% BSA solution and added to the wells. The plates were incubated and washed again. Finally, 50 ml of a DAPI solution (diluted 1:10,000 in PBS) was added to each well. After an incubation period of 2 min at room temperature, the samples were washed with fresh PBS again (three times for 15 min). Imaging was conducted on a fluorescence microscope (Axio Imager M2M, Carl Zeiss, Oberkochen). The primary antibodies used were CD144 Monoclonal Antibody and VWF Monoclonal Antibody (both ThermoFisher Scientific, Waltham, USA). The secondary antibodies used were Goat Anti-Mouse IgG H&L Alexa Fluor 594 (ThermoFisher Scientific, Waltham, USA) with an optimum excitation wavelength at 590 nm and an emission maximum at 617 nm, and Goat Anti-Rabbit IgG H&L Alexa Fluor 488 (ThermoFisher Scientific, Waltham, USA) with an optimum excitation wavelength at 495 nm and an emission maximum at 519 nm.
2.8. Pre-vascularization potential of HUVEC
The pre-vascularization potential of printed endothelial cells was evaluated in 2D as well as in 3D cell culture experiments. In the 2D study, a basal membrane matrix (Geltrex™ LDEV-Free Reduced Growth Factor Basement Membrane Matrix, ThermoFisher Scientific, Waltham, USA) was slowly thawed at 4°C overnight. Then, 90 µl of Geltrex™ was pipetted into a 48-well plate that was incubated for 30 min at 37°C to induce gelation of the matrix substrate. A cell-alginate suspension was prepared (1.5% alginate, 1 million cells/ml, HUVEC), transferred to the 3D printer, and printed into centrifugation tubes at different static pressures (0.5 and 3.0 bar) with a constant valve opening time of 4500 µs (SMLD 300G, Fritz Gyger AG, Gwatt, Switzerland; valve diameter 150 µm). Then, 500 µl of each printed suspension was added to micro test tubes previously filled with 4,500 µl cell culture media. After mixing, 500 µl of each diluted cell suspension was separately pipetted into the prepared wells and the cell culture plates were incubated at 37°C and 5% v/v CO2. Live-dead imaging of the samples was conducted on the 2nd day of incubation (Observer Z1, Zeiss, Oberkochen, Germany). The images of the PI-FDA-stained cells were analyzed by counting the number of crossings, closed networks, and extensions formed by the cells using ImageJ and the Angiogenesis Analyzer plug-in freeware tool developed by Gilles Carpentier.
To investigate the pre-vascularization potential of printed cells in a 3D environment, cell-alginate suspension was prepared and dispensed through the microvalve as previously described for the 2D experiments (HUVEC). For each printing parameter setting (0.5 and 3.0 bar), a separate micro test tube was filled with 1.6 ml cell-alginate suspension. After printing, the suspension was centrifuged and the supernatant removed. Each cell pellet was suspended in 50 µl cell culture media leading to a final cell concentration of 32 million cells/ml. Meanwhile, an agarose, a collagen solution, and a hMSC-medium suspension with a cell concentration of 32 million cells/ml were prepared. Agarose, collagen, and both cell suspensions were mixed in such way to achieve a final cell concentration of 3 million cells/ml (per each cell type), an agarose concentration of 0.2%, and a collagen concentration of 0.5 % (Agr0.2Coll0.5). After 14 days of incubation at 37°C and 5% v/v CO2, HUVECs were immunofluorescently labeled as follows. The cell-laden hydrogel samples were fixed in ice-cold methanol (VWR International, Leuven, Belgium) for 15 – 20 min at room temperature. The primary antibody (Monoclonal Anti-CD31 PECAM-1, Sigma-Aldrich, St. Louis, USA) was diluted with a BSA solution (3% in PBS) to a ratio of 1:100. After removal of the methanol, the samples were washed in PBS for 5 min and rinsed in 300 ml of the primary antibody solution for 48 h at 37°C. After removing the supernatant, the samples were washed twice in PBS at 37°C to remove excess antibody (first for 5 min, then for 12 – 24 h). The PBS was removed and the secondary antibody (Goat Anti-Mouse IgG H&L Alexa Fluor 594, Thermo Fisher Scientific, Waltham, USA) was diluted in BSA solution (1:400) and added to the wells, which were then incubated for 48 h at 37°C. The samples were subsequently washed with PBS three times. DAPI staining was conducted as described above. Finally, the samples were washed with PBS again 3 times (5 min each time) and stored in fresh PBS at 4°C until imaging by two-photon laser scanning microscopy (TPLSM).
2.9. Statistical analysis
Statistical analysis was performed using a one-way analysis of variance with Tukey’s post hoc test using SPSS software (Version 25, IBM Corporation, Armonk, USA). A value of P < 0.05 (*) was considered statistically significant and a value of P < 0.005 (**) was considered highly statistically significant. The number of replicates is given in the respective figure caption.
3. Results
The viscosity curves of the cell-laden alginate solution applied in this study clearly confirmed the shear thinning behavior typical for this hydrogel (data not shown). The viscosity continuously decreased with increasing shear rate from 0.01 to 1000s−1. Based on these experimentally derived viscosity curves, the flow behavior index n and the consistency index K used to describe the rheological behavior of shear thinning fluids were calculated. For a 1.5% alginate solution with a cell concentration of 1 million cells/ml, we found n to be 0.944 ± 0.004 and K to be 0.193 ± 0.013 Pa·sn. To validate the applied simulation model, the calculated droplet volumes (from simulation) were compared with experimentally measured ones for two upstream pressures of 0.5 and 3 bar (Figure 1A). The simulation predicts slightly lower droplet sizes: The deviation in droplet volumes calculated from the simulation compared to the measured ones was 19.5% and 18.9% for 0.5 and 3 bar, respectively. The corresponding average wall shear stress occurring inside the nozzle was 1.62 and 9.19 kPa for the upstream pressures 0.5 and 3.0 bar.
Figure 1B shows the maximum and average wall shear stress within the critical region of the microvalve nozzle. Here, the maximum wall shear stress is simply the maximum over the wall of the microvalve nozzle (automatically calculated by software) and the average wall shear stress is the area average over the whole microvalve nozzle wall. The average increases in an almost linear fashion with the increasing pressure. While the average wall shear stress is always below 10 kPa, the maximum reaches the value of 21 kPa at 3 bar. However, not all the cells traveling through the microvalve would experience such high values of shear stress occurring at or near the nozzle walls. To demonstrate this, we considered three streamlines passing from 15 to 30, and 45 mm radial distances away from the centerline of the nozzle (Figure 1C). Assuming cells as mass-free particles travelling within the microvalve on the flow streamlines, they experience the fluid shear stress and pressure occurring in each spatial position along the streamline. Figure 1D and E show the pressure and shear stress along the three streamlines. The figures show that almost all the cells traveling through the microvalve experience the same hydrostatic pressure regardless of their radial position. The shear stress imposed on the cells depends on their radial distance from centerline; the closer to the centerline, the lower the shear stress.
This study found that there are two aspects that should be considered when studying the effects of printing processes on cells. First, since the nozzle is very short, the cells experience a very short time of exposure to shear stress while passing through together with a jump in shear stress (known as extensional stress) at the entrance region of the nozzle (inset, Figure 1E). Second, cells are exposed to hydrostatic pressure throughout nearly the entire printing time frame (because the printer reservoir is under pressure throughout the printing process) as well as a high-pressure gradient during the time they are flowing through the nozzle of the microvalve. The simulation results offer insights about the type, duration and amplitude of the mechanical stimuli on the cells that later on can be used for proper tuning of the bioprinting process.
The following cell culture results are presented in combination with the applied printing pressure ranging from 0.25 to 3.0 bar. This printing or upstream pressure can be precisely set before printing and is a controlling parameter in the process. According to the results presented in Figure 1, high pressure values are associated with higher levels of the corresponding average and maximum shear stress and thus a higher loss in cell viability. After being expelled from the printing nozzle, the viability of HUVECs decreased with increasing printing pressure (Figure 2). The normalized viability values decreased almost steadily and ranged from 100% for 0.25 bar to 79.7% for 3.0 bar.
Figure 2.

Cell viability of HUVECs in alginate solution immediately after being expelled from the tip of the printing nozzle plotted against the applied printing pressure. Viability results were normalized to the viability value at a printing pressure of 0.25 bar and thus ranged from 100% to 79.7%. n = 3.
In the non-printed as well as in all printed samples, 2D network-like structures of similar quality and comprising viable endothelial cells could be observed (Figure 3A). Previously, printed cells were exposed to different shear stress levels corresponding to the applied printing pressures of 0.5 and 3.0 bar. Software-based image analysis revealed no statistically significant differences between the number of crossing points of cellular structures, the number of closed network elements, and the number of extensions or dead ends (P < 0.05, Figure 3B). However, in samples printed under the harshest printing conditions (3 bar), significantly more dead cells were found than in all other samples (P < 0.05, Figure 3C).
Figure 3.
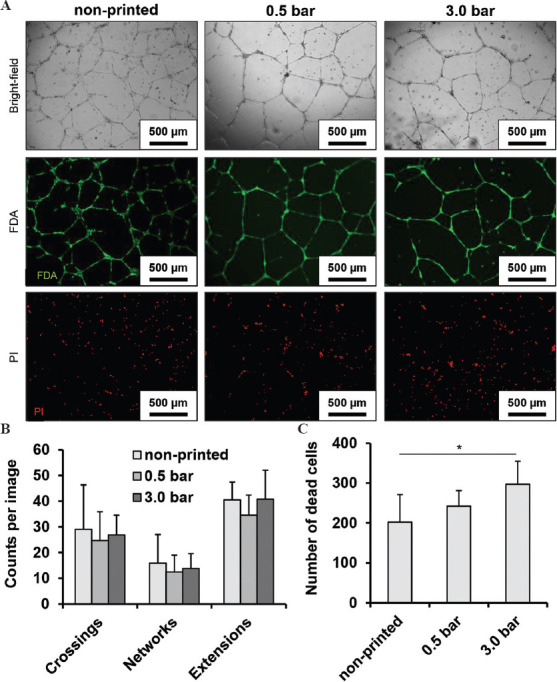
Network-like structures were formed by viable cells in all samples under 2D culture conditions (A). The differentiation between living and dead cells is clear with live-dead staining. The results were also evaluated with software-based image analysis, which did not reveal any statistically significant differences among the different printing conditions (B). The number of dead cells was highest in samples printed at the highest pressure and thus under the harshest conditions (C). n = 3 for (A-C). P < 0.05*.
We further demonstrated that the applied printing conditions did not alter the expression of endothelial cell specific markers such as vascular-endothelial (VE) cadherin and von Willebrand factor (Figure 4). As confirmed by visual examination, both markers were equally present in non-printed controls and in samples printed at 0.5 and 3.0 bar. The cell nuclei were visualized by DAPI staining. In all samples, VE cadherin was highly concentrated at the cell-cell interface. The intensity of the signal for both target proteins was different from cell to cell. However, there were no qualitative differences visible among the images from the three groups.
Figure 4.

Expression of vascular endothelial cadherin (VE cadherin, red) and von Willebrand factor (VWF, green) by HUVEC in non-printed and printed samples visualized by fluorescence microscopy. The cell nuclei were stained with DAPI.
Under 3D culture conditions and in co-culture with hMSC, endothelial cells exposed to low hydrostatic pressure/shear stress formed capillary-like structures (Figure 5). Using an established angiogenesis model based on a hydrogel blend of agarose and collagen[6], we observed in the present work that the formation of capillary-like structures was drastically reduced after cells were exposed to high bioprinting-associated hydrostatic pressure and resulting shear stress. TPLSM images revealed comparable structure formation in non-printed samples and in those which were printed at 0.5 bar. However, in samples printed at 3.0 bar no structure formation was observed at all. Here, all cells remained rounded throughout the cultivation period.
Figure 5.
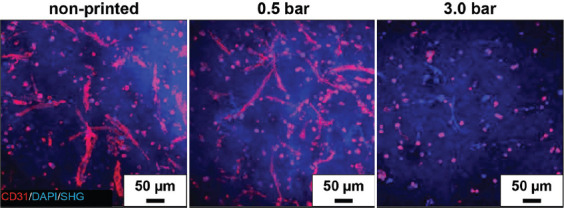
Endothelial CD31 adhesion protein (red) visualized by TPLSM on non-printed and printed cells mixed with non-printed hMSCs and encapsulated in a 3D mixture of agarose and collagen (Agr0.2Koll0.5). The nuclei of all cell types were visualized by DAPI staining (blue). Collagen within the hydrogel blend was made visible by second harmonic generation (SHG, blue). HUVEC were co-cultured with hMSCs for 14 days.
4. Discussion
3D bioprinting is accompanied by mechanical stimulation that can critically affect the fate and function of cells. Here, with the focus on DoD bioprinting using a mechanical microvalve, we studied the effect of bioprinting-associated hydrostatic pressure (as controlling parameter) on the viability and pre-vascularization potential of HUVECs. To quantify the amplitude of the shear stress corresponding to the bioprinting hydrostatic pressure, we simulated the flow of cell-laden alginate 1.5% w/v within a commercially available microvalve. This numerical model can be used to determine both the maximum and average shear stress imposed on the cells during printing based on the pre-set upstream pressure. The validity of our numerical model is assured by comparing the droplet size results from the simulation with those we measured. It is shown here that all cells during bioprinting are subject to the effects of the same hydrostatic pressure, while the shear stress imposed on the cells varies according to their radial distance from the wall of the nozzle. Furthermore, Chand et al. developed a numerical model for extrusion based bioprinting and investigated the printing process parameters on the maximum wall shear stress and duration in which cells passing through the nozzle[12]. However, the focus of our numerical simulation model was on the DoD bioprinting using mechanical microvalve which is different from those considering extrusion bioprinting. For the control samples, non-printed cells were taken from the cartridge of the printer. In this way, all cells were equally exposed to the same hydrostatic pressure so that its effect could be discounted. However, the cell culture results are reported based on pressure since this is the controlling parameter in our bioprinter. In this regard, Figure 1B can be used when the amplitude of shear stress for alginate 1.5% w/v is of interest. Overall, the numerical model presented here provides detailed information about mechanical stimulation of the cells during drop ejection that can eventually be helpful in the redesign and optimization of not only the printing parameters but also the microvalve geometry.
In this study, whenever cells were printed, alginate solution was used as the hydrogel solution. This was done for two reasons: first, alginate is commonly used in studies investigating the effect of printing-induced shear stress on cells and its viscosity can be altered over a wide range by simply changing its concentration[10,13], and second, alginate solution can be transformed into a hydrogel only on demand and in the presence of a particular crosslinker (e.g., calcium chloride). The latter eliminates the risk of spontaneous and unwanted gelation during bioprinting or pipetting as occurs in temperature-sensitive materials such as agarose or collage[14,15]. Moreover, alginate is a highly biocompatible, frequently applied, and very well investigated material for bioprinting as well as 3D cell culture experiment[16-19]. Notably, alginate is not suitable for pre-vascularization studies as it does not promote cell adhesion under 3D culture conditions due to the lack of binding motives as RGD sequences. Since cell-laden alginate 1.5% wt/v is used in this work, its viscosity is measured using a rotary rheometer and modeled as a shear-thinning non-Newtonian fluid using the power-law model.
Under physiological conditions, endothelial cells are exposed to continuous fluid flow and shear stress. For large vessels such as arteries and the aorta, shear stresses between 0.3 and 1.3 Pa have been reported, and for smaller vessels such as capillaries, around 4.2 to 9.55 Pa occur physiologically[20-22]. A number of studies investigate the effect of shear stress on endothelial cells in vitro[23-25]. However, in those studies cells were cultured at physiologically relevant shear stress for longer periods of time, such as hours and days. In contrast, cells were exposed to excessive shear stresses in this study for only a very short time frame in the range of milliseconds.
In general, shear stress during bioprinting depends on several factors such as the dispenser geometry (e.g., needle or valve diameter), the printing pressure, and rheological behavior of the printing solution. The observed decrease of post-printing cell viability is in accordance with already published data for various cell types combined with alginate solution[26-28]. It has been reported that for micro valve-based bioprinting, relatively high cell viabilities can be maintained depending on the solution viscosity and the printing parameters. For example, Horváth et al. printed suspensions of endothelial cells in cell culture medium and while pipetting cell suspension resulted in a viability loss of 15.8% those in printed samples showed losses of up to 18.7%[29]. However, only a few published studies systematically investigate the viability and function of endothelial cells under varied printing parameters[28,30]. As published previously, mesenchymal progenitor cells differentiate into endothelial cells when exposed to low shear stresses (1.5 Pa) for several hours[31]. Furthermore, it has been shown that exposure to shear stress can lead to de-differentiation of cells under certain conditions[23]. However, the results of the present study do not suggest that printing-associated shear stress induces de-differentiation; no differences could be seen in the cellular phenotype after qualitatively assessing the expression of endothelial cell-specific markers such as CD31, vWF, and VE-cadherin. The quantification of network-like multi-cell structures obtained from the 2D pre-vascularization study did not lead to any significant differences between printed and pipetted samples. However, when comparing the initial cell numbers in printed and pipetted samples, significantly more dead cells were found in those that were printed at 3 bar and thus exposed to the highest shear stress. The comparable outcomes in all samples in terms of 2D pre-vascularization could be explained by taking into account the ability of HUVECs to proliferate comparatively quickly in a 2D environment[29]. However, in a 3D environment, we expect that cell proliferation and migration will be significantly reduced during cultivation, as the mechanical properties of the surrounding matrix will affect the diffusion of relevant cytokines and limit cell motility[32-36]. Taking further into account the strong drop in viability when printing the cells at 3 bar, we assume that the remaining number of viable and/or functional cells is too low for capillary-like network formation as it still can be observed at a low printing pressure (Figure 2). Established protocols for 3D pre-vascularization studies demand comparatively high initial cell concentrations in the range of several million cells/ml hydrogel or scaffold. These optimal cell concentrations were usually identified when the assay was developed. As confirmed by the present study, dispensing endothelial cells at 3 bar, the highest shear stress investigated in this study, immediately reduces cell viability by about 20%. The initial cell number at the beginning of the cultivation period was therefore significantly different from what the established protocol for 3D pre-vascularization demands. Therefore, the viability and metabolic activity of 3D encapsulated cells needs to be thoroughly assessed over time in a follow-up study that would consider an equal concentration of viable HUVEC in all samples at the beginning of the experiment. However, taking into consideration the important finding that 3D pre-vascularization can equally be achieved with endothelial cells that were exposed to low shear stress, the pressure range below 0.5 bar should be the area of main interest in further studies.
Although bioprinting-associated shear stress can substantially diminish the number of viable cells, the results presented in this study indicate that there exists a process window for microvalve-based bioprinting in which cell viability and function of HUVEC are not negatively affected. Due to exposure to the high shear stresses that occur by setting the printing pressure to 3 bar, a significant viability loss immediately after printing as well as reduced capillary-like network formation in long-term 3D culture experiments can be observed.
5. Conclusion
In this work, we used a FEA-based simulation model to determine the mechanical conditions imposed on cells during bioprinting. The simulation model offers for the first time detailed spatiotemporal information about the printing-induced shear stress and hydrostatic pressure that, together with experimental studies, can be used for optimizing the process for cell-friendly bioprinting with different hydrogels. The experimental in vitro cell culture analysis revealed that the cells maintain their capacity to proliferate and to assemble into 2D and 3D multi-cell capillary networks after exposure to bioprinting-associated hydrostatic pressure and resulting shear stress. However, this is true only if the key parameters, such as bioink viscosity and printing pressure, are properly balanced. We therefore conclude that microvalve-based bioprinting is a suitable technique for the manufacture of pre-vascularized constructs when the printing parameters and thus the shear stress level are thoroughly controlled.
Acknowledgments
This work was supported by the Core Facility Two-Photon Imaging of the Interdisciplinary Center for Clinical Research (IZKF Aachen) within the Faculty of Medicine at RWTH Aachen University. We thank Dr. Michael Vogt, operation manager of this Core Facility for his support. This publication uses data collected within the framework of the PhD thesis of the first author Marius Köpf entitled ‘Synthese sowie rheologische, mechanische und zellbiologische Charakterisierung von Agarose-Kollagen-Hydrogel-Mischungen für den 3D-Druck von prävaskularisiertem Luftröhren-Ersatzgewebe’ published in 2019 at the Faculty of Georesources and Materials Engineering, RWTH Aachen University, Aachen, Germany[37].
Funding
We acknowledge the financial support of Deutsche Forschungsgemeinschaft DFG, Bonn, Germany (Grants FI975/23-1+2, JO 764/4-1+2, and 363055819/GRK 2415).
Conflict of interest
The authors declare no competing financial interest.
Author contributions
Conceptualization – Marius Köpf and Horst Fischer; Supervision – Horst Fischer and Stefan Jockenhoevel; Investigation – Marius Köpf with support of Franziska Kreimendahl (experimental), Ramin Nasehi (numerical simulations); Formal analysis – Marius Köpf, Ramin Nasehi, Franziska Kreimendahl, Stefan Jockenhoevel, and Horst Fischer; Funding acquisition – Horst Fischer and Stefan Jockenhoevel; Writing – original draft: Marius Köpf with support of Horst Fischer and Ramin Nasehi.
References
- 1.Malda J, Visser J, Melchels J, et al. 25th Anniversary Article:Engineering Hydrogels for Biofabrication. Adv Mater. 2013;25:5011–28. doi: 10.1002/adma.201302042. http://doi.org/10.1002/adma.201302042. [DOI] [PubMed] [Google Scholar]
- 2.Wang Z, Kapadia W, Li C, et al. Tissue-specific Engineering:3D Bioprinting in Regenerative Medicine. J Control Release. 2021;329:237–56. doi: 10.1016/j.jconrel.2020.11.044. http://doi.org/10.1016/j.jconrel.2020.11.044. [DOI] [PubMed] [Google Scholar]
- 3.Jain RK, Au P, Tam J, et al. Engineering Vascularized Tissue. Nat Biotechnol. 2005;23:821–3. doi: 10.1038/nbt0705-821. https://doi.org/10.1038/nbt0705-821. [DOI] [PubMed] [Google Scholar]
- 4.Subbiah R, Thrivikraman G, Parthiban SP, et al. Prevascularized Hydrogels with Mature Vascular Networks Promote the Regeneration of Critical-size Calvarial Bone Defects In Vivo. J Tissue Eng Regen Med. 2021;15:219–231. doi: 10.1002/term.3166. https://doi.org/10.1002/term.3166. [DOI] [PMC free article] [PubMed] [Google Scholar]
- 5.Zimoch J, Zielinska D, Michalak-Micka K, et al. Bio-engineering a Prevascularized Human Tri-layered Skin Substitute Containing a Hypodermis. Acta Biomater. 2021;134:215–27. doi: 10.1016/j.actbio.2021.07.033. https://doi.org/10.1016/j.actbio.2021.07.033. [DOI] [PubMed] [Google Scholar]
- 6.Kreimendahl F, Köpf M, Thiebes AL, et al. Three-dimensional Printing and Angio-genesis:Tailored Agarose-type I Collagen Blends Comprise 3D Printability and Angio-genesis Potential for Tissue Engineered Substitutes. Tissue Eng Part C Methods. 2017;23:604–15. doi: 10.1089/ten.TEC.2017.0234. https://doi.org/10.1089/ten.tec.2017.0234. [DOI] [PubMed] [Google Scholar]
- 7.Stratesteffen H, Köpf M, Kreimendahl F, et al. GelMA-collagen Blends Enable Drop-on-demand 3D Printablility and Promote Angiogenesis. Biofabrication. 2017;9:045002. doi: 10.1088/1758-5090/aa857c. https://doi.org/10.1088/1758-5090/aa857c. [DOI] [PubMed] [Google Scholar]
- 8.Blaeser A, Campos DF, Fischer H. 3D Bioprinting of Cell-laden Hydrogels for Advanced Tissue Engineering. Curr Opin Biomed Eng. 2017;2:58–66. https://doi.org/10.1016/j.cobme.2017.04.003. [Google Scholar]
- 9.Simunovic F, Finkenzeller G. Vascularization Strategies in Bone Tissue Engineering. Cells. 2021;10:1749. doi: 10.3390/cells10071749. https://doi.org/10.3390/cells10071749. [DOI] [PMC free article] [PubMed] [Google Scholar]
- 10.Blaeser A, Campos DF, Puster U, et al. Controlling Shear Stress in 3D-Bioprinting is a Key Factor to Balance Printing Resolution and Stem Cell Integrity. Adv Healthc Mater. 2016;5:326–33. doi: 10.1002/adhm.201500677. https://doi.org/10.1002/adhm.201500677. [DOI] [PubMed] [Google Scholar]
- 11.Jentsch S, Nasehi R, Kuckelkorn C, et al. Multiscale 3D Bioprinting by Nozzle-free Acoustic Droplet Ejection. Small Methods. 2021;5:e2000971. doi: 10.1002/smtd.202000971. https://doi.org/10.1002/smtd.202000971. [DOI] [PubMed] [Google Scholar]
- 12.Chand R, Muhire BS, Vijayavenkataraman SS. Computational Fluid Dynamics Assessment of the Effect of Bioprinting Parameters in Extrusion Bioprinting. Int J Bioprint. 2022;8:45–60. doi: 10.18063/ijb.v8i2.545. http://doi.org/10.18063/ijb.v8i2.545. [DOI] [PMC free article] [PubMed] [Google Scholar]
- 13.Axpe E, Oyen ML. Applications of Alginate-based Bioinks in 3D Bioprinting. Int J Mol Sci. 2016;17:1976. doi: 10.3390/ijms17121976. http://doi.org/10.3390/ijms17121976. [DOI] [PMC free article] [PubMed] [Google Scholar]
- 14.Augst AD, Kong HJ, Mooney DJ. Alginate Hydrogels as Biomaterials. Macromol Biosci. 2006;6:623–33. doi: 10.1002/mabi.200600069. http://doi.org/10.1002/mabi.200600069. [DOI] [PubMed] [Google Scholar]
- 15.Kuo CK, Ma PX. Ionically Crosslinked Alginate Hydrogels as Scaffolds for Tissue Engineering:Part 1. Structure, Gelation Rate and Mechanical Properties. Biomaterials. 2001;22:511–21. doi: 10.1016/s0142-9612(00)00201-5. http://doi.org/10.1016/s0142-9612(00)00201-5. [DOI] [PubMed] [Google Scholar]
- 16.Gasperini L, Mano JF, Reis RL. Natural Polymers for the Microencapsulation of Cells. J R Soc Interface. 2014;11:20140817. doi: 10.1098/rsif.2014.0817. http://doi.org/10.1098/rsif.2014.0817. [DOI] [PMC free article] [PubMed] [Google Scholar]
- 17.Lee KY, Mooney DJ. Hydrogels for Tissue Engineering. Chem Rev. 2001;101:1869–79. doi: 10.1021/cr000108x. http://doi.org/10.1021/cr000108x. [DOI] [PubMed] [Google Scholar]
- 18.Duan B, Hockaday LA, Kang KH, et al. 3D Bioprinting of Heterogeneous Aortic Valve Conduits with Alginate/Gelatin Hydrogels. J Biomed Mater Res A. 2013;101:1255–64. doi: 10.1002/jbm.a.34420. http://doi.org/10.1002/jbm.a.34420. [DOI] [PMC free article] [PubMed] [Google Scholar]
- 19.Tabriz AG, Hermida MA, Leslie NR, et al. Three-dimensional Bioprinting of Complex Cell Laden Alginate Hydrogel Structures. Biofabrication. 7:045012. doi: 10.1088/1758-5090/7/4/045012. http://doi.org/10.1088/1758-5090/7/4/045012. [DOI] [PubMed] [Google Scholar]
- 20.Papaioannou TG, Stefanadis C. Vascular Wall Shear Stress:Basic Principles and Methods. Hellenic J Cardiol. 2005;46:9–15. [PubMed] [Google Scholar]
- 21.Koutsiaris AG, Tachmitzi SV, Batis N, et al. Volume Flow and Wall Shear Stress Quantification in the Human Conjunctival Capillaries and Post-capillary Venules In Vivo. Biorheology. 2007;44:375–86. [PubMed] [Google Scholar]
- 22.Reneman RS, Hoeks AP. Wall Shear Stress as Measured In Vivo:Consequences for the Design of the Arterial System. Med Biol Eng Comput. 2008;46:499–507. doi: 10.1007/s11517-008-0330-2. http://doi.org/10.1007/s11517-008-0330-2. [DOI] [PMC free article] [PubMed] [Google Scholar]
- 23.Mahmoud MM, Serbanovic-Canic J, Feng S, et al. Shear Stress Induces Endothelial-to-mesenchymal Transition Via the Transcription Factor Snail. Sci Rep. 2017;7:3375. doi: 10.1038/s41598-017-03532-z. http://doi.org/10.1038/s41598-017-03532-z. [DOI] [PMC free article] [PubMed] [Google Scholar]
- 24.van der Meer AD, Poot AA, Feijen J, et al. Analyzing Shear Stress-Induced Alignment of Actin Filaments in Endothelial Cells with a Microfluidic Assay. Biomicrofluidics. 2010;4:11103. doi: 10.1063/1.3366720. http://doi.org/10.1063/1.3366720. [DOI] [PMC free article] [PubMed] [Google Scholar]
- 25.Pang Z, Antonetti DA, Tarbell JM. Shear Stress Regulates HUVEC Hydraulic Conductivity by Occludin Phosphorylation. Ann Biomed Eng. 2005;33:1536–45. doi: 10.1007/s10439-005-7786-0. http://doi.org/10.1007/s10439-005-7786-0. [DOI] [PubMed] [Google Scholar]
- 26.Faulkner-Jones A, Fyfe C, Cornelissen DJ, et al. Bioprinting of Human Pluripotent Stem Cells and their Directed Differentiation into Hepatocyte-like Cells for the Generation of Mini-livers in 3D. Biofabrication. 2015;7:044102. doi: 10.1088/1758-5090/7/4/044102. http://doi.org/10.1088/1758-5090/7/4/044102. [DOI] [PubMed] [Google Scholar]
- 27.Markstedt K, Mantas A, Tournier I, et al. 3D Bioprinting Human Chondrocytes with Nanocellulose-alginate Bioink for Cartilage Tissue Engineering Applications. Biomacromolecules. 2015;16:1489–96. doi: 10.1021/acs.biomac.5b00188. http://doi.org/10.1021/acs.biomac.5b00188. [DOI] [PubMed] [Google Scholar]
- 28.Nair K, Gandhi M, Khalil S, et al. Characterization of Cell Viability during Bioprinting Processes. Biotechnol J. 2009;4:1168–77. doi: 10.1002/biot.200900004. http://doi.org/10.1002/biot.200900004. [DOI] [PubMed] [Google Scholar]
- 29.Horváth L, Umehara Y, Jud C, et al. Engineering an In Vitro Air-blood Barrier by 3D Bioprinting. Sci Rep. 2015;5:7974. doi: 10.1038/srep07974. http://doi.org/10.1038/srep07974. [DOI] [PMC free article] [PubMed] [Google Scholar]
- 30.Khalil S, Sun W. Bioprinting Endothelial Cells with Alginate for 3D Tissue Constructs. J Biomech Eng. 2009;131:111002. doi: 10.1115/1.3128729. http://doi.org/10.1115/1.3128729. [DOI] [PubMed] [Google Scholar]
- 31.Wang H, Riha GM, Yan S, et al. Shear Stress Induces Endothelial Differentiation from a Murine Embryonic Mesenchymal Progenitor Cell Line. Arterioscler Thromb Vasc Biol. 2005;25:1817–23. doi: 10.1161/01.ATV.0000175840.90510.a8. http://doi.org/10.1161/01.ATV.0000175840.90510.a8. [DOI] [PubMed] [Google Scholar]
- 32.Grolman JM, Weinand P, Mooney DJ. Extracellular Matrix Plasticity as a Driver of Cell Spreading. Proc Natl Acad Sci U S A. 2020;117:25999–6007. doi: 10.1073/pnas.2008801117. http://doi.org/10.1073/pnas.2008801117. [DOI] [PMC free article] [PubMed] [Google Scholar]
- 33.Chaudhuri O, Gu L, Klumpers D, et al. Hydrogels with Tunable Stress Relaxation Regulate Stem Cell Fate and Activity. Nat Mater. 2016;15:326–34. doi: 10.1038/nmat4489. http://doi.org/10.1038/nmat4489. [DOI] [PMC free article] [PubMed] [Google Scholar]
- 34.Figueiredo L, Pace R, D'Arros C, et al. Assessing Glucose and Oxygen Diffusion in Hydrogels for the Rational Design of 3D Stem Cell Scaffolds in Regenerative Medicine. J Tissue Eng Regen Med. 2018;12:1238–46. doi: 10.1002/term.2656. http://doi.org/10.1002/term.2656. [DOI] [PubMed] [Google Scholar]
- 35.Malda J, Rouwkema J, Martens DE, et al. Oxygen Gradients in Tissue-engineered PEGT/PBT Cartilaginous Constructs:Measurement and Modeling. Biotechnol Bioeng. 86:9–18. doi: 10.1002/bit.20038. http://doi.org/10.1002/bit.20038. [DOI] [PubMed] [Google Scholar]
- 36.Bland E, Dréau D, Burg KJ. Overcoming Hypoxia to Improve Tissue-engineering Approaches to Regenerative Medicine. J Tissue Eng Regen Med. 2013;7:505–14. doi: 10.1002/term.540. http://doi.org/10.1002/term.540. [DOI] [PubMed] [Google Scholar]
- 37.Köpf M. Synthese Sowie Rheologische, Mechanische und Zellbiologische Charakterisierung von Agarose-Kollagen-Hydrogel-Mischungen für den 3D-Druck von Prävaskularisiertem Luftröhren-Ersatzgewebe, PhD Thesis, RWTH Aachen University. 2019 http://doi.org/10.18154/RWTH-2019-05138. [Google Scholar]