

Highlights
-
•
Metabolic connectivity is associated with temporal lobe epilepsy surgery outcome.
-
•
An increased connectivity is mostly observed within the operated temporal lobe.
-
•
Strengthened epileptogenic connectome is associated with non-free-seizure outcomes.
-
•
Seed correlations might be valuable for the individual outcome prediction.
Keywords: FDG PET, Metabolic connectivity, Drug resistant epilepsy, Seed correlation, Temporal lobe epilepsy surgery
Abstract
18F-FDG PET provides high sensitivity for the pre-surgical assessment of drug-resistant temporal lobe epilepsy (TLE). However, little is known about the metabolic connectivity of epileptogenic networks involved. This study therefore aimed to evaluate the association between metabolic connectivity and seizure outcome in surgically treated TLE.
Methods
The study included 107 right-handed patients that had undergone a presurgical interictal 18F-FDG PET assessment followed by an anterior temporal lobectomy and were classified according to seizure outcome 2 years after surgery. Metabolic connectivity was evaluated by seed correlation analysis in left and right epilepsy patients with a Class Engel IA or > IA outcome and compared to age-, sex- and handedness-matched healthy controls.
Results
Increased metabolic connectivity was observed in the >IA compared to the IA group within the operated temporal lobe (respective clusters of 7.5 vs 3.3 cm3 and 2.6 cm3 vs 2.2 cm3 in left and right TLE), and to a lower extent with the contralateral temporal lobe (1.2 vs 0.7 cm3 and 1.7 cm3 vs 0.7 cm3 in left and right TLE). Seed correlations provided added value for the estimated individual performance of seizure outcome over the group comparisons in left TLE (AUC of 0.74 vs 0.67).
Conclusion
Metabolic connectivity is associated with outcome in surgically treated TLE with a strengthened epileptogenic connectome in patients with non-free-seizure outcomes. The added value of seed correlation analysis in left TLE underlines the importance of evaluating metabolic connectivity in network related diseases.
1. Introduction
18F-Fluoro-deoxy-glucose (18F-FDG) positron emission tomography (PET), during the interictal state, provides high sensitivity for detecting drug resistant temporal lobe epilepsy (TLE) related hypometabolism, with pre-surgical assessment detection ranging from 86 to 90% (Verger et al., 2018). 18F-FDG PET is thus a useful tool to identify the epileptogenic zone (EZ) in drug-resistant temporal epilepsy and provides a good prediction of prognostic seizure outcome in cases where hypometabolism is restricted to one lobe (Tomás et al., 2019). At the group level, PET hypometabolism and stereotactic electroencephalography (SEEG) defined epileptogenic zones were found to be concordant. However, as expected, hypometabolism was not limited to the EZ defined by SEEG (Guedj et al., 2015). Likewise, it has recently been shown that a gradient of PET hypometabolism is observed between non-involved as well as propagation, epileptogenic and lesional zones with 18F-FDG PET nevertheless showing good performance in defining the EZ (Lagarde et al., 2020). These findings are also consistent with the currently prevailing notion of epileptogenic and propagation networks (Bartolomei et al., 2017).
For the purposes of assessing these epileptic networks, it is important to consider PET metabolism as a network rather than a combination of regional metabolic measurements. Metabolic connectivity modelling aims to detect functionally interacting brain regions based on PET with 18F-FDG (Yakushev et al., 2017). Briefly, metabolic connectivity as modelled from 18F-FDG static PET data can be performed at the group-level using seed correlation or inter-regional correlation analysis (IRCA) (Sala & Perani, 2019), which allows to evaluate the direct local and overall correlations of a region of interest delineated by a data-driven approach (Lee et al., 2008). This approach is particularly suited to studying metabolic connectivity in a well-established pathological brain region, such as an identified EZ. The study of metabolic connectivity in TLE is of particular interest given the inherent limitations of available alternative examination approaches such as MRI, which is particularly compromised by magnetic artifacts affecting the temporal region (Kuzniecky et al., 1987) or surface electro-encephalography which is limited by spatial sampling bias at the expense of deep cortical regions, such as the internal temporal areas or sub-cortical structures (Koessler et al., 2015). Moreover, when compared to functional MRI data, static 18F-FDG-PET data can provide valuable information for studying brain connectivity, with respect to signal-to-noise ratios, variance concentration, and out-of-sample replication (Yakushev et al., 2017). Metabolic activity estimated by PET allows to circumvent issues related to neurovascular coupling inherent to the blood oxygen level-dependent MRI approach. Only very few studies that assess the metabolic connectivity in temporal lobe epilepsy have been published to date (Vanicek et al., 2016, Wang et al., 2019, Shim et al., 2020, Ren et al., 2021, Zhu et al., 2022, Cho et al., 2022). They predominantly involve a small number of epilepsy patients, gather left and right epilepsies, and use a metabolic connectivity approach based on graph theory analyses, without any a priori hypotheses, which potentially increases the number of false positives correlations obtained (Sala & Perani, 2019). Indeed, graph theory analyses do not require the definition of a selected region to study connectivity as opposed to the IRCA methods, which may increase the risk of statistical noise. Moreover, by only capturing pairwise information only (and not taking into account, the contribution of all remaining brain regions to the target associations), graph theory which does not rely on partial correlation analyses is unable to characterize the effects of multiple brain regions interacting together (Sala & Perani, 2019).
The current study therefore addresses these shortfalls by using seed correlation analysis to evaluate the association between metabolic connectivity and seizure outcome in a greater number of surgically treated TLE patients.
2. Material and methods
2.1. Population
We retrospectively identified all right-handed patients referred to our department for an interictal brain 18F-FDG PET as part of the pre-operative evaluation of a drug-resistant TLE and that subsequently underwent an anterior temporal lobectomy between May 2007 and June 2020. All the definitions of temporal lobe epilepsy were made after multidisciplinary case review conferences involving neurologists specialized in epilepsy, neurosurgeons, neuroradiologists, nuclear physicians and pathologists. A temporal lobe epilepsy was diagnosed after a consensual analysis of findings from clinical description of the seizure, recorded seizures on long term video-electro-encephalogram (EEG) recordings, pre-surgical MRI and 18F-FDG PET results and completed, when necessary, with stereotactic electro-encephalogram (SEEG). The absence of visible MRI structural abnormality did not preclude the diagnosis of medial temporal lobe epilepsy when other modalities were consistent with this diagnosis. At 2 years post-surgery patients were then classified by seizure outcome either as seizure-free (Engel 1A; Engel’s classification) or non-seizure-free (Engel, 1993). The study (Clinical Trials Ref: NCT05455047) was approved by the ethics committee of the Regional University Hospital of Nancy (n°333, November 15th, 2021) and complied with the principles of the Declaration of Helsinki.
A group of 33 healthy controls that were age-, sex- and handedness-matched to the TLE group (37.79 [29–47] years, 18 women) was extracted from a normal 18F-FDG-PET database (Clinical Trials Ref: NCT00484523) as approved by the ethics committee. These controls did not have any neurological and psychiatric diseases and had normal brain MRIs.
2.2. 18F-FDG PET acquisition and reconstruction
18F-FDG PET scans were performed according to current guidelines (Guedj et al., 2022) and under the same conditions for all included patients. 18F-FDG (150 MBq) was injected intravenously, during an interictal period, with patients awake and resting with closed eyes in a quiet environment. Evaluating the patient’s interictal status required a continuous supervision of the patient and started as soon as the patient arrived in the department before the injection, to ensure that 18F-FDG was not administered at an ictal/postictal stage. This continuous supervision was maintained until at least 20 min after the radiopharmaceutical administration and during the whole scanning procedure. Image acquisition was initiated 30 min after injection and stopped 15 min later. Images were reconstructed using the ordered subsets expectation maximization algorithm and corrected for attenuation using a CT transmission scan. Images of patients were acquired either with an analog camera (Biograph 6, Siemens®) as 4 iterations and 8 subsets and subsequently displayed as a 168 × 168 matrix with 2.7 × 2.7 × 2.7 voxels or with a digital camera (Vereos, Philips®) as 2 iterations and 10 subsets and subsequently displayed as a 256 × 256 matrix with 1 × 1 × 1 mm3 voxels, using reconstruction parameters currently validated in our department.
Healthy control acquisitions were performed with an analog camera (Discovery ST, GE Healthcare, Waukesha, WI). Details of reconstruction processes have been reported elsewhere (Lagarde et al., 2020).
2.3. 18F-FDG PET analysis and metabolic connectivity
Brain statistical analysis was performed at the voxel level using the SPM12 software (Wellcome Department of Cognitive Neurology, University College, London, UK) to compare groups of patients with different outcomes (Engel class IA and > IA) to the group of healthy subjects, with age and sex considered as covariates. Right and left epilepsies were analyzed separately to identify the lateralization effect(s) on seizure outcome (Chassoux et al., 2016). PET images were initially spatially normalized onto the Montreal Neurological Institute (MNI) atlas. Dimensions of the resulting voxels were 2 × 2 × 2 mm. Images were then smoothed with a Gaussian filter (8 mm full width at half-maximum) to blur individual variations in gyral anatomy and to minimize differences in spatial resolution between the different PET systems. Intensity normalization was performed using proportional scaling to overall activity.
Two-group comparisons were initially performed between the groups of patients with different outcomes and the healthy controls. The significance threshold was set at p < 0.001, and all reported clusters were corrected for cluster volume based on Monte-Carlo simulations to avoid type II errors (Lieberman & Cunningham, 2009).
To evaluate metabolic connectivity, seed correlation analysis was carried out according to the procedure validated by Lee et al.(Lee et al., 2008), using the same extracted cluster at the individual level as the covariate for Engel class IA and > IA groups. In detail, intersection of clusters obtained after the two comparisons between the two patient outcome groups and healthy subjects, namely the seed region, was used as a covariate respectively for left and right epilepsies. Mean values of each individual extracted cluster were then used as interacted covariates to identify regions with significant voxel‐wise negative/positive correlations between patients in each outcome group and the healthy controls. Results were expressed as an increase of positive or negative connectivity. Nuisance covariates and thresholds were identical to those previously detailed for group SPM(T) map comparisons. The precise locations of the clusters in the MNI space were obtained with the SPM xjView toolbox (http://www.alivelearn.net/xjview) and according to the Automated Anatomical Labelling (AAL) atlas (Tzourio-Mazoyer et al., 2002).
To confirm the results visualized with seed correlations, we performed a Sparse Inverse Correlation Estimation (SICE) which allows to analyze metabolic connectivity with partial correlations but without any a priori hypotheses. The detailed methods of this analysis are available in the Supplemental Appendices.
2.4. Estimated individual performances of seizure outcome
Estimated individual performances for patient outcome (Engel class IA vs Engel class > IA) were obtained by applying two different methods: a voxel-to-voxel-based and a seed correlation-based approach. The voxel-to-voxel individual approach extracted mean metabolism for each patient as significant hypometabolic clusters determined at the group level for the > 1A group compared to the healthy controls. The individual approach based on seed correlations computed the ratio between the mean value of metabolism in (i) clusters identified to have an increase in connectivity after seed correlation analysis determined at the group level after comparison with healthy subjects for > 1A group, and (ii) the seed region used as a covariate for the seed correlations.
2.5. Statistical analysis
Categorical variables are presented as numbers and percentages, and continuous variables as medians [1st;3rd quartiles]. For categorical variables, the significance of differences was determined by the chi-square test or Fisher’s exact test, and by Mann-Whitney tests for continuous variables, based on the assumption of normality. To evaluate performances of the group comparison and seed correlation approaches at the individual level for patient seizure outcomes, receiving operating characteristic (ROC) curves were calculated using areas under the curve (AUC) for left and right groups. A combined variable was generated to calculate the estimated performances of the combination of both approaches. Statistical analyses were performed using the IBM Corp Released 2012 (IBM SPSS Statistics for Windows, Version 21.0. Armonk, NY: IBM Corp.). A p value < 0.05 was considered significant.
3. Results
3.1. Patient characteristics
We retrospectively included 107 patients (37 [27–45] years old, 62 women) with a median interval of 340 [174;670] days between PET imaging and epileptic surgery. Two years post-surgery and based on the Engel classification, 74 patients were seizure-free (Class IA, 32 left epilepsies) whilst 33 patients had seizures (7 class IB patients, 2 with left epilepsy; 6 class ID patients, 1 with left epilepsy; 9 class II patients, 6 with left epilepsy; 8 class III patients, 5 with left epilepsy; 3 class IV patients, all with right epilepsy). Table 1 lists the clinical, MRI and pathology characteristics of our included population. No differences were observed between patient outcome groups with the exception that the duration of disease was longer in the class Engel IA group than in the non-seizure-free group (median duration of disease 22 vs 13 years, respectively, p = 0.01). All detailed characteristics of the included population are available in the Supplementary File.
Table 1.
Patient characteristics.
| All patients (n = 107, 46 left lateralized) |
Engel IA (n = 74, 32 left lateralized) |
Engel > IA (n = 33, 14 left lateralized) |
p value | |
|---|---|---|---|---|
| Age at evaluation (years-old) | 37 [27;45] | 39 [28;46] | 34 [27;39] | 0.08 |
| Sex (women) | 62 (58%) | 47 (64%) | 15 (45%) | 0.08 |
| Duration of disease (years) | 17 [8;33] | 22 [11;36] | 13 [5;22] | 0.01* |
| Age of epilepsy onset (years) | 15 [2;21] | 13 [6;20] | 18 [12;25] | 0.09 |
| Epilepsy type on electroclinical findings | 0.61 | |||
| Mesial | 83 (78%) | 59 (79%) | 24 (73%) | |
| Lateral | 20 (19%) | 13 (18%) | 7 (21%) | |
| Temporal plus | 4 (3%) | 2 (3%) | 2 (6%) | |
| MRI findings | 0.85 | |||
| Normal | 19 (18%) | 13 (18%) | 6 (18%) | |
| Hippocampal sclerosis | 48 (45%) | 34 (46%) | 14 (42%) | |
| Dysplasia | 12 (11%) | 9 (12%) | 3 (9%) | |
| Other abnormalities (cyst, sequel, polymicrogyria, doubtful lesion) | 27 (25%) | 17 (23%) | 10 (30%) | |
| Not available | 1 (1%) | 1 (1%) | 0 (0%) | |
| Histopathological findings | 0.50 | |||
| Normal | 7 (7%) | 5 (7%) | 2 (6%) | |
| Hippocampal sclerosis | 57 (53%) | 42 (57%) | 15 (45%) | |
| Dysplasia | 9 (8%) | 8 (11%) | 1 (3%) | |
| Other abnormalities (cyst, sequel, polymicrogyria) | 21 (20%) | 11 (15%) | 10 (30%) | |
| Not available | 13 (12%) | 8 (11%) | 5 (15%) |
P values for comparisons between the different outcome groups. * significant p-value.
3.2. Voxel-to-voxel group comparisons
Fig. 1 represents the voxel-to-voxel group comparisons between left IA, left > IA, right IA and right > IA patient groups and healthy subjects. As expected, compared to healthy controls, patients with temporal epilepsy had relatively decreased metabolism in operated temporal lobes. Clusters of hypometabolism were more extended in right TLE than in left TLE (respective cluster volumes of 12.8 and 11.0 cm3 for left IA and left > IA group vs 29.8 and 16.7 cm3 for right IA and right > IA group). There was a tendency to find larger temporal clusters in the left > IA group (4.8 cm3, T-voxel max at 6.5, x = -54, y = -2, z = -14) compared to the left IA group (3.5 cm3, T-voxel max at 6.5, x = -50, y = 6, z = -34). This was not the case for right epilepsy with 12.6 cm3 temporal clusters identified in the right > IA group (T-voxel max at 8.0, x = 60, y = -24, z = 0) versus 29.0 cm3 in the right IA group (T-voxel max at 9.6, x = 62, y = −16, z = −20). In all groups, the entire pathological epileptic temporal lobe was involved including the pole, the internal temporal region and the fusiform region. Classically reported remote occipital and fronto-orbital regions were also hypometabolic in all TLE patient groups. Interestingly, only left-lateralized epilepsies showed contralateral temporal hypometabolism which was more pronounced in the > IA group than in the IA group (1.7 cm3 vs 0.3 cm3). Importantly, as depicted in Fig. 1 and Table 2, there was no difference in the regions involved between groups IA and > IA. Details of identified clusters are given in Table 2.
Fig. 1.

Significant findings on whole-brain 3D-rendered volumes and main temporal clusters represented on slice sections of MRI template in the MNI space at a p-voxel value of 0.001 corrected for the cluster volume of voxel-to-voxel comparisons between the left IA (a) > IA (b) groups compared to healthy controls and the right IA (c) and > IA groups (d) compared to the healthy controls. Highlighted areas represent hypometabolic areas of TLE patients. [color].
Table 2.
Significant clusters of hypometabolism compared to healthy subjects based on voxel-to-voxel group comparisons for the left IA, left > IA, right IA and right > IA groups (p < 0.001, corrected for cluster volume).
| Cluster Volume (mm3) |
x | y | z | T-voxel max | |
|---|---|---|---|---|---|
| Left IA | |||||
| Temporal superior, medium and inferior, hippocampus, para-hippocampus, amygdalae, fusiform, temporal pole superior and medium | 3,485 | −50 | 6 | −34 | 6.5 |
| Temporal superior and medium, occipital medium, supra-marginal, parietal superior | 1,708 | −42 | −82 | −6 | 4.8 |
| Occipital superior, medium and inferior, cuneus, precuneus, lingual, calcarine | 4,985 | −14 | −96 | 0 | 6.6 |
| Contralateral occipital superior, medium and inferior, cuneus, lingual, calcarine | |||||
| Fronto-orbital superior | 113 | −12 | 36 | –32 | 7.1 |
| Fronto-orbital mesial, medium and inferior | 366 | −26 | 42 | −4 | 4.4 |
| Parietal superior, occipital superior | 86 | −18 | −84 | −52 | 4.8 |
| Insula, rolandic, inferior-opercular | 137 | −40 | 12 | 14 | 4.1 |
| Contralateral temporal medium and inferior | 294 | 60 | −16 | −18 | 4.8 |
| Contralateral temporal medium and inferior | 88 | 56 | −44 | −8 | 4.2 |
| Contralateral temporal superior | 211 | 60 | –22 | 2 | 5.0 |
| Contralateral fronto-orbital medium and inferior | 720 | 44 | 36 | −6 | 6.7 |
| Contralateral parietal superior | 99 | 42 | −60 | 64 | 4.0 |
| Contralateral pre and post central, rolandic, supramarginal | 479 | 52 | −20 | 28 | 5.2 |
| Left > IA | |||||
| Temporal superior, medium and inferior, hippocampus, para-hippocampus, fusiform, temporal pole superior and medium | 4,786 | −54 | −2 | −14 | 6.5 |
| Occipital superior, medium and inferior, cuneus, precuneus, lingual, calcarine | 2,142 | −14 | −92 | −4 | 5.9 |
| Contralateral occipital superior and inferior, cuneus, calcarine | |||||
| Occipital medium | 105 | −42 | −92 | −4 | 4.2 |
| Occipital medium and inferior | 109 | −42 | −76 | 4 | 3.7 |
| Fronto-orbital superior | 178 | −10 | 34 | –32 | 6.8 |
| Fronto-orbital medium and inferior | 441 | −28 | 40 | −2 | 4.1 |
| Pre and post central | 133 | −56 | −14 | 18 | 4.0 |
| Contralateral temporal superior, medium and inferior, temporal pole medium | 1,699 | 50 | −10 | −26 | 5.9 |
| Contralateral temporal medium and inferior | 75 | 72 | −18 | −24 | 3.9 |
| Contralateral fronto-orbital superior, medium and inferior, insula | 774 | 44 | 34 | −6 | 5.7 |
| Contralateral supra marginal, post central, rolandic | 439 | 52 | −18 | 24 | 4.3 |
| Contralateral cerebellum | 131 | 26 | −66 | −40 | 3.5 |
| Right IA | |||||
| Temporal superior, medium and inferior, temporal pole superior and medium, occipital superior, medium and inferior, lingual, fusiform, calcarine, hippocampus, parahippocampus, amygdalae, cuneus, precuneus, parietal superior and inferior, angular, supra-marginal, pre and post central, rolandic, insula, fronto-orbital inferior, thalamus, putamen and pallidum | 29,020 | 62 | −16 | −20 | 9.6 |
| Contralateral occipital superior, medium and inferior, calcarine, lingual and cuneus | |||||
| Frontal superior | 142 | 20 | 60 | 6 | 4.5 |
| Frontal inferior | 81 | 48 | 26 | 26 | 3.5 |
| Cerebellum | 111 | 26 | −62 | −40 | 4.2 |
| Cerebellum | 233 | 40 | −60 | −62 | 5.2 |
| Contralateral fronto-orbital medium, fronto-mesial superior | 172 | −10 | 58 | −2 | 3.9 |
| Right > IA | |||||
| Temporal superior, medium and inferior, temporal pole superior and medium, occipital medium, lingual, fusiform, hippocampus, parahippocampus, parietal superior and inferior, angular, supra-marginal, post central, rolandic, insula, fronto-orbital medium and inferior, putamen and pallidum | 12,558 | 60 | −24 | 0 | 8.0 |
| Contralateral fronto-orbital medium and frontal superior mesial | 219 | −10 | 56 | −4 | 4.6 |
| Occipital superior, medium and inferior, calcarine, cuneus | 3,471 | −12 | −98 | −4 | 6.7 |
| Contralateral occipital superior, medium and inferior, calcarine, cuneus, lingual | |||||
| Frontal superior and medium | 281 | 24 | 50 | 16 | 3.7 |
| Contralateral occipital medium and angular | 126 | −40 | −72 | 32 | 3.7 |
3.3. Seed correlations
Results from seed correlations are described in Fig. 2 and Table 3. Increased connectivity was mainly observed within the operated temporal lobe with greater connectivity identified in the > IA groups when compared to the IA groups. The greater connectivity of the > IA group was more frequently observed in left TLE than in right TLE (respective clusters of 3.3 cm3, T-voxel max at 5.1 vs 7.5 cm3, T-voxel max at 5.2 for left IA and left > IA groups, respective clusters of 2.2 cm3, T-voxel max at 4.6 vs 2.6 cm3, T-voxel max at 6.3 for right IA and right > IA groups). Contralateral temporal lobe connectivity was also observed, to a lesser extent, in all groups of patients with a tendency of finding higher connectivity in the > IA groups (respective clusters of 0.7 cm3, T-voxel max at 3.8 vs 1.2 cm3, T-voxel max at 4.9 for left IA and left > IA groups, respective clusters of 0.7 cm3, T-voxel max at 5.4 vs 1.7 cm3, T-voxel max at 6.0 for right IA and right > IA groups). All TLE patient groups showed decreased connectivity in the bilateral occipital region with a tendency to observe more decreased connectivity in the right > IA group (respective clusters of 1.1 cm3, T-voxel max at 4.7, 1.0 cm3, T-voxel max at 4.3, 0.9 cm3, T-voxel max at 4.4, and 2.6 cm3, T-voxel max at 4.7 for groups left IA, left > IA, right IA and right > IA).
Fig. 2.

Significant findings on 3D-rendered volumes at a p-voxel value of 0.001 corrected for cluster volume of seed correlations with increased and decreased connectivity for the left IA (a) and > IA (b) groups and the right IA (c) and > IA groups (d) compared to healthy controls (lower panel). [color].
Table 3.
Significant clusters of increased and decreased connectivity compared to healthy subjects and based on seed correlations of the left IA, left > IA, right IA and right > IA groups (p < 0.001, corrected for cluster volume).
| Cluster Volume (mm3) |
x | y | z | T-voxel max | |
|---|---|---|---|---|---|
| Left IA | |||||
| Increased connectivity | |||||
| Temporal superior, medium and inferior, temporo-polar superior and medium, parahippocampus, insula, caudate, putamen, fronto-orbital inferior | 2,375 | −30 | 14 | −20 | 5.1 |
| Temporal medium and inferior, hippocampus, fusiform, | 751 | −48 | −12 | −26 | 4.9 |
| Temporal superior, post-central | 166 | −62 | −16 | 2 | 3.6 |
| Hippocampus, parahippocampus | 366 | 0 | −24 | −20 | 3.5 |
| Medium cingulate | 360 | −12 | −16 | 44 | 3.7 |
| Contralateral temporal superior and medium, temporo-polar superior and medium, hippocampus, amygdalae, insula | 707 | 38 | 10 | −16 | 3.8 |
| Contralateral caudate, putamen | 605 | 24 | 16 | 22 | 3.7 |
| Contralateral fronto-orbital superior, medium and frontomesial | 193 | 12 | 70 | −4 | 3.8 |
| Contralateral insula and rolandic | 345 | 38 | −14 | 26 | 3.7 |
| Decreased connectivity | |||||
| Rectus, fronto-orbital superior | 244 | −4 | 48 | −24 | 4.6 |
| Occipital superior and medium, cuneus, lingual, calcarine | 833 | −24 | −98 | 2 | 4.7 |
| Parietal superior and inferior, post-central | 927 | −44 | 50 | 60 | 4.2 |
| Contralateral occipital superior, medium, cuneus | 250 | 20 | −100 | 12 | 3.4 |
| Contralateral lingual and calcarine | 290 | 18 | −74 | 2 | 3.9 |
| Contralateral frontal medium | 169 | 44 | 54 | 10 | 3.2 |
| Left > IA | |||||
| Increased connectivity | |||||
| Temporal superior, medium and inferior, temporo-polar superior and medium, parahippocampus, hippocampus, amygdalae, insula, putamen, fronto-orbital inferior, fusiform, lingual | 7,232 | −34 | 14 | −38 | 5.2 |
| Temporal superior, post-central, rolandic | 193 | −60 | −14 | 36 | 3.8 |
| Temporal medium | 119 | −50 | −54 | 10 | 3.6 |
| Anterior cingulate and contralateral anterior cingulate | 238 | 6 | 30 | 16 | 3.6 |
| Contralateral temporo-polar superior and medium, parahippocampus, hippocampus, fronto-orbital inferior, amygdalae, fusiform | 1,220 | 40 | 14 | −34 | 4.9 |
| Decreased connectivity | |||||
| Occipital superior and medium, calcarine, cuneus | 781 | −12 | −94 | 6 | 4.0 |
| Occipital medium, parietal superior and inferior | 247 | −26 | −58 | 44 | 4.3 |
| Parietal superior, post-central | 322 | 48 | −58 | 66 | 3.6 |
| Frontal medium, pre-central | 588 | −38 | 0 | 70 | 4.4 |
| Contralateral calcarine and lingual | 484 | 12 | −84 | 2 | 4.2 |
| Contralateral fronto-orbital inferior | 172 | 42 | 34 | −8 | 3.8 |
| Contralateral frontal medium, pre-central | 175 | 54 | 2 | 48 | 3.6 |
| Controlatéral parietal inferior, angular | 282 | 64 | −68 | 38 | 4.5 |
| Right IA | |||||
| Increased connectivity | |||||
| Temporal superior, medium and inferior, temporo-polar superior and medium, parahippocampus, fusiform, insula, fronto-orbital inferior | 2,216 | 60 | −14 | −24 | 4.6 |
| Contralateral parahippocampus, hippocampus, amygalae | |||||
| Cerebellum | 129 | 20 | −48 | −40 | 4.2 |
| Anterior cingulate, caudate | 258 | 26 | 34 | 12 | 4.5 |
| Contralateral anterior cingulate and medium, caudate | |||||
| Contralateral temporal superior, medium and inferior, tempor-polar superior and medium, front-mesial superior | 718 | −26 | 64 | −30 | 5.4 |
| Contralateral cerebellum | 126 | −16 | −40 | −38 | 3.8 |
| Decreased connectivity | |||||
| Lingual, calcarine | 781 | 16 | −72 | −2 | 4.4 |
| Contralateral lingual, calcarine, cuneus, occipital superior | |||||
| Occipital superior and medium, parietal superior and angular | 127 | 36 | −80 | 42 | 3.4 |
| Precuneus, medium and posterior cingulate, calcarine | 695 | −4 | −62 | 24 | 4.2 |
| Controlatéral precuneus, cuneus, calcarine, posterior cingulate | |||||
| Precuneus | 280 | 4 | −76 | 62 | 4.8 |
| Parietal superior and inferior | 307 | 46 | −58 | 66 | 4.2 |
| Frontal superior | 174 | 36 | −4 | 74 | 3.8 |
| Contralateral frontal medium, pre-central | 413 | −48 | 8 | 54 | 4.6 |
| Contralateral parietal superior and inferior, angular | 190 | −34 | −78 | 48 | 3.3 |
| Contralateral parietal superior and inferior | 118 | −40 | −60 | 62 | 3.8 |
| Right > IA | |||||
| Increased connectivity | |||||
| Temporal superior, medium and inferior, temporo-polar superior and medium, fusiform, parahippocampus, hippocampus | 2,636 | 62 | −14 | –22 | 6.3 |
| Contralateral temporal inferior, temporo-polar superior and medium, parahippocampus, amygdalae, fronto-orbital inferior | 1,412 | −36 | 12 | −34 | 6.0 |
| Controlatéral temporal inferior, fusiform | 154 | −40 | –32 | –22 | 3.8 |
| Contralateral temporal superior, temporo-polar superior, insula | 131 | −46 | 10 | −14 | 3.4 |
| Contralateral anterior and medium cingulate, hippocampus, caudate | 358 | −20 | −2 | 38 | 4.2 |
| Anterior cingulate | |||||
| Decreased connectivity | |||||
| Occipital superior, medium and inferior, lingual, cuneus | 2,592 | –32 | −94 | −4 | 4.7 |
| Contralateral occipital medium, inferior, calcarine, fusiform | |||||
| Cerebellum, fusiform | 146 | 26 | −82 | −20 | 3.3 |
| Contralateral temporal medium and inferior | 190 | −62 | −36 | −10 | 3.6 |
| Contralateral frontal superior and fronto-orbital superior | 110 | –22 | 54 | −2 | 4.3 |
| Contralateral supramarginal, angular, parietal inferior, temporal medium | 383 | −60 | −56 | 32 | 4.1 |
| Parietal inferior, angular, temporal superior and medium | 447 | 64 | −58 | 34 | 4.6 |
| Post-central | 110 | 38 | −34 | 72 | 3.6 |
| Contralateral frontal medium, precentral | 390 | −42 | 6 | 60 | 4.8 |
3.4. Estimated performances of seizure outcome at the individual level
For left TLE, the combination of individual information from the voxel-to-voxel group comparisons and the seed correlation analysis provided an AUC of 0.74, which was higher than the AUC obtained at the individual level from the voxel-to-voxel group comparisons only (AUC of 0.67), as depicted in Fig. 3. No significant AUCs were obtained for the voxel-to-voxel group comparisons and the seed correlation analysis for right TLE.
Fig. 3.
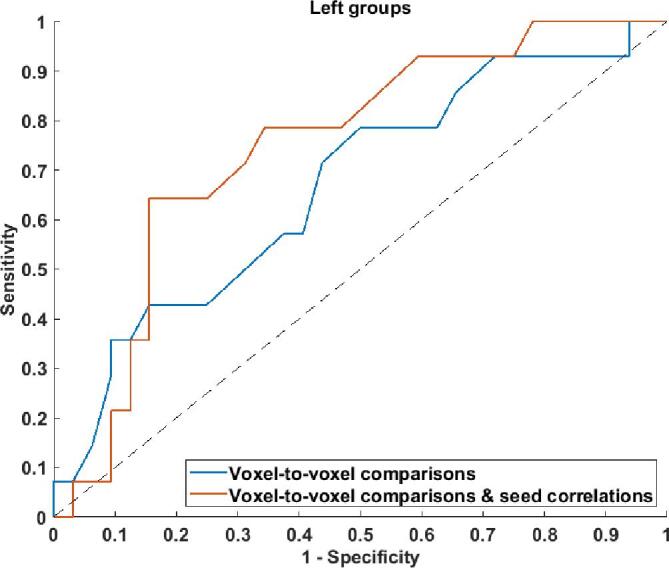
ROC curves for individual estimated performances of patient seizure outcomes for the voxel-to-voxel group comparisons (blue curve) and for the combination of voxel-to-voxel group comparisons and the seed correlation-based method (red curve) for left temporal lobe epilepsy. [color]. (For interpretation of the references to color in this figure legend, the reader is referred to the web version of this article.)
4. Discussion
The current study substantiates the potential merits of applying observations of metabolic connectivity that are associated with better postoperative seizure outcomes in patients with drug-resistant TLE to the pre-surgical patient evaluation. Patients with Engel classification > IA presented more marked temporal connectivity within the operated lobe and to a lesser extent with the contralateral temporal lobe than patient in the Engel IA groups, suggesting that patients with a non-free seizure outcome exhibited strengthened brain connections. Moreover, the seed correlation method provided an added value for estimating individual performances of seizure outcome over voxel-to-voxel group comparisons in left TLE.
The study population was selected based on robust selection criteria; the 107 TLE patients included were all right-handed and underwent the same anterior temporal lobectomy surgery with a minimum 2-year follow-up. Patients were compared to age-, sex- and handedness-matched healthy controls, to mitigate for any potential handedness effects on functional connectivity (Bettus et al., 2010). Importantly, left and right epilepsies were studied separately since the lateralization of epilepsy is known to influence 18F-FDG PET findings (Chassoux et al., 2016). As summarized in Table 1, approximately-one third of our patients were not seizure-free after anterior temporal lobectomy. This is a similar proportion to that reported in the literature (McIntosh et al., 2004). No differences in clinical parameters were observed between the IA and > IA groups with the exception that the IA groups had a longer duration of disease. A longer duration of disease has been previously described as a predicative factor of a seizure-free state after surgery (Morgan et al., 2017). Moreover, discrepancies between MRI and histopathological findings were observed. In particular a higher number of patients with normal MRI than patients with normal histopathological findings (18% vs 7%, Table 1). This discrepancy between a high rate of negative MRI and a low rate of negative histology results is a common finding in epilepsy surgery (43% negative by MRI (McGonigal et al., 2007) vs 8% negative by histology (Blumcke et al., 2017)). This strengthens the requirements for another imaging modality like 18F-FDG PET in multidisciplinary epilepsy case review meetings, as 41.5% of MRI negative epilepsies include different types of intractable epilepsies that present with regional hypometabolism on PET (Menon et al., 2015).
In the present study, the voxel-to-voxel group comparisons typically detected hypometabolism centered in the involved pathological temporal lobe but not limited to the epileptogenic zone (Guedj et al., 2015). There were no clear differences in the regions involved between groups IA and > IA and no superior volume of hypometabolism in > IA groups when compared to the IA groups (respective cluster volumes of 12.8 and 11.0 cm3 for left IA and left > IA groups vs 29.8 and 16.7 cm3 for right IA and right > IA groups, Table 2). Previous PET studies have reported a higher risk of failure in series of TLE patients presenting with extra-temporal metabolism (Cahill et al., 2019, Chassoux et al., 2017, Tang et al., 2020). Interestingly, our current study found a tendency towards a higher extent of contralateral temporal hypometabolism volumes in the > IA group compared to the IA group (contralateral temporal volumes of 1.7 cm3 vs 0.3 cm3, respectively, Table 2) in left TLE but not right TLE. In terms of lateralization, a larger extent of hypometabolism was observed in right-lateralized compared to left-lateralized epilepsy, suggesting that the pathology involves distinct, cerebral hemisphere specific, epileptogenic networks. This confirms that it is essential to evaluate left- and right-lateralized epilepsy separately according to lateralization as was indeed the case in the present study. Similar results of more extended hypometabolisms in right-lateralized TLE have been previously reported in the literature (Chassoux et al., 2016).
One of the major findings of the present study is the increased connectivity within the operated temporal lobe observed in the > IA groups compared to the IA groups in both left and right TLE (clusters of 7.5 vs 3.3 cm3 and 2.6 cm3 vs 2.2 cm3 for left and right TLE respectively, Table 3). This is consistent with recent metabolic connectivity studies based on graphical analyses, gathering left-lateralized and right-lateralized patients, that reported higher functional connectivity in patients who were not seizure-free (Cho et al., 2022, Ren et al., 2021, Yu et al., 2018). The main hypothesis is that the persistent seizure group has over-excitatory brain activity compared to seizure-free patients as indicated by strengthened brain connections, allowing seizures to occur and to propagate more readily. Thus, even after anterior temporal lobectomy and removal of the epileptogenic zone, the epileptogenic network may persist in patients with increased connectivity with these network differences contributing to the surgical outcomes of TLE patients. Indeed, Cho et al. observed a more increased assortative coefficient in non-seizure-free patients, implicating that the epileptogenic network is more robust to removal of the epileptogenic zone (Cho et al., 2022). In our study, these findings cannot be explained by the longer duration of disease observed in IA patients compared to > IA patients since it may have led to stronger connections in IA patients. Interestingly, Ren et al (Ren et al., 2021) report the involvement of the same temporal regions as in our study i.e. an increased brain connection within the fusiform gyrus and the temporal inferior gyrus in > IA patients compared to healthy controls (see Table 3). This is also in line with recent effective connectivity studies using SEEG cortico-cortical event related potentials showing that the fusiform gyrus is an important hub between the medial temporal module and neocortical temporal structures (Krieg et al., 2017), especially in the dominant temporal lobe where it may act as an interface between the lexical and semantic networks (Aron et al., 2021). Our study also noted increased connectivity between the pathological and contralateral temporal lobes in the > IA groups which is consistent with reports in the recent literature (Ren et al., 2021). This poorer post-surgical outcome in TLE patients with higher functional connectivity has been previously described based on electrophysiological findings (Lagarde et al., 2018). Moreover, we found that the increased connectivity involved specific temporal regions namely the temporo-polar medium, the fusiform and the temporal inferior region. This is consistent with TLE patient connectivity results reported from diffusion-tensor imaging (DTI), albeit that DTI evaluates structural connectivity whereas metabolic connectivity is more representative of functional connectivity (Besson et al., 2014).
We observed decreased connectivity between the pathological temporal lobe and the posterior-occipital regions in all of our patient groups. Altered connectivity in occipital areas of TLE patients has been previously reported by MRI (Yasuda et al., 2015), specifically in mesial TLE with diffusion tensor imaging (Xu et al., 2014). Loss of occipital connectivity in epilepsy patients may explain the impaired visuospatial attention reported in these patients (Wills et al., 2021).
The estimated individual performances of patient seizure outcomes were enhanced when using combined data from the voxel-to-voxel group comparisons and a seed correlation approach in left TLE (AUC of 0.74 vs 0.66), suggesting that metabolic connectivity may provide additional value to evaluating outcome in surgically treated TLE patients. This is in contrast to right TLE seizure outcome for which we did not find any significant AUCs from the voxel-to-voxel group comparisons or the seed correlations. It is well established that right TLE, which presumably affects the minor hemisphere in right-handed patients, exhibits different functional connectivity when compared to left-lateralized epilepsy, this suggests the presence of more compensatory mechanisms from different regions opposing the damaged neuronal tissue subsequent to the seizures (see more contralateral temporal connectivity and a decrease in connectivity in the right > IA group, Table 3) (Vanicek et al., 2016). We attempted to confirm results obtained from the seed correlation analysis by applying the sparse inverse covariance estimation (SICE) method. The SICE estimates the underlying local and overall connectivity matrix by using partial correlations whilst simultaneously imposing sparsity to increase statistical robustness in light of the low number of observations. The SICE method does not require an a priori hypothesis [6]. Results from the SICE are similar to those from the seed correlation analysis, the connectivity within the pathological temporal lobe was clearly different between the IA groups and > IA groups (Supplemental Figs. 1 and 2). Indeed, when compared to healthy controls, an increased connectivity was also observed within the pathological epileptic temporal lobe of the > IA group in left-lateralized epilepsies (from T-score of 5.4 in the left IA group to T-score of 40.1 in the left > IA group) and in right-lateralized epilepsies (from T-score of 14.8 in the right IA group to T-score of 82.4 in the right > IA group). Future work evaluating SICE to estimate seizure outcome of right TLE, at the individual level and computing non-binary inverse covariance matrix (IC) estimated by maximum likelihood estimation (MLE) approaches, is warranted (Huang et al., 2010, Titov et al., 2017). However, these individual-level analyses require a larger number of patients and are currently only used to distinguish very different populations (i.e. Alzheimer diseases vs normal controls) (Huang et al., 2010, Titov et al., 2017).
The present study suffers from several limitations. Even though patients were continuously supervised before and during the whole scanning procedure to exclude a potential ictal stage, we did not perform the additional continuous EEG recording that is suggested in the recent European guidelines for 18F-FDG PET imaging (Guedj et al., 2022). PET acquisitions were obtained from two different PET scanners with different spatial resolutions and compared to healthy controls whose PET scan acquisitions were performed on a third type of PET scan. Even though this allowed to confirm the extrapolation of our results, it may have led to the detection of epileptic foci with reduced sensitivity. We applied an adapted smoothing to limit this potential bias. Then, for the voxel-to-voxel group comparisons, we deliberately did not search for hypermetabolism in our population because hypometabolism areas were widespread and proportional scaling normalization may have led to potential false positive findings (Yakushev et al., 2008). Finally, it would have been very interesting to identify distinct connectivity metabolic profiles for the different types of lesional epilepsy. Such analyses will however require further studies on a larger number of patients.
5. Conclusion
To conclude, this study identified different metabolic connectivity profiles based on right-handed TLE patient post-operative seizure outcomes using seed correlation analysis which is specifically adapted to temporal epilepsy with well-defined epileptic zones. Patients with Engel classification > IA presented with more marked temporal connectivity within the operated and the contralateral temporal lobe than patients from the Engel IA groups, suggesting that strong brain connections in the epileptic connectome are associated with a non-free-seizure outcome. The straightforward seed correlation analysis method provides an added value for the individual estimation of patient outcome over voxel-to-voxel group comparisons in left surgically treated TLE. This reinforces the fact that brain 18F-FDG PET imaging should be investigated by including the study of metabolic connectivity in network related diseases.
Funding
This research did not receive any specific grants from funding agencies in the public, commercial, or not-for-profit sectors.
7. Ethics approval
The study (Clinical Trials Ref: NCT05455047) was approved by the ethics committee of the Regional University Hospital of Nancy (n°333, November 15th, 2021) and complied with the principles of the Declaration of Helsinki.
8. Patient consent
Informed consent was obtained from all individual participants included in the study.
9. Permission to reproduce material from other sources
Not applicable.
10. Author contribution statement
All authors contributed significantly to this work.
We confirm that we have read the Journal's position on issues pertaining to ethical publication and confirm that this report complies with those guidelines.
CRediT authorship contribution statement
Matthieu Doyen: Conceptualization, Data curation, Formal analysis, Investigation, Methodology, Writing – original draft. Mohammad B. Chawki: Conceptualization, Data curation, Formal analysis, Investigation, Methodology. Sébastien Heyer: Conceptualization, Data curation, Formal analysis, Investigation, Methodology. Eric Guedj: Writing – review & editing. Véronique Roch: Conceptualization, Data curation, Formal analysis, Investigation, Methodology. Pierre-Yves Marie: Writing – review & editing. Louise Tyvaert: Writing – review & editing. Louis Maillard: Conceptualization, Data curation, Formal analysis, Investigation, Methodology, Writing – review & editing. Antoine Verger: Conceptualization, Data curation, Formal analysis, Investigation, Methodology, Writing – original draft, Writing – review & editing.
Declaration of Competing Interest
The authors declare that they have no known competing financial interests or personal relationships that could have appeared to influence the work reported in this paper.
Acknowledgement
The authors thank the Nancyclotep imaging platform for its technical and financial support.
Footnotes
Supplementary data to this article can be found online at https://doi.org/10.1016/j.nicl.2022.103210.
Contributor Information
Matthieu Doyen, Email: matthieu.doyen@univ-lorraine.fr.
Mohammad B. Chawki, Email: momodestains@yahoo.fr.
Sébastien Heyer, Email: s.heyer@chru-nancy.fr.
Eric Guedj, Email: eric.guedj@univ-amu.fr.
Véronique Roch, Email: v.roch@chru-nancy.fr.
Pierre-Yves Marie, Email: py.marie@chru-nancy.fr.
Louise Tyvaert, Email: l.tyvaert@chru-nancy.fr.
Louis Maillard, Email: l.maillard@chru-nancy.fr.
Antoine Verger, Email: a.verger@chru-nancy.fr.
Appendix A. Supplementary data
The following are the Supplementary data to this article:
Supplementary figure 1.

Supplementary figure 2.

Data availability
Data will be made available on request.
References
- Aron O., Jonas J., Colnat-Coulbois S., Maillard L. Language mapping using stereo electroencephalography: A review and expert opinion. Front. Hum. Neurosci. 2021;15 doi: 10.3389/fnhum.2021.619521. [DOI] [PMC free article] [PubMed] [Google Scholar]
- Bartolomei F., Lagarde S., Wendling F., McGonigal A., Jirsa V., Guye M., Bénar C. Defining epileptogenic networks: Contribution of SEEG and signal analysis. Epilepsia. 2017;58(7):1131–1147. doi: 10.1111/epi.13791. [DOI] [PubMed] [Google Scholar]
- Besson P., Dinkelacker V., Valabregue R., Thivard L., Leclerc X., Baulac M., Sammler D., Colliot O., Lehéricy S., Samson S., Dupont S. Structural connectivity differences in left and right temporal lobe epilepsy. NeuroImage. 2014;100:135–144. doi: 10.1016/j.neuroimage.2014.04.071. [DOI] [PubMed] [Google Scholar]
- Bettus G., Bartolomei F., Confort-Gouny S., Guedj E., Chauvel P., Cozzone P.J., Ranjeva J.-P., Guye M. Role of resting state functional connectivity MRI in presurgical investigation of mesial temporal lobe epilepsy. J. Neurol. Neurosurg. Psychiatry. 2010;81(10):1147–1154. doi: 10.1136/jnnp.2009.191460. [DOI] [PubMed] [Google Scholar]
- Blumcke I., Spreafico R., Haaker G., Coras R., Kobow K., Bien C.G., Pfäfflin M., Elger C., Widman G., Schramm J., Becker A., Braun K.P., Leijten F., Baayen J.C., Aronica E., Chassoux F., Hamer H., Stefan H., Rössler K., Thom M., Walker M.C., Sisodiya S.M., Duncan J.S., McEvoy A.W., Pieper T., Holthausen H., Kudernatsch M., Meencke H.J., Kahane P., Schulze-Bonhage A., Zentner J., Heiland D.H., Urbach H., Steinhoff B.J., Bast T., Tassi L., Lo Russo G., Özkara C., Oz B., Krsek P., Vogelgesang S., Runge U., Lerche H., Weber Y., Honavar M., Pimentel J., Arzimanoglou A., Ulate-Campos A., Noachtar S., Hartl E., Schijns O., Guerrini R., Barba C., Jacques T.S., Cross J.H., Feucht M., Mühlebner A., Grunwald T., Trinka E., Winkler P.A., Gil-Nagel A., Toledano Delgado R., Mayer T., Lutz M., Zountsas B., Garganis K., Rosenow F., Hermsen A., von Oertzen T.J., Diepgen T.L., Avanzini G. Histopathological findings in brain tissue obtained during epilepsy surgery. N. Engl. J. Med. 2017;377(17):1648–1656. doi: 10.1056/NEJMoa1703784. [DOI] [PubMed] [Google Scholar]
- Cahill V., Sinclair B., Malpas C.B., McIntosh A.M., Chen Z., Vivash L.E., O’Shea M.F., Wilson S.J., Desmond P.M., Berlangieri S.U., Hicks R.J., Rowe C.C., Morokoff A.P., King J.A., Fabinyi G.C., Kaye A.H., Kwan P., Berkovic S.F., O’Brien T.J. Metabolic patterns and seizure outcomes following anterior temporal lobectomy : Cahill et al.: Metabolic Patterns. Ann. Neurol. 2019;85(2):241–250. doi: 10.1002/ana.25405. [DOI] [PubMed] [Google Scholar]
- Chassoux F., Artiges E., Semah F., Desarnaud S., Laurent A., Landre E., Gervais P., Devaux B., Helal O.B. Determinants of brain metabolism changes in mesial temporal lobe epilepsy. Epilepsia. 2016;57(6):907–919. doi: 10.1111/epi.13377. [DOI] [PubMed] [Google Scholar]
- Chassoux F., Artiges E., Semah F., Laurent A., Landré E., Turak B., Gervais P., Helal B.-O., Devaux B. 18F-FDG-PET patterns of surgical success and failure in mesial temporal lobe epilepsy. Neurology. 2017;88(11):1045–1053. doi: 10.1212/WNL.0000000000003714. [DOI] [PubMed] [Google Scholar]
- Cho K.H., Park K.M., Lee H., Cho H., Lee D.A., Heo K., Kim S.E. Metabolic network is related to surgical outcome in temporal lobe epilepsy with hippocampal sclerosis : A brain FDG-PET study. J. Neuroimaging. 2022;32(2):300–313. doi: 10.1111/jon.12941. [DOI] [PubMed] [Google Scholar]
- Engel J. Update on surgical treatment of the epilepsies: Summary of The Second International Palm Desert Conference on the Surgical Treatment of the Epilepsies (1992) Neurology. 1993;43(8) doi: 10.1212/wnl.43.8.1612. [DOI] [PubMed] [Google Scholar]
- Guedj E., Bonini F., Gavaret M., Trébuchon A., Aubert S., Boucekine M., Boyer L., Carron R., McGonigal A., Bartolomei F. 18FDG-PET in different subtypes of temporal lobe epilepsy: SEEG validation and predictive value. Epilepsia. 2015;56(3):414–421. doi: 10.1111/epi.12917. [DOI] [PubMed] [Google Scholar]
- Guedj E., Varrone A., Boellaard R., Albert N.L., Barthel H., van Berckel B., Brendel M., Cecchin D., Ekmekcioglu O., Garibotto V., Lammertsma A.A., Law I., Peñuelas I., Semah F., Traub-Weidinger T., van de Giessen E., Van Weehaeghe D., Morbelli S. EANM procedure guidelines for brain PET imaging using [18F]FDG, version 3. Eur. J. Nucl. Med. Mol. Imaging. 2022;49(2):632–651. doi: 10.1007/s00259-021-05603-w. [DOI] [PMC free article] [PubMed] [Google Scholar]
- Huang S., Li J., Sun L., Ye J., Fleisher A., Wu T., Chen K., Reiman E., Alzheimer’s Disease NeuroImaging Initiative Learning brain connectivity of Alzheimer’s disease by sparse inverse covariance estimation. NeuroImage. 2010;50(3):935–949. doi: 10.1016/j.neuroimage.2009.12.120. [DOI] [PMC free article] [PubMed] [Google Scholar]
- Koessler L., Cecchin T., Colnat-Coulbois S., Vignal J.-P., Jonas J., Vespignani H., Ramantani G., Maillard L.G. Catching the invisible : mesial temporal source contribution to simultaneous EEG and SEEG recordings. Brain Topogr. 2015;28(1):5–20. doi: 10.1007/s10548-014-0417-z. [DOI] [PubMed] [Google Scholar]
- Krieg J., Koessler L., Jonas J., Colnat-Coulbois S., Vignal J.-P., Bénar C.G., Maillard L.G. Discrimination of a medial functional module within the temporal lobe using an effective connectivity model : A CCEP study. NeuroImage. 2017;161:219–231. doi: 10.1016/j.neuroimage.2017.07.061. [DOI] [PubMed] [Google Scholar]
- Kuzniecky R., de la Sayette V., Ethier R., Melanson D., Andermann F., Berkovic S., Robitaille Y., Olivier A., Peters T., Feindel W. Magnetic resonance imaging in temporal lobe epilepsy : Pathological correlations. Ann. Neurol. 1987;22(3):341–347. doi: 10.1002/ana.410220310. [DOI] [PubMed] [Google Scholar]
- Lagarde S., Roehri N., Lambert I., Trebuchon A., McGonigal A., Carron R., Scavarda D., Milh M., Pizzo F., Colombet B., Giusiano B., Medina Villalon S., Guye M., Bénar C.-G., Bartolomei F. Interictal stereotactic-EEG functional connectivity in refractory focal epilepsies. Brain. 2018;141(10):2966–2980. doi: 10.1093/brain/awy214. [DOI] [PubMed] [Google Scholar]
- Lagarde S., Boucekine M., McGonigal A., Carron R., Scavarda D., Trebuchon A., Milh M., Boyer L., Bartolomei F., Guedj E. Relationship between PET metabolism and SEEG epileptogenicity in focal lesional epilepsy. Eur. J. Nucl. Med. Mol. Imaging. 2020;47(13):3130–3142. doi: 10.1007/s00259-020-04791-1. [DOI] [PubMed] [Google Scholar]
- Lee D.S., Kang H., Kim H., Park H., Oh J.S., Lee J.S., Lee M.C. Metabolic connectivity by interregional correlation analysis using statistical parametric mapping (SPM) and FDG brain PET; methodological development and patterns of metabolic connectivity in adults. Eur. J. Nucl. Med. Mol. Imaging. 2008;35(9):1681–1691. doi: 10.1007/s00259-008-0808-z. [DOI] [PubMed] [Google Scholar]
- Lieberman M.D., Cunningham W.A. Type I and Type II error concerns in fMRI research : Re-balancing the scale. Soc. Cognit. Affect. Neurosci. 2009;4(4):423–428. doi: 10.1093/scan/nsp052. [DOI] [PMC free article] [PubMed] [Google Scholar]
- McGonigal A., Bartolomei F., Regis J., Guye M., Gavaret M., Fonseca A.-T.-D., Dufour H., Figarella-Branger D., Girard N., Peragut J.-C., Chauvel P. Stereoelectroencephalography in presurgical assessment of MRI-negative epilepsy. Brain. 2007;130(12):3169–3183. doi: 10.1093/brain/awm218. [DOI] [PubMed] [Google Scholar]
- McIntosh A.M., Kalnins R.M., Mitchell L.A., Fabinyi G.C.A., Briellmann R.S., Berkovic S.F. Temporal lobectomy : Long-term seizure outcome, late recurrence and risks for seizure recurrence. Brain: A J. Neurol. 2004;127(Pt 9):2018–2030. doi: 10.1093/brain/awh221. [DOI] [PubMed] [Google Scholar]
- Menon R.N., Radhakrishnan A., Parameswaran R., Thomas B., Kesavadas C., Abraham M., Vilanilam G., Sarma S.P. Does F-18 FDG-PET substantially alter the surgical decision-making in drug-resistant partial epilepsy? Epilep. Behav. E&B. 2015;51:133–139. doi: 10.1016/j.yebeh.2015.07.004. [DOI] [PubMed] [Google Scholar]
- Morgan V.L., Englot D.J., Rogers B.P., Landman B.A., Cakir A., Abou-Khalil B.W., Anderson A.W. Magnetic resonance imaging connectivity for the prediction of seizure outcome in temporal lobe epilepsy. Epilepsia. 2017;58(7):1251–1260. doi: 10.1111/epi.13762. [DOI] [PMC free article] [PubMed] [Google Scholar]
- Ren S., Huang Q., Bao W., Jiang D., Xiao J., Li J., Xie F., Guan Y., Feng R., Hua F. Metabolic brain network and surgical outcome in temporal lobe epilepsy : a graph theoretical study based on 18F-fluorodeoxyglucose PET. Neuroscience. 2021;478:39–48. doi: 10.1016/j.neuroscience.2021.10.012. [DOI] [PubMed] [Google Scholar]
- Sala A., Perani D. Brain molecular connectivity in neurodegenerative diseases : recent advances and new perspectives using positron emission tomography. Front. Neurosci. 2019;13:617. doi: 10.3389/fnins.2019.00617. [DOI] [PMC free article] [PubMed] [Google Scholar]
- Shim H.-K., Lee H.-J., Kim S.E., Lee B.I., Park S., Park K.M. Alterations in the metabolic networks of temporal lobe epilepsy patients: A graph theoretical analysis using FDG-PET. NeuroImage. Clin. 2020;27 doi: 10.1016/j.nicl.2020.102349. [DOI] [PMC free article] [PubMed] [Google Scholar]
- Tang Y., Liao G., Li J., Long T., Li Y., Feng L., Chen D., Tang B., Hu S. FDG-PET profiles of extratemporal metabolism as a predictor of surgical failure in temporal lobe epilepsy. Front. Med. 2020;7 doi: 10.3389/fmed.2020.605002. [DOI] [PMC free article] [PubMed] [Google Scholar]
- Titov D., Diehl-Schmid J., Shi K., Perneczky R., Zou N., Grimmer T., Li J., Drzezga A., Yakushev I. Metabolic connectivity for differential diagnosis of dementing disorders. J. Cereb. Blood Flow Metab. 2017;37(1):252–262. doi: 10.1177/0271678X15622465. [DOI] [PMC free article] [PubMed] [Google Scholar]
- Tomás J., Pittau F., Hammers A., Bouvard S., Picard F., Vargas M.I., Sales F., Seeck M., Garibotto V. The predictive value of hypometabolism in focal epilepsy : A prospective study in surgical candidates. Eur. J. Nucl. Med. Mol. Imaging. 2019;46(9):1806–1816. doi: 10.1007/s00259-019-04356-x. [DOI] [PubMed] [Google Scholar]
- Tzourio-Mazoyer N., Landeau B., Papathanassiou D., Crivello F., Etard O., Delcroix N., Mazoyer B., Joliot M. Automated anatomical labeling of activations in SPM using a macroscopic anatomical parcellation of the MNI MRI single-subject brain. NeuroImage. 2002;15(1):273–289. doi: 10.1006/nimg.2001.0978. [DOI] [PubMed] [Google Scholar]
- Vanicek T., Hahn A., Traub-Weidinger T., Hilger E., Spies M., Wadsak W., Lanzenberger R., Pataraia E., Asenbaum-Nan S. Insights into intrinsic brain networks based on graph theory and PET in right- compared to left-sided temporal lobe epilepsy. Sci. Rep. 2016;6:28513. doi: 10.1038/srep28513. [DOI] [PMC free article] [PubMed] [Google Scholar]
- Verger A., Lagarde S., Maillard L., Bartolomei F., Guedj E. Brain molecular imaging in pharmacoresistant focal epilepsy: Current practice and perspectives. Revue Neurol. 2018;174(1–2):16–27. doi: 10.1016/j.neurol.2017.05.001. [DOI] [PubMed] [Google Scholar]
- Wang K.-L., Hu W., Liu T.-H., Zhao X.-B., Han C.-L., Xia X.-T., Zhang J.-G., Wang F., Meng F.-G. Metabolic covariance networks combining graph theory measuring aberrant topological patterns in mesial temporal lobe epilepsy. CNS Neurosci. Ther. 2019;25(3):396–408. doi: 10.1111/cns.13073. [DOI] [PMC free article] [PubMed] [Google Scholar]
- Wills K.E., González H.F.J., Johnson G.W., Haas K.F., Morgan V.L., Narasimhan S., Englot D.J. People with mesial temporal lobe epilepsy have altered thalamo-occipital brain networks. Epilepsy Behav. 2021;115 doi: 10.1016/j.yebeh.2020.107645. [DOI] [PMC free article] [PubMed] [Google Scholar]
- Xu Y., Qiu S., Wang J., Liu Z., Zhang R., Li S., Cheng L., Liu Z., Wang W., Huang R. Disrupted topological properties of brain white matter networks in left temporal lobe epilepsy : A diffusion tensor imaging study. Neuroscience. 2014;279:155–167. doi: 10.1016/j.neuroscience.2014.08.040. [DOI] [PubMed] [Google Scholar]
- Yakushev I., Landvogt C., Buchholz H.-G., Fellgiebel A., Hammers A., Scheurich A., Schmidtmann I., Gerhard A., Schreckenberger M., Bartenstein P. Choice of reference area in studies of Alzheimer’s disease using positron emission tomography with fluorodeoxyglucose-F18. Psych. Res. 2008;164(2):143–153. doi: 10.1016/j.pscychresns.2007.11.004. [DOI] [PubMed] [Google Scholar]
- Yakushev I., Drzezga A., Habeck C. Metabolic connectivity : Methods and applications. Curr. Opin. Neurol. 2017;30(6):677–685. doi: 10.1097/WCO.0000000000000494. [DOI] [PubMed] [Google Scholar]
- Yasuda C.L., Chen Z., Beltramini G.C., Coan A.C., Morita M.E., Kubota B., Bergo F., Beaulieu C., Cendes F., Gross D.W. Aberrant topological patterns of brain structural network in temporal lobe epilepsy. Epilepsia. 2015;56(12):1992–2002. doi: 10.1111/epi.13225. [DOI] [PubMed] [Google Scholar]
- Yu R., Park H.-J., Cho H., Ko A., Pae C., Oh M.-K., Kang H.-C., Kim H.D., Park E.-K., Shim K.-W., Kim D.S., Lee J.S. Interregional metabolic connectivity of 2-deoxy-2[18 F]fluoro-D-glucose positron emission tomography in vagus nerve stimulation for pediatric patients with epilepsy : A retrospective cross-sectional study. Epilepsia. 2018;59(12):2249–2259. doi: 10.1111/epi.14590. [DOI] [PubMed] [Google Scholar]
- Zhu Z., Zhang Z., Gao X., Feng L., Chen D., Yang Z., Hu S. Individual brain metabolic connectome indicator based on Jensen-Shannon divergence similarity estimation predicts seizure outcomes of temporal lobe epilepsy. Front. Cell Dev. Biol. 2022;9 doi: 10.3389/fcell.2021.803800. [DOI] [PMC free article] [PubMed] [Google Scholar]
Associated Data
This section collects any data citations, data availability statements, or supplementary materials included in this article.
Supplementary Materials
Data Availability Statement
Data will be made available on request.