Abstract
Genome sequencing of cancers often reveals mosaics of different subclones present in the same tumour1–3. Although these are believed to arise according to the principles of somatic evolution, the exact spatial growth patterns and underlying mechanisms remain elusive4,5. Here, to address this need, we developed a workflow that generates detailed quantitative maps of genetic subclone composition across whole-tumour sections. These provide the basis for studying clonal growth patterns, and the histological characteristics, microanatomy and microenvironmental composition of each clone. The approach rests on whole-genome sequencing, followed by highly multiplexed base-specific in situ sequencing, single-cell resolved transcriptomics and dedicated algorithms to link these layers. Applying the base-specific in situ sequencing workflow to eight tissue sections from two multifocal primary breast cancers revealed intricate subclonal growth patterns that were validated by microdissection. In a case of ductal carcinoma in situ, polyclonal neoplastic expansions occurred at the macroscopic scale but segregated within microanatomical structures. Across the stages of ductal carcinoma in situ, invasive cancer and lymph node metastasis, subclone territories are shown to exhibit distinct transcriptional and histological features and cellular microenvironments. These results provide examples of the benefits afforded by spatial genomics for deciphering the mechanisms underlying cancer evolution and microenvironmental ecology.
Subject terms: Breast cancer, Cancer genomics, Machine learning, Cancer genomics, Computational models
A workflow centred around base-specific in situ sequencing generates detailed maps of, and can phenotypically characterize, the unique set of subclones of cancers.
Main
Cancers are complex and dynamic entities that are constantly reshaped by the interactions between neoplastic cells and their microenvironments4–6. Whole-genome sequencing (WGS) analysis of the average cancer detects thousands of somatic mutations and multiple genetically related yet distinct groups of cells termed ‘subclones’2,7,8. However, as genomic technologies typically assay DNA from dissociated tissues, the phenotypic consequences and the ecosystem pressures that are critical to fully understanding cancer evolution are lost9,10. Consequently, relatively little is currently known about the nature or causes of spatial patterns of cancer growth, phenotypic characteristics of distinct subclonal lineages or their interactions with tissue ecosystems11. Still, this information appears key because adverse cancer outcomes—growth, progression and recurrence—are properties of genetically distinct subclones3,12–16.
Lineage tracing using somatic mutations is a powerful tool for inferring the ancestral relationships between cancer subclones, but methods to perform this in preserved human tissue context are lacking3,14,17–20. Histology-driven sampling, such as laser capture microdissection (LCM)21, combined with low-input nucleic acid library sequencing or even single-cell sequencing goes some way towards resolving subclone spatial structure19. However, even the most exhaustive sampling strategy will struggle to provide an unbiased representation of the cancer clone territories, particularly across whole-tumour sections. Recently described spatial genomics approaches permit the de novo spatial detection of cancer clones with distinct copy number profiles, but this does not permit the detection of point mutations or quantitative read outs of intermixed clones22,23. It has previously been demonstrated that individual mutations can be detected in situ using in situ hybridization24 or mutation-specific padlock probes25–28. However, these approaches are limited by the number of available fluorophores. Given that every cancer and subclone therein is genetically unique, to reconstruct ancestral relationships in both space and time, we need to be able to trace multiple, cancer-specific somatic mutations simultaneously8.
To address this need, we developed a genetic clone mapping workflow that is centred around base-specific in situ sequencing (BaSISS) technology. We derived quantitative maps of multiple genetic clones in eight tissues from two multifocal breast cancers that span the main histological stages of early cancer progression: ductal carcinoma in situ (DCIS), invasive cancer and lymph node metastasis29. In a case of DCIS, clones exhibited co-existence and segregation patterns in different parts of the breast ductal anatomy. By integrating genetic clone maps with multimodal spatial data layers, we found that genetically similar regions can be scattered across wide areas yet maintain similar transcriptional and histological features and foster recurrent ecosystems. Finally, we found that genetic progression, which encapsulates the historical order of events, does not necessarily translate directly to transitions in histological state that are commonly assumed to reflect the stages of cancer progression, thus warranting a combined genetic and histological assessment of cancer evolution.
The BaSISS workflow
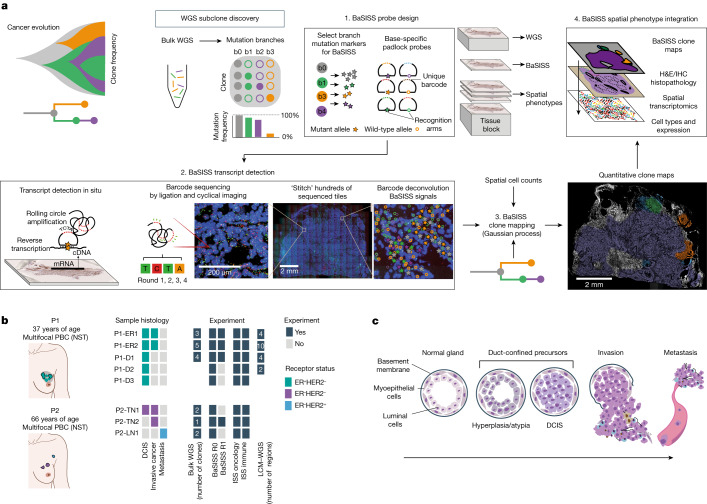
The BaSISS workflow is centred around fresh frozen tissue blocks that undergo serial cryosectioning to generate tissue for bulk WGS and z-stacked sections for in-tissue spatial clone mapping and spatial phenotyping (Fig. 1a). Following subclone detection from bulk WGS data, there are three core BaSISS steps. First, to facilitate detection of multiple clones of interest, BaSISS padlock probes with sequence-specific oligonucleotide target recognition arms are designed towards both mutant and wild-type alleles of clone-defining somatic variants. A unique 4–5 nucleotide reader barcode on each probe enables multiplexing27. BaSISS targets can take the form of any expressed somatic mutation, including point mutations and rearrangement breakpoints, and can be supplemented with copy number alterations (Supplementary Table 1). Second, BaSISS and transcript detection are performed as previously described for gene expression ISS using cyclical microscopy27,30 (Fig. 1a and Supplementary Methods).
Fig. 1. The BaSISS workflow to generate cancer clone maps.
a, Following de novo mutation detection and subclone discovery in WGS data, the BaSISS workflow is performed as follows: (1) bespoke mutation-specific padlock probes are designed. (2) BaSISS transcripts are detected. To achieve this, BaSISS padlock probes hybridize to complementary DNA (cDNA) in situ. By virtue of a highly specific DNA ligase, only completely target-complementary padlock probes are ligated and form closed circles. Ligated probes are amplified through rolling circle amplification and their reader barcodes are detected in tissue space through sequencing by ligation with fluorophore-labelled interrogation probes and cyclical microscopy. (3) Mathematical modelling of BaSISS signals and the genotype of clones is then performed to derive clone maps. (4) Subsequent phenotype and microenvironment characterization of clones is then possible, by integrating clone fields with spatial datasets acquired from serial tissue sections. The BaSISS model and cell typing are described further in Extended Data Figs. 1 and 2. b, The two cases of multifocal primary breast cancer (PBC) used to develop the BaSISS approach. Coloured tiles report the histological features within each sample and the experiments performed. The number of clones identified by WGS and targeted by BaSISS are reported as white numerals. c, The traditional histological model of breast cancer progression. DCIS, ductal carcinoma in situ; H&E, haematoxylin and eosin; LN, lymph node; NST, invasive carcinoma of no special type; TME, tumour microenvironment.
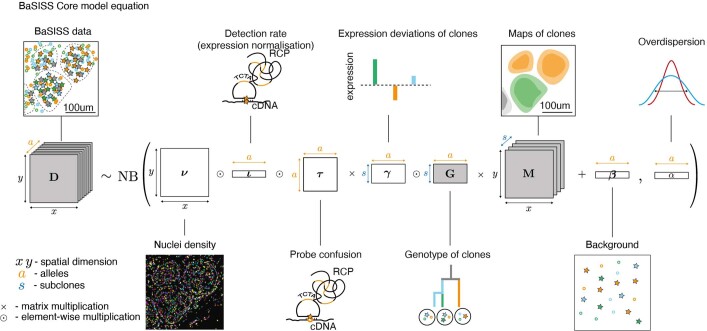
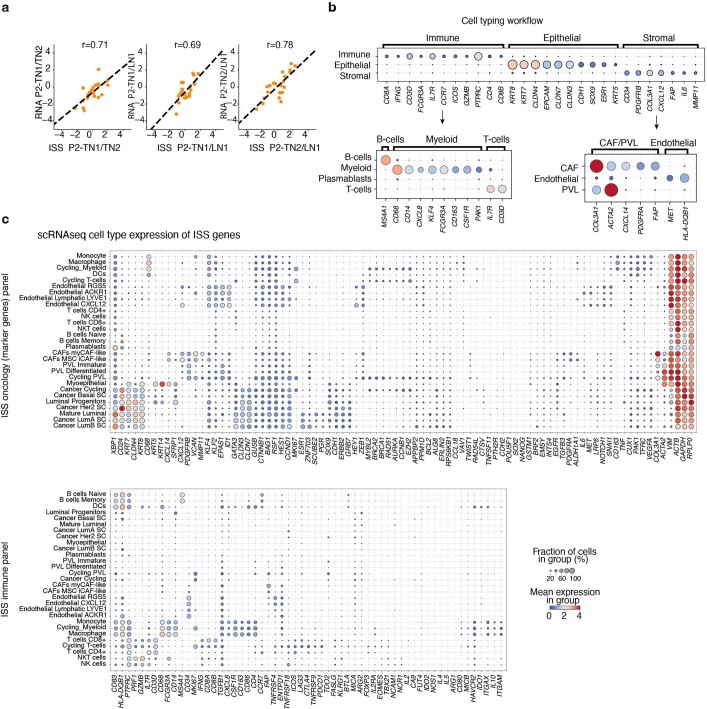
Third, continuous spatial subclone maps are generated using a statistical algorithm that exploits BaSISS signals as well as local cell counts (derived from the DAPI channel during the fluorescence microscopy of BaSISS) using two-dimensional Gaussian processes (Extended Data Fig. 1 and Supplementary Methods). The variational Bayesian model also accounts for unspecific or wrongly decoded signals and variable probe efficiency and is augmented by variant allele fractions in the bulk genomic sequencing data. In an optional, fourth characterization step, BaSISS clone maps can be aligned and integrated with additional layers of spatial phenotype data. In this study, we performed spatially resolved single-cell transcriptomics using targeted ISS (using a previously published 91 gene oncology, a novel 62 gene immune panel and drawing on published single-cell RNA sequencing data)30,31 and immunohistochemistry (IHC) staining (Extended Data Fig. 2a–c and Supplementary Methods). Additional sections were obtained to perform validation of our workflow using LCM and low-input WGS as previously described32 (Extended Data Fig. 3a).
Extended Data Fig. 1. Mathematical modelling BaSISS data.
Mathematical model for generating quantitative clone maps. The essential idea is that the BaSISS signals count matrix D is decomposed into maps of clones M each with a distinct genotype G (grey shading), accounting for multiple sources of variability. For further details see Supplementary Methods.
Extended Data Fig. 2. Hierarchical cellular typing workflow.
a, Scatterplots of between sample log2-fold change of gene expression derived from RNAseq and combined ISS oncology and immune experiments. Correlations indicate that the probes are on-target. Included genes are those with transcripts per million (TPM) > 25 in RNAseq and 1000 detections per million cells in ISS whose deviation due to low counts would be negligible, R = Pearson’s correlation coefficient. b, Marker genes for the cell typing were selected using hierarchical logistic regression. The input datasets are the targeted ISS oncology and immune panels. If nuclei have marker ISS signals within 5 μm from their centre, the corresponding cell types were assigned. At first iteration, nuclei were classified into 3 broad categories (Immune, Epithelial and Stromal). At the second iteration, nuclei with Immune and Stromal assignments were further subdivided into (B-cells, Myeloid and T-cells) and (CAF/PVL, Endothelial) groups. The identity of nuclei that did not have any marker genes in proximity or had a contradictory assignment was considered unknown. PVL = perivascular-like. c, Mean expression of the genes used in ISS immune and oncology panels was calculated from the breast cancer single cell RNA sequencing (scRNA) reference (derived from Wu et al. Nature Genetics, 2021) to aid interpretation of the observed ISS signal distribution.
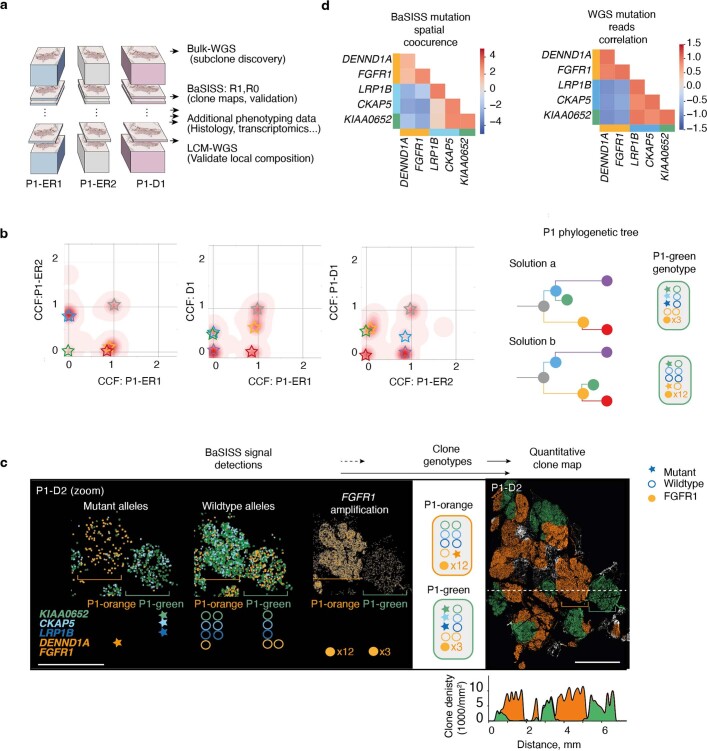
Extended Data Fig. 3. BaSISS resolves ambiguous WGS derived clonal architectures.
a, Cartoon illustrating tissue block handling for P1. b, Density plots of WGS derived point mutation, cancer cell fraction (CCF) estimates from pairs of samples (see Supplementary Methods for details). Mutation clusters are denoted by coloured stars. The two phylogenetic tree solutions most compatible with the mutation cluster CCFs are presented alongside their respective inferred P1-green genotypes. c, BaSISS signal detections in approximately 3 mm2 region of D2 (repeated x3, left), exhibit co-occurrence and segregation patterns of both wild-type and mutant alleles that support the phylogenetic tree solution ‘a’. Sample D2 clone map (right) with frequency plot (below) of local, mean clone composition, corresponding to horizontal dashed line. The quantitative, continuous nature of these data can be examined more fully via the interactive web browser https://www.cancerclonemaps.org/. d, Spatial co-occurrence matrix of BaSISS mutant allele signals from P1-D1 (top) and LCM-WGS read correlations from 6 microdissected regions of P1-D1/P1-D2 reveal the same co-occurrence patterns that support tree solution ‘a’.
Two cases of multifocal breast cancer
The cohort includes eight tissue blocks from two patients (P1 and P2) who underwent a surgical mastectomy for a multifocal breast cancer. These patients were selected to permit a comparison between genetic and histological progression models in early breast cancer development29 (Fig. 1b,c). P1 had two separate oestrogen receptor (ER)-positive, human epidermal growth factor receptor 2 (HER2)-negative primary invasive breast cancers (PBCs) within a 5-cm bed of DCIS; we used tissue blocks from both PBCs (samples P1-ER1 and P1-ER2) and three regions from DCIS (samples P1-D1, P1-D2 and P1-D3). P2 had two separate PBCs of the ‘triple-negative’ subtype (lacking the ER, progesterone receptor and HER2). We sampled both PBCs (samples P2-TN1 and P2-TN2) and an axillary lymph node that contained metastatic cancer deposits (sample P2-LN1) (Fig. 1b).
Accurate and reproducible maps of clones
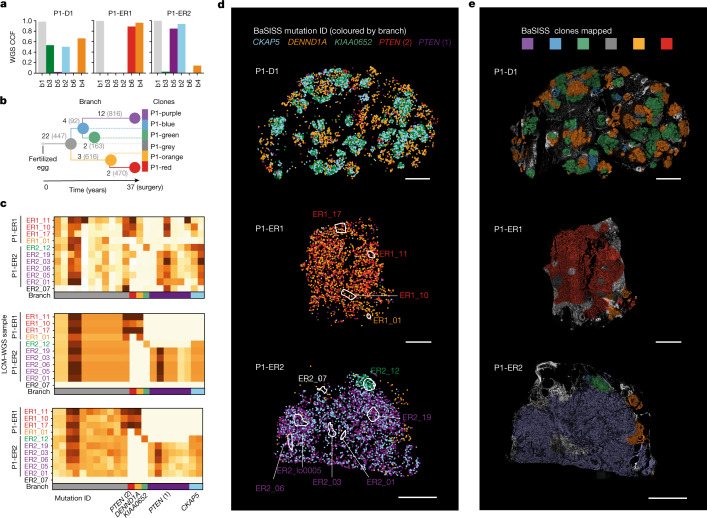
To demonstrate that spatial BaSISS signal counts can provide a meaningful read out of the underlying somatic genotype, we first focused on three samples from P1 (P1-ER1, P1-ER2 and P1-D1) (Fig. 1b). Previous multiregional WGS experiments identified mutation clusters that equated to six phylogenetic tree branches, and these were present at different levels across the three samples3 (Fig. 2a,b, Extended Data Fig. 3b and Supplementary Table 3). To enable spatial detection of subclones, BaSISS padlock probes were designed towards 51 alleles that report on each branch of the phylogenetic tree: 25 single-base substitutions and the equivalent wild-type base, as well as an amplified oncogene (FGFR1) (black numbers; Fig. 2b and Supplementary Table 1). Subclones are referred to by a patient identifier and the colour of the corresponding node of the phylogenetic tree: P1-purple, P1-red, P1-grey, P1-orange, P1-green and P1-blue (Fig. 2b). A subclone genotype comprises the branch mutations accumulated as one moves from the tree root to the subclone node, therefore P1-green contains grey, blue and green branch mutations (Extended Data Fig. 3b). The bulk WGS-derived tree was corroborated by spatial co-occurrence of BaSISS signals and LCM–WGS validation data (Fig. 2c and Extended Data Figs. 3c,d and 4a).
Fig. 2. Converting BaSISS spatial signals into maps of clones.
a, Bar plots of cancer cell fractions (CCFs) derived from bulk WGS of the P1 samples. b, Phylogenetic tree reconstructed from multiregional bulk WGS data from P1 (see Supplementary Methods for details). Each branch is labelled with the total number of WGS mutations defining the branch (grey text) and the number of BaSISS probes designed to target that branch (black text). c, Three heatmaps of variant allele fractions (VAFs) calculated using data derived from n = 11 regions of P1-ER1 and P1-ER2 (marked in d). Raw BaSISS VAFs (for each target mutation the number of mutant signals divided by total number of mutant plus wild-type signals) (top) and model-imputed BaSISS VAFs (middle) are derived from raw BaSISS signal data within these regions. In serial tissue cryosections, corresponding z-stack regions were identified and subjected to LCM–WGS. Resulting LCM–WGS VAFs are presented (bottom). Mean per-gene correlations are approximately 0.41 and 0.90 for BaSISS to LCM–WGS and model-imputed VAFs to LCM–WGS comparisons, respectively. Sample names are coloured according to the dominant BaSISS subclone in the sampled region. Each row represents a targeted mutation. The mutations plotted in d are labelled by their gene name; for PTEN there are two separate mutations. d, Spatial BaSISS detections of barcodes reporting on five selected mutations, coloured according to their targeted branch. White contours indicate LCM regions (relates to c). e, BaSISS clone maps in physical space projected on the DAPI image (nuclei are white), derived using BaSISS mathematical modelling of signals from 45 informative targets. Each clone has a different colour, and dominant clones are reported (shown if the CCF is more than 25% and the inferred local cell density is more than 300 cells per mm2). Scale bars, 2.5 mm (d,e).
Extended Data Fig. 4. Validation of the BaSISS workflow.
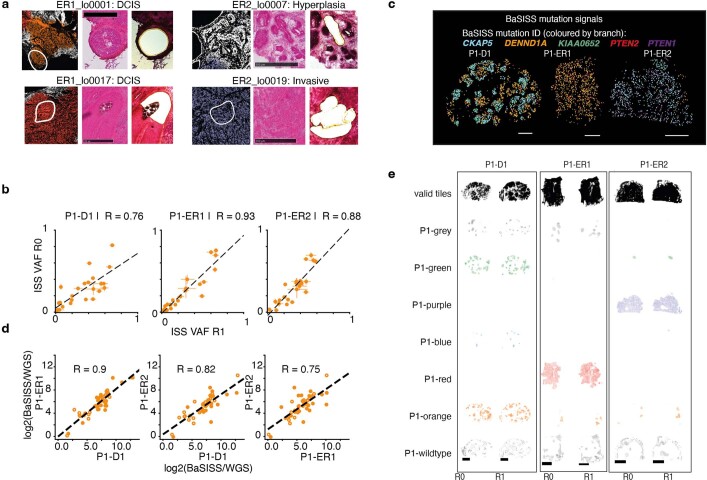
a, Four examples of BaSISS clone map regions (left) (see Fig. 2e) selected for laser capture microdissection (LCM) and whole genome sequencing (WGS) validation. Corresponding regions in z-stack tissue sections stained with H&E before (middle) and after (right) LCM. Scale bar = 500 um. b, Scatterplots of BaSISS variant allele fractions (VAF) defined as the number of mutation specific signals divided by mutation plus wildtype signals (depth) for each mutation target between replicate BaSISS experiments. Data are presented as mean estimates and 95% HPDI. c, Replicate BaSISS experiments (relates to Fig. 2d). Signals for selected mutations are coloured according to branch of origin. Scale bar = 2.5 mm. d, Scatterplots of BaSISS VAFs (normalised to WGS VAFs) in related samples indicate that the BaSISS data provide a meaningful read out of genomic structure. R = Pearson’s correlation coefficient. e, BaSISS clone fields derived from replicate sequencing data: Factor 2–7 are clones corresponding to the same coloured branch. Factor 1 is residual, 8 is normal. Scale bar = 2.5 mm.
On average, 97% of detected BaSISS spot signals were converted into feasible barcodes33. The median target-specific coverage across 300 mm2 of breast tissue was 13,000-fold (Supplementary Table 4). BaSISS-derived variant allele fractions exhibited strong correlation across replicate experiments on serial tissue sections (R = 0.76–0.93, Pearson’s; Extended Data Fig. 4b), demonstrating quantitative reproducibility.
BaSISS signals coloured according to their subclonal mutation branch revealed a first, albeit noisy, visual glimpse of subclonal growth structure (Fig. 2d). Broad patterns were preserved in technical replicate experiments using adjacent tissue sections (Extended Data Fig. 4c). Although the number of signals detected per nucleus (n = 0.82) does not provide single-cell resolution of the somatic genotype, it is possible to aggregate information (1) spatially over areas of approximately 100 × 100 µm2, and (2) across alleles co-occurring in a particular subclone to infer the local clonal composition of different tumour clones and normal cells (Supplementary Table 4). This process generated detailed maps covering several squared centimetres of tumour tissues (Fig. 2e). Of note, the clone mapping algorithm also implicitly adjusts the observed allele frequencies for a range of systematic biases (Extended Data Fig. 4d), stemming from the use of RNA-derived signals, differential BaSISS probe sensitivity and allele confusion to produce highly consistent maps across replicates (Extended Data Fig. 4e). Although the raw BaSISS variant allele fractions of many probes were noisy owing to the aforementioned biases, the modelled allele frequencies were in highly accurate agreement with LCM–WGS validation data (Fig. 2c,g and Supplementary Table 5). This further corroborates the quantitative nature of BaSISS-derived clone maps that can be explored using an interactive web browser (https://www.cancerclonemaps.org/).
Charting histogenomic relationships
Histology-driven sampling of well-defined stages of cancer progression can uncover mechanisms and markers of disease progression10,19,29,34. Up to two-thirds of PBCs contain both invasive cancer and intermixed DCIS, a non-obligate precursor lesion. How these distinct ‘stages’ of cancer development might relate to genetic diversification within the same tissue is generally unknown35 (Fig. 1c). To demonstrate that BaSISS can chart these relationships across entire tissue sections, we examined three PBC samples with intermixed invasive and DCIS histology: P1-ER1, P1-ER2 and P2-TN1 (Fig. 3 and Extended Data Figs. 5 and 6a–c).
Fig. 3. Genetic clones mapped in histological context from three PBCs.
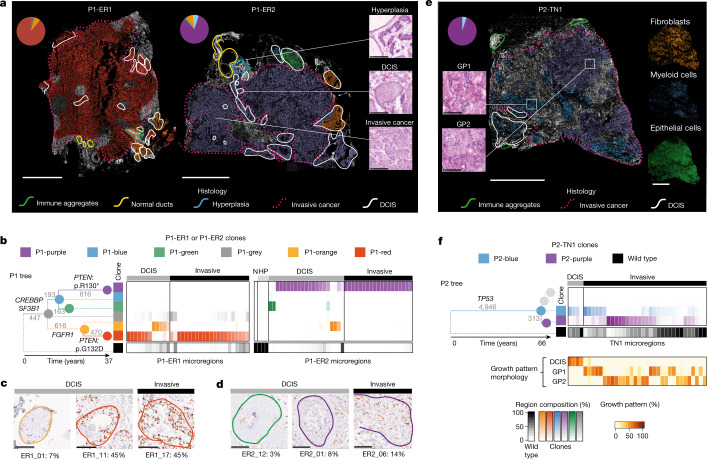
a, BaSISS maps of two PBCs from P1 with intermixed DCIS and invasive cancer. The most prevalent genetic clone is projected as a coloured field (corresponds to b) on DAPI images (reported if the CCF is more than 25% and the inferred local cell density is more than 300 cells per mm2). Scale bar, 2.5 mm. Pie charts report the WGS-estimated clone composition of P1-ER1 and P1-ER2. Inset images (right) are regions of P1-ER2 (H&E-stained serial tissue sections) that represent three histological progression states. Scale bar, 250 µm. b, The phylogenetic tree was inferred from P1 multiregion WGS: branches are scaled according to and annotated with the number of WGS mutations and driver mutation-containing genes. Branches and nodes are coloured to reflect the clones mapped in a. Heatmaps report clone composition in 34 and 44 histologically annotated epithelial-containing microregions of P1-ER1 and P1-ER2, respectively. Microregions include individual ducts or randomly selected similarly sized regions of invasive cancer (see Extended Data Figs. 4b and 5b and the web browser https://www.cancerclonemaps.org/ for microregion details). HP, hyperplasia; N, normal ducts. c,d, IHC in P1-ER1 (c) and P1-ER2 (d) for the proliferative marker Ki-67 in six clone territories (indicated by contour colour); the percentage of nuclei staining positive (brown) is reported. Scale bars, 250 µm. e, As in a, but a clone map of P2-TN1. Scale bar, 2.5 mm. Mini-images report ISS-derived cell types (right) and H&E tissue section snapshots of the two cancer growth patterns (GP1 and GP2) reported in P2-TN1 (left). Scale bar, 250 μm. f, Phylogenetic tree for P2 and heatmap of 36 P2-TN1 microregions, as in b. Branches relating to clones not detected in this sample (that is, only found in P2-LN1) are shaded grey. The bottom heatmap is the estimate by the histopathologist and reports the contribution of different growth patterns to the microregion, defined by distinct nuclear and architectural features (Supplementary Methods).
Extended Data Fig. 5. Phenotype characterisation of histo-genomic states in sample P1 PBCs.
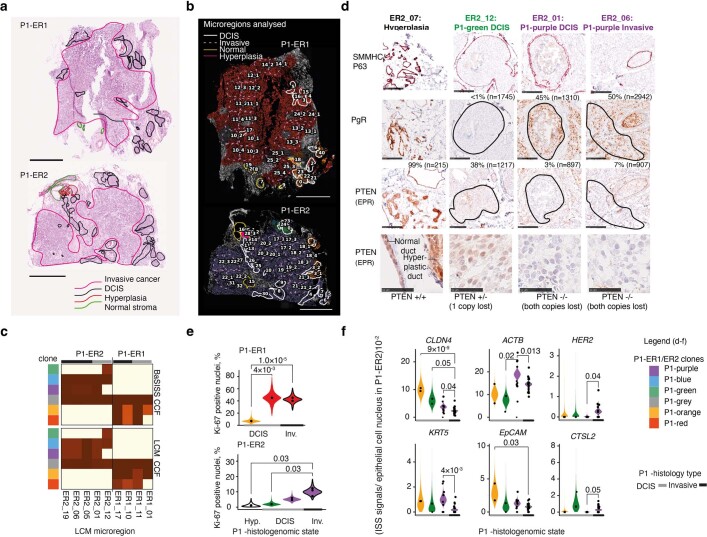
a, Broadly annotated H&E tissue sections of the P1-ER1 and P1-ER2 primary breast cancers. b, Microregions selected for detailed analysis overlaid on BaSISS maps (regions relate to heatmaps in Fig. 3a; numbers relate to histological annotations in Supplementary Table 2). c, Comparison of the cancer cell fractions (CCF) of 9 regions of P1-ER1/P1-ER2 determined through both BaSISS (top) and laser capture microdissection (LCM) whole genome sequencing (WGS) (bottom). d, Snapshots of immunohistochemistry (IHC) staining in serial fresh frozen tissue cryosections from P1-ER2. Selected regions with confirmed clone compositions (by LCM WGS) are presented. SMMHC/P63 antibody stains myoepithelial cells red, PTEN protein and the progesterone receptor (PR) stain brown. % reports proportion of positive nuclei stained, n reports number of nuclei in region assessed by QuPath digital software. Row 1–3 scale bars = 250 um. Row 4 scale bar = 50 um. e, Violin plots depict clone specific Ki67 IHC staining rate posterior density of the generalised linear mixed model (glmm) with region specific random effect. Significant comparisons were controlled for FDR using the BH procedure. Analysis was limited to the 11 regions with confirmed clone compositions by WGS due to variation between IHC and BaSISS sections in z-stack morphology (relates to Fig. 2d). f, Violin plots depict clone specific gene expression contribution posterior density of the glmm with region specific random effect. A total of 36 regions of P1-ER2 with a dominant clone fraction > 0.7 were analysed. Significant comparisons were controlled for FDR using the BH procedure. DCIS = Ductal carcinoma in situ.
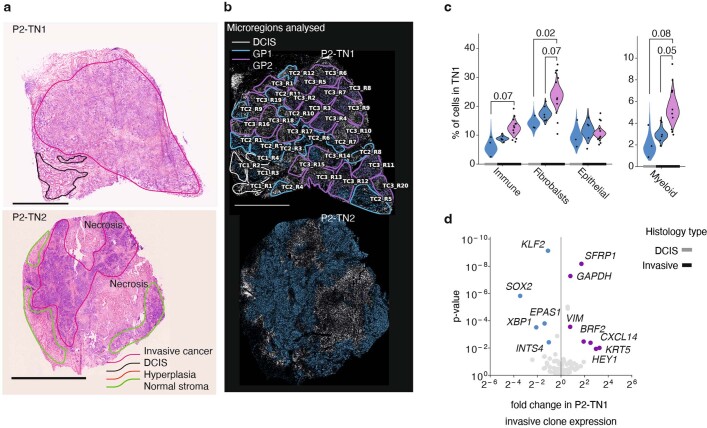
Extended Data Fig. 6. Ecosystem characterisation in P2-TN1.
a, Haematoxylin and eosin (H&E) stained sections of the two primary breast cancers from case P2. b, Microregions selected for detailed analysis overlaid on BaSISS maps (regions relate to heatmaps in Fig. 3a; numbers relate to histological annotations in Supplementary Table 2). Microregions were not defined for P2-TN2 as a single clone was targeted and detected. c, Cell type contribution posterior density of the generalised linear mixed models (glmm) model with region specific random effect. Significant comparisons were controlled for FDR using the BH procedure. 19 clone territories (with dominant clone fraction > 0.1) were analysed. Fibroblasts and perivascular-like cells (PVL) could not be differentiated within this experiment and are reported as ‘fibroblasts’. d, Volcano plot of epithelial expression of the 91 oncology ISS panel genes in TN1 invasive regions. Significance was adjusted for multiple testing using BH procedure, only genes with FDR < 0.1 and fold change > 1.5 in both ways are coloured/labelled. DCIS = Ductal carcinoma in situ.
BaSISS detected 2–4 subclones per PBC in accordance with bulk WGS data. Clone maps (Fig. 3a,e) and the quantitative clonal composition of 73 individually annotated microregions (Fig. 3b,f and Extended Data Figs. 5a,b and 6a,b) revealed that individual subclones form spatial patterns that were, by varying degrees, related to the histological progression states. Normal tissue elements, including immune aggregates and histologically normal ducts, appear unstained consistent with a wild-type status for the targeted clones (green and yellow contours, respectively; Fig. 3a,e). In P1-ER2, an area of hyperplasia was predicted and confirmed by LCM–WGS to be genetically unrelated to the cancer (blue contour; Figs. 2c and 3a).
In each PBC, the genetic and histological progression models were broadly consistent, in which the invasive disease was mainly composed of cells from the most recently diverged subclone: P1-red, P1-purple and P2-purple in samples P1-ER1, P1-ER2 and P2-TN1, respectively (Fig. 3b,f). By contrast, earlier diverging clones colocalized entirely or in part to the histological pre-invasive lesion: DCIS. For example, in P1-ER2, BaSISS predicted that green branch mutations were completely absent from the invasive compartment, a conclusion that is supported by three separate microdissections (LCM–WGS) from distant regions of invasive cancer in P1-ER2 (Fig. 2c and Extended Data Fig. 5c).
However, in each PBC, there was a subclone that spanned both DCIS and invasive histology, revealing that disconnects between histological and genetic progression states can exist. This was the case for clone P1-red in P1-ER1 and clone P1-purple in P1-ER2. These DCIS-invasive spanning clones could be distinguished from each other by hundreds of private mutations, including different inactivating driver mutations in PTEN, indicating parallel evolution along these divergent lineages that resulted in two distinct instances of cancer invasion (total mutation numbers label the phylogenetic tree branches; Fig. 3b). The spatial predictions of the BaSISS model of intraductal acquisition of PTEN mutations and PTEN protein loss was confirmed by LCM–WGS and IHC, respectively (Fig. 2c and Extended Data Fig. 5d). In sample P2-TN1, the only predicted driver point mutation was a deleterious mutation in the tumour suppressor gene TP53, and this was detected in both DCIS and invasive compartments and was also present in all cancer regions of the second PBC, P2-TN2, consistent with an early onset in the development of this cancer (phylogenetic tree; Fig. 3e,f). These data therefore suggest that many, if not all, of the genetic events necessary to initiate the invasive transition in these three cancers were acquired within the ducts, and subsequently both intraductal expansion and stromal invasion ensued.
Phenotypic changes accompany progression
Next, by integrating additional layers of spatial data, we sought to establish how phenotypic changes relate to genetic-state and histological-state transitions. In P1-ER1 and P1-ER2, consistent with a more proliferative phenotype, PTEN-mutant clone regions exhibited denser Ki-67 IHC nuclear staining, than PTEN wild-type ancestral clone regions (false-discovery rate (FDR) = 0.004 P1-red versus P1-orange; and FDR = 0.03 P1-purple versus P1-green) (Fig. 3c,d and Extended Data Fig. 5e). However, for a given genetic clone, the Ki-67 score was similar irrespective of whether it occupied a DCIS or invasive state, indicating that upregulation of Ki-67 is temporally related to acquisition of a PTEN mutation and precedes invasion.
By contrast, cellular resolution spatial transcriptomics analysis of P1-ER2 revealed that epithelial cell expression of several genes—CLDN4 (encoding claudin 4), ACTB (encoding β-actin), KRT5 (encoding keratin 5) and CTSL2 (encoding lysosomal cysteine protease cathepsin V)—differed between DCIS and invasive compartments occupied by the same, P1-purple, clone (Extended Data Fig. 5f). These transcriptional changes might therefore be considered more closely linked to the histological transition rather than genetic changes traced by this approach. Expression of CLDN4 was consistently lower in the invasive compartment than to each DCIS clone. However, for some genes such as ACTB, expression patterns changed in opposing directions in the invasive cancer relative to the sampled DCIS clone (expression is higher than P1-green DCIS (FDR = 0.02) and lower than P1-purple DCIS (FDR = 0.013)) or were highly specific to a genetically more distant DCIS clone (Extended Data Fig. 5f).
Attempts to isolate the changes associated with invasive transition might also be confounded by heterogeneity within the invasive compartment. In P2-TN1, we therefore sought to examine whether the two genetically distinct invasive subclones (P2-blue and P2-purple) were phenotypically distinct. The two cancer clones exhibited distinct morphological (nuclear and architectural) features (P = 0.04, Fisher’s exact test) (H&E image insets; Fig. 3e,f) and occupied neighbourhoods with different stroma (FDR = 0.02) and immune cells such as myeloid cell densities (FDR = 0.08) (mini-image insets; Fig. 3e and Extended Data Fig. 6a–c). Transcriptional programs were also distinct, with statistically significant differences in gene expression for 12 of 91 genes between clones (Extended Data Fig. 6d). Together, these data indicate that the particular clones sampled can have a profound effect on attempts to identify the phenotypic changes implicated in driving or arising during histological progression.
Growth patterns of pre-invasive clones
To demonstrate that BaSISS can be used to chart growth patterns in relation to complex tissue structures, we turned our attention to three DCIS samples from P1 that spanned a tissue surface area of 224 mm2 (P1-D1, P1-D2 and P1-D3) (Fig. 4a and Extended Data Fig. 7a). The adult female breast comprises multiple, branching ductal systems, termed lobes, that extend from the nipple surface to the acini of the lobules, as illustrated in Fig. 4c36,37. DCIS arises from the duct epithelium and is considered a lobar disease as it typically involves the ducts and lobules of a single lobe38. Although DCIS is known to be genetically heterogeneous19, how DCIS clones are organized and grow through the wider duct system remains elusive39.
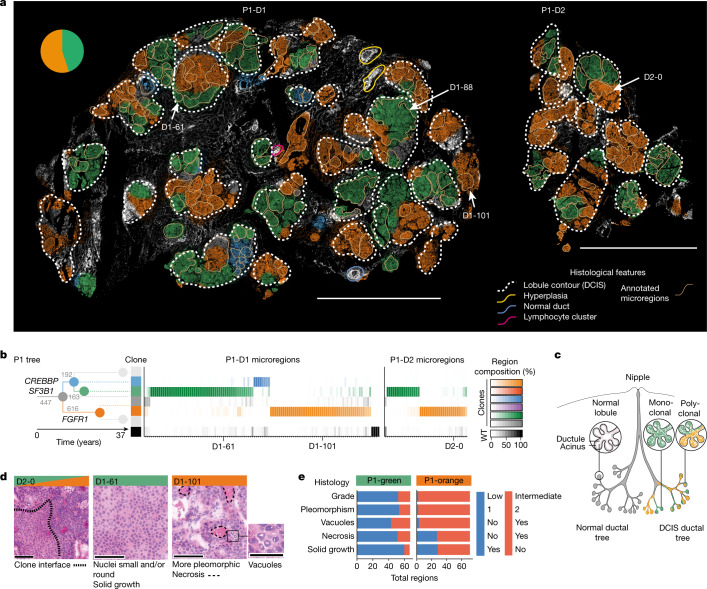
Fig. 4. Growth patterns and histological associations of DCIS clones.
a, BaSISS maps of pure DCIS samples: P1-D1 and P1-D2. The most prevalent genetic clone is projected as a coloured field (which corresponds to b) on DAPI images (reported if the CCF is more than 25% and the inferred local cell density is more than 300 cells per mm2). Scale bar, 5 mm. The quantitative, continuous nature of these data can be examined via an interactive web browser (https://www.cancerclonemaps.org/). The pie chart reports the WGS-estimated clone composition of P1-D1. The white dashed contours delineate morphologically defined lobules. The beige contours mark 114 and 40 manually selected microregions in P1-D1 and P1-D2, respectively, the clonal composition of which is reported by the heatmaps in b. Microregions were manually selected and represent single or small groups of intimately related acini or ductules from the same lobule. b, The phylogenetic tree was inferred from P1 multiregion WGS: branches are scaled according to and annotated with the number of WGS mutations and driver mutation-containing genes. Branches and nodes are coloured to reflect the clones mapped in a. Only branches detected in P1-D1 and P1-D2 are coloured. WT, wild type. c, Cartoon of a lobe of the breast with normal anatomy (left) and DCIS (right), with lobules exhibiting monoclonal and polyclonal involvement. d, H&E images report representative subclone histological features in regions selected from a. Scale bars, 100 µm and 50 µm (vacuoles). e, Stacked bar plot summarizes histological features of microregions dominated by P1-green (n = 66) or P1-orange (n = 72). Nuclear pleomorphism is a measurement of the amount of variability in size and shape of the nuclei and is a major determinant of the histological grade.
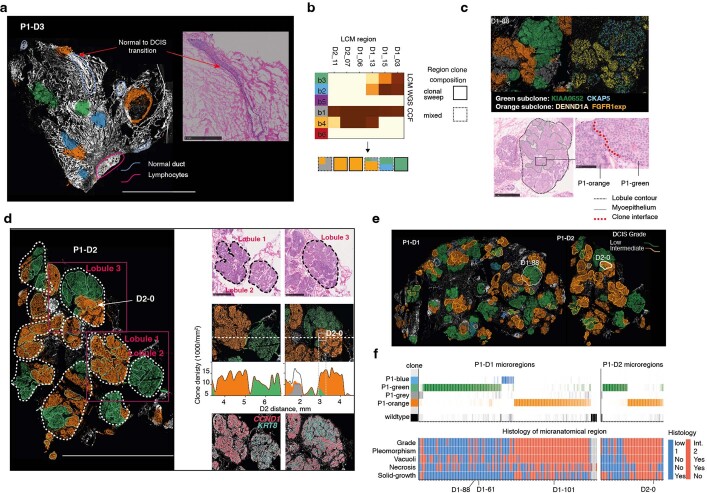
Extended Data Fig. 7. DCIS clone specific histologies.
a, BaSISS clone map of P1-D3, a sample that contains Ductal carcinoma in Situ (DCIS), stroma and normal glandular regions. The most prevalent genetic clone colour is projected as a coloured field on DAPI images (reported if cancer cell fraction > 25% and inferred local cell density > 300 cells/mm2). Scale bar = 5 mm. Inlaid, H&E stained image (from a serial tissue section) details the histological transition from normal to DCIS morphology, consistent with the clone field transition in the BASISS map (scale bar = 1 mm). b, Heatmap of cancer cell fractions (CCF) derived from LCM WGS of six regions of P1-D1/P1-D2 with cartoon of predicted clone composition indicating inference of monoclonal and polyclonal growth patterns. c, Example of a clone interface within a single sub-lobular space in P1-D1. Clone fields (top left); spatial BaSISS mutation signals (top right); characteristic histological features on H&E (bottom left) with zoom image of clone interface (scale bar = 100 um) (bottom right). d, Histological, genetic and transcriptional features of three lobules (identified on the clone map of P1-D2; left, scale bar = 5 mm) are shown: H&E staining (top) scale bar = 1 mm; BaSISS clone fields projected on DAPI with frequency plots of the local, mean cancer (coloured areas) and non-cancer (white) corresponding to horizontal dashed line (middle); and ISS gene expression signals reporting CCND1 and KRT8 that exhibit clone specific spatial patterns. e, Clone maps of P1-D1/P1-D2 (as presented in Fig. 4a) but microregions are coloured according to histological grade. f, Histopathological annotations for each microregion presented alongside the same clone composition heatmap as shown in Fig. 4b.
The clone maps generated for the three samples formed striking mosaics of mainly green and orange, and occasional blue and grey that localized to areas of histologically confirmed DCIS (Fig. 4a and Extended Data Fig. 7a). Immune clusters and occasional normal or hyperplastic ducts appeared white (unstained), consistent with a different genetic ancestry. In P1-D3, a 3-mm length of a large duct exhibited both a genetic and a histological transition from normal ductal epithelium to DCIS along its length, confirming that, although neoplastic involvement was extensive in this lobe, it was incomplete (Extended Data Fig. 7a). On dividing the glandular tissue into lobules (white dashed contours; Fig. 4a), it was apparent that a handful of lobules contained a single clone, but often multiple clones co-occurred. Indeed, we were surprised to observe that the same clones repeatedly co-existed within lobules that spanned centimetres of tissue. These appearances seem at odds with the traditional model of clonal competition in which a fitter clone generates localized monoclonal sweeps (Fig. 4c).
However, at finer, sublobular resolution, complete or near-complete clonal sweeps are the dominant pattern, as exemplified by assaying 146 representative microscopic regions that represent individual or small clusters of intimately related acini and ducts (beige contours; Fig. 4a). The existence of frequent clonal sweeps as inferred by BaSISS (Fig. 4b) was corroborated by LCM–WGS of additional microregions (Extended Data Fig. 7b). In some instances, including P1-D1-88 (Extended Data Fig. 7c) and P1-D2-0 (Fig. 4a,b,d and Extended Data Fig. 7d–f), clonal interfaces are directly observed within a continuous anatomical space. However, more commonly, rapid clone field transitions (see interactive maps (https://www.cancerclonemaps.org/)) coincided with the myoepithelial cell layer and/or basement membrane that define an acinus or ductule border. It thus transpires that the microanatomical structure of resident tissues can have, an as yet poorly understood, role in shaping observed subclonal architectures (Fig. 4a,c).
DCIS clone-specific phenotypes
Integration of histological and spatial gene expression data from serial sections revealed that the DCIS clones, P1-green and P1-orange, exhibit many phenotypic differences that are consistent across large tissue areas (Fig. 4d,e and Extended Data Figs. 7e,f and 8a,b). Histogenetic associations were very strong, with regions dominated by P1-green being more likely to have an intermediate rather than a low nuclear grade (P < 0.0001; Fisher’s exact test after Bonferroni correction), exhibit more nuclear pleomorphism (P < 0.0001), necrosis (P < 0.0001), vacuoles (P < 0.0001) and a non-solid architectural growth pattern (P < 0.0001) (Fig. 4d,e and Extended Data Fig. 7e,f).
Extended Data Fig. 8. Distinct transcriptional profiles of two DCIS clones.
a, Volcano plot of epithelial expression of the 91 oncology ISS panel genes in P1-D2. Significance was adjusted for multiple testing using BH procedure, only genes with FDR < 0.1 and fold change > 1.5 in both ways are coloured/labelled. The coloured genes are included in the by region plot in b. b, Heatmap of gene expression data within each of the 41 sampled regions in P1-D2, presented alongside the relevant clone composition regions (top) as per Fig. 4b. ISS counts in each regions are transformed by applying Poisson cdf with λ = mean (P1-green expression, P1-orange expression) × nuclei count in each region, thus divergence from 0.5 reflects deviation from the global mean expression. Only genes with FDR < 0.1 are presented and ordered by the confidence of differential.
Clone and cell type-resolved spatial gene expression analysis using targeted ISS further corroborated phenotype–genotype correlations. A total of 28 of 91 interrogated genes were differentially expressed by the two main clones (FDR < 0.1, fold change > 1.5 both ways; Extended Data Fig. 8a,b). Consistent with a higher nuclear grade, P1-orange epithelial cells exhibited higher expression of the cell-cycle regulatory oncogenes CCND1 and CCNB1 and the oncogene ZNF703, which have been linked to adverse clinical outcome40. Overall, architectural and nuclear appearances and gene expression profiles were remarkably lineage-specific, and it was particularly notable that these different patterns could also be appreciated spatially, in regions with sublobular, microscopic clone intermixing, adding weight to the clone composition predictions by the model (Extended Data Fig. 7d).
Metastatic clones in a lymph node
Lymph node metastasis is associated with higher rates of cancer mortality41. Whether it has an active role in facilitating cancer progression or simply reflects a more aggressive or distinct biology of certain clones is largely unknown. A substantial challenge is low cancer purity of diffusely infiltrated lymph nodes, which can make it difficult to separate cancer from immune cell-derived molecular signals. To demonstrate that BaSISS can facilitate the simultaneous study of cancer and immune compartments in such challenging cases, we analysed BaSISS, histological annotation and ISS targeted gene expression datasets from sample P2-LN1 (Fig. 5 and Extended Data Fig. 9).
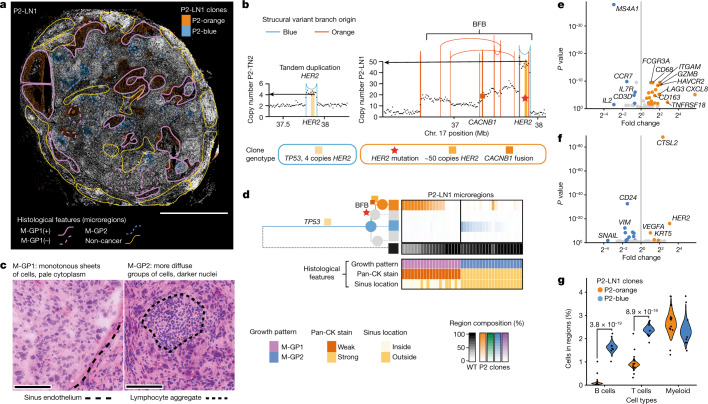
Fig. 5. Intrinsic and extrinsic features of metastatic subclones in a lymph node.
a, BaSISS map of P2-LN1, which relates to P2-TN1 (Fig. 3e) and P2-TN2 (Extended Data Fig. 6a,b). The most prevalent genetic clone colours are projected as coloured fields on the DAPI image (reported if the CCF is more than 25%; a threshold of 5% is used in regions of diffusely infiltrating blue to allow visualization in very high normal contamination regions). Scale bar, 2.5 mm. Coloured contours define microregions with distinct metastatic cancer growth patterns (M-GP1 and M-GP2); ‘+’ indicates the surrounding sinus epithelium. b, Plots of the genomic structures in P2-blue and P2-orange clones in the vicinity of the HER2 gene, derived from WGS data of P2-TN2 and P2-LN1. Vertical lines represent genomic rearrangement breakpoints coloured by the phylogenetic tree branch where the event occurred. Dots represent local (binned) copy number. HER2 amplification, CACNB1 fusion and HER2 mutation are BaSISS targets used to track this complex event. BFB, breakage fusion bridge. c, Representative areas of the two main growth patterns stained with H&E. Scale bar, 100 µm. d, Phylogenetic tree inferred from P2 multiregion WGS. Branch and node colours inform the clones mapped in a. The top heatmap reports the BaSISS clone contribution to 39 histologically annotated microregions from a (regions with 5% or more tumour cells are included); see https://www.cancerclonemaps.org/. The bottom heatmap reports microregion histological features. Pan-CK, pan-cytokeratin. e, Volcano plot of immune cell expression of the 62 genes in the ISS immune panel. f, Volcano plot of epithelial cell expression of the 91 genes in the ISS immune panel. Significantly (FDR > 0.1), differentially expressed (fold change of more than 1.5 both ways) genes are coloured. g, Violin plots depict clone-specific cell-type contribution posterior density of the generalized linear mixed model with region-specific random effect, and includes the 22 clone territories with a dominant clone fraction of more than 0.05 in P2-LN1. Significant comparisons were controlled for FDR using the Benjamini–Hochberg procedure.
Extended Data Fig. 9. Highly recurrent clone specific ecosystems in a metastatic lymph node.
a, P2-LN1 sample (left) DAPI image with BaSISS subclone fields (as shown in Fig. 5a) and coloured squares mark regions depicted in b,c,d; (middle) pan-cytokeratin immunohistochemistry stained (IHC) (epithelial cells appear brown); (right) CD45 antibody (immune cells appear brown) with ISS immune panel derived cell types projected as coloured dots. b—d, Snapshots of example regions dominated by P2-blue or P2-orange clones, as indicated in a. In each case signals (dots) from selected targets in BaSISS b, ISS oncology c or ISS immune panels d are presented overlaid on sections stained by IHC following the BaSISS/ISS experiment. In the bottom row of c and top row of d inferred epithelial and immune cell types are presented. In top rows of c and d, 80% transparency is applied to the underlying IHC image to aid visualisation of overlaid dots. e, Spatial patterns of three hypoxia related genes are projected on the entire P2-LN1 tissue section. f, Spatial patterns of PDGFRB, CD34, CD68 and hypoxia related ISS signals overlaid on HER2 (left) and CD45 IHC stained sections(right) correspond to region of white square on top left clone field image in e.
BaSISS in P2-LN1 targeted 13 trunk and branch alleles, including point mutations and an expressed novel internal fusion in the CACNB1 gene that was co-amplified with the clinically targetable breast cancer oncogene HER2 in a breakage fusion bridge event (Fig. 5b and Supplementary Data Table 1). The model detected two clones (P2-blue and P2-orange) that formed spatially segregated patterns in P2-LN1 (Fig. 5a,d). Only P2-blue was detected in primary breast tumours (P2-TN1 and P2-TN2) (Fig. 3e and Extended Data Fig. 6b).
Detailed histological annotation, blinded to the clone territories, was performed using a combination of H&E, CD45 and pan-cytokeratin IHC and identified multiple metastatic cancer growth patterns (coloured contours; Fig. 5a,c,d and Supplementary Table 2). Intersecting the clone maps and histological annotations revealed strong associations between the two detected clones and the two main histological growth patterns (P < 0.0001, Fisher’s exact test) (Fig. 5d). The P2-orange clone formed monotonous sheets of cancer cells, exhibited weak immunoreactivity for pan-cytokeratin and often occupied sinusoidal structures. By contrast, P2-blue cells stained more strongly for pan-cytokeratin and, when clustered, surround densely packed lymphocyte cores (Fig. 5c,d and Extended Data Fig. 9a–d).
We sought to determine whether transcriptional differences support the spatial inference of clones. Consistent with the known HER2 amplification, P2-orange expressed higher levels of HER2 (Fig. 5f and Extended Data Fig. 9c). A total of 17 of 91 genes were differentially expressed and many of these are implicated in critical biological cancer pathways and/or have recognized prognostic value, including CTSL2, VEGFA (encoding vascular endothelial growth factor receptor A) and CD24 (refs. 42,43) (Fig. 5f). Spatially plotting these genes confirmed that clone-specific expression patterns are recapitulated within multiple, spatially distinct expansions across more than 1 cm2 of tissue (Extended Data Fig. 9a–c).
Integration of spatial transcriptomics data also revealed that metastatic subclones occupied distinct immune microenvironments. Relative to P2-orange cells, P2-blue cells resided in neighbourhoods enriched for T cells and B cells (Fig. 5e,g). In fact, P2-blue cells frequently formed clusters around B cell-rich germinal-like centres, highlighting a potential clone-specific interaction with the adaptive immune system (Fig. 5c and Extended Data Fig. 9a,d). By contrast, P2-orange regions frequently resided inside the lymph node sinuses that were lined by endothelial cells expressing CD34 and PDGFRB (Fig. 5c and Extended Data Fig. 9f). Most of the immune cells in P2-orange regions were myeloid cells with expression profiles consistent with the existence of both M1 and M2 macrophages (CD163, CD68, HAVCR2 and FCGR3A), and the most highly enriched gene, CXCL8, is released by hypoxic macrophages44 (Fig. 5e). Indeed, relative to P2-blue, it emerges that P2-orange experienced more hypoxic conditions manifesting as higher cancer cell expression of VEGFA and necrotic regions (Extended Data Fig. 9e,f). Hypoxia signatures are associated with adverse clinical outcomes, probably because they reflect the emergence of environments that can select for hypoxia-tolerant clones and/or cancer proliferation rates outstrip neoangiogenesis45. Together, these data demonstrate how BaSISS clone maps allow one to spatially relate such variation in microenvironments to individual clones.
Discussion
Here we present BaSISS, a pipeline that combines a highly multiplexed fluorescence microscopy-based protocol and algorithms to map and phenotypically characterize the unique set of subclones of cancer. These maps served as the basis for further spatially and single-cell-resolved molecular and histological characterization of each clone. Applying BaSISS to a series of samples from the key stages of breast cancer progression—carcinoma in situ, invasive cancer and lymph node metastasis—it is notable that virtually every sample exhibited a spatial organization of clones, which warrants further investigation in larger cohorts. The fact that nearly all clones examined in this dataset displayed distinct clone-specific gene expression, stromal and immune microenvironments and microanatomical niches highlights the functional relevance of at least some subclonal diversification.
The ability to chart clonal growth patterns and clone-specific genetic underpinnings of the tumour microenvironment is likely to be instrumental in elucidating how different evolutionary processes operate and manifest across different cancer types—or even in histologically normal tissues46. Understanding the forces of malignant progression, especially invasion and metastasis, and how interactions with the tumour microenvironment shape clinical outcomes10 appear of particular importance. Detailing the functional and microenvironmental characteristics of different clones is also relevant as some part of subclonal diversity in tumours may be due to selectively neutral drift, but the exact extent remains debated.
Particular advantages of the technology are that it is capable of interrogating very large tissue sections on the scale of squared centimetres, which enables studying entire cross-sections of smaller tumours. It is also comparably cheap, unlike solely relying on sequencing-based methods47. The three main limitations of the approach are relatively low sensitivity, which currently precludes single-cell genotyping, a reliance on RNA with the resulting variation in gene expression levels of targeted transcripts, and the fact that clone-defining mutations need to be detected first by separate sequencing-based assays. Greater sensitivity and spatial resolution may be achieved by including more targets per clone and by favouring mutations with higher predicted expression levels, for example, in higher copy number states. A switch to hybridization-based sequencing and direct RNA-binding probes may also improve base-specific detection by several fold48,49. Further discussion of the implications of our observations and limitations of the method is provided in a Supplementary Note.
It is often stated that “nothing in biology makes sense except in the light of evolution”50, which is likely to be true for cancer biology. The ability to spatially locate and molecularly characterize different cancer subclones adds essential features to the spatial-omics toolkit. It provides a robust evolutionary framework that is necessary to interpret the biological relevance of many of the more plastic spatial characteristics of a cancer. Future widespread applications of spatial genomics approaches such as BaSISS will uncover how cancers grow in different tissues and allow us to track, trace and characterize the ill-fated clones that are responsible for adverse clinical outcomes.
Reporting summary
Further information on research design is available in the Nature Portfolio Reporting Summary linked to this article.
Online content
Any methods, additional references, Nature Research reporting summaries, source data, extended data, supplementary information, acknowledgements, peer review information; details of author contributions and competing interests; and statements of data and code availability are available at 10.1038/s41586-022-05425-2.
Supplementary information
This file contains Supplementary Methods; Supplementary Discussion Notes; Statistics and Reproducibility and Supplementary References.
Padlock probe designs and BaSISS genotype matrices.
Clinical histopathological information.
Bulk WGS data; BaSISS panel mutations, clusters and signatures.
BaSISS and ISS performance metrics.
LCM WGS validation data.
Acknowledgements
This work was funded in part by the Wellcome Trust [Grant number 108413/A/15/D]. For the purpose of open access, the authors have applied a CC-BY public copyright licence to any Author Accepted Manuscript version arising from this submission. L.R.Y. is funded by a Wellcome Trust Clinical Research Career Development Fellowship (ref.: 214584/Z/18/Z). This work was supported by a pump-priming award from the Cancer Research UK Cambridge Centre Early Detection Programme (CRUK grant ref.: A25117). M.N. is funded by the Swedish Research Council (project grant 2019-01238), Cancerfonden (project grant CAN 2021/1726) and the strategic research area U-CAN. C.S. is funded by a fellowship from the Swedish Cancer Society (210401FE) and a research grant from the Cancer Society in Stockholm/the King Gustaf V Jubilee Foundation (rafo 174292). S.S. is supported by NCI U54 CA225088 and the Ludwig Center at Harvard. H.R. is funded by the Regional Health Authorities South-East (project grant 2019057). ISS technical assistance was provided by the In Situ Sequencing unit, part of the spatial and single-cell biology platform, funded by Science for Life Laboratory, Stockholm, Sweden. Samples and clinical data used in this study were provided by Dana Farber Cancer Institute under support of DF/HCC Breast SPORE: Specialized Program of Research Excellence (SPORE), an NCI-funded programme, grant 1P50CA168504. The content of this publication is solely the responsibility of the authors and does not necessarily represent the official views of the NIH/NCI.
Extended data figures and tables
Source data
Author contributions
J.S., P.J.C., M.N. and L.R.Y. designed the initial study. A.L., M.Gerstung and L.R.Y. analysed and interpreted the data and drafted the article and figures. J.S., M.N. and C.S. acquired the ISS data and contributed to data interpretation and manuscript preparation. A.L. and M. Gerstung developed the core mathematical models. A.S. and V.K. contributed to mathematical modelling. A.L. and G.R. developed the dedicated webtool interface. A.S. contributed to image segmentation and processing. A.L.R. and S.S. provided samples. S.S. and C.S. performed IHC. H.R., S.S., A.L.R. and S.P. contributed histopathological expertise. Y.S.J. contributed RNA sequencing expertise. S.D. performed WGS subclonality analysis. J.S.P., V.V., T.L., O.A.B. and M.Gataric contributed to the development of bespoke ISS analysis pipelines. All authors reviewed and commented on the manuscript.
Peer review
Peer review information
Nature thanks Naveed Ishaque, Roberto Salgado, Alexander Swarbrick and the other, anonymous, reviewer(s) for their contribution to the peer review of this work. Peer reviewer reports are available.
Data availability
Complete BaSISS and ISS datasets that are necessary to interpret, verify and extend the research in the article are available to download (ftp://ftp.sanger.ac.uk/pub/cancer/LomakinEtAl_BaSISS). Bulk tissue WGS data are deposited in the European Genome Phenome Archive and are available for download on request (https://ega-archive.org/datasets) with the following accessions: EGAD00001002696 (P2 samples, with IDs PD14780a, PD14780b, PD14780d and PD14780e) and EGAD00001000898 (P1 samples, with IDs PD9694a, PD9694b, PD9694c and PD9694d). Registered fluorescent microscopy images from ISS experiments have been deposited at BioImage Archive (https://www.ebi.ac.uk/bioimage-archive/) under accession number S-BIAD537. Public data used for single-cell RNA sequencing analysis were obtained from the NCBI’s Gene Expression Omnibus (https://www.ncbi.nlm.nih.gov/geo/query/acc.cgi?acc=GSE176078). Source data are provided with this paper.
Code availability
All scripts and custom code for data analysis, including step-by-step notebooks, are available at https://github.com/gerstung-lab/BaSISS and 10.5281/zenodo.703731. Code used to segment nuclei in images is available at https://github.com/yozhikoff/segmentation.
Competing interests
J.S. is now (but was not at the time of contribution to this manuscript) an employee of Spatial Transcriptomics, Part of 10X Genomics, Inc. Y.S.J. is co-founder of Genome Insight. C.S. is co-owner of HistoOne AB, and has research contracts with Prelude Dx. M.N. is an advisor to 10X Genomics. All other authors declare no competing interests.
Footnotes
Publisher’s note Springer Nature remains neutral with regard to jurisdictional claims in published maps and institutional affiliations.
These authors contributed equally: Artem Lomakin, Jessica Svedlund
Contributor Information
Moritz Gerstung, Email: moritz.gerstung@dkfz.de.
Mats Nilsson, Email: mats.nilsson@scilifelab.se.
Lucy R. Yates, Email: ly2@sanger.ac.uk
Extended data
is available for this paper at 10.1038/s41586-022-05425-2.
Supplementary information
The online version contains supplementary material available at 10.1038/s41586-022-05425-2.
References
- 1.Gerstung M, et al. The evolutionary history of 2,658 cancers. Nature. 2020;578:122–128. doi: 10.1038/s41586-019-1907-7. [DOI] [PMC free article] [PubMed] [Google Scholar]
- 2.Andor N, et al. Pan-cancer analysis of the extent and consequences of intratumor heterogeneity. Nat. Med. 2016;22:105–113. doi: 10.1038/nm.3984. [DOI] [PMC free article] [PubMed] [Google Scholar]
- 3.Yates LR, et al. Subclonal diversification of primary breast cancer revealed by multiregion sequencing. Nat. Med. 2015;21:751–759. doi: 10.1038/nm.3886. [DOI] [PMC free article] [PubMed] [Google Scholar]
- 4.Greaves M, Maley CC. Clonal evolution in cancer. Nature. 2012;481:306–313. doi: 10.1038/nature10762. [DOI] [PMC free article] [PubMed] [Google Scholar]
- 5.McGranahan N, Swanton C. Clonal heterogeneity and tumor evolution: past, present, and the future. Cell. 2017;168:613–628. doi: 10.1016/j.cell.2017.01.018. [DOI] [PubMed] [Google Scholar]
- 6.Nowell PC. The clonal evolution of tumor cell populations. Science. 1976;194:23–28. doi: 10.1126/science.959840. [DOI] [PubMed] [Google Scholar]
- 7.Dentro SC, et al. Characterizing genetic intra-tumor heterogeneity across 2,658 human cancer genomes. Cell. 2021;184:2239–2254.e39. doi: 10.1016/j.cell.2021.03.009. [DOI] [PMC free article] [PubMed] [Google Scholar]
- 8.Nik-Zainal S, et al. The life history of 21 breast cancers. Cell. 2012;149:994–1007. doi: 10.1016/j.cell.2012.04.023. [DOI] [PMC free article] [PubMed] [Google Scholar]
- 9.Gaglia G, et al. Temporal and spatial topography of cell proliferation in cancer. Nat. Cell Biol. 2022;24:316–326. doi: 10.1038/s41556-022-00860-9. [DOI] [PMC free article] [PubMed] [Google Scholar]
- 10.Risom T, et al. Transition to invasive breast cancer is associated with progressive changes in the structure and composition of tumor stroma. Cell. 2022;185:299–310.e18. doi: 10.1016/j.cell.2021.12.023. [DOI] [PMC free article] [PubMed] [Google Scholar]
- 11.Dhainaut M, et al. Spatial CRISPR genomics identifies regulators of the tumor microenvironment. Cell. 2022;185:1223–1239.e20. doi: 10.1016/j.cell.2022.02.015. [DOI] [PMC free article] [PubMed] [Google Scholar]
- 12.Yates LR, et al. Genomic evolution of breast cancer metastasis and relapse. Cancer Cell. 2017;32:169–184.e7. doi: 10.1016/j.ccell.2017.07.005. [DOI] [PMC free article] [PubMed] [Google Scholar]
- 13.Maley CC, et al. Genetic clonal diversity predicts progression to esophageal adenocarcinoma. Nat. Genet. 2006;38:468–473. doi: 10.1038/ng1768. [DOI] [PubMed] [Google Scholar]
- 14.Jamal-Hanjani M, et al. Tracking the evolution of non–small-cell lung cancer. N. Engl. J. Med. 2017;376:2109–2121. doi: 10.1056/NEJMoa1616288. [DOI] [PubMed] [Google Scholar]
- 15.Janiszewska M, et al. Subclonal cooperation drives metastasis by modulating local and systemic immune microenvironments. Nat. Cell Biol. 2019;21:879–888. doi: 10.1038/s41556-019-0346-x. [DOI] [PMC free article] [PubMed] [Google Scholar]
- 16.Juric D, et al. Convergent loss of PTEN leads to clinical resistance to a PI(3)Kα inhibitor. Nature. 2015;518:240–244. doi: 10.1038/nature13948. [DOI] [PMC free article] [PubMed] [Google Scholar]
- 17.Jones S, et al. Comparative lesion sequencing provides insights into tumor evolution. Proc. Natl Acad. Sci. USA. 2008;105:4283–4288. doi: 10.1073/pnas.0712345105. [DOI] [PMC free article] [PubMed] [Google Scholar]
- 18.Shah SP, et al. Mutational evolution in a lobular breast tumour profiled at single nucleotide resolution. Nature. 2009;461:809–813. doi: 10.1038/nature08489. [DOI] [PubMed] [Google Scholar]
- 19.Casasent AK, et al. Multiclonal invasion in breast tumors identified by topographic single cell sequencing. Cell. 2018;172:205–217.e12. doi: 10.1016/j.cell.2017.12.007. [DOI] [PMC free article] [PubMed] [Google Scholar]
- 20.Tarabichi M, et al. A practical guide to cancer subclonal reconstruction from DNA sequencing. Nat. Methods. 2021;18:144–155. doi: 10.1038/s41592-020-01013-2. [DOI] [PMC free article] [PubMed] [Google Scholar]
- 21.Shen CY, et al. Genome-wide search for loss of heterozygosity using laser capture microdissected tissue of breast carcinoma: an implication for mutator phenotype and breast cancer pathogenesis. Cancer Res. 2000;60:3884–3892. [PubMed] [Google Scholar]
- 22.Zhao T, et al. Spatial genomics enables multi-modal study of clonal heterogeneity in tissues. Nature. 2022;601:85–91. doi: 10.1038/s41586-021-04217-4. [DOI] [PMC free article] [PubMed] [Google Scholar]
- 23.Erickson A, et al. Spatially resolved clonal copy number alterations in benign and malignant tissue. Nature. 2022;608:360–367. doi: 10.1038/s41586-022-05023-2. [DOI] [PMC free article] [PubMed] [Google Scholar]
- 24.Janiszewska M, et al. In situ single-cell analysis identifies heterogeneity for PIK3CA mutation and HER2 amplification in HER2-positive breast cancer. Nat. Genet. 2015;47:1212–1219. doi: 10.1038/ng.3391. [DOI] [PMC free article] [PubMed] [Google Scholar]
- 25.Larsson C, Grundberg I, Söderberg O, Nilsson M. In situ detection and genotyping of individual mRNA molecules. Nat. Methods. 2010;7:395–397. doi: 10.1038/nmeth.1448. [DOI] [PubMed] [Google Scholar]
- 26.Grundberg I, et al. In situ mutation detection and visualization of intratumor heterogeneity for cancer research and diagnostics. Oncotarget. 2013;4:2407–2418. doi: 10.18632/oncotarget.1527. [DOI] [PMC free article] [PubMed] [Google Scholar]
- 27.Ke R, et al. In situ sequencing for RNA analysis in preserved tissue and cells. Nat. Methods. 2013;10:857–860. doi: 10.1038/nmeth.2563. [DOI] [PubMed] [Google Scholar]
- 28.Baker A-M, et al. Robust RNA-based in situ mutation detection delineates colorectal cancer subclonal evolution. Nat. Commun. 2017;8:1998. doi: 10.1038/s41467-017-02295-5. [DOI] [PMC free article] [PubMed] [Google Scholar]
- 29.Cowell CF, et al. Progression from ductal carcinoma in situ to invasive breast cancer: revisited. Mol. Oncol. 2013;7:859–869. doi: 10.1016/j.molonc.2013.07.005. [DOI] [PMC free article] [PubMed] [Google Scholar]
- 30.Svedlund J, et al. Generation of in situ sequencing based OncoMaps to spatially resolve gene expression profiles of diagnostic and prognostic markers in breast cancer. EBioMedicine. 2019;48:212–223. doi: 10.1016/j.ebiom.2019.09.009. [DOI] [PMC free article] [PubMed] [Google Scholar]
- 31.Wu SZ, et al. A single-cell and spatially resolved atlas of human breast cancers. Nat. Genet. 2021;53:1334–1347. doi: 10.1038/s41588-021-00911-1. [DOI] [PMC free article] [PubMed] [Google Scholar]
- 32.Ellis P, et al. Reliable detection of somatic mutations in solid tissues by laser-capture microdissection and low-input DNA sequencing. Nat. Protoc. 2021;16:841–871. doi: 10.1038/s41596-020-00437-6. [DOI] [PubMed] [Google Scholar]
- 33.Gataric, M. et al. PoSTcode: probabilistic image-based spatial transcriptomics decoder. Preprint at 10.1101/2021.10.12.464086 (2021).
- 34.Nirmal AJ, et al. The spatial landscape of progression and immunoediting in primary melanoma at single-cell resolution. Cancer Discov. 2022;12:1518–1541. doi: 10.1158/2159-8290.CD-21-1357. [DOI] [PMC free article] [PubMed] [Google Scholar]
- 35.Kole AJ, et al. Overall survival is improved when DCIS accompanies invasive breast cancer. Sci. Rep. 2019;9:9934. doi: 10.1038/s41598-019-46309-2. [DOI] [PMC free article] [PubMed] [Google Scholar]
- 36.Going JJ, Moffat DF. Escaping from flatland: clinical and biological aspects of human mammary duct anatomy in three dimensions. J. Pathol. 2004;203:538–544. doi: 10.1002/path.1556. [DOI] [PubMed] [Google Scholar]
- 37.Schnitt, S. J. & Collins, L. C. Biopsy Interpretation of the Breast (Lippincott Williams & Wilkins, 2009).
- 38.Pinder SE. Ductal carcinoma in situ (DCIS): pathological features, differential diagnosis, prognostic factors and specimen evaluation. Mod. Pathol. 2010;23:S8–S13. doi: 10.1038/modpathol.2010.40. [DOI] [PubMed] [Google Scholar]
- 39.Thomson JZ, et al. Growth pattern of ductal carcinoma in situ (DCIS): a retrospective analysis based on mammographic findings. Br. J. Cancer. 2001;85:225–227. doi: 10.1054/bjoc.2001.1877. [DOI] [PMC free article] [PubMed] [Google Scholar]
- 40.Solin LJ, et al. A multigene expression assay to predict local recurrence risk for ductal carcinoma in situ of the breast. J. Natl Cancer Inst. 2013;105:701–710. doi: 10.1093/jnci/djt067. [DOI] [PMC free article] [PubMed] [Google Scholar]
- 41.Jatoi, I., Hilsenbeck, S. G., Clark, G. M. & Osborne, C. K. Significance of axillary lymph node metastasis in primary breast cancer. J. Clin. Oncol.17, 2334–2340 (1999) [DOI] [PubMed]
- 42.Sereesongsaeng N, McDowell SH, Burrows JF, Scott CJ, Burden RE. Cathepsin V suppresses GATA3 protein expression in luminal A breast cancer. Breast Cancer Res. 2020;22:139. doi: 10.1186/s13058-020-01376-6. [DOI] [PMC free article] [PubMed] [Google Scholar]
- 43.Kwon MJ, et al. CD24 overexpression is associated with poor prognosis in luminal A and triple-negative breast cancer. PLoS ONE. 2015;10:e0139112. doi: 10.1371/journal.pone.0139112. [DOI] [PMC free article] [PubMed] [Google Scholar]
- 44.Li X-P, et al. Co-expression of CXCL8 and HIF-1α is associated with metastasis and poor prognosis in hepatocellular carcinoma. Oncotarget. 2015;6:22880–22889. doi: 10.18632/oncotarget.4412. [DOI] [PMC free article] [PubMed] [Google Scholar]
- 45.Cairns RA, Hill RP. Acute hypoxia enhances spontaneous lymph node metastasis in an orthotopic murine model of human cervical carcinoma. Cancer Res. 2004;64:2054–2061. doi: 10.1158/0008-5472.can-03-3196. [DOI] [PubMed] [Google Scholar]
- 46.Sottoriva A, et al. A Big Bang model of human colorectal tumor growth. Nat. Genet. 2015;47:209–216. doi: 10.1038/ng.3214. [DOI] [PMC free article] [PubMed] [Google Scholar]
- 47.Vickovic S, et al. High-definition spatial transcriptomics for in situ tissue profiling. Nat. Methods. 2019;16:987–990. doi: 10.1038/s41592-019-0548-y. [DOI] [PMC free article] [PubMed] [Google Scholar]
- 48.Gyllborg D, et al. Hybridization-based in situ sequencing (HybISS) for spatially resolved transcriptomics in human and mouse brain tissue. Nucleic Acids Res. 2020;48:e112. doi: 10.1093/nar/gkaa792. [DOI] [PMC free article] [PubMed] [Google Scholar]
- 49.Lee H, Marco Salas S, Gyllborg D, Nilsson M. Direct RNA targeted in situ sequencing for transcriptomic profiling in tissue. Sci. Rep. 2022;12:7976. doi: 10.1038/s41598-022-11534-9. [DOI] [PMC free article] [PubMed] [Google Scholar]
- 50.Dobzhansky T. Nothing in biology makes sense except in the light of evolution. Am. Biol. Teach. 1973;35:125–129. [Google Scholar]
Associated Data
This section collects any data citations, data availability statements, or supplementary materials included in this article.
Supplementary Materials
This file contains Supplementary Methods; Supplementary Discussion Notes; Statistics and Reproducibility and Supplementary References.
Padlock probe designs and BaSISS genotype matrices.
Clinical histopathological information.
Bulk WGS data; BaSISS panel mutations, clusters and signatures.
BaSISS and ISS performance metrics.
LCM WGS validation data.
Data Availability Statement
Complete BaSISS and ISS datasets that are necessary to interpret, verify and extend the research in the article are available to download (ftp://ftp.sanger.ac.uk/pub/cancer/LomakinEtAl_BaSISS). Bulk tissue WGS data are deposited in the European Genome Phenome Archive and are available for download on request (https://ega-archive.org/datasets) with the following accessions: EGAD00001002696 (P2 samples, with IDs PD14780a, PD14780b, PD14780d and PD14780e) and EGAD00001000898 (P1 samples, with IDs PD9694a, PD9694b, PD9694c and PD9694d). Registered fluorescent microscopy images from ISS experiments have been deposited at BioImage Archive (https://www.ebi.ac.uk/bioimage-archive/) under accession number S-BIAD537. Public data used for single-cell RNA sequencing analysis were obtained from the NCBI’s Gene Expression Omnibus (https://www.ncbi.nlm.nih.gov/geo/query/acc.cgi?acc=GSE176078). Source data are provided with this paper.
All scripts and custom code for data analysis, including step-by-step notebooks, are available at https://github.com/gerstung-lab/BaSISS and 10.5281/zenodo.703731. Code used to segment nuclei in images is available at https://github.com/yozhikoff/segmentation.


