Abstract
The production of autologous T cells expressing a chimaeric antigen receptor (CAR) is time-consuming, costly and occasionally unsuccessful. T-cell-derived induced pluripotent stem cells (TiPS) are a promising source for the generation of ‘off-the-shelf’ CAR T cells, but the in vitro differentiation of TiPS often yields T cells with suboptimal features. Here we show that the premature expression of the T-cell receptor (TCR) or a constitutively expressed CAR in TiPS promotes the acquisition of an innate phenotype, which can be averted by disabling the TCR and relying on the CAR to drive differentiation. Delaying CAR expression and calibrating its signalling strength in TiPS enabled the generation of human TCR– CD8αβ+ CAR T cells that perform similarly to CD8αβ+ CAR T cells from peripheral blood, achieving effective tumour control on systemic administration in a mouse model of leukaemia and without causing graft-versus-host disease. Driving T-cell maturation in TiPS in the absence of a TCR by taking advantage of a CAR may facilitate the large-scale development of potent allogeneic CD8αβ+ T cells for a broad range of immunotherapies.
T cells that are engineered to express a chimaeric antigen receptor (CAR) can direct potent therapeutic responses in patients with chemorefractory haematologic malignancies1. CARs are synthetic receptors that redirect T cell specificity and augment T cell functions to overcome tumour resistance2. CAR T cells are now under investigation in a range of diseases, including solid tumours, infectious disease, autoimmunity and senescence-associated pathologies3–5. CAR T cells are generally produced in autologous fashion, which is effective but presents some challenges. Manufacturing time is critical for patients with rapidly progressing disease; cell product variability is high because patient T cells may be reduced in number or functionality due to progressive disease or previous therapies; manufacturing processes and release testing are required on an individual basis and are costly6, 7. Alternate T cell sources are under investigation to enable ‘off-the-shelf’ cellular therapy, including donor-derived lymphoid progenitors, T cells lacking alloreactive potential (virus-specific T cells, γδTCR-T cells, invariant natural killer T (iNKT) cells and TCR-edited T cells) and pluripotent stem cell-derived T cells8, 9. The use of allogeneic T cells collected from healthy donors is the most explored alternative source, with some promising clinical results already obtained10. However, maintaining product consistency after genetic engineering and manufacturing large cell batches of sufficient cell purity to avert graft-versus host disease (GvHD) remain a challenge11. Pluripotent stem cells provide an attractive solution to overcome challenges associated with the use of autologous or allogeneic blood cells cells12. Their self-renewing capacity should facilitate the selection of clones of a desired genotype, eventually combining multiple edits to enhance anti-tumour functions and pre-empt alloreactivity and allorejection, and support large-scale production8, 13, 14.
We have previously demonstrated that CAR T cells can be generated from reprogrammed T-cell-derived induced pluripotent stem cells (TiPS)12. These original TiPS were retrovirally transduced to express a CD19-specific CAR (CAR-TiPS) and re-differentiated into T cells. The CAR T cells induced therefrom (CAR-iT) homogeneously expressed both the transduced CAR (1928z) and the endogenous αβTCR. The CAR-iT cells were specific for CD19, highly lytic and controlled tumour growth in an intraperitoneal lymphoma model in NSG mice12. Despite expressing their endogenous αβTCR, these CAR-iT cells did not acquire a conventional CD4 or CD8αβ T cell phenotype, but rather an innate-like CD4−CD8αβ− double-negative (DN) or CD8αα single-positive (SP) phenotype. Transcriptional analyses confirmed that these CAR-iT cells more closely resembled γδTCR-T cells than αβTCR-T cells12. This lineage divergence was recently observed in another model wherein the constitutive expression of an LMP2-specific CAR in TiPS yielded DN and CD8α T cell phenotypes15. In another report, the lymphoid differentiation of induced pluripotent stem cells expressing a GPC3-specific CAR failed to induce characteristic T-cell markers such as CD5 and CD3 and rather produced natural killer (NK) or innate lymphoid cells (ILC)16. These reports raise the questions of why T lineage commitment is deferred towards innate phenotypes and what is required to induce CD8αβ CAR T cells.
Here we set out to analyse the impact of TCR and CAR expression on the commitment of TiPS-derived lymphoid progenitors to adaptive T-cell lineages. Physiological αβTCR-T-cell development is regulated by TCR gene recombination, Notch and preTCR/TCR signalling17. The TCR and Notch are central to the adoption of either γδTCR- or αβTCR-T-cell fates. The earlier rearrangement of the γ- and δ-chains results in maturation of γδTCR-T-cells with a DN or CD8αα SP phenotype18, whereas successful pre-TCR and αβTCR assembly drive progression from the DN to the CD4+CD8αβ+ double positive (DP) stage before yielding SP T-cells19, 20. We show that premature αβTCR or constitutive CAR expression interfere with DP formation, depending on the strength of Notch stimulation. Delaying CAR expression through TRAC promoter-controlled expression and calibration of CAR signalling through CD3ζ immunoreceptor tyrosine activation motif (ITAM) mutations enable DP CAR+ induced T (iT) cell development. In absence of an αβTCR, the CAR drives T-cell maturation and yields CD8αβ+ CAR+ iT cells that mediate durable remissions in a systemic leukaemia model.
Results
Delta-like ligand 4 (DLL4) stimulation facilitates CD4+CD8αβ+ DP iT cell development from WT-TiPS but not CAR-TiPS.
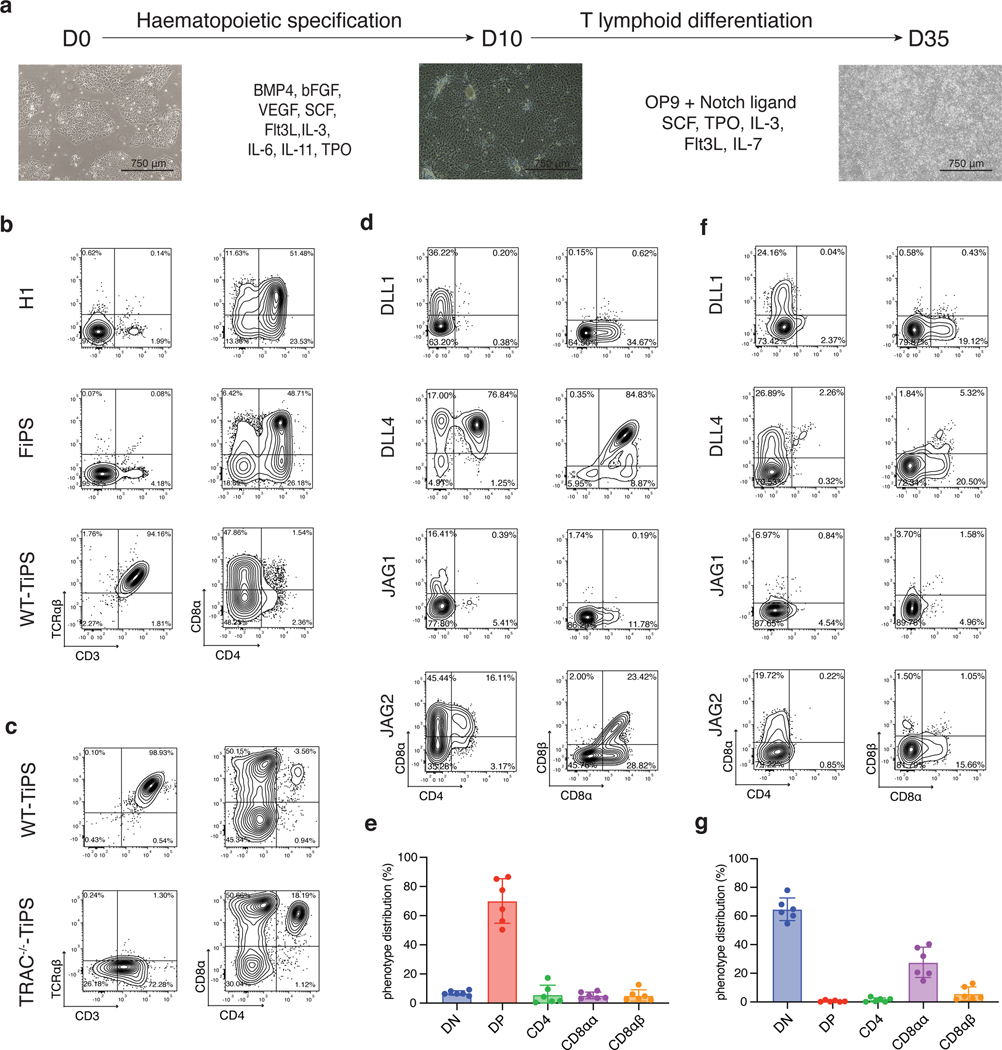
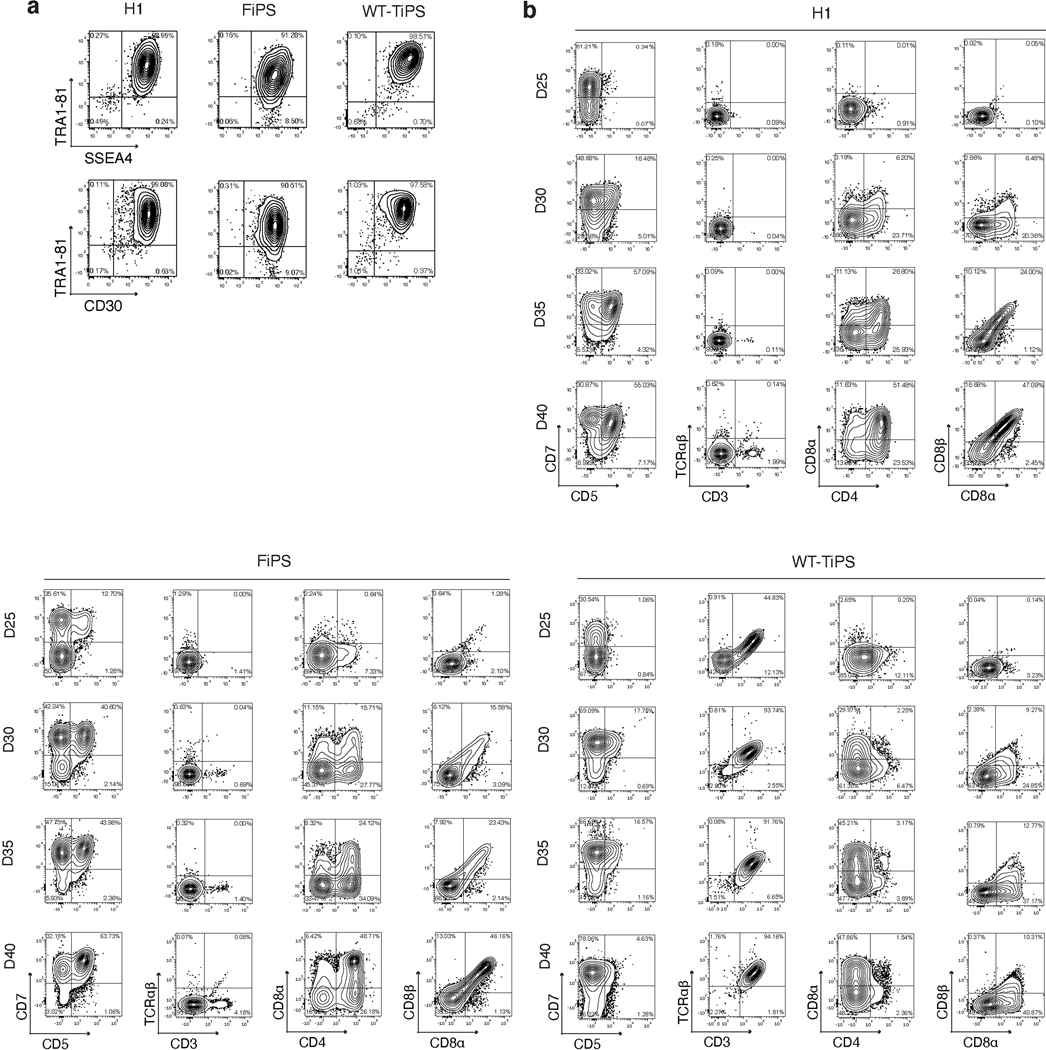
We determined the yield of CD4+CD8αβ+ DP αβTCR-T cell precursors from pluripotent stem cells using the OP9-mDLL1 stromal cell line in the differentiation protocol shown in Fig. 1a. The human embryonic stem (ES) cell line H1 and fibroblast-derived induced pluripotent stem cells (FiPS) cells consistently yielded a DP population, typically arising by day 35 and followed by the appearance of CD3+ cells by day 40 (Fig. 1b and Extended Data Fig. 1a,b). When differentiating unmodified, wild-type TiPS (WT-TiPS, Extended Data Fig. 1a) under the same conditions, very few DP cells were induced (Fig. 1b). Nonetheless, CD3+ αβTCR+ cells were generated, appearing much earlier, typically by day 25 (Fig. 1b and Extended Data Fig. 1b) and eschewing the DP intermediate state.
Fig. 1. DLL4 supports in vitro αβTCR-T cell development of WT-TiPS but not CAR-TiPS.
a, Schematic representation of in vitro T cell differentiation protocol. Microscope images are at 4x magnification, scale bar represents 750μm. b, Flow cytometric analysis of T lineage commitment of H1, FiPS and WT-TiPS on OP9-mDLL1, gated on live CD45+CD7+ cells at day 40 (D40) in the differentiation. c, Flow cytometric analysis of T lineage commitment of WT-TiPS and TRAC−/−-TiPS on OP9-mDLL1, gated on live CD45+ cells at D40 in the differentiation. d, f, Representative flow cytometric analysis of T lineage commitment of WT-TiPS (d) and CAR-TiPS (f) on D35 in differentiation on OP9 expressing the indicated human Notch ligand, gated on live CD45+CD7+ cells. e, g, Phenotype distribution of WT-TiPS (e, n = 6 biological replicates) or CAR-TiPS (g, n = 6 biological replicates) on D35 of differentiation on OP9-DLL4, gated on live CD45+CD7+ cells. All data are means ± s.d.
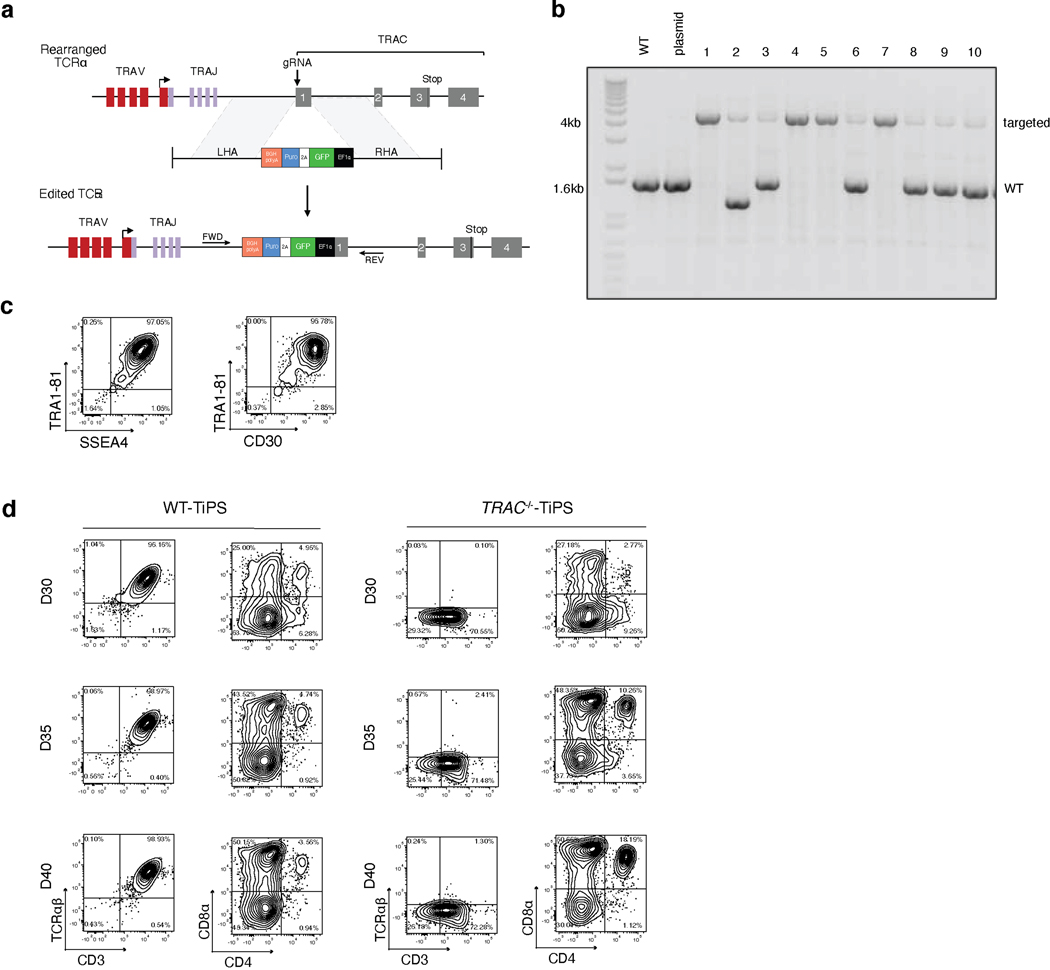
As the variable (V), diversity (D), and junctional (J) αβTCR genes are pre-rearranged in WT-TiPS, in contrast to their germline configuration in ES and FiPS cells, we reasoned that V gene transcription, which normally precedes VDJ recombination, would result in the premature expression of rearranged αβTCR genes in TiPS. We further hypothesised that the early formation of an αβTCR would mimic the earlier timing of a productive γδTCR rearrangement, and thus bypass DP cell formation and impart an innate phenotype18. To preclude early TCR assembly, we abolished TCRα chain expression by disrupting the TRAC locus (Extended Data Fig. 2a–c). Disrupting the TRAC locus (TRAC−/−-TiPS) indeed allowed for increased DP cell formation from TRAC−/−-TiPS compared with WT-TiPS (Fig. 1c and Extended Data Fig. 2d), supporting the notion that early TCR signalling prevents αβTCR-T cell lineage commitment21. The altered lineage commitment also corroborated that our differentiation protocol (Fig. 1a) supports DP cell development and pointed to the critical importance of the timing of TCR assembly in determining the fate of TiPS-derived T cells.
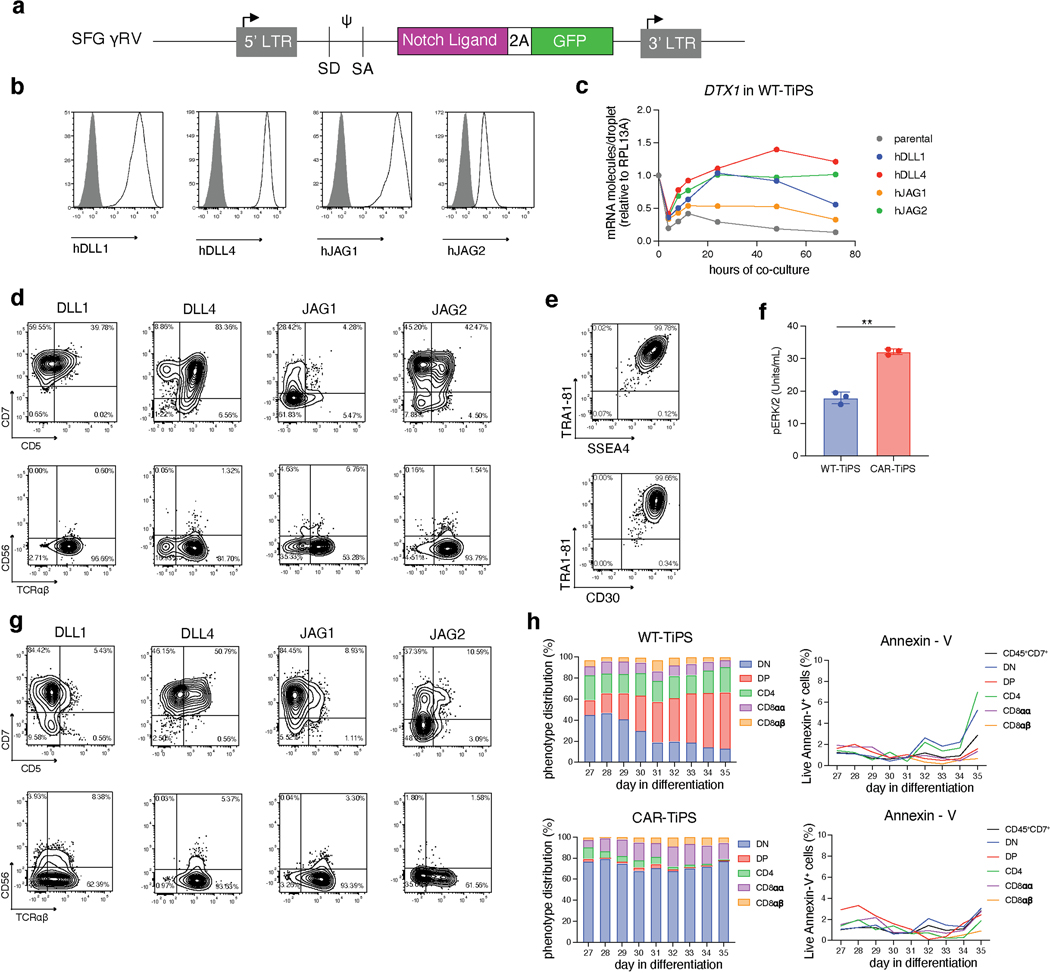
As Notch signalling also plays a critical role at the αβ- versus γδ-lineage commitment junction22, we investigated its role by first assessing different Notch ligands for their ability to support T cell differentiation from TiPS. We engineered OP9 stromal cells to express either one of the four human Notch ligands, Delta-like ligand 1 (DLL1), Delta-like ligand 4 (DLL4), Jagged-1 (JAG1) or Jagged-2 (JAG2) (Extended Data Fig. 3a, b). These ligands displayed a gradation in their level of Notch signalling induction (Extended Data Fig. 3c) and, correspondingly, their ability to support T lineage commitment and DP formation from WT-TiPS (Fig. 1d and Extended Data Fig. 3d). DLL1 and JAG1 were unable to support DP T cell development, in contrast with JAG2 and DLL4, the latter showing the greatest efficiency in both T lineage commitment (CD7+CD5+ positive cells, Extended Data Fig. 3d) and DP formation (Fig. 1d, e). Interestingly, DLL4 has been previously shown to efficiently support in vitro T cell differentiation after TCR gene rearrangement23 and induces the strongest signalling from Notch124 (Extended Data Fig. 3c).
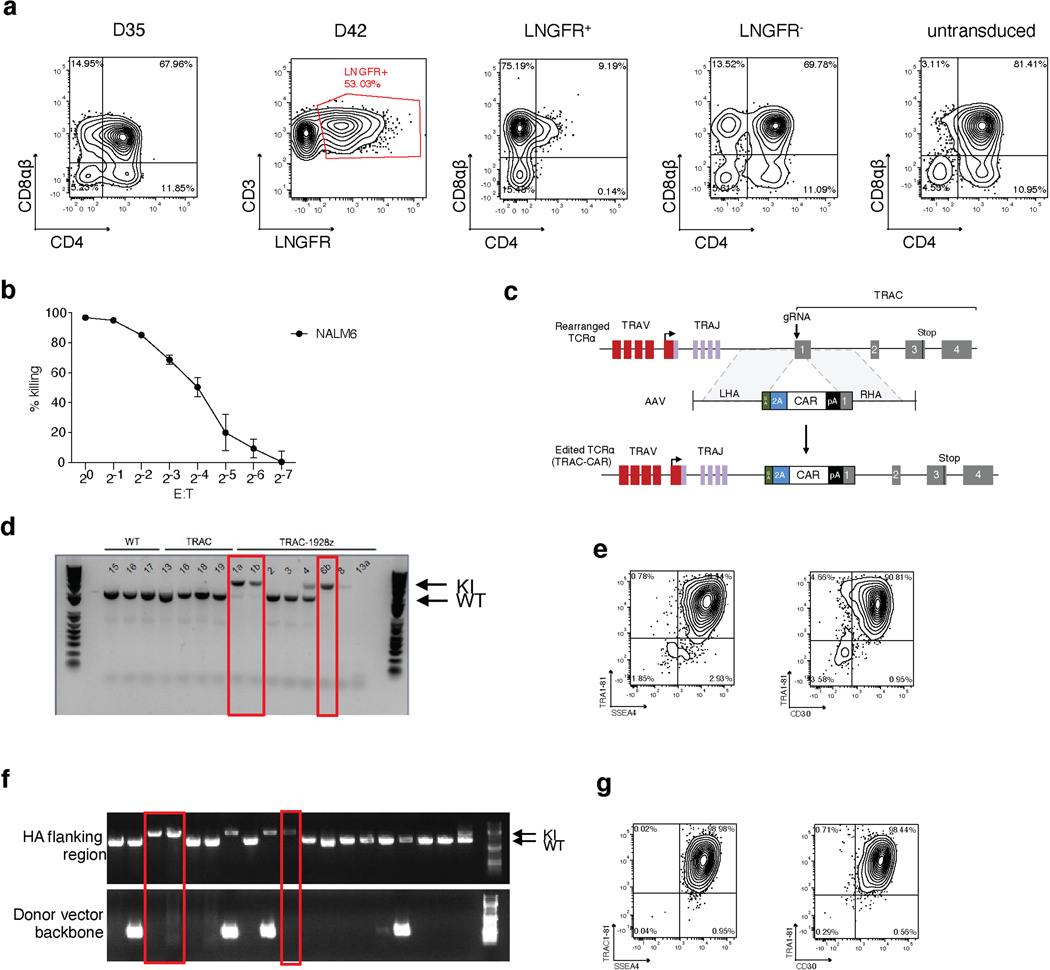
These findings support a model wherein DP cell formation depends on an intricate interaction between TCR and Notch stimulation, in which a potent DLL4-mediated signal is required in WT-TiPS because of the earlier expression of a functional TCR, whereas DLL1 suffices for H1 and TRAC−/−-TiPS. The requirement for stronger Notch engagement in the context of earlier TCR assembly suggests that the TCR interferes with Notch signalling, which can be over-ridden by more potent Notch ligands, and that a strong activation signal from the CAR25, 26 and the TCR would offset stronger Notch signalling. Consistent with this model, we found that TiPS that constitutively expressed the 1928z CAR (CAR-TiPS, Extended Data Fig. 3e), had increased levels of extracellular signal-regulated kinase (ERK)1/2 phosphorylation (Extended Data Fig. 3f), induced fewer CD7+CD5+ cells, and did not produce DP cells, even in the presence of DLL4, instead generating DN and CD8αα iT cells (Fig. 1f, g and Extended Data Fig. 3g). To assess whether premature CAR signalling induces apoptosis in emerging DP cells, we measured apoptotic cells at the different developmental stages (DN, DP, CD4 induced SP, CD8αα SP and CD8αβ SP) in WT-TiPS and CAR-TiPS from D27 – D35, when the induction of the DP population occurs in WT-TiPS (Extended Data Fig. 3h). Levels of apoptosis were uniformly low (<5%) in both WT-TiPS and CAR-TiPS, and similar in all different developmental stages, suggesting that the lack of DP establishment from CAR-TiPS is not due to global apoptosis of the DP population. To verify whether the development of CD8αβ iT cells is feasible in the presence of a CAR, we transduced the CAR into DP cells arising from WT-TiPS on D35. Delaying the onset of CAR expression in this manner resulted in the development of functional SP cells, including CD8αβ CAR+ iT cells (Extended Data Fig. 4a, b). This finding not only established that CD8αβ CAR+ iT cells can be generated from TiPS, but also confirmed that the lack of DP formation from CAR-TiPS was probably due to interference with DP commitment arising from the early CAR expression afforded by the constitutive Ubiquitin C promoter in CAR-TiPS.
Regulated CAR expression facilitates CD4+CD8αβ+ DP iT cell development.
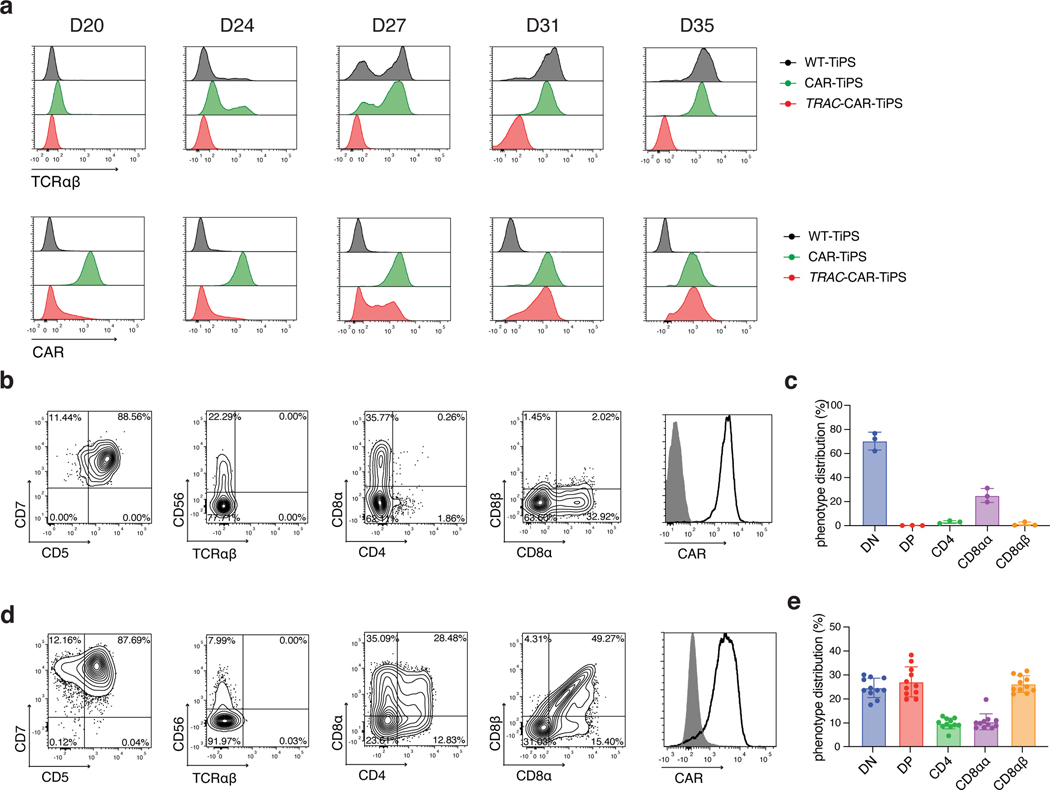
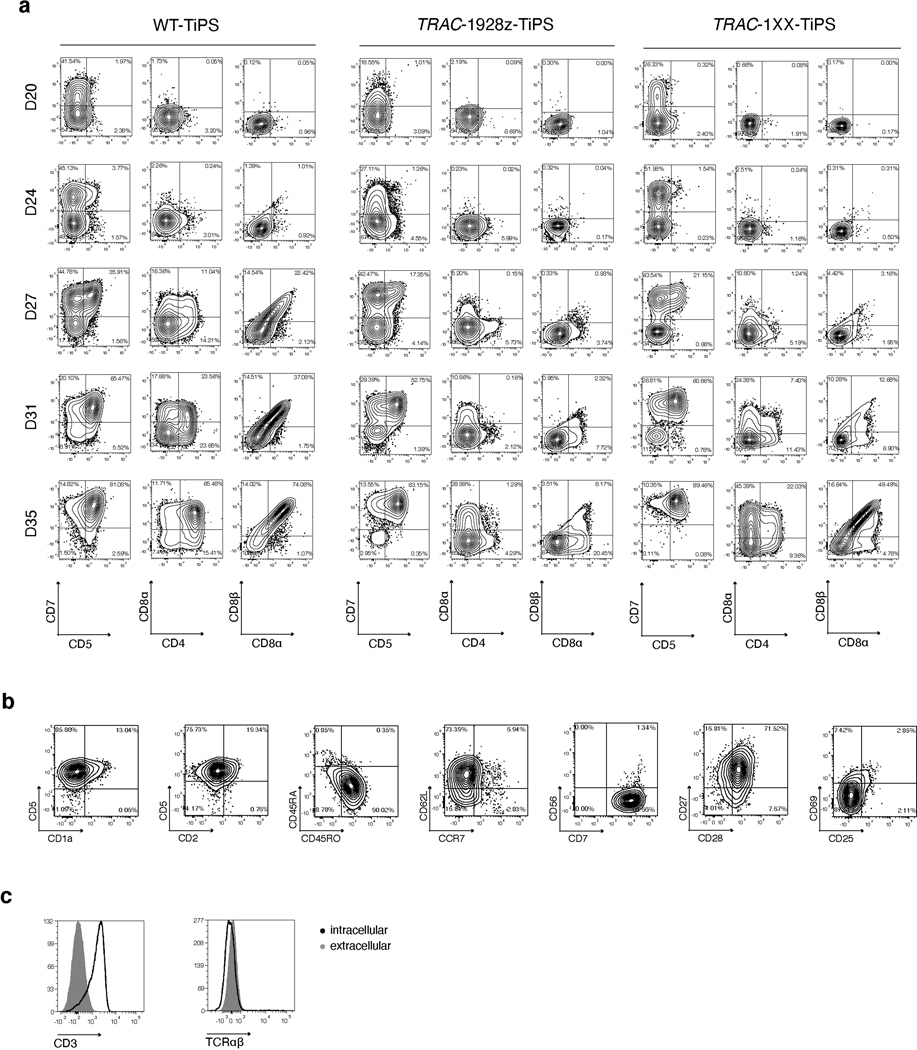
To restrict CAR expression, we placed it under the transcriptional control of the TRAC promoter (TRAC-1928z-TiPS, Extended Data Fig. 4c–e). CAR expression from the TRAC locus not only resulted in the expected absence of TCR expression throughout differentiation (Fig. 2a, top panel), but also showed the remarkable similarity in temporal cell-surface expression between TRAC-CAR and the αβTCR in both WT-TiPS and CAR-TiPS (Fig. 2a). The differentiation of TRAC-1928z-TiPS towards early T cell lineage commitment improved, as reflected in a greater CD7+CD5+ population (Fig. 2b) compared with CAR-TiPS (Extended Data Fig. 3g). DP induction, however, was still not enhanced (Fig. 2b, c and Extended Data Fig. 5a).
Fig. 2. TRAC-controlled 1928z-1XX CAR expression facilitates DP T cell development.
a, Induction of αβTCR (upper panel) and CAR (lower panel) expression in WT-TiPS, CAR-TiPS and TRAC-CAR-TiPS throughout T lymphoid development on OP9-DLL4 at the indicated timepoints. Gated on live CD45+CD7+ cells. b, d, Representative flow cytometric analysis of T lineage commitment markers of TRAC-1928z-TiPS (b) and TRAC-1XX-TiPS (d) gated on live CD45+ cells at D35 in differentiation on OP9-DLL4. c, e, D35 phenotype distribution of TRAC-1928z-TiPS (c, n = 3 biological replicates) and TRAC-1XX-TiPS (e, n = 11 biological replicates) at D35 gated on live CD45+CD7+ cells. All data are means ± s.d.
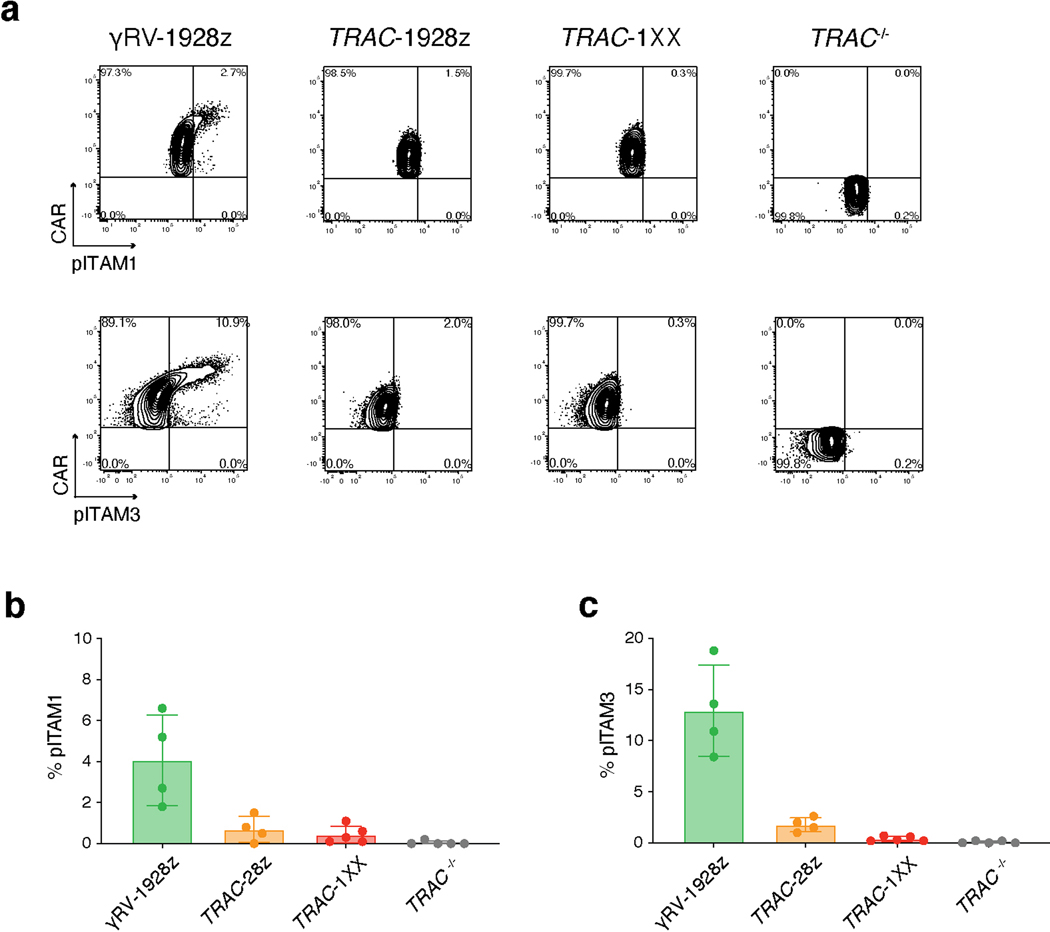
We hypothesized that despite its delayed onset of expression, the TRAC-encoded 1928z still interfered enough to prevent DP commitment. We therefore sought to attenuate CAR signalling strength by substituting the 1928z with 1928z-1XX, a CAR in which the second and third ITAM have been inactivated27. In peripheral blood mononuclear cells (PBMC)-derived T cells, CAR expression through the endogenous TRAC promoter reduced signalling in the absence of antigen exposure28, and the mutation of the second and third ITAMs pre-empted their phosphorylation27. Phosphorylation of ITAM1 and ITAM3 was readily detected in retrovirally expressed CARs (γRV-1928z) in the absence of antigen, increasingly in T cells with the highest CAR expression (Extended Data Fig. 6a–c). TRAC-encoded 1928z showed reduced phosphorylation of ITAM1 and ITAM3, while the latter was abolished in TRAC-1XX T cells (Extended Data Fig. 6a–c).
Upon their differentiation, TRAC-1XX-TiPS (Extended Data Fig. 4f, g) not only maintained the same heightened propensity to induce CD7 and CD5 expression as TRAC-1928z-TiPS, but additionally increased their progression to the DP stage (Fig. 2d, e and Extended Data Fig. 5a). By day 35, these DP cells expressed CD1a, CD2 and CD45RO, consistent with the phenotype of human DP thymocytes29–31 (Extended Data Fig. 5b). Intracellular CD3 confirmed their T lineage commitment despite the absence of CD3 and αβTCR expression at their cell surface (Extended Data Fig. 5c).
CAR expression affects Notch and TCR downstream target gene induction.
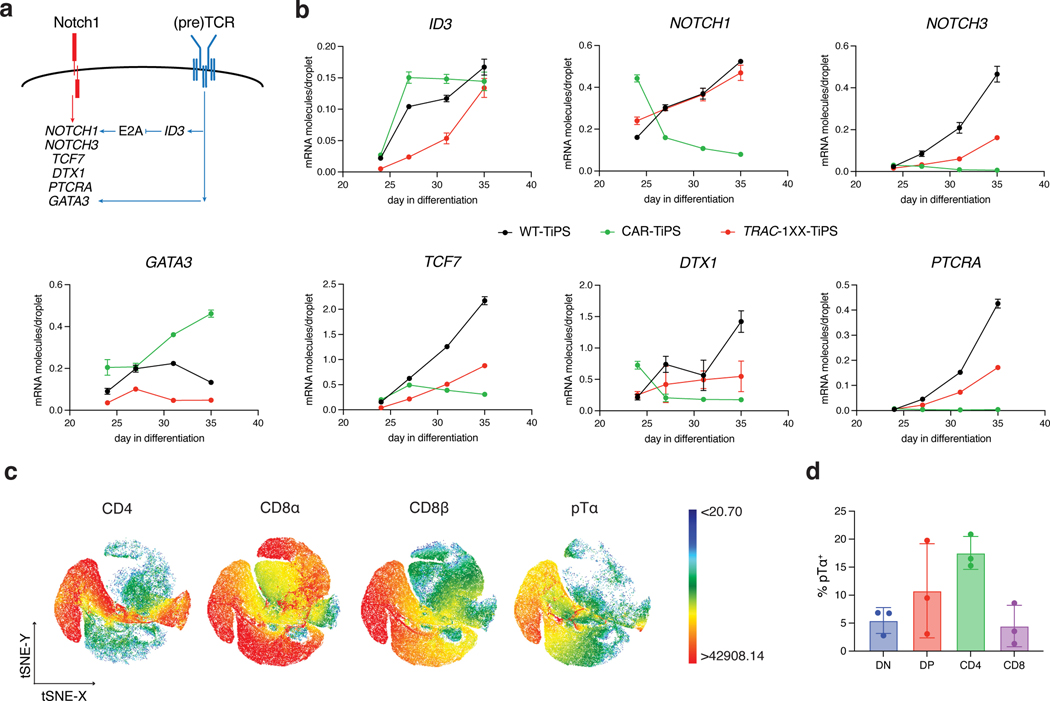
To further support our hypothesis that the induction to the DP stage is controlled by CAR and Notch interactions, we assessed the impact of CAR regulation on Notch target transcript levels during the T lineage commitment phase of our in vitro differentiation protocol. We assessed the expression level of several genes that have been reported to be associated with T lymphoid development and αβ/γδ lineage commitment, including NOTCH1, NOTCH3, ID3, TCF7, DTX1, GATA3 and PTCRA (Fig. 3a)32–34. Constitutive CAR expression did indeed grossly perturbed the expression pattern observed in WT-TiPS. CAR-TiPS showed an early increase in the expression of the (pre)TCR target ID3 between D24 and D27 (Fig. 3b), with correspondingly reduced levels of NOTCH1, NOTCH3 and Notch targets TCF7, DTX1 and PTCRA. In the TRAC-1XX-TiPS, ID3 expression was decreased while NOTCH1, NOTCH3 and their downstream targets increased to levels nearing those found in WT-TiPS (Fig. 3b). GATA3 expression, which is a direct target gene of not just Notch but also the pTα34, was noticeably upregulated in CAR-TiPS relative to WT-TiPS and reduced in TRAC-1XX-TiPS (Fig. 3b), suggesting that constitutive CAR expression results in stronger GATA3 induction compared with the TCR or pTα.
Fig. 3. CAR regulation influences Notch and TCR target gene induction.
a, Schematic representation of Notch and (pre)TCR signalling interactions as reported in the literature. b, ddPCR analysis of Notch and (pre)TCR target genes at D24, 27, 31 and 35 of T cell differentiation (normalized to RPL13A) (n = 3 technical replicates). c, t-distributed Stochastic Neighbour embedding (tSNE) analysis of cell surface expression of CD4, CD8α, CD8β and pTα on D35 TRAC-1XX-TiPS iT cells. Colour scale represent level of marker expression. d, Distribution of pTα expression on D35 TRAC-1XX-TiPS (n = 3 biological replicates). All data are means ± s.d.
Notably, one of the key Notch targets, PTCRA, which encodes the pTα, is repressed in CAR-TiPS, but induced in differentiating WT-TiPS as well as in TRAC-1XX-TiPS (Fig. 3b). In thymic development, pTα pairs with the rearranged β-chain to allow for α chain rearrangement and progression to the DP stage19. To assess whether PTCRA induction in TRAC-1XX-TiPS was associated with pTα protein expression, we measured cell surface-protein levels by flow cytometry and found cell surface pTα expression in the induced-CD4 SP and DP populations (Fig. 3c, d), consistent with its physiological pattern35.
CAR engagement facilitates maturation to CD8αβ single-positive iT cells.
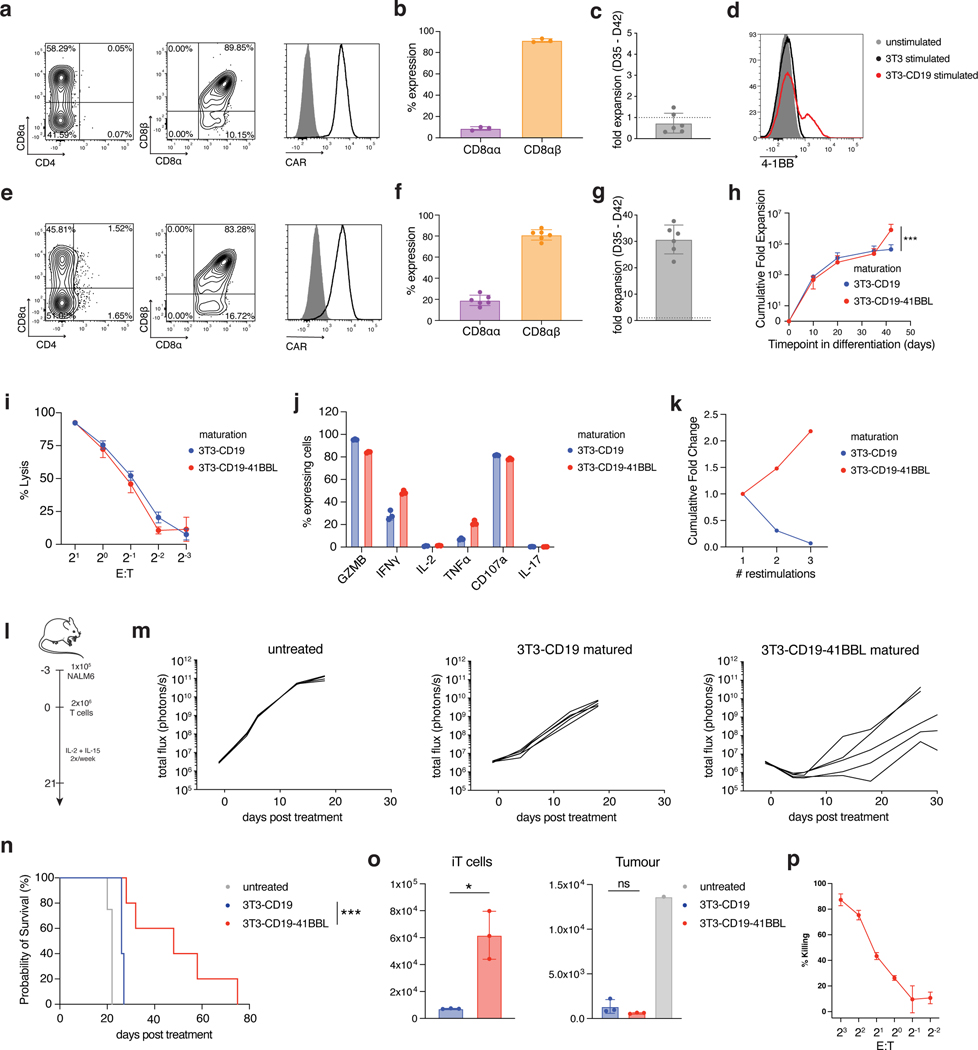
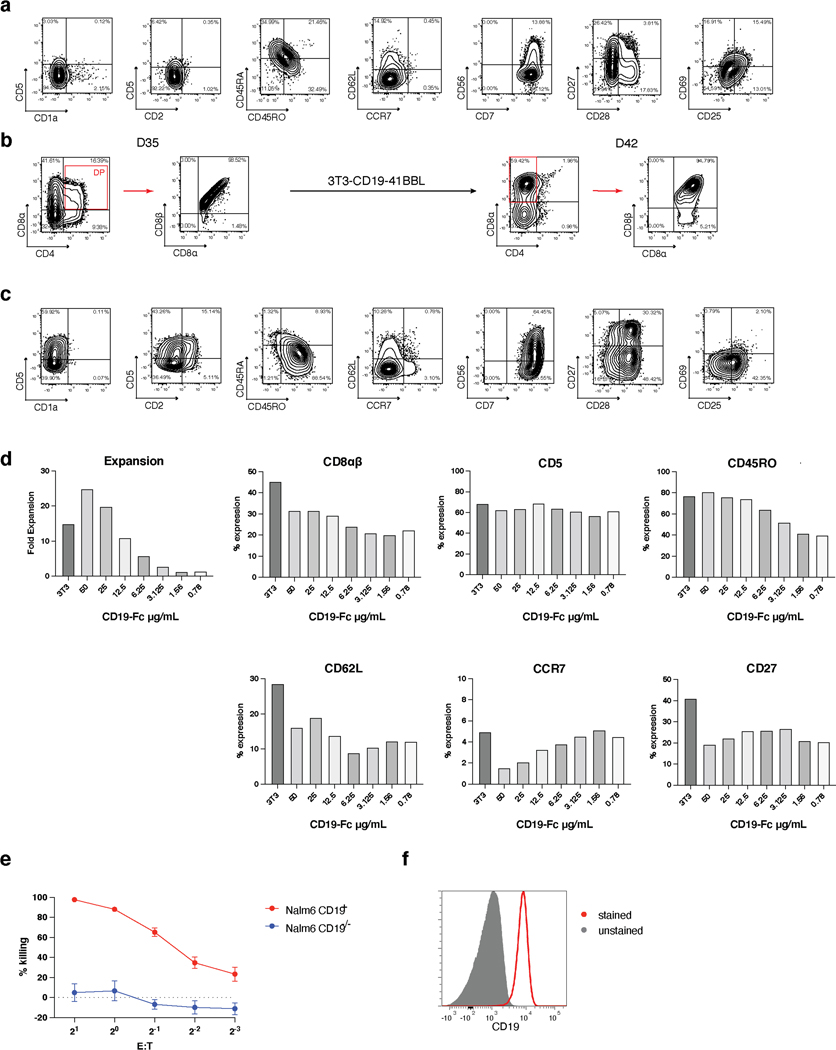
Having established that CAR regulation allows for DP cell development in the absence of a TCR, we set out to determine whether the CAR could substitute for the TCR in further driving maturation of DP cells into CD8αβ SP iT cells. In the absence of a TCR-dependent positive selection process, we stimulated D35 DP iT cells on cells expressing the CAR target antigen (NIH/3T3 fibroblasts expressing CD19)36. CAR engagement was required for iT cell survival as co-culture with parental fibroblasts lacking CD19 did not yield viable iT cells. Phenotypic analysis on CD19 stimulated TRAC-1XX-iT cells after a week (day 42) showed that CD4 and CD1a expression had waned and that a population of CD8αβ SP iT cells was induced, consistent with maturation from the DP to the SP stage (Fig. 4a and Extended Data Fig. 7a). Some DN cells and a small population of CD8αα iT cells still coexisted (Fig. 4b). The matured SP D42 TRAC-1XX-iT cells displayed a phenotype resembling activated T cells, including the upregulation of CD25, CD69, CD56 and transition from CD45RO to CD45RA (Extended Data Fig. 7a). However, the cells also downregulated CD5 and expanded poorly (Fig. 4c and Extended Data Fig. 7a).
Fig. 4. 4–1BBL co-stimulation enhances CD8αβ TRAC-1XX-iT proliferation and function.
a, Representative phenotype of TRAC-1XX-iT cells matured on 3T3-CD19 for 7 days (D35-D42), gated on live CD45+CD7+ (left and right) and CD45+CD7+CD8α+ (middle). b, Distribution of CD8αα and CD8αβ phenotype in the CD8α+ compartment (n = 3 biological replicates). c, Expansion of TRAC-1XX-iT cells from D35-D42 after maturation on 3T3-CD19 (n = 6 biological replicates). d, 4–1BB cell-surface expression on TRAC-1XX-iT cells on D35 8 h after exposure to parental 3T3 (black), 3T3-CD19 (red) or left unstimulated (grey). e, Representative phenotype of TRAC-1XX-iT cells matured on 3T3-CD19–41BBL, gated on live CD45+CD7+ (left and right) and CD45+CD7+CD8α+ (middle). f, Distribution of CD8αα and CD8αβ phenotype in the CD8α+ compartment (n = 6 biological replicates). g, Expansion of TRAC-1XX-iT cells from D35-D42 after maturation on 3T3-CD19–41BBL (n = 6 biological replicates). h, Total cell expansion from D0-D42 in iT differentiation with maturation on 3T3-CD19±41BBL (n = 6 biological replicates for each group, p=0.0008). i, Cytotoxic activity measured in an 18 h bioluminescence assay, using firefly luciferase (FFLuc)-expressing NALM6 at the indicated effector-to-target (E:T) ratios (n = 3; technical replicates). j, 4 h intracellular cytokine detection of 3T3-CD19±41BBL-matured cells in response to NALM6 (n = 3 technical replicates). k, Representative expansion of D42 cells matured on 3T3-CD19±41BBL upon repeated weekly antigen exposure on 3T3-CD19. l, Schematic representation of NALM6 in vivo tumour model. m, Tumour burden (total flux in photons per second) of NALM6-bearing mice treated with 2×10⁶ D42 TRAC-1XX-iT cells (n = 4–5, line = one mouse). n, Kaplan-Meier analysis of overall survival (p<0.0001). o, Flow cytometric quantification of iT cells (left panel, p=0.0339) and tumour cells (right panel) in bone marrow 6 days after T cell infusion (n = 3). p, Cytotoxic activity measured in a 6 h flow cytometry assay, using primary CD19+ CLL cells at the indicated E:Ts with 3T3-CD19–41BBL-matured TRAC-1XX-iT cells (n = 3 technical replicates) * P<0.05, *** P<0.001, Welch’s 2-sample two-sided t test (h, o), log-rank Mantel-Cox test (n). All data are means ± s.d.
Analysing the phenotype and induction of activation and co-stimulatory markers upon antigen exposure, we found that 4–1BB was induced transiently 8 h after antigen exposure (Fig. 4d) and hypothesized that engaging the 4–1BB pathway at this stage may promote iT cell expansion. We thus engineered the 3T3-CD19 cells to co-express 4–1BB ligand (3T3-CD19–41BBL). When D35 TRAC-1XX-iT cells were stimulated on 3T3-CD19–41BBL, they maintained the ability to form SP iT cells (Fig. 4e, f) and expanded 30-fold (Fig. 4g). To confirm that the resulting SP iT cells at D42 were indeed derived from D35 DP precursors, we sorted the DP cells at D35 and then exposed them to 3T3-CD19–41BBL. After 7 d, the DP cells had lost CD4 expression and matured to CD8αβ SP iT cells (Extended Data Fig. 7b). Phenotypically, 3T3-CD19–41BBL-matured cells retained CD5 and CD2 expression, more so than 3T3-CD19-matured cells, and showed higher expression of CD45RO, CD28 and CD56 (Extended Data Fig. 7c).
To determine whether CD19 levels may influence acquisition of an effector-like phenotype of the TRAC-1XX-iT cells, we matured iT cells on titrated levels of recombinant CD19 (Extended Data Fig. 7d). Increasing CD19 positively affected the expansion and CD8αβ SP iT-cell content but did not reduce the effector-like phenotype.
To determine whether exposure to 4–1BB co-stimulation qualitatively affected TRAC-1XX-iT maturation, we compared the function of the 3T3-CD19 and 3T3-CD19–41BBL-matured TRAC-1XX-iT cells. In vitro cytolytic function (Fig. 4i) and cytokine production (Fig. 4j) were similar between the two groups. However, whereas 3T3-CD19 matured cells failed to expand upon repeated exposure to antigen, 3T3-CD19–41BBL maturation improved their expansion and survival (Fig. 4k). We proceeded to compare these two populations in the NALM6 leukaemia model37 (Fig. 4l), wherein iT cells matured on 3T3-CD19–41BBL showed improved tumour control and survival (Fig. 4m,n), which was associated with an increased persistence of TRAC-1XX-iT cells (Fig. 4o). The cytolytic function of 3T3-CD19–41BBL-matured TRAC-1XX-iT cells was also demonstrated in vitro to be antigen specific (Extended Data Fig. 7e), and responsive not only to NALM6, but also to primary patient-derived CD19+ chronic lymphocytic leukaemia (CLL) cells (Fig. 4p and Extended Data Fig. 7f).
TRAC-1XX-iT cells overall resemble peripheral-blood derived CD8αβ T cells.
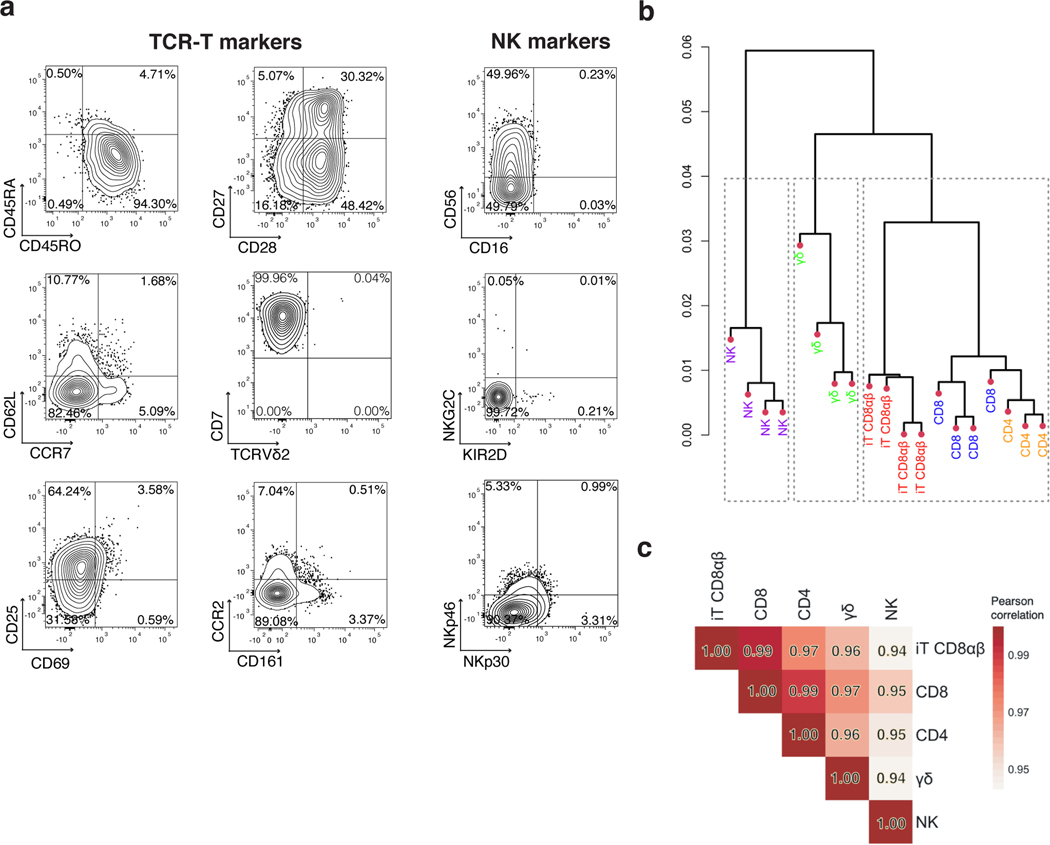
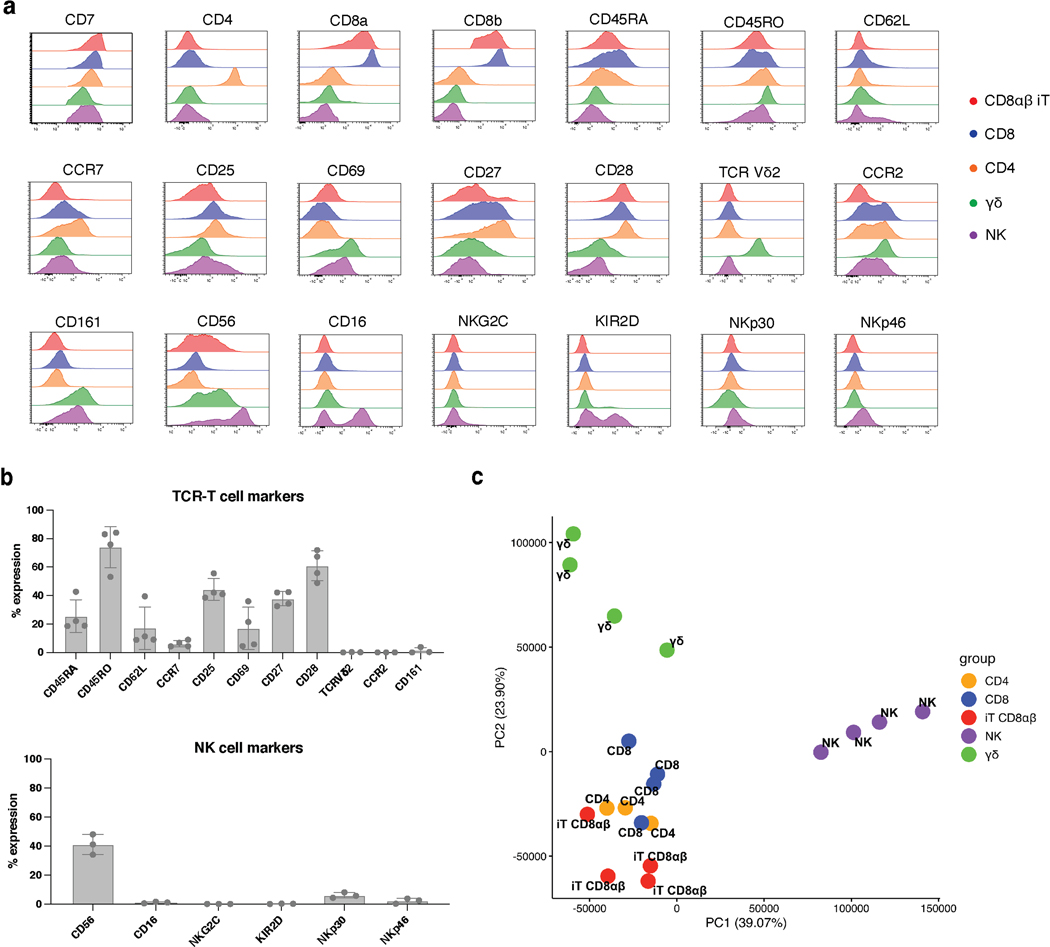
Having established that T-cell commitment, differentiation, maturation, and expansion of CD8αβ CAR T cells can be driven by CAR expression in the absence of a TCR, we sought out to compare the resulting CD8αβ TRAC-1XX-iT cells (CD8αβ iT) to naturally occurring peripheral blood lymphocytes. Analysis of cell-surface markers associated with αβTCR-T cells, NK cells or γδTCR-T cells, showed that CD8αβ iT cells express classical T-cell markers including CD45RO, CD25, CD27, CD28 and low levels of CD62L and CCR7 (Fig. 5a and Extended Data Fig. 8a, b). The stimulated cells expressed the T-cell activation/NK-cell marker CD56 but lacked canonical NK markers such as CD16 and KIR2D (Fig. 5a and Extended Data Fig. 8a, b). They also did not express γδTCR-T-cell-associated markers including the γδTCR (Vδ2) and CD161 (Fig. 5a and Extended Data Fig. 8a, b). To assess the nature of the cells more closely, we compared the transcriptomic profile of the CD8αβ iT cells to that of healthy donor PBMC-derived lymphocytes. To enhance comparability, CD4 αβTCR-T (CD4), CD8 αβTCR-T (CD8), γδTCR-T (γδT) and NK cells were engineered to express the 1928z-1XX CAR (either through TRAC-targeted integration in CD4 and CD8 or retroviral expression in γδT and NK cells) and purified for the CAR+ populations. Unsupervised hierarchical clustering analysis based on a dissimilarity matrix showed that, on the basis of overall gene expression, the CD8αβ iT cells are most closely related to the CD4 and CD8 T cells (Fig. 5b). Principal component (PC) analysis confirmed that within the first two PCs, CD8αβ iT cells cluster more closely with peripheral blood αβTCR-T cells than with γδTCR-T cells (Extended Data Fig. 8c). Pearson’s correlation distinguished that CD8αβ iT cells are more closely related to the peripheral blood CD8 T cells (r = 0.99, Fig. 5c).
Fig. 5. CD8αβ TRAC-1XX-iT cells resemble peripheral-blood derived CD8αβ T cells.
a, Phenotype analysis of 3T3-CD19–41BBL-matured D42 CD8αβ TRAC-1XX-iT cells for TCR-T cell markers (left and middle panel) and NK-cell markers (right panel). Data is representative of four independent experiments, gated on live CD45+CD7+CD8αβ+ cells. b, Dendrogram of hierarchical clustering analysis based on Euclidian distance matrix comparing the transcriptome of TRAC-1XX CD8αβ αβTCR-T cells (CD8, blue, n = 4 biological replicates), TRAC-1XX CD4 αβTCR-T cells (CD4, orange, n = 3 biological replicates), γRV-1XX γδTCR-T cells (γδ, green, n = 4 biological replicates), γRV-1XX NK cells (NK, purple, n = 4 biological replicates) and CD8αβ+ TRAC-1XX-iT cells (iT CD8αβ, red, n = 4 biological replicates). c, Correlation matrix using Pearson’s statistics comparing same groups as in (b).
TRAC-1XX-iT cells achieve tumour control in a systemic in vivo leukaemia model.
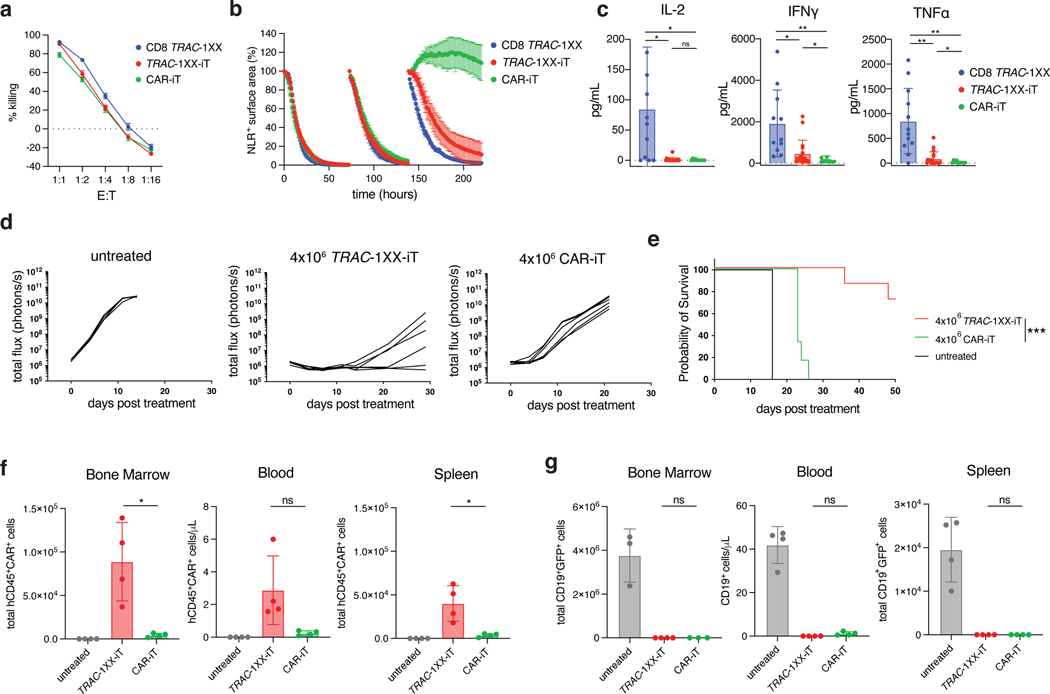
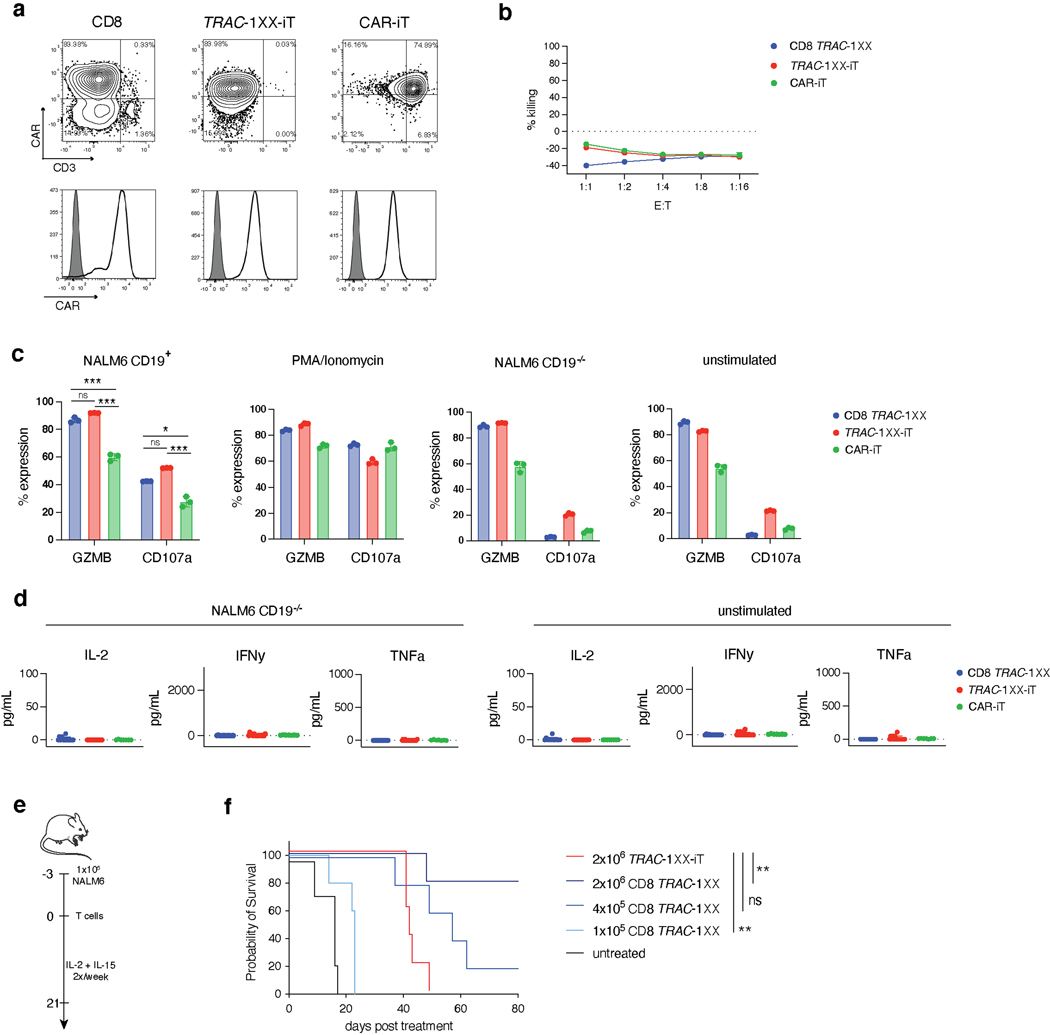
To determine whether the αβTCR-T lineage commitment of TRAC-1XX-iT cells enhanced their functional capabilities, we compared their in vitro and in vivo functions to CAR-iT cells and healthy-donor PBMC-derived CD8+ TRAC-1XX αβTCR-T cells (CD8 TRAC-1XX) (Extended Data Fig. 9a). In vitro cytolytic activity was antigen-specific and similar among the three cell populations in an 18 h cytotoxicity assay (Fig. 6a and Extended Data Fig. 9b). However, Granzyme B and CD107a production was reduced in CAR-iT cells (Extended Data Fig. 9c). Importantly, TRAC-1XX-iT and CD8 TRAC-1XX cells were able to control repeated in vitro exposure to tumour cells, whereas CAR-iT cells failed after a third challenge (Fig. 6b). In vitro cytokine secretion was reduced in both iT populations compared with CD8 TRAC-1XX T cells. TRAC-1XX-iT cells were able to produce IFNγ and TNFα, whereas minimal secretion was detected in CAR-iT cells. Notably, both TRAC-1XX-iT and CAR-iT cells lacked the ability to produce IL-2 in response to antigen (Fig. 6c and Extended Data Fig. 9d). To determine whether the differences in in vitro function between the TRAC-1XX-iT and CAR-iT cells translated into differences in in vivo tumour control, we compared them in the systemic NALM6 leukaemia model. We found that TRAC-1XX-iT cells showed improved tumour control (Fig. 6d, e), associated with increased iT cell persistence in the bone marrow, spleen and blood (Fig. 6f, g).
Fig. 6. TRAC-1XX-iT have improved persistence and function over CAR-iT cells.
Functional comparison of healthy-donor peripheral blood TRAC-1XX CD8αβ αβTCR-T cells (CD8 TRAC-1XX), CAR-iT, and TRAC-1XX-iT cells (matured on 3T3-CD19–41BBL). CD8 TRAC-1XX doses reflect number of CAR+ T cells utilized in the assay. a, Cytotoxic activity using a 18 h Incucyte assay, using NLR-expressing NALM6 as target cells (n = 3 technical replicates). b, NALM6 rechallenge assay. NLR+ NALM6 and T cells were co-cultured at a 1:1 E:T. Every 72 h T cells were rechallenged with 1x NLR+NALM6 and cytokines. NALM6 clearance was measured in NLR+ surface area reduction compared to the timepoint of rechallenge (n = 3 technical replicates). c, Twenty-four h cytokine secretion using NALM6 as target cells at a 1:1 E:T ratio (CD8 TRAC-1XX n = 15, TRAC-1XX-iT n = 18, CAR-iT n = 11 biological replicates, IL-2 CD8 TRAC-1XX vs CAR-iT p=0.02, IL-2 CD8 TRAC-1XX vs TRAC-1XX-iT p=0.0222, IFNγ CD8 TRAC-1XX vs CAR-iT p=0.004, IFNγ CD8 TRAC-1XX vs TRAC-1XX-iT p=0.0293, IFNγ TRAC-1XX-iT vs CAR-iT p=0.0363, TNFα CD8 TRAC-1XX vs CAR-iT p=0.001, TNFα CD8 TRAC-1XX vs TRAC-1XX-iT p=0.0027, TNFα TRAC-1XX-iT vs CAR-iT p=0.0262). d, Tumour burden (total flux in photons per second) of NALM6-bearing, untreated mice (n = 4) or mice treated with 4×10⁶ TRAC-1XX-iT (middle) or CAR-iT (right) cells (n = 6, line = one mouse). e, Kaplan-Meier analysis of overall survival (p=0.002). f,g, Enumeration of iT cells (f) and tumour cells (g) in the bone marrow, spleen and blood 12 days post T cell infusion (n = 4 mice, iT in bone marrow TRAC-1XX-iT vs CAR-iT p=0.0329, iT in spleen TRAC-1XX-iT vs CAR-iT p=0.0369). * P<0.05, ** P<0.01, *** P<0.001, Welch’s 2-sample two-sided t test (c, f, g), log-rank Mantel-Cox test (e). All data are means ± s.d.
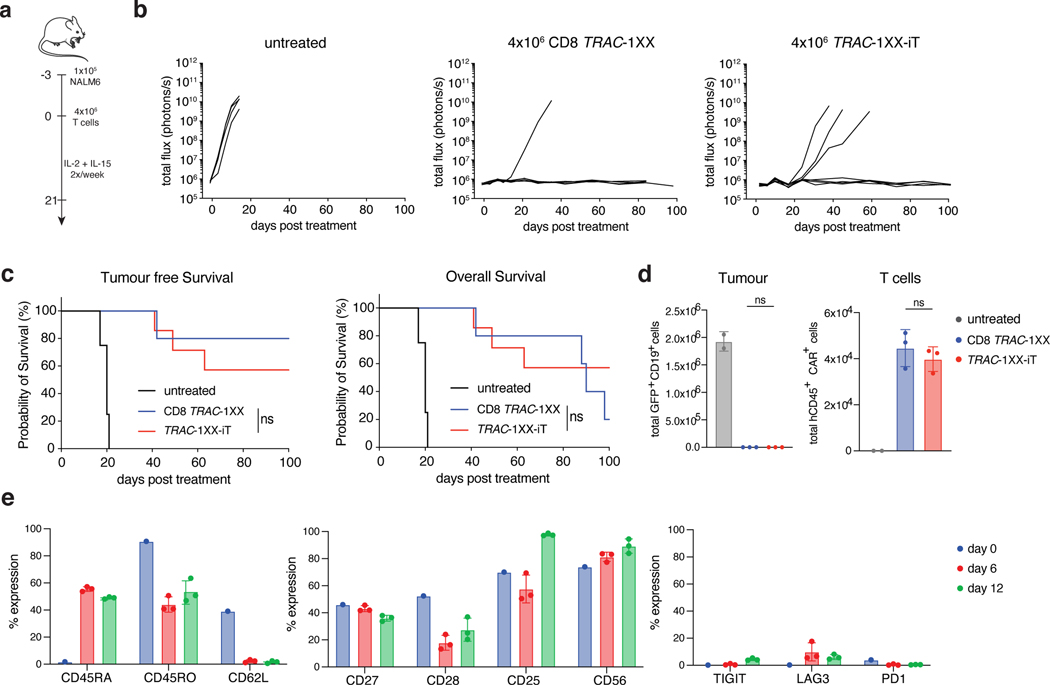
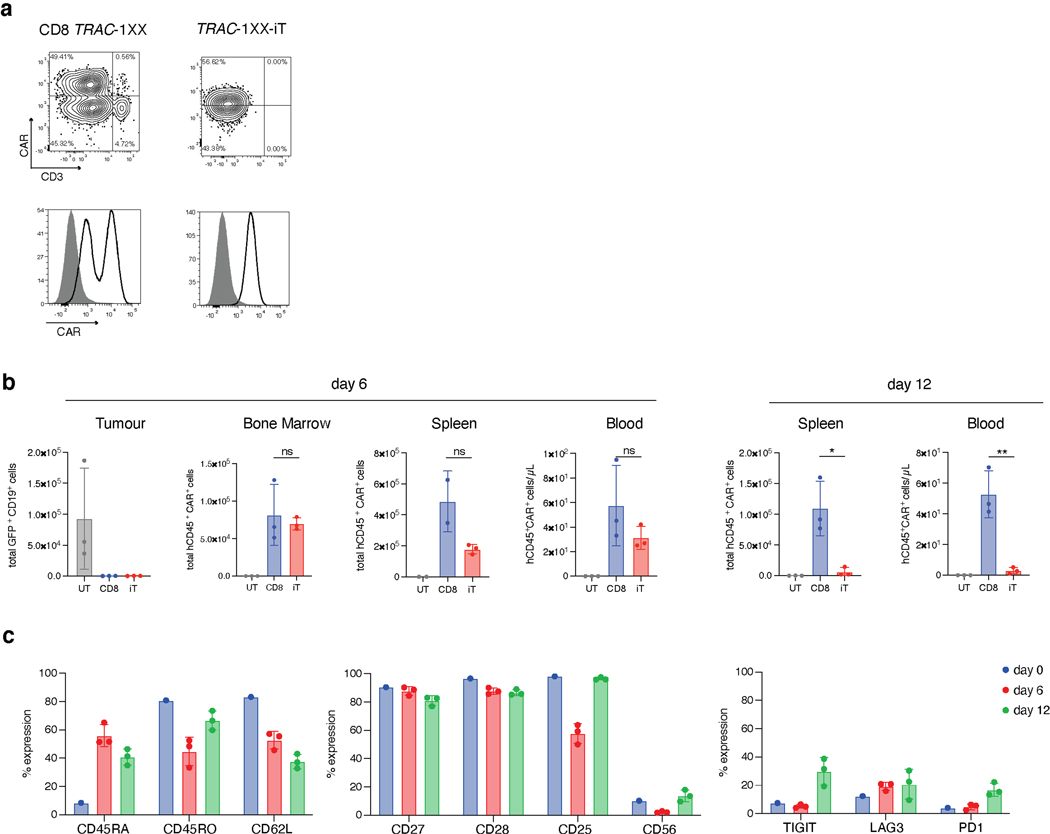
To provide a potency benchmark under these conditions, we administered diminishing doses of CD8 TRAC-1XX T cells and found that a single infusion of 2×10⁶ TRAC-1XX-iT cells provided a survival response that was not significantly different from 4×10⁵ healthy donor-derived CD8 TRAC-1XX T cells (Extended Data Fig. 9e, f). 4×10⁶ cells TRAC-1XX-iT cells induced complete and durable responses (Fig. 7a–c). Notably, mice infused with 4×10⁶ CD8 TRAC-1XX T cells eventually succumbed while presenting GvHD-like symptoms including weight loss, diarrhoea, and loss of fur, probably caused by the remaining small population of TCR+ cells11, none of which occurred in TRAC-1XX-iT cell recipient mice (Fig. 7c). Enumeration of tumour cells in bone marrow, spleen, and blood at 6 and 12 d after infusion, showed complete absence of detectable tumour in the bone marrow for both treatment groups at either timepoint (Fig. 7d and Extended Data Fig. 10a, b). TRAC-1XX-iT cells showed similar persistence to CD8 TRAC-1XX T cells in bone marrow, spleen and blood by day 6 and in bone marrow on day 12 but were less abundant in spleen and blood by day 12 (Fig. 7d and Extended Data Fig. 10b). Phenotypically, both populations increased CD45RA expression in vivo, and diminished CD62L expression (Fig. 7e and Extended Data Fig. 10c). TRAC-1XX-iT cells downregulated CD27 and CD28 but did not display increased exhaustion markers compared with peripheral blood CD8 TRAC-1XX T cells.
Fig. 7. TRAC-1XX-iT cells cure systemic NALM6 tumour model without inducing graft-versus-host disease.
a, Schematic representation of systemic NALM6 tumour model. b, Tumour burden (total flux in photons per second) of NALM6-bearing untreated mice (n = 4), or mice treated with 4×10⁶ CD8 TRAC-1XX (n = 5) or TRAC-1XX-iT cells (n = 7, line = one mouse). c, Kaplan-Meier analysis of tumour-free survival (left) and overall survival (right). d, Flow cytometric quantification of tumour cells (left) and T cells (right) in bone marrow 12 days after T cell infusion (n = 2–3 mice). e, Phenotype of persisting TRAC-1XX-iT cells prior to infusion (day 0, n = 1) and of cells derived from the bone marrow on day 6 and 12 days after TRAC-1XX-iT cell infusion (n = 3 mice). * P<0.05, ** P<0.01, *** P<0.001, log-rank Mantel-Cox test (c), Welch’s 2-sample two-sided t test (d). All data are means ± s.d.
Discussion
We have described the generation of therapeutic CD8αβ CAR iT cells from TiPS. We investigated how premature TCR or CAR expression interferes with adaptive T-cell maturation, and show that delayed expression and calibrated CAR signalling enable DP T-cell development and terminal CD8αβ iT cell expansion in the absence of a TCR.
In vitro T cell development from TiPS that constitutively express a CAR yields T cells with an innate-like CD8αα T cell phenotype12, 15 or NK-like features16, 26. We show that premature CAR expression at the DN stage interferes with Notch signalling, skewing differentiation away from DP differentiation and towards the acquisition of an innate-like phenotype. The Notch ligand DLL1 was sufficient to induce DP cell formation during T lineage development from precursor cells that bear TCR VDJ genes in germline configuration, but not from WT-TiPS, which encode a rearranged αβTCR and required DLL4 to progress to the DP stage (Fig. 1d). In the presence of constitutive CAR expression however, DLL4 was no longer sufficient to evoke DP differentiation (Fig. 1f). Constitutive CAR expression diminished NOTCH1 expression and deregulated downstream gene expression, including DTX1, TCF7 and PTCRA (Fig. 3b). Consistent with in vitro models of lymphopoiesis, stronger TCR signals or interference with Notch signalling impairs the DN to DP transition in αβTCR T cells38, 39 and defaults the cells towards an innate/γδTCR-like fate.
The combination of regulating CAR expression under the control of the TRAC locus28 and inactivating the CAR’s second and third ITAM (ref. 27) brought down the potential for constitutive signalling (Extended Data Fig. 6) and rescued the induction of genes downstream of Notch and DP development (Figs. 2d and 3b). The partially restored induction of PTCRA in differentiating TRAC-1XX-TiPS is noteworthy (Fig. 3b–d), given the crucial role the preTCR-complex plays in the development of αβTCR-T cells (but not γδTCR-T cells19). PreTCR expression is required for β chain selection19, 40, 41 and its absence diverts T cell differentiation towards a γδTCR-T cell phenotype42. PTCRA expression is absent in the presence of a constitutively expressed CAR (Fig. 3b), consistent with Notch downregulation43. Facilitating DP development through attenuation of CAR signalling is also consistent with the finding that attenuated γδTCR signalling can allow for DP maturation in the absence of an αβTCR44.
TRAC-1XX-TiPS cannot assemble a functional αβTCR and therefore depend on the CAR to direct T cell maturation past the DP stage. Exposure to the CAR antigen resulted in the maturation of CD8αβ SP by day D42, but failed to support their expansion (Fig. 4a, c). Provision of 4–1BB co-stimulation together with antigen enabled the emerging SP TRAC-1XX-iT cells to expand. Upregulation of 4–1BB has been observed in murine DP cells undergoing positive selection in vivo45. The benefit of providing co-stimulation is consistent with TCR/major histocompatibility complex interaction alone not sufficing to induce complete CD8 T cell maturation46, 47. The emerging SP TRAC-1XX-iT cells exposed to 4–1BBL not only expanded but also acquired robust effector functions (Fig. 4i–m) and the ability to expand upon repeated antigen stimulation (Fig. 4k). However, these iT cells do not have a classical naïve phenotype, as they maintain CD5 and CD7 expression but do not homogeneously express CD45RA, CD62L and CCR7, as would be expected in naïve T cells and recent thymic emigrants48. They rather express CD45RO, CD28, CD25 and CD56, which are hallmarks of recently activated T cells (Extended Data Fig. 7c). This effector-like phenotype is commonly observed following extrathymic differentiation of T cells, irrespective of CAR expression or maturation protocol49, 50. While the TRAC-1XX-iT described here do not display a canonical naïve phenotype, it is noteworthy that they also do not express common exhaustion markers. Transcriptional studies confirmed that CAR-induced maturation produces CD8αβ TRAC-1XX-iT cells that are more similar to peripheral blood-derived CD8αβ αβTCR-T cells, than to CD4 αβTCR-T cells and yet are more distinct from γδTCR-T cells and NK cells (Fig. 5b, c).
When comparing TRAC-1XX-iT function to CAR-iT and peripheral blood-derived CD8 TRAC-1XX, we found that TRAC-1XX-iT had improved cytolytic capacity and cytokine secretion compared with CAR-iT (Fig. 6b,c), as well as improved anti-tumour activity in vivo (Fig. 6d,e). TRAC-1XX-iT cells still produced significantly lower levels of cytokines than CD8 TRAC-1XX cells, notably lacking IL-2 production, which was therefore provided exogenously (Fig. 6c). TRAC-1XX-iT cells nonetheless provide substantial anti-tumour activity in a systemic NALM6 model, which CAR-iT cannot achieve (Fig. 6d,e), while requiring a higher dosage than CD8 TRAC-1XX T cells (Extended Data Fig. 9e,f). Phenotypically, both TRAC-1XX-iT and CD8 TRAC-1XX cells differentiated towards an effector phenotype upon encounter with the tumour in the bone marrow. TRAC-1XX-iT cells downregulated CD62L, CD27 and CD28, but did not show accelerated acquisition of exhaustion markers (Fig. 7e and Extended Data Fig. 10c). TRAC-1XX-iT cells showed reduced persistence in spleen and blood over time (Extended Data Fig. 10b). Despite these differences, TRAC-1XX-iT cells were able to induce long-term remission and survival following intravenous infusion of a single dose of 4×10⁶ iT cells (Fig. 7a–c). Tumour control by CAR-iT cells has only been hitherto achieved in intraperitoneal models12, 15, 16.
TiPS are a highly attractive resource for allogeneic, ‘off-the-shelf’ immunotherapy8. The self-renewing capacity of TiPS allows for the establishment of gene edited, clonally selected master cell banks51, 52 which can be utilized to mass produce genetically homogeneous T cell populations, eliminating donor-dependent T cell variability and thereby standardizing treatment. Combined with genome editing, the use of TiPS allows for careful selection of a desired genotype, screening for insertional mutagenesis53, off-target editing and translocations54, 55, and facilitates the complete elimination of TCR expression to prevent GvHD11 or the accidental transduction of malignant cells in apheresis products56. Genotype selection, including detection of off-target editing events, makes TiPS particularly attractive for multiplexed gene editing strategies, such as combining TRAC locus editing with the ablation of CD52, CD70, or PD1 (refs. 54,55,57). The use of TiPS-derived T cells is not limited to targeting CD19 as described here and is applicable to other target tumour associated antigens, as well as applications beyond cancer immunotherapy58. Nonetheless, CARs that produce stronger signalling or engage antigens expressed during T cell development, may require the same careful analysis as described here to avert interference with DP development.
In the present protocol, 1 million TRAC-1XX-iT cells are generated from a single TiPS in 42 days (Fig. 4h). Its engineering flexibility and expansion potential provide a process that can be easily scaled to generate clinically relevant iT cell numbers. This may allow for off-the-shelf CAR T cell therapy utilizing uniform and consistent iT cells produced from the same engineered master cell bank. The development of feeder-free systems that support the delicate signalling balance required for DP development and αβTCR-T cell lineage commitment and expansion is needed to facilitate large-scale manufacturing. A major advantage of the TiPS approach is to enable safe multiplexed T cell engineering to overcome histocompatibility and tumour microenvironmental barriers8, 9. In summary, we have shown that synthetic receptors like CARs can substitute for the TCR in driving directed T cell differentiation and show that the induction of TCR−/−, αβTCR-T cell-like CD8αβ CAR iT cells is feasible and holds great potential for the large scale production of potent T-cell-based immunotherapies.
Methods
Cell Lines
OP9-mDLL1.
OP9-mDLL1 cells were obtained from Isabelle Rivière and cultured as previously described12.
OP9-DLL1, -DLL4, -JAG1, -JAG2.
Parental OP9 cells were obtained from ATCC. Plasmids encoding the Moloney murine leukaemia virus-based SFGγ retroviral vector59 were used to clone bi-cistronic constructs to express one of the human Notch ligands (DLL1, DLL4, JAG1 or JAG2) and green fluorescent protein (GFP). Plasmids containing sequences of hDLL1, hDLL4, hJAG1 and hJAG2 were obtained from GenScript (NM_005618, NM_019074, NM_000214 and NM_002226 respectively) and were cloned using standard molecular biology techniques by replacing the FFLuc element in the SFG-FFLuc-P2A-GFP retroviral vector with the desired Notch ligand. Vesicular stomatitis virus glycoprotein G (VSV-G) pseudotyped retroviral supernatants derived from transduced gpg29 fibroblasts (H29) was used to transduce OP9. Transduced cells were purified by flow cytometry based on Notch ligand and GFP expression. Antibodies used to detect Notch ligand expression were hDLL1 – PE (MHD1–314; BioLegend), hDLL4 – PE (MHD4–46; BioLegend), hJagged-1 – PE (MHJ1–152; BD) and hJagged-2 – PE (MHJ2–523; BioLegend) respectively. Purified OP9 cells were cultured in MEMα (Gibco) media with 20% Fetal Bovine Serum (FBS, Hyclone), 1X MEM Non-Essential Amino Acids (NEAA, Corning), 2mM GlutaMAX (Gibco), 100U/mL Penicillin (Pen) and 100μg/mL Streptomycin (Strep, Corning), 55μM 2-Mercaptoethanol (2-ME, Gibco) and 50mg/mL ascorbic acid (Sigma) as previously described12.
NALM6.
NALM6 cells were obtained from ATCC. NALM6 CD19−/− were generated as previously described60. NALM6 were transduced to express GFP and firefly Luciferase (FFLuc) for in vitro and in vivo detection37. Cells were cultured in RPMI 1640 (Corning) with 10% FBS (Hyclone) 1x NEAA, 2mM GlutaMAX, 100U/mL Pen, 100μg/mL Strep, 2mM HEPES (Corning) and 55μM 2-ME). For Incucyte-based analysis, NALM6 CD19+ and NALM6 CD19−/− were transduced with Incucyte NucLight Red lentiviral reagent (NLR, Essen BioScience) and selected with puromycin according to manufacturer’s instructions.
3T3-CD19.
NIH 3T3 cells expressing CD19 were used as artificial antigen presenting cells as previously described37. 3T3-CD19–4-1BBL were generated utilizing a previously described SFGγ retroviral vector encoding the 4–1BBL transgene59. VSV-G pseudotyped retroviral supernatant derived from transduced H29 was used to transduce 3T3-CD19. Transduced cells were purified by flow cytometry based on 4–1BBL (4–1BBL – PE, 5F4; BioLegend) expression. Cells were cultured in DMEM media (Corning) with 10% Cosmic Calf Serum (Hyclone).
K562-mbIL-21–4-1BBL.
K562 cells were transduced to express membrane-bound IL-21 and 4–1BBL as previously described61. Cells were cultured in RPMI 1640 (Corning) with 10% FBS (Hyclone), 2mM GlutaMAX, 100U/mL Pen 100μg/mL Strep, 55μM 2-ME.
H1.
The human embryonic stem cell line was obtained from the Studer Lab and cultured on MEF in hES media (DMEM-F12 (Corning) with 20% knock-out serum replacement (KSR), 1X NEAA, 2mM GlutaMAX, 100U/mL Pen 100μg/mL Strep, 55μM 2-ME) supplemented with 8ng/mL human basic fibroblast growth factor (hbFGF) (R&D systems).
Primary CLL cells:
Apheresis product before CAR T cell infusion were obtained from patients that were consented and enrolled in phase I 1928z CAR T cell clinical trials approved by the MSKCC Institutional Review Board (IRB).
Generation of iPS
FiPS
Fibroblast-derived iPS (FiPS) were generated as previously described51, transfected with a transient plasmid-based reprogramming system to initiate cellular reprogramming. In brief, cells were transfected with reprogramming vector backbone (pCEP4, Life Technologies) containing OCT4, NANOG, and SOX2 under regulation of the EF1α promoter. Transfected cells were plated on Matrigel and selected with hygromycin until FiPS colonies were established.
WT-TiPS.
WT-TiPS were generated as previously described (Clone T-iPSC-1.10)12. In brief, healthy-donor peripheral blood mononuclear cells (PBMCs) were activated with phytohaemagglutinin (PHA, 2μg/mL) and transduced with two tri-cistronic SFGγ retroviral vectors, each vector encoding reprogramming factors and a different fluorescent marker (f-Citrine-P2A-cMYC-E2A-SOX2 and f-vexGFP-P2A-OCT4-T2A-KLF4). Transduced cells were seeded on MEF feeder cells and TiPS colonies were established.
CAR-TiPS.
CAR-TIPS were generated as previously described (1928z-T-iPSC)12. In brief, clone T-iPSC-1.10 was stably transduced with a bi-cistronic lentiviral vector (mCherry-P2A-1928z) and purified for mCherry expression by flow cytometry.
TRAC−/−-TiPS.
TRAC−/−-TiPS were generated through CRISPR /Cas9-targeted integration of a EF1a-GFP-P2A-Puromycin-bGHpA(G2AP) expression unit into the TRAC locus leading to knockout of the TCRa gene into the WT-TiPS (Clone T-iPSC-1.10). WT-TiPS were electroporated using Lonza Cell Line Nucleofector Kit V solution and Lonza Nucleofector-II. Five million cells were resuspended in 100uL nucleofection solution, with 2.6 μg pBS-TRAC gRNA1, 2.6 μg pBS-TRAC-HR-G2AP and 2.6 μg hCas9 plasmid, and electroporated using program B-025. Transfected cells were plated on Matrigel-coated plates using TiPS complete medium containing 10μM ROCK inhibitor. After 48 h cells were selected with 0.8 μg/ml Puromycin and sorted by flow cytometry for GFP expression. pBS-TRAC gRNA1 was generated by cloning the TRAC gRNA target sequence (5’-CAGGGTTCTGGATATCTGT) into pBS-gRNA MCS plasmid, which contains the human U6 promoter and the gRNA fold described in Mali et al., Science 2013. pBS-TRAC-HR-G2AP was generated by cloning the left (~0.9 kb) and right (1 kb) TRAC homology arms (HAs) into pBluescript II SK (+), followed by the insertion of the EF1a-GFP-P2A-Puromycin-bGHpA expression unit in between of the HAs. hCas9 plasmid62 was obtained from Addgene (41815).
TRAC-1928z-TiPS.
TRAC-1928z T cells were generated as previously described28, 57. In brief, αβTCR-T cells were purified from PBMCs with the Pan T cell Isolation kit (Miltenyi Biotec) on the AutoMACS Pro according to manufacturer instructions. Purified cells were activated with CD3/CD28 Dynabeads (1:1 beads:cell) in X-Vivo 15 media (Lonza) supplemented with 5% Human Serum (HS) (Gemini Bioproducts) with 5ng/mL rhIL-7 (R&D Systems) and 5ng/mL rhIL-15 (R&D Systems). 48 h after αβTCR-T cell activation, CD3/CD28 beads were magnetically removed, and T cells were transfected by electrotransfer of TRAC ribonucleoprotein using the Nucleofector II device (Lonza). Then 2×10⁶ T cells were resuspended in P3 buffer (Lonza) and mixed with 60pmol TRAC ribonucleoprotein in a total volume of 20μL. Following electroporation and considering 66.7% viability, cells were diluted into culture medium and 1×10⁶/mL and incubated at 37°C, 5% CO2. Recombinant AAV6 donor vector pAAV-TRAC-1928z28 was added to the culture 30min after electroporation at a multiplicity of infection of 3×10⁵ genome copies. Twenty-four h after targeting, T cells were reprogrammed as described above (WT-TiPS) and TRAC-1928z-TiPS colonies were established and cloned on MEF feeder cells. PCRs were performed to determine biallelic, specific target transgene integration into the TRAC locus.
TRAC-1XX-TiPS.
αβTCR-T cells were isolated, activated and transfected as described above (TRAC-1928z-TiPS). Following electroporation cells were transduced with the previously described recombinant AAV6 donor vector pAAV-TRAC-1XX containing the 1928z-1XX CAR construct. The 1928z-1XX CAR contains tyrosine-to-phenylalanine point mutations within ITAM2 and 3 of the CD3ζ domain rendering only ITAM1 functional27 TRAC-1XX-T cells were reprogrammed as described above for the FiPS. Emerging iPSCs colonies were expanded and cloned by limiting dilution. PCRs were performed to determine biallelic, specific target transgene integration into the TRAC locus.
iPS culture.
iPS lines were maintained on MEF prior to EB-based differentiation, in serum-free hES medium supplemented with 8ng/mL hbFGF. Prior to monolayer-based iCD34 differentiation, iPS lines were cultured on Matrigel in hES media containing 0.4μM PD032590, 1uM CHIR99021, 5μM Thiazovivin, 2μM SB431542 (all Biovision), 10μM ROCK-inhibitor (Ascent) and 10ng/mL hbFGF (R&D Systems) as previously described63.
Fresh media was provided every day and cells were passaged every 3–4 days as previously described12, 51. iPS lines were tested for mycoplasma contamination every 2 months.
iPSC surface marker expression
iPS lines were assessed for cell surface pluripotency marker expression including SSEA4 – FITC (MC813–70; BD), TRA-1–81 – af647 (TRA-1–81; BD) and CD30 – PE (BerH8; BD).
Verification of transgene integration into the TRAC locus
Genomic DNA was isolated using QuickExtract™ DNA Extraction Solution (Lucigen) following manufacturer’s protocols. PCRs were performed using KAPA 2X HiFi Hot Start Ready Mix following manufacturer’s recommended conditions. PCR products were analysed using ethidium bromide-stained agarose gel electrophoresis and imaged using the Bio-Rad ChemiDoc.
TRAC−/−-TiPS:
Successful disruption of the TRAC locus through insertion of the G2AP expression unit was verified through PCR of the region spanning between the left- and right homology arms. Primers: 5’-GATGATACGCGTCTCTTCTCCTTTCTCATTGAGC and 5’-TCGAGTAAACGGTAGTGCTG. Non-targeted allelles produce a 1603bp PCR product, targeted alleles a 4434bp product.
TRAC-1928z-TiPS and TRAC-1XX-TiPS successful integration of the 1928z and 1928z-1XX CAR construct respectively were assessed as previously described27, 28.
T cell differentiation from iPS and expansion of iT cells.
For the differentiation of iPS to haematopoietic precursors, we used optimized serum- and feeder-free in vitro differentiation protocols based on Embryoid Body (EB) formation12 or monolayer-based (iCD34)51.
Haematopoietic precursor differentiation.
EB-based precursor differentiation was performed as previously described12. Undifferentiated TRAC−/−-TiPS or WT-TiPS colonies were transferred to ultra-low attachment plates to allow for EB formation in serum-free differentiation medium (StemPro-34 (Invitrogen), with 2mM GlutaMAX, 1X NEAA, 100U/mL Pen, 100μg/mL Strep, 55μM 2-ME, and 50mg/mL ascorbic acid). Mesoderm induction was facilitated through EB culture with 30ng/mL human bone morphogenetic protein 4 (hBMP-4) and 5ng/mL hbFGF until day 4. Next, haematopoietic specification and expansion was achieved in the presence of 20ng/mL human vascular endothelial growth factor (hVEGF) and a cocktail of haematopoietic cytokines (100ng/mL rhSCF, 20ng/mL rhFlt3L, 20ng/mL rhIL-3 and 5ng/mL hbFGF). Cells were transferred to fresh media with cytokines every 48 h. All cytokines were obtained from R&D systems. Day 10 EBs containing haematopoietic progenitor cells were dissociated with Accutase (StemCell Technologies) prior to culture on OP9 for T lymphoid commitment and expansion.
Monolayer-based iCD34 differentiation was performed as previously described61. H1, FiPS or TiPS were differentiated to mesoderm and subsequently to CD34+ haematopoietic progenitors on matrigel in StemPro34 differentiation media supplemented with a combination of 5ng/mL hBMP-4, 10ng/mL hbFGF, 10ng/mL rhVEGF, 50ng/mL hSCF, 10ng/mL hIL-6, 10ng/mL hIL-11for 10 days. Media supplemented with fresh cytokines was added every 48 h. All cytokines were obtained from R&D systems. On day 10, CD34+ cells were enriched through positive selection with CD34 microbeads (Miltenyi Biotec) on the AutoMACS Pro according to manufacturer instructions, prior to T lymphoid differentiation on OP9.
T lymphoid commitment and expansion.
Day 10 single cells were seeded on OP9 monolayers in OP9 medium (MEMα with 20% FBS), supplemented with 10ng/mL rhTPO, 5ng/mL rhIL-3, 30ng/mL rhSCF, 10ng/mL rhIL-7 and 10ng/mL rhFlt3L to initiate lymphoid lineage commitment until day 20, and with 30ng/mL rhSCF, 10ng/mL rhIL-7 and 10ng/mL rhFlt3L to complete T lineage commitment until day 35. Differentiating T lymphoid cells were passaged onto fresh OP9 monolayers every four days, fresh media with cytokines was supplemented 48 h after each passage. For the stimulation and expansion of TRAC-1XX-iT and CAR-iT cells, differentiated cells were harvested from OP9 monolayers on day 35 and seeded on a monolayer of irradiated 3T3-CD19±4–1BBL at a 3:1 E:T ratio in T cell expansion media (CTS Optimizer Media (Gibco) with 1x CTS T cell maturation/expansion supplement and 1x CTS Immune cell serum replacement, 5ng/mL rhIL-7 and 25ng/mL rhIL-21). Cells were fed with fresh expansion media every 48 h. For maturation of TRAC-1XX-iT cells on CD19 recombinant protein, flat-bottom tissue culture plates were coated with recombinant human CD19-Fc chimeric protein (R&D Systems), in 100mM sodium-bicarbonate coating buffer, overnight at 4°C. Plate were blocked with PBS + 5% FBS for 30min at room temperature and washed twice with PBS. iT cells were resuspended at 0.25×10⁶ cells/mL in T cell expansion media with 5ng/mL rhIL-7, 25ng/mL rhIL-21 and 3μg/mL Urelumab (Creative Biolabs). Cells were passaged after 48 h and fresh media supplemented with cytokines was added every 2 days.
PBMC derived cell isolation, activation, culture, and transduction.
Buffy coats from healthy volunteer donors were obtained from the New York Blood Center. PBMCs were isolated by density gradient centrifugation.
αβTCR-T cells.
αβTCR-T cells were purified and engineered as described above (TRAC-1928z-TiPS). After AAV6 transduction with pAAV-TRAC-1XX, cells were cultured in media supplemented with 5ng/mL IL-7 and 5ng/mL IL-15 for 3–5 days. After expansion, CD4 and CD8 cells were purified using EasySep™ CD4+ or CD8+ negative selection T cell isolation kit (Stem Cell Technologies) and purified for CAR expression by flow cytometry.
γδTCR-T cells.
PBMCs were resuspended in lymphocyte media (RPMI 1640 media with 10% FBS) supplemented with 1μg/mL Zoledronic Acid (Stem Cell Technologies) 10ng/mL rhIL-15 (R&D systems) and 100U/mL IL-2 (Proleukin). After 72 h cells were fed with additional media and cytokines, after 6 days γδTCR-T cells were purified with the Miltenyi Biotec TCRγ/δ+ T cell isolation kit. Purified γδTCR-T cells were transduced with SFGγ−1928z-1XX-P2A-LNGFR to induce CAR expression. Cells were expanded for 5–7 days in media supplemented with cytokines and purified for expression of the transduction reporter low-affinity nerve growth factor reporter (LNGFR) using magnetic isolation with LNGFR – PE (C401457; BD) and anti-PE microbeads (Miltenyi Biotec).
NK cells.
NK cells were purified from PBMCs with the NK Cell Isolation Kit (Miltenyi Biotec). NK cells were resuspended in lymphocyte medium and activated with K562-mbIL21–41BBL at a 1:1 E:T, supplemented with 1000U/mL IL-2. 48 h after activation NK cells were transduced with SFGγ−1928z-1XX-P2A-LNGFR to induce CAR expression. Cells were expanded for five days in media supplemented with cytokines and purified for LNGFR expression using magnetic isolation with LNGFR – PE (C401457; BD) and anti-PE microbeads (Miltenyi Biotec) on the AutoMACS Pro.
Retroviral vector constructs, retroviral production, and transduction.
Plasmids encoding the SFGγ-retroviral vector59 were prepared as previously described36, 64. VSV-G pseudotyped retroviral supernatants derived from transduced H29 were used to construct stable retroviral-producing cells lines as previously described65. T and NK cells were transduced by centrifugation on Retronectin (Takara)-coated plates.
iT transduction.
Day 35 WT-TiPS iT cells were harvested and transduced by centrifugation on Retronectin-coated plates in the presence of 100U/mL IL-2. Cells were fed every 48 h with fresh lymphocyte media and cytokines.
Flow cytometry
Cell surface proteins.
The following conjugated antibodies were used to monitor T lymphocyte lineage development during differentiation. CD45 – BV605 (HI30; BioLegend), CD3 – BUV737 (UCHT1; BD), TCRαβ – PE-Cy7 (IP16; Invitrogen), CD4 – BV785 (SK3; BioLegend), CD8α – BUV395 (HIT8a; BD), CD8β – PE (SIDI8BEE; Invitrogen), CD8αβ – APC (2ST8.5H7; BD), CD7 – APC-H7 (M-T701; BD), CD5 – PerCP-Cy5.5 (UCHT2; BioLegend), CD56 – BV421 (HCD56; BioLegend), CD1a – PE-Cy7 (HI149; BioLegend), CD2 – BV711 (RPA-2.10; BD). The TCR-T and NK cell phenotypes were determined with CD45RA – BV605 (HI100; BioLegend), CD45RO – BV421 (UCHL1; BioLegend), CD62L – BV711 (DREG-56; BioLegend), CCR7 – PE-Cy7 (G043H7; BioLegend), CD25 – BB515 (2A3; BD), CD69 – PerCP-Cy5.5 (FN50; BioLegend), CD27 – BUV737 (M-T271; BD), CD28 – PE-Cy7 (CD28.2; BioLegend), CD16 – BUV737 (3G8; BD), NKG2C – PE (S19005E; BioLegend), KIR2D – FITC (NKVFS1; Miltenyi Biotec), NKp46 – FITC (9E2; BioLegend), NKp30 – PerCP-Cy5.5 (P30–15; BioLegend), TCRVδ2 – PerCP-Cy5.5 (B6; Biolegend) and CD161 – BV421 (HP-3G10; BioLegend), CCR2 – PE (K036C2; BioLegend) in addition to the aforementioned T lymphocyte lineage commitment markers. 4–1BB induction was measured with 4–1BB – BV605 (4B4–1; BioLegend). CAR expression was measured with biotin-conjugated goat anti-mouse F(ab’)2 antibody (GaM-biotin; Jackson ImmunoResearch), followed by a blocking incubation with 2% mouse serum (MP Biomedicals) and streptavidin-PE (BioLegend) or streptavidin-APC (BioLegend).
pTα stain.
Cells were incubated with anti-pTα antibody (2F1; BD), biotin-labelled anti-mouse IgG1 (RMG1–1; BioLegend) and Streptavidin-PE (BD). Staining for additional cell surface proteins was performed after completion of pTα staining.
Intracellular phospho-protein analyses.
SFGγ−1928z, TRAC-1928z and TRAC-1XX T cells were fixed with Phosflow Fix Buffer I (BD) and stained for the CAR with GaM-af647 (Jackson ImmunoResearch), followed by 2% mouse serum, and subsequently permeabilized with Phosflow Perm Buffer III (BD) following the manufacturer’s procedure. Permeabilized samples were stained with antibodies detecting phosphorylated CD3ζ ITAM1 – af488 (EP776(2)Y; Abcam) or phosphorylated CD3ζ ITAM3 – PE (K25–407.69; BD).
All antibodies were titrated prior to use. Flow cytometric data were acquired on Fortessa X-20 (BD) or 5-laser Aurora (Cytek Biosciences) Flow cytometer voltages were calibrated with Ultra Rainbow Calibration Kit (SpheroTech, URCP-38–2K) prior to every acquisition. Analysis was performed using FCS Express 7 (De Novo Software). Negative and positive gates were set based on (un)stained PBMC and TiPS controls (Supplementary Fig. 1).
Apoptosis Analysis.
WT-TiPS and CAR-TiPS cells were harvested daily between D27 and D35 of the differentiation and stained for viability and Annexin-V – APC (Invitrogen) according to manufacturer’s instructions, followed by cell surface staining for CD45, CD7, CD4, CD8α and CD8β as described above. Percentage of apoptotic cells within populations (CD45+CD7+, DN, DP, CD4, CD8αα or CD8αβ) was calculated based on live Annexin-V+ stain.
Notch induction in differentiating TiPS cells.
WT-TiPS D20 lymphoid progenitor cells were co-cultured with parental OP9, OP9-hDLL1, OP9-hDLL4, OP9-hJAG1 or OP9-hJAG2. At 0, 4, 8, 12, 24, 48 and 72 h of co-culture, cells were harvested, cell pellets were snap-frozen and stored at −80°C for until RNA extraction. Gene induction was measured by ddPCR as described below. Relative level of DTX1 induction was normalized to 0h.
Notch/TCR target gene induction during iT differentiation.
TiPS (WT-TiPS, CAR-TiPS and TRAC-1XX-TiPS) were differentiated as described. During the T lymphoid commitment phase of the differentiation (D24, D27, D31 and D35) suspension cells were harvested, cell pellets were snap-frozen and stored at −80°C until RNA extraction. Gene induction was measured by ddPCR as described below.
dd PCR.
ddPCR gene expression assays for Notch1 (dHsaCPE5050282), Notch 3 (dHsaCPE5046836), TCF7 (dHsaCPE5031804), DTX1 (dHsaCPE5192773), GATA3 (dHsaCPE5034292), ID3 (dHsaCPE5027720), PTCRA (dHsaCPE5031466) and RPL13A (dHsaCPE5037592) were obtained from Bio-Rad. ddPCR reactions were set up according to One-Step RT-ddPCR Advanced Kit for Probes protocol on a QX200 ddPCR system (Bio-Rad). Each sample was evaluated in technical triplicates. Reactions were partitioned into a median of ~15,000 droplets per well using the QX200 droplet generator. Emulsified reactions were amplified on a 96-well thermal cycler. Plates were read and analysed with the QuantaSoft software to assess the number of droplets positive for the target gene. The number of messenger RNA (mRNA) molecules per droplet relative to RPL13A was calcultated assuming a Poisson distribution, as prescribed by Bio-Rad.
RNA extraction, library generation and sequencing.
Total RNA was isolated from 0.3 ×10⁶ – 0.5×10⁶ cells using the RNeasy 96 Kit (Qiagen, 74181) according to the manufacturer’s protocol. RNA quality was measured by High Sensitivity RNA ScreenTape (Agilent) on the Agilent 42000 TapeStation System. RNA quantity was measured using the Thermo Scientific™ Qubit™ Flex Fluorometer (Invitrogen). 200ng of total RNA was used per sample to generate mRNA library using NEBNext®Ultra™ II Directional RNA Library Kit for Illumina® (New England BioLabs) per sample. Final libraries were quantified using the Qubit™ 1X dsDNA high sensitivity Assay kit on the Qubit™ Flex Fluorometer. Library quality and size were measured using Agilent High Sensitivity D1000 ScreenTape. Libraries were calculated to nM, diluted to 4nM, and pooled evenly for high throughput sequencing. Sequencing was performed on Illumina NextSeq 500 Instrument (Illumina) with 2×76 pair-end reads targeting a minimum of 16 million pair-end reads per sample.
RNA sequencing analysis.
Sequencing data were trimmed using Trim Galore! 0.6.0 to remove Illumina adapters. Resulting reads were mapped to the human reference genome (assembly GRCh38.86) using Salmon v0.13.1 in quasi-mapping-based mode, with GC bias correction, selective alignment, and range factorization. The data was analysed using the statistical software R. The aggregated read counts were normalized for sequencing depth and RNA composition with DESeq2. Pseudogenes identified by the GENCODE project and lowly expressed genes were filtered out prior to downstream analysis. Principal Component Analysis (PCA) was performed with normalized read counts in R. Hierarchical Clustering Analysis was carried out with the unweighted pair group method with arithmetic mean (UPGMA) method on Euclidean distance matrix. Correlation matrix was generated using Pearson’s statistics.
Cytotoxicity Assays.
The in vitro toxicity of TRAC-1XX T cells was determined by a standard firefly luciferase (FFLuc)-based assay60 or by NLR+ imaging on the Incucyte Live Cell Analysis System (Sartorius). For FFLuc based cytotoxicity, FFLuc-expressing NALM6 served as target cells. The effector (E) and tumour target (T) cells were co-cultured in triplicates at the indicated E:T ratio using black-walled 96-well plates with 1×10⁵ target cells in a total volume of 100μL per well in T cell expansion medium. Four hours later, 50μL luciferase substrate (Bright-Glo, Promega) was directly added to each well. Emitted light (RLU) was detected in a luminescence plate reader (Agilent BioTek S1L), and lysis was calculated using the formula 100 x (1-(RLUsample)/(RLUtarget alone)). For the Incucyte cytotoxicity assay, flat-bottom 96-well plates were pre-coated with 5μg/mL Fibronectin (Sigma) at 4°C overnight. The E:T ratios were plated in with 3×10⁴ target cells in a total volume of 200μL per well in T cell expansion medium, in technical triplicates. Hourly brightfield and fluorescence imaging was performed for a 72 h period. Cell survival was quantified based on NLR+ surface area by Incucyte S3 software (Essen BioScience) and normalized to the NLR+ surface area at 0 h. For the flow-cytometry based cytotoxic T lymphocyte (CTL) assay, CD19+ cells were purified from apharesis product (EasySep CD19 Positive selection kit, StemCell Technologies) and cultured overnight in RPMI media with 10% human serum, 1x NEAA, 2mM GlutaMAX, 100U/mL Pen, 100μg/mL Strep. TRAC-1XX-iT cells were counted and plated in triplicate at the indicated E:T ratios with 1×10⁵ CD19+ CLL target cells in a total volume of 100μL per well in T cell expansion media. Six hours later, cells were stained with CD19 – PE-Cy7 (SJ25C1, BioLegend), CD45 – BV605 (HI30, BioLegend), CD7 – APC-H7 and Sytox Blue Dead Cell Stain (Invitrogen) and the number of remaining, target cells (live, CD7−CD19+ cells) were enumerated by flow using AccuCount beads (Spherotech). Percentage lysis was calculated using the formula (sample count x 100)/(target alone count).
Antigen restimulation assay.
Restimulation assays were performed as previously described37. In brief, 1×10⁶ T cells were co-cultured with 3×10⁵ 3T3-CD19 in 1mL T cell expansion media. Fresh media was supplied every 48 h. Cells were counted after seven days and restimulated on fresh 3T3-CD19 monolayers.
In vitro NALM6 rechallenge assay.
3×10⁴ iT cells were co-cultured with 3×10⁴ NLR+ NALM6 CD19+ tumour cells in 200μL T cell expansion media. Hourly brightfield and fluorescence imaging was performed for a 10 day period. At day 3 and day 6, plates were removed from the Incucyte, and 50μL media was replaced with 50μL media supplemented with 3×10⁴ fresh NLR+ NALM6 cells and 4x cytokines. Cell survival was quantified based on NLR+ surface area by Incucyte S3 software (Essen BioScience) and normalized to the NLR+ surface area at 0, 72 and 144 h respectively.
Cytokine analyses.
To measure intracellular levels, iT cells were cultured for 4 h at 1×10⁶ cells/mL together with NALM6 at a 1:1 ratio in the presence of Brefeldin A (BD) monensin (BioLegend) and CD107a – BV421 (H4A3; BD). Cells were stained with ef506 Fixable Viability dye (ThermoFisher) prior to fixation and permeabilization using BD Cytofix/Cytoperm Plus kit as per manufacturer’s instructions, followed by staining with anti-cytokine and cell-surface antibodies GranzymeB – APC (GB12; Invitrogen), IFNγ – PE-Cy7 (4S.B3; Invitrogen), IL-2 – BUV737 (MQ1–17H12; BD), TNFα – PE (Mab11; Invitrogen), IL-17 – af488 (BL168, BioLegend), CD45 – BV605 (HI30; BioLegend). Percentage of cytokine producing cells was determined by flow cytometry.
To measure secreted cytokine levels, 0.5×10⁶ T cells were cultured together with NALM6 at a 1:1 ratio or without target cells for 24 h. Supernatants were collected and stored at −80°C. Secreted cytokines were quantified using BD Cytometric Bead Array kits (IL-2 – 558270, IFNγ – 560111, TNFα – 560112) and flow cytometry.
ERK1/2 phosphorylation analysis.
Phosphorylated-ERK1/2 was quantified in day 35 WT-TiPS and CAR-TiPS. Cells were lysed in 1x denaturation buffer supplemented with 10μg/mL aprotonin, leupeptin and pepstatin at 1mg/mL total protein content. Phosphorylated ERK1/2 was quantified using the BD Cell Signaling Master Buffer Kit (560005) and Phospho ERK1/2 (560012) according to manufacturer’s instructions.
Mouse systemic tumour model.
6–8 week-old NOD/SCID/IL-2Rγ-null (NSG) mice were obtained from Jackson Laboratory. A dose of 0.1×10⁶ FFLuc-NALM6 was administered by tail vein injection and three days later the indicated dose of T cells were administered by tail vein injection per mouse. Mice received IL-2 (Proleukin 100KU/mouse) and rhIL-15 (150ng/mouse) in 200μL PBS intraperitoneally twice per week for three weeks post T cell injection. Tumour burden was measured by bioluminescence imaging using the Xenogen IVIS Imaging System (Xenogen). Living Image software (Xenogen) was used to analyse the acquired bioluminescence data. No blinding method was used. All animal experiments were conducted in accordance with protocols approved by MSKCC Institutional Animal Care and Use Committee (IACUC) and following National Institutes of Health (NIH) guidelines for animal welfare.
Cell enumeration.
Three mice per group were euthanised at day 6 or day 12 post T cell injection and cells were isolated from the blood, bone marrow and spleen as described37. Cells were stained for viability (ef506), CD45, CAR, CD4, CD8α, CD8β, CD45RA, CD45RO, CD27, CD28, CD25, CD62L, CD56, CD19 (all as described above), mCD45 – BV421 (30-F11; BioLegend), TIGIT – BV605 (A15153G; BioLegend), LAG3 – PE-Cy7 (11C3c65; BioLegend), PD1 – BV711 (EH12.2H7; BioLegend) and GFP (tumour cells) and analysed by flow cytometry in the presence of counting beads (Countbright, Invitrogen).
Statistics.
All experimental data are presented as mean ± S.D. No statistical methods were used to predetermine sample size. Appropriate statistical tests were used to analyse data, as described in the figure legends. Statistical analysis was performed on GraphPad Prism 7 software and R. Significance was set at p < 0.05.
Extended Data
Extended Data Fig. 1. T lymphoid commitment of hES, FiPS and TiPS on OP9-mDLL1.
a, Flow cytometric analysis of pluripotency marker expression on H1, FiPS and WT-TiPS b, Flow cytometric analysis of T lymphoid markers of H1, FiPS and WT-TiPS during differentiation on OP9-mDLL1 at indicated timepoints. Plots depicting CD7/CD5 are gated on live CD45+ cells, plots depicting CD3/TCRαβ, CD4/CD8α and CD8α/CD8β are gated on live CD45+CD7+ cells. CD3/TCRαβ and CD4/CD8α at D40 are as presented in Fig. 1b.
Extended Data Fig. 2. Generation, validation, and differentiation of TRAC−/−-TiPS.
a, CRISPR/Cas9-targeted integration of EF1a-GFP-P2A-Puromycing-bGHpA (G2AP) expression unit into the TRAC locus. Top, TRAC locus; middle, plasmid containing the G2AP expression unit flanked by homology arms; bottom, edited TRAC locus. ‘FWD’ and ‘REV’ indicate the location of the forward and reverse primers used in b. b, PCR validation of G2AP integration into the TRAC locus of TiPS clones. c, Flow cytometric analysis of pluripotency marker expression on TRAC−/−-TiPS. Gated on live cells. d, T lymphoid makers of WT-TiPS and TRAC−/−-TiPS during differentiation on OP9-mDLL1 at the indicated timepoints. Gated on live CD45+ cells. D40 is as presented in Fig. 1c.
Extended Data Fig. 3. Early T lymphoid commitment of WT-TiPS and CAR-TiPS on human Notch ligands.
a, SFG γRV plasmid design to transduce human Notch ligands (DLL1, DLL4, JAG1 or JAG2) into parental OP9 cells. b, Notch ligand expression on engineered OP9 lines. Filled grey histogram are stained parental OP9 cells, open black histogram are transduced OP9 cells. c, DTX1 induction in WT-TiPS by OP9 expressing indicated Notch ligand. D20 differentiating WT-TiPS cells were co-cultured with indicated OP9. DTX1 induction was measured by ddPCR, relative to endogenous RPL13A. The fold change was calculated relative to 0 h. Data shown is average of n = 2 technical replicates. d, g, Flow cytometric analysis of T lymphoid commitment marker expression (CD7, CD5, TCRαβ and CD56) of WT-TiPS (d) and CAR-TiPS (g) differentiated on OP9 expressing indicated human Notch ligands. Gated on live CD45+ cells. e, Flow cytometric analysis of pluripotency marker expression on CAR-TiPS. Gated on live cells. f, Phosphorylated-ERK1/2 levels in WT-TiPS (blue) and CAR-TiPS (red) on D35 (n = 3 technical replicates). h, Phenotype (left panels) and apoptosis levels (right panels) of WT-TiPS (top) and CAR-TiPS (bottom) from D27 – D35 of differentiation on OP9-DLL4. Percentage of apoptotic cells in each T lineage developmental stage was based on percentage live Annexin-V+ cells. * P<0.05, ** P<0.001, *** P<0.001, Welch’s 2-sample t test, data are means ± s.d (f).
Extended Data Fig. 4. CD8αβ single positive CAR+ iT cell development.
WT-TiPS were differentiated on OP9-DLL4 and transduced to express the 1928z CAR at D35 utilizing γRV SFG-1928z-P2A-LNGFR. Cells were expanded for 7 days in expansion media supplemented with IL-2. a, CD4/CD8αβ expression prior to transduction (D35) and on D42 in LNGFR+ cells, LNGFR− cells and untransduced control cells which remained in differentiation on OP9-DLL4. Gated on live CD45+ cells. b, Cytotoxic activity of CAR+ iT cells in a 18 h bioluminescence assay, using FFLuc- NALM6 as target cells (n = 3 technical replicates, data are mean ± s.d). c, CRISPR/Cas9-targeted integration of CAR transgene into the TRAC locus. Top, TRAC locus; middle, plasmid containing the CAR transgene cassette flanked by homology arms; bottom, edited TRAC locus. d, f, PCR validation of CAR integration into the TRAC locus of TRAC-1928z-TiPS (d) and TRAC-1XX-TiPS (f) clones. e, g, Pluripotency marker expression on TRAC-1928z-TiPS (e) and TRAC-1XX-TiPS (g), gated on live cells.
Extended Data Fig. 5. T lineage commitment of TRAC-CAR-TiPS.
a, T lineage commitment marker expression (CD7/CD5, CD4/CD8α, CD8α/CD8β) of WT-TiPS (left), TRAC-1928z-TiPS (middle) and TRAC-1XX-TiPS on OP9-DLL4 at the indicated timepoints. CD7/CD5 is gated on live CD45+ cells, others are gated on live CD45+CD7+ cells. b, Flow cytometric analysis of T cell phenotype markers of D35 DP TRAC-1XX-iT cells. Gated on live CD45+CD7+CD4+CD8αβ+ cells. c, Intracellular and cell-surface expression of CD3 and TCRαβ on D35 TRAC-1XX-iT cells.
Extended Data Fig. 6. Tonic ITAM phosphorylation in CAR+ T cells.
a, Representative flow cytometry plot of CAR expression and pITAM1 (top panel) or pITAM3 (bottom panel) in PBMC-derived T cells expressing γRV-1928z, TRAC-1928z or TRAC-1XX (gated on live CAR+), or in control TRAC−/− cells (gated on live CAR−). b, c, Percentage of pITAM1+ (b) and pITAM3+ (c) in the populations shown in a (n = 4–5 biological replicates, data are means ± s.d.).
Extended Data Fig. 7. DP TRAC-1XX-iT cell mature to CD8αβ SP iT cells on 3T3-CD19–41BBL.
a, c, Flow cytometric analysis of D42 cells matured on 3T3-CD19 (a) or 3T3-CD19–41BBL (c). Gated on live CD45+CD7+ cells. b, Flow cytometric analysis of D35 and D42 phenotypes of stimulated DP TRAC-1XX-iT cells. D35 TRAC-1XX-iT cells were sorted for a CD4+CD8αβ+ DP phenotype, stimulated on 3T3-CD19–41BBL and expanded for seven days. Gated on live CD45+CD7+ cells. d, Fold Expansion and T cell phenotype marker expression of TRAC-1XX-iT cells matured on 3T3-CD19–41BBL (3T3) or recombinant CD19-Fc. e, 4 h cytotoxicity assay of 3T3-CD19–41BBL stimulated TRAC-1XX-iT cells in response to NALM6-CD19+ an NALM6-CD19−/− target cells (n = 3 technical replicates, data are means ± s.d.) f CD19 expression on primary CLL cells.
Extended Data Fig. 8. Comparison of CD8αβ TRAC-1XX-iT cells and peripheral blood lymphocytes.
a, Representative examples of lymphoid phenotype marker expression in CD8αβ TRAC-1XX-iT (red), CD8αβ αβTCR-T (blue), CD4 αβTCR-T (orange), γδTCR-T (green) and NK cells (purple). CD8αβ TRAC-1XX-iT cells are the same as represented in Fig. 5a. b, Variability of lymphoid phenotype marker expression in CD8αβ TRAC-1XX-iT cells (n= 3–4 biological replicates, data are means ± s.d). Biological replicates shown are samples utilized in RNA analysis (Fig. 5b, c). c, Principal Component Analysis comparing TRAC-1XX CD8αβ αβTCR-T cells (CD8, n = 4), TRAC-1XX CD4 αβTCR-T cells (CD4, n = 3), γRV-1XX γδTCR-T cells (γδ, n = 4), γRV-1XX NK cells (NK, n = 4) and CD8αβ+ TRAC-1XX-iT cells (iT CD8αβ, n = 4).
Extended Data Fig. 9. Functional comparison of TRAC-1XX-iT, CAR-iT and CD8 TRAC-1XX.
Functional comparison of healthy-donor peripheral blood TRAC-1XX CD8αβ αβTCR-T (CD8 TRAC-1XX), CAR-iT and TRAC-1XX-iT cells. CD8 TRAC-1XX cell doses represent number of CAR+ cells utilized in the assay. a, CAR and CD3 expression in CD8 TRAC-1XX, CAR-iT and TRAC-1XX-iT cells (black line) compared to unstained control (grey filled histogram). b, 18 h incucyte cytotoxicity assay with NLR+ CD19−/− NALM6 target cells (n = 3 technical replicates). c, 4 h intracellular cytokine detection in T cells stimulated with NALM6 CD19+ target cells (at a 1:1 E:T), PMA/Ionomycin, NALM6 CD19−/− target cells (at a 1:1 E:T) unstimulated controls (n = 3 technical replicates). d, 24 h cytokine secretion using NALM6-CD19−/− as target cells at a 1:1 E:T (n = 11–18 biological replicates, left panel) or unstimulated control (n = 11–18 biological replicates, right panel). e, Schematic representation of the NALM6 in vivo tumour model. f, Kaplan-Meier analysis of tumour free survival (2×10⁶ TRAC-1XX-iT vs 2×10⁶ CD8 TRAC-1XX p=0.0062, 2×10⁶ TRAC-1XX-iT vs 1×10⁵ CD8 TRAC-1XX p=0.0034). * P<0.05, ** P<0.01, *** P<0.001, Chi-Square test (b) log-rank Mantel-Cox test (f). All data are means ± s.d.
Extended Data Fig. 10. TRAC-1XX-iT function compared to healthy donor peripheral blood-derived CD8 TRAC-1XX T cells.
In vivo functional comparison of healthy-donor peripheral blood TRAC-1XX CD8αβ αβTCR-T (CD8 TRAC-1XX), TRAC-1XX-iT cells. CD8 TRAC-1XX cell doses represent number of CAR+ cells utilized in the assay. a, CAR and CD3 expression in CD8 TRAC-1XX and TRAC-1XX-iT cells (black line) compared to unstained control (grey filled histogram). b, Enumeration of tumour cells in the bone marrow and T cells in bone marrow, spleen and blood 6 or 12 days post T cell infusion (n = 2–3 mice, T cell in bone marrow day 12, CD8 TRAC-1XX vs TRAC-1XX-iT p=0.0161, T cells in spleen day 12 CD8 TRAC-1XX vs TRAC-1XX-iT p=0.0052). c, Phenotype of CD8 cells prior to infusion (day 0, n = 1) and of cells derived from the bone marrow on day 6 (n = 3 mice) and 12 (n = 3 mice). d, Kaplan-Meier analysis of overall survival. * P<0.05, ** P<0.01, *** P<0.001 Welch’s 2-sample two-sided t test (b) All data are means ± s.d.
Supplementary Material
Acknowledgements.
We thank G. Gunset for logistical and technical assistance, Dr M. Sættersmoen for advice on NK cell culture, Dr A. Iyer for support with statistical analyses and E.Ortiz for support in cell culture. We thank the SKI Cell Therapy and Cell Engineering Facility, the Flow Cytometry core facility, Integrated Genomics Operation, Antitumor Assessment and Animal Core Facilities for their expert assistance. We also thank Drs Y.-S. Lai, C.-W. Chang, A. Witty, B.-H. Yang, M. Ribadi, J. Huffman, H. Shaked, R. Bjordahl and B. Whitlock (Fate Therapeutics Inc) for technical contributions. This work was supported by the Tri-I Stem Cell Initiative, the Tow Foundation, Cycle for Survival, the Marie-Josée and Henry R. Kravis Center for Molecular Oncology, Fate Therapeutics Inc., and NCI grant P30 CA08748. S.J.C.v.d.S. and M.T. were supported by a New York Stem Cell Foundation Druckenmiller Fellowship.
Footnotes
Competing interests.
R.A., T.L., R.C., B.V., are employees of Fate Therapeutics Inc. and have equity in the company. M.S. reports research funding from Takeda Pharmaceuticals, Atara Biotherapeutics and Fate Therapeutics. M.S. served on the scientific advisory board of St Jude Children’s Research Hospital.
Data Availability
The RNA sequencing data have been deposited in the Gene Expression Omnibus under the accession number GSE210364. Source data for tumour growth are provided with this paper. Other data generated for this manuscript are available from the corresponding author upon reasonable request.
References
- 1.June CH & Sadelain M. Chimeric Antigen Receptor Therapy. N. Engl. J. Med. 379, 64–73 (2018). [DOI] [PMC free article] [PubMed] [Google Scholar]
- 2.Sadelain M, Rivière I. & Riddell S. Therapeutic T cell engineering. Nature 545, 423–431 (2017). [DOI] [PMC free article] [PubMed] [Google Scholar]
- 3.Globerson Levin A, Rivière I, Eshhar Z. & Sadelain M. CAR T cells: Building on the CD19 paradigm. Eu.r J. Immunol 51, 2151–2163 (2021). [DOI] [PMC free article] [PubMed] [Google Scholar]
- 4.Maldini CR, Ellis GI & Riley JL CAR T cells for infection, autoimmunity and allotransplantation. Nat. Rev. Immunol 18, 605–616 (2018). [DOI] [PMC free article] [PubMed] [Google Scholar]
- 5.Chen Y, Sun J, Liu H, Yin G. & Xie Q. Immunotherapy Deriving from CAR-T Cell Treatment in Autoimmune Diseases. J. Immunol. Res 2019, 5727516 (2019). [DOI] [PMC free article] [PubMed] [Google Scholar]
- 6.Wang X. & Rivière I. Clinical manufacturing of CAR T cells: foundation of a promising therapy. Mol. Ther. Oncolytics 3, 16015 (2016). [DOI] [PMC free article] [PubMed] [Google Scholar]
- 7.Allen ES et al. Autologous lymphapheresis for the production of chimeric antigen receptor T cells. Transfusion 57, 1133–1141 (2017). [DOI] [PMC free article] [PubMed] [Google Scholar]
- 8.Themeli M, Rivière I. & Sadelain M. New cell sources for T cell engineering and adoptive immunotherapy. Cell Stem Cell 16, 357–366 (2015). [DOI] [PMC free article] [PubMed] [Google Scholar]
- 9.Depil S, Duchateau P, Grupp SA, Mufti G. & Poirot L. ‘Off-the-shelf’ allogeneic CAR T cells: development and challenges. Nat. Rev. Drug. Discov 19, 185–199 (2020). [DOI] [PubMed] [Google Scholar]
- 10.Benjamin R. et al. Genome-edited, donor-derived allogeneic anti-CD19 chimeric antigen receptor T cells in paediatric and adult B-cell acute lymphoblastic leukaemia: results of two phase 1 studies. Lancet 396, 1885–1894 (2020). [DOI] [PubMed] [Google Scholar]
- 11.Qasim W. et al. Molecular remission of infant B-ALL after infusion of universal TALEN gene-edited CAR T cells. Sci. Transl. Med 9 eaaj2013 (2017). [DOI] [PubMed] [Google Scholar]
- 12.Themeli M. et al. Generation of tumor-targeted human T lymphocytes from induced pluripotent stem cells for cancer therapy. Nat. Biotechnol 31, 928–933 (2013). [DOI] [PMC free article] [PubMed] [Google Scholar]
- 13.Wang B. et al. Generation of hypoimmunogenic T cells from genetically engineered allogeneic human induced pluripotent stem cells. Nat. Biomed. Eng 5, 429–440 (2021). [DOI] [PubMed] [Google Scholar]
- 14.Woan KV et al. Harnessing features of adaptive NK cells to generate iPSC-derived NK cells for enhanced immunotherapy. Cell Stem Cell 28, 2062–2075.e2065 (2021). [DOI] [PMC free article] [PubMed] [Google Scholar]
- 15.Harada S. et al. Dual-antigen targeted iPSC-derived chimeric antigen receptor-T cell therapy for refractory lymphoma. Mol. Ther 30, 534–549 (2022). [DOI] [PMC free article] [PubMed] [Google Scholar]
- 16.Ueda T. et al. Non-clinical efficacy, safety and stable clinical cell processing of induced pluripotent stem cell-derived anti-glypican-3 chimeric antigen receptor-expressing natural killer/innate lymphoid cells. Cancer Sci. 111, 1478–1490 (2020). [DOI] [PMC free article] [PubMed] [Google Scholar]
- 17.Yui MA & Rothenberg EV Developmental gene networks: a triathlon on the course to T cell identity. Nat. Rev. Immunol 14, 529–545 (2014). [DOI] [PMC free article] [PubMed] [Google Scholar]
- 18.Pardoll DM et al. Thymus-dependent and thymus-independent developmental pathways for peripheral T cell receptor-gamma delta-bearing lymphocytes. J. Immunol 140, 4091–4096 (1988). [PubMed] [Google Scholar]
- 19.Fehling HJ, Krotkova A, Saint-Ruf C. & von Boehmer H. Crucial role of the pre-T-cell receptor alpha gene in development of alpha beta but not gamma delta T cells. Nature 375, 795–798 (1995). [DOI] [PubMed] [Google Scholar]
- 20.Hogquist KA, Gavin MA & Bevan MJ Positive selection of CD8+ T cells induced by major histocompatibility complex binding peptides in fetal thymic organ culture. J. Exp. Med 177, 1469–1473 (1993). [DOI] [PMC free article] [PubMed] [Google Scholar]
- 21.Baldwin TA, Sandau MM, Jameson SC & Hogquist KA The timing of TCR alpha expression critically influences T cell development and selection. J. Exp. Med 202, 111–121 (2005). [DOI] [PMC free article] [PubMed] [Google Scholar]
- 22.Washburn T. et al. Notch activity influences the alphabeta versus gammadelta T cell lineage decision. Cell 88, 833–843 (1997). [DOI] [PubMed] [Google Scholar]
- 23.Mohtashami M. et al. Direct comparison of Dll1- and Dll4-mediated Notch activation levels shows differential lymphomyeloid lineage commitment outcomes. J. Immunol 185, 867–876 (2010). [DOI] [PubMed] [Google Scholar]
- 24.Van de Walle I. et al. Specific Notch receptor-ligand interactions control human TCR-αβ/γδ development by inducing differential Notch signal strength. J. Exp. Med 210, 683–697 (2013). [DOI] [PMC free article] [PubMed] [Google Scholar]
- 25.Ramello MC et al. An immunoproteomic approach to characterize the CAR interactome and signalosome. Sci. Signal 12 eaap9777 (2019). [DOI] [PMC free article] [PubMed] [Google Scholar]
- 26.Maluski M. et al. Chimeric antigen receptor-induced BCL11B suppression propagates NK-like cell development. J. Clin. Invest 129, 5108–5122 (2019). [DOI] [PMC free article] [PubMed] [Google Scholar]
- 27.Feucht J. et al. Calibration of CAR activation potential directs alternative T cell fates and therapeutic potency. Nat. Med 25, 82–88 (2019). [DOI] [PMC free article] [PubMed] [Google Scholar]
- 28.Eyquem J. et al. Targeting a CAR to the TRAC locus with CRISPR/Cas9 enhances tumour rejection. Nature 543, 113–117 (2017). [DOI] [PMC free article] [PubMed] [Google Scholar]
- 29.Res P, Blom B, Hori T, Weijer K. & Spits H. Downregulation of CD1 marks acquisition of functional maturation of human thymocytes and defines a control point in late stages of human T cell development. J. Exp. Med 185, 141–151 (1997). [DOI] [PMC free article] [PubMed] [Google Scholar]
- 30.Haynes BF, Singer KH, Denning SM & Martin ME Analysis of expression of CD2, CD3, and T cell antigen receptor molecules during early human fetal thymic development. J. Immunol 141, 3776–3784 (1988). [PubMed] [Google Scholar]
- 31.Fujii Y, Okumura M, Inada K, Nakahara K. & Matsuda H. CD45 isoform expression during T cell development in the thymus. Eur. J. Immunol 22, 1843–1850 (1992). [DOI] [PubMed] [Google Scholar]
- 32.Van de Walle I. et al. An early decrease in Notch activation is required for human TCR-alphabeta lineage differentiation at the expense of TCR-gammadelta T cells. Blood 113, 2988–2998 (2009). [DOI] [PubMed] [Google Scholar]
- 33.Yashiro-Ohtani Y. et al. Pre-TCR signaling inactivates Notch1 transcription by antagonizing E2A. Genes Dev. 23, 1665–1676 (2009). [DOI] [PMC free article] [PubMed] [Google Scholar]
- 34.Hernández-Hoyos G, Anderson MK, Wang C, Rothenberg EV & Alberola-Ila J. GATA-3 expression is controlled by TCR signals and regulates CD4/CD8 differentiation. Immunity 19, 83–94 (2003). [DOI] [PubMed] [Google Scholar]
- 35.Dolens AC et al. Distinct Notch1 and BCL11B requirements mediate human γδ/αβ T cell development. EMBO Rep. 21, e49006 (2020). [DOI] [PMC free article] [PubMed] [Google Scholar]
- 36.Brentjens RJ et al. Eradication of systemic B-cell tumors by genetically targeted human T lymphocytes co-stimulated by CD80 and interleukin-15. Nat. Med 9, 279–286 (2003). [DOI] [PubMed] [Google Scholar]
- 37.Zhao Z. et al. Structural Design of Engineered Co-stimulation Determines Tumor Rejection Kinetics and Persistence of CAR T Cells. Cancer Cell 28, 415–428 (2015). [DOI] [PMC free article] [PubMed] [Google Scholar]
- 38.Ciofani M, Knowles GC, Wiest DL, von Boehmer H. & Zúñiga-Pflücker JC Stage-specific and differential notch dependency at the alphabeta and gammadelta T lineage bifurcation. Immunity 25, 105–116 (2006). [DOI] [PubMed] [Google Scholar]
- 39.Hayes SM, Li L. & Love PE TCR signal strength influences alphabeta/gammadelta lineage fate. Immunity 22, 583–593 (2005). [DOI] [PubMed] [Google Scholar]
- 40.Groettrup M. et al. A novel disulfide-linked heterodimer on pre-T cells consists of the T cell receptor beta chain and a 33 kd glycoprotein. Cell 75, 283–294 (1993). [DOI] [PubMed] [Google Scholar]
- 41.Borowski C, Li X, Aifantis I, Gounari F. & von Boehmer H. Pre-TCRalpha and TCRalpha are not interchangeable partners of TCRbeta during T lymphocyte development. J. Exp. Med 199, 607–615 (2004). [DOI] [PMC free article] [PubMed] [Google Scholar]
- 42.Terrence K, Pavlovich CP, Matechak EO & Fowlkes BJ Premature expression of T cell receptor (TCR)alphabeta suppresses TCRgammadelta gene rearrangement but permits development of gammadelta lineage T cells. J. Exp. Med 192, 537–548 (2000). [DOI] [PMC free article] [PubMed] [Google Scholar]
- 43.Reizis B. & Leder P. Direct induction of T lymphocyte-specific gene expression by the mammalian Notch signaling pathway. Genes Dev. 16, 295–300 (2002). [DOI] [PMC free article] [PubMed] [Google Scholar]
- 44.Haks MC et al. Attenuation of gammadeltaTCR signaling efficiently diverts thymocytes to the alphabeta lineage. Immunity 22, 595–606 (2005). [DOI] [PubMed] [Google Scholar]
- 45.Kim YM et al. Expression of 4–1BB and 4–1BBL in thymocytes during thymus regeneration. Exp. Mol. Med 41, 896–911 (2009). [DOI] [PMC free article] [PubMed] [Google Scholar]
- 46.Groves T, Parsons M, Miyamoto NG & Guidos CJ TCR engagement of CD4+CD8+ thymocytes in vitro induces early aspects of positive selection, but not apoptosis. J. Immunol 158, 65–75 (1997). [PubMed] [Google Scholar]
- 47.Anderson G, Hare KJ & Jenkinson EJ Positive selection of thymocytes: the long and winding road. Immunol. Today 20, 463–468 (1999). [DOI] [PubMed] [Google Scholar]
- 48.McFarland RD, Douek DC, Koup RA & Picker LJ Identification of a human recent thymic emigrant phenotype. Proc. Natl. Acad. Sci. U S A 97, 4215–4220 (2000). [DOI] [PMC free article] [PubMed] [Google Scholar]
- 49.Iriguchi S. et al. A clinically applicable and scalable method to regenerate T-cells from iPSCs for off-the-shelf T-cell immunotherapy. Nat. Commun 12, 430 (2021). [DOI] [PMC free article] [PubMed] [Google Scholar]
- 50.Ito T. et al. The therapeutic potential of multiclonal tumoricidal T cells derived from tumor infiltrating lymphocyte-1derived iPS cells. Commun. Biol 4, 694 (2021). [DOI] [PMC free article] [PubMed] [Google Scholar]
- 51.Valamehr B. et al. Platform for induction and maintenance of transgene-free hiPSCs resembling ground state pluripotent stem cells. Stem Cell Reports 2, 366–381 (2014). [DOI] [PMC free article] [PubMed] [Google Scholar]
- 52.Nagano S. et al. High Frequency Production of T Cell-Derived iPSC Clones Capable of Generating Potent Cytotoxic T Cells. Mol. Ther. Methods Clin. Dev 16, 126–135 (2020). [DOI] [PMC free article] [PubMed] [Google Scholar]
- 53.Fraietta JA et al. Disruption of TET2 promotes the therapeutic efficacy of CD19-targeted T cells. Nature 558, 307–312 (2018). [DOI] [PMC free article] [PubMed] [Google Scholar]
- 54.Poirot L. et al. Multiplex Genome-Edited T-cell Manufacturing Platform for “Off-the-Shelf” Adoptive T-cell Immunotherapies. Cancer Res. 75, 3853–3864 (2015). [DOI] [PubMed] [Google Scholar]
- 55.Stadtmauer EA et al. CRISPR-engineered T cells in patients with refractory cancer. Science 367, 1001 (2020). [DOI] [PMC free article] [PubMed] [Google Scholar]
- 56.Ruella M. et al. A cellular antidote to specifically deplete anti-CD19 chimeric antigen receptor-positive cells. Blood 135, 505–509 (2020). [DOI] [PMC free article] [PubMed] [Google Scholar]
- 57.Mansilla-Soto J. et al. HLA-independent T cell receptors for targeting tumors with low antigen density. Nat. Med 28, 345–352 (2022). [DOI] [PMC free article] [PubMed] [Google Scholar]
- 58.Amor C. et al. Senolytic CAR T cells reverse senescence-associated pathologies. Nature 583, 127–132 (2020). [DOI] [PMC free article] [PubMed] [Google Scholar]
- 59.Rivière I, Brose K. & Mulligan RC Effects of retroviral vector design on expression of human adenosine deaminase in murine bone marrow transplant recipients engrafted with genetically modified cells. Proc. Natl. Acad. Sci. U S A 92, 6733–6737 (1995). [DOI] [PMC free article] [PubMed] [Google Scholar]
- 60.Hamieh M. et al. CAR T cell trogocytosis and cooperative killing regulate tumour antigen escape. Nature 568, 112–116 (2019). [DOI] [PMC free article] [PubMed] [Google Scholar]
- 61.Cichocki F. et al. iPSC-derived NK cells maintain high cytotoxicity and enhance in vivo tumor control in concert with T cells and anti-PD-1 therapy. Sci. Transl. Med 12, eaaz5618 (2020). [DOI] [PMC free article] [PubMed] [Google Scholar]
- 62.Mali P. et al. RNA-guided human genome engineering via Cas9. Science 339, 823–826 (2013). [DOI] [PMC free article] [PubMed] [Google Scholar]
- 63.Valamehr B. et al. A novel platform to enable the high-throughput derivation and characterization of feeder-free human iPSCs. Sci. Rep 2, 213 (2012). [DOI] [PMC free article] [PubMed] [Google Scholar]
- 64.Maher J, Brentjens RJ, Gunset G, Rivière I. & Sadelain M. Human T-lymphocyte cytotoxicity and proliferation directed by a single chimeric TCRzeta /CD28 receptor. Nat. Biotechnol 20, 70–75 (2002). [DOI] [PubMed] [Google Scholar]
- 65.Gong MC et al. Cancer patient T cells genetically targeted to prostate-specific membrane antigen specifically lyse prostate cancer cells and release cytokines in response to prostate-specific membrane antigen. Neoplasia 1, 123–127 (1999). [DOI] [PMC free article] [PubMed] [Google Scholar]
Associated Data
This section collects any data citations, data availability statements, or supplementary materials included in this article.
Supplementary Materials
Data Availability Statement
The RNA sequencing data have been deposited in the Gene Expression Omnibus under the accession number GSE210364. Source data for tumour growth are provided with this paper. Other data generated for this manuscript are available from the corresponding author upon reasonable request.


