

Abstract
Objective
To systematically analyze the cell composition and transcriptome of primary and transformed human endometrial stromal cells (HESCs and THESCs).
Design
The primary HESCs from three different donors and one immortalized THESC were collected from the human endometrium at mid-secretory phase and cultured in vitro.
Setting
Academic Research Laboratory
Patients
None
Interventions
None
Main Outcome Measures
Single cell RNA-Seq analysis
Results
We found the individual differences among the primary HESCs and bigger changes between the primary HESCs and THESCs. Cell clustering with or without integration identified cell clusters belonging to mature, proliferative, and active fibroblasts that were conserved across all the samples at different stages of cell cycles with intensive cell communication signals. All the primary and transformed HESCs can be correlated with some subpopulations of fibroblasts in the human endometrium.
Conclusions
Our study indicated that the primary HESCs and THESCs displayed conserved cell characters and distinct cell clusters. Mature, proliferative and active fibroblasts at different stages or cell cycles were detected across all the samples and presented with complex cell communication network. The cultured HESCs and THESCs retained the features of some subpopulations within the human endometrium.
Keywords: scRNA-Seq, fibroblast, THESCs, HESCs, human endometrium
Introduction
Issues involving fertility affect women worldwide (1). In addition to infertility, as defined as the inability to achieve pregnancy after trying for 1 year, and pregnancy complications, such as preeclampsia, gestational diabetes, and premature birth, represent a significant health concern. As the uterus functions to support embryo implantation, and fetal growth, understanding the molecular mechanisms regulating uterine biology Is critical to understanding issues that arise in pregnancy (2, 3). However, the knowledge about the human uterus during pregnancy is very limited. Animal models, such as rodents, ruminants, primates, and especially the genetically modified mouse models are well-developed tools to study uterine function in vivo (4–6). Meanwhile, the in vitro culture of human endometrial cells, including stromal fibroblasts and epithelium, provides a valuable chance to directly investigate the functions of human uterus (7). Recently, the advancement of human endometrial organoid models assembled by both epithelium and stroma presents a promising avenue in establishing in vitro human endometrium to directly investigate their functions during pregnancy (8, 9).
The cultured human endometrial stromal cells (HESCs) is one fundamental of the in vitro human endometrial system. HESCs are fibroblasts isolated from the uterus of women and can be maintained in vitro. These cells can be stimulated with ovarian steroids and or cAMP to differentiate into decidual cells. This decidualization process is a requisite for successful embryo implantation, as the decidualization of stromal cells protect and nurture the implanting embryo. HESCs have been studied intensively to identify the complex signals during decidualization that is a critical transformation process that prepares the stromal cells to support the pregnancy (10). Additionally, distinct fibroblast subpopulations were identified in the human endometrium during the menstrual cycle (11–13), Although cell subpopulations of untreated human endometrial stromal cells have been proposed (14, 15), our understanding about the cell composition of HESCs at the non-stimulated status is still very limited.
In general, the stromal fibroblasts are easy to culture in vitro (16). The primary HESCs and the Telomerase-immortalized endometrial stromal cell line (THESC) (17) are both widely used. Primary HESCs retain the characters of human endometrial stromal cells but are limited by the passages of the cell line while the THESCs have been reported as immortalized cell lines that can decidualize normally upon hormone treatment (17). THESCs may be a good replacement of primary HESCs. However, a systematic comparison between HESCs and THESCs in the cell composition and transcriptome is prerequisite to unveil the conserved and differentiated characteristics between these two in vitro cell models. To test the hypothesis, we performed scRNA-Seq in three primary HESCs from different donors and one immortalized THESC.
Methods
Cell culture
Two primary HESCs, P1 and P2, that were isolated from the human endometrial biopsy of two donors at mid-secretory, were kindly provided by Dr. Steve Young at the University of North Carolina at Chapel Hill. One primary HESC, P3, was collected from one mid-secretory donor at Baylor College of Medicine. The Telomerase-immortalized endometrial stromal cell line (THESC) was derived from mid-secretory HESCs and generously provided by Dr. Charles J. Lockwood (17). The primary HESCs and the THESCs were cultured at 37 °C under 5% CO2 in Dulbecco’s modified Eagle’s medium (DMEM-F12, 11320033, Fisher), supplemented with 1X Penicillin-Streptomycin (15140122, Fisher) and 5% Fetal Bovine Serum (10–437-028, Fisher). Primary HESCs at passage 4–5 were collected for scRNA-Seq analysis.
Single cell collections
Both the primary cells and THESCs were rinsed with 1X PBS and incubated by 0.25% trypsin (2520056, Fisher) at 37 °C to dissociate the cells from the cell plates. After 2–4 min incubation when the majority cells were dissociated, the cell solutions were gently pipetted and collected in the 15ml tubes. Then, the trypsin was neutralized by culture medium at the ratio 1:3. The cell solutions were centrifuged at 300g for 5 min and the supernatant was removed. The cell pellets were resuspended in cell culture medium and filtered using a 40μm cell strainer. The filtered cell suspension was kept on ice until loaded onto the machine.
scRNA-Seq library preparation and sequencing
The cells were counted and examined for viability with trypan blue staining using a TC-20 cell counter (Bio-Rad). Approximately 10,000 live cells at 1×10⁶ cells/ml concentration were loaded into the Single Cell Chip to generate single cell emulsion in the Chromium Controller with Chromium Single Cell 3’ Library & Gel Bead Kit v3.1 (Cat. 1000268, 10x Genomics). Reverse transcription of mRNA and cDNA amplification were carried out following the manufacturer’s instruction (Cat. 1000268, 10x Genomics). The amplified cDNA was further fragmented to construct NGS libraries. Then, Real-time PCR
Seq and Nova-Seq in NIEHS Epigenomics and DNA Sequencing Core Laboratory with the parameters recommended in the manufacture’s instruction manual. 2% PhiX control library was added in the pooled library for quality control.
scRNA-Seq data analysis
Raw FASTQ files were processed by Cell Ranger software (version 4.0.0, 10× Genomics) using “cellranger count” pipeline, which used STAR for alignment against human reference genome GRCh38/hg38. This pipeline used the barcodes to generate feature-cell matrix of unique molecular identifier (UMI) counting.
All the primary HESCs and THESC were analyzed together by Seurat package (version 3.6.3) (18) with or without integration by Harmony (19).
After filtering and normalization, the combined datasets were clustered following the standard unsupervised workflow. The marker genes of each cluster were identified by pairwise comparisons of each cluster against all other clusters using the FindAllMarkers function in the Seurat package with adjusted p-value less than 0.05. Expression of selected marker genes from each cluster was visualized by Dimplot in the Seurat package or Vision software (20). The heatmap of the top five marker genes from each cluster was generated according to the Seurat pipeline. The unsupervised hierarchy clustering based on the DEGs from all the clusters was generated using Partek® Genomics Suite® software, v7.0.
The DEGs between primary HESCs and THESCs in the mature, proliferative and active fibroblasts were identified by pairwise comparisons using FindMarkers in the Seurat package. DEGs with adjusted p value < 0.05 and absolute fold change >1.3 were used for Ingenuity Pathway Analysis (IPA, Qiagen) to identify the enriched pathways in the 13 cell clusters. After harmony integration, DEGs with adjusted p value < 0.05 and absolute fold change >1.2 were used for Ingenuity Pathway Analysis (IPA, Qiagen) and DAVID Functional Annotation Bioinformatics Microarray Analysis to identify the enriched pathways (21, 22).
The cell cycle was predicted using CellCycleScoring in the Seurat package. Cell trajectory of each sample was analyzed using monocle3 (23).
The overall communication map and dominant ligand-receptor pairs within the three primary HESCs and one THESC were analyzed using CellChat (24). Only the clusters with more than 50 cells were included for this analysis. The overall communication score was calculated by computeCommunProbPathway. The top ligand-receptor pairs were visualized by netVisual_bubble.
The scRNA-Seq of our combined dataset was mapped to the published scRNA-Seq dataset from human endometrial tissues at mid-secretory (25) using the ClusterMap (26).
The detailed script was in supplement material “HESC-scRNAseq-script”.
Real-time PCR
The three primary HESCs and one THESC cell were seeded at 6-well plate, Cells from the same sample were pooled together for RNA isolation. The total RNA was isolated by Rneasy mini kit (74104, Qiagen). 1ug total RNA was reverse transcribed into cDNA using M-MLV reverse transcriptase (28025013, Fisher) following the manual. Quantitative real time PCR was performed using SsoAdvanced Universal SYBR Green Supermix (1725274, Bio-rad). SYBR green primers were designed using NIH Primer-blast or downloaded from the Primerbank (27) and synthesized by Sigma-Aldrich (Excel S1). ΔΔCt values were calculated using the Ct number of 18S as amplification control and THESC as the base line to acquire relative mRNA levels per sample.
Data availability
The raw and processed data for scRNA-Seq of the three primary HESCs and one THESC were uploaded to GEO as GSE195918.
Results
The cell atlas of primary HESCs and THESC
In order to determine the cell atlas of the cultured human endometrial stromal cells, we performed single-cell RNA-Seq in three patient HESCs and one THESC. In total, 1,688, 2,189, and 2,219 HESCs from three different donors and 1,672 THESCs were collected for scRNA-seq analysis, respectively. On average, 6,734 genes and 54,610 UMI per cell, 6,480 genes and 49,368 UMI per cell, 6,400 genes and 46,638 UMI per cell, 6,588 genes and 51,024 UMI per cell were detected in the three primary HESCs and one THESC samples. Based on the number of cells, the average gene per cell and the average UMI per cell, the quality of our data in four samples was consistent and was comparable to the recently published single cell studies using human endometrial tissues and cells (11, 13, 15).
First of all, we combined all the four samples for the scRNA-Seq analysis. To check the inter-sample differences, we reassigned one color to the cells from the same sample in the combined UMAP (Fig. 1A). Generally, the four samples were separated from each other suggesting the variations between the samples. Among them, the three primary HESCs were closer to each other with a small number of cells overlapped, while the THESC was further away from the primary HESCs with very few cells overlapped (Fig. 1A) suggesting that the primary cells still presented the individual differences with the bigger changes observed between primary and transformed HESCs.
Fig.1.

The cell atlas of primary HESCs and THESC. A. UMAP analysis of four samples. Each color labeled one sample. B. UMAP analysis of 13 cell clusters. Each color labeled one cell cluster. C. Heatmap of DEG expressions of all the cell clusters. From yellow to blue, the gene expressions were from high to low. Hierarchy cluster analysis identified three groups of clusters names as mature, proliferative and active. D. The percentage of cell from each sample within each cell cluster. E. The top altered pathways in each cell clusters. Red was activation, green was inhibition, brown was significantly altered but with no obvious directions The size of the circle corresponded to the p value. The bigger the size was, the more significant the result was. P1, P2, and P3 were three primary HESCs.
For the combined datasets, there were 13 distinct cell clusters labeled with different colors (Fig. 1B). Based on the expression patterns of the marker genes, we performed hierarchy cluster analysis and grouped the 13 cell clusters into three categories that we named mature, proliferative, and active fibroblasts (Fig. 1C). Each category contained cell clusters from different samples (Fig. 1D). The mature and proliferative fibroblasts had the cell clusters from all four samples, primary HESC P1, P2, P3 and THESC. Cluster 11 that belongs to two primary HESCs P1 and P3, and cluster 12 from THESC were assigned to the active fibroblasts. Each sample also contained the cells from different clusters. For example, primary HESC P1 was mainly composed of cluster 3, 4, 11, while P2 was consisted of cluster 1, 5, 9, 10. These results suggested that the four HESCs shared not only similar cell composition, but also maintained certain distinct cell clusters.
The functional annotations of HESC subpopulations
To further understand the characters of the 13 cell clusters, we compared the marker genes and top altered pathways of each cluster (Fig. 1E, table 1, Fig, S1 and Excel S2).
Table 1.
The top 20 marker genes in human endometrial stromal cell clusters.
| Mature | Proliferative | Active | ||||||||||
|---|---|---|---|---|---|---|---|---|---|---|---|---|
| Cluster-0 | Cluster-1 | Cluster-2 | Cluster-3 | Cluster-5 | Cluster-4 | Cluster-6 | Cluster-7 | Cluster-8 | Cluster-9 | Cluster-10 | Cluster-11 | Cluster-12 |
| ALDH1A1 | KRT17 | TFPI2 | IGFBP5 | VCAN | HIST1H4C | FGF5 | CCNB1 | HIST1H4C | TOP2A | AC092069.1 | LRRC75A | GREM1 |
| KRT18 | POSTN | CRYAB | PPME1 | ACTA2 | UBE2S | CXCL12 | CENPF | CLSPN | CENPF | PHKG1 | DIO2 | RAB3B |
| CCDC71L | ACTG2 | FST | DIO2 | BGN | CCNB1 | TM4SF1 | CDC20 | ATAD2 | IGFBP5 | AC091607.2 | EGR1 | SH3BGRL3 |
| MEST | KRT34 | IGFBP6 | KRT18 | FN1 | CENPF | HMGB2 | CKS2 | HIST1H1B | HIST1H4C | RPL27A | KCNMA1 | CXCL12 |
| RBP1 | IGFBP5 | SRGN | KISS1 | COL4A1 | H2AFZ | HIST1H4C | UBE2S | NASP | KRT34 | RPL38 | NEAT1 | MIR100HG |
| MMP3 | SPON2 | ACTC1 | FHL1 | SCUBE3 | CKS2 | UBE2S | KPNA2 | PCNA | HMGB2 | TMSB4X | MEST | TTC3 |
| CLEC2B | SYNPO2 | CXCL12 | DKK1 | BEX1 | TUBB4B | TFPI2 | ASPM | HELLS | MKI67 | RAB13 | TGM2 | G0S2 |
| TGFBI | FILIP1L | ID3 | PTGR1 | TINAGL1 | KPNA2 | G0S2 | MKI67 | MCM3 | ASPM | C1orf56 | HNRNPH1 | IGFBP4 |
| GDF15 | NEAT1 | IGFBP7 | TXNRD1 | COL1A2 | MT1E2 | CKS2 | ARL6IP1 | TYMS | CKS2 | RPL13A | RAB3B | HSPB6 |
| IGFBP2 | S100A4 | PRRX2 | CTSB | THBS2 | TPX2 | CCNB1 | TPX2 | H2AFZ | UBE2C | CCND1 | THBS1 | FN1 |
| HLA-B | WFDC1 | TNFRSF11B | TIMP3 | RGS4 | CDC20 | PTTG1 | AURKA | DNAJC9 | ACTG2 | MT2A | AXL | CYBRD1 |
| FJX1 | AKAP12 | PIK3R1 | GDF15 | COL6A1 | PRC1 | SRGN | HMGB2 | MEST | KPNA2 | LRRC75A | SULF1 | LOX |
| DUSP1 | SOX4 | DCN | MT1E | GREM1 | MKI67 | CDKN3 | PRC1 | PCLAF | ANLN | ACTG2 | CDKN1A | AC092069.1 |
| CYB5A | COL4A1 | PTX3 | NNMT | FBN1 | TYMS | TOP2A | HMMR | USP1 | POSTN | SMC4 | AC092069.1 | FGF5 |
| CCDC80 | PAPPA | LGALS3 | MGST1 | COL1A1 | BIRC5 | CENPF | TUBB4B | FEN1 | TPX2 | ATP5PD | GOLGA4 | SULF1 |
| GPRC5A | ADAMTS5 | SERPINE2 | ANKRD37 | ITGA11 | PTTG1 | UBE2C | CDKN3 | UBE2T | SMC4 | FKBP1A | FTL | SCUBE3 |
| ANXA1 | CNN1 | CTSC | TIMP1 | TGFBI | SMC4 | TUBB4B | CCNB2 | DEK | CENPE | EIF5A | GPRC5A | EDIL3 |
| PTN | RND3 | MFGE8 | LYPD6B | PPP1R14A | ASPM | FST | TOP2A | ALDH1A1 | CDK1 | HMGB2 | FTH1 | KCTD20 |
| IER3 | WNT5A | ADIRF | THBS1 | TAGLN | CKS1B | STMN1 | CKS1B | DNMT1 | SPDL1 | PCLAF | MT-ND5 | EEF1A1 |
| KRT19 | NEFM | DSP | UCHL1 | SPARC | TOP2A | PRC1 | NUSAP1 | HIST1H1D | ARL6IP1 | CKS2 | FRMD6 | PTX3 |
Li. Single-cell ribonucleic acid sequencing of human endometrial stromal cells. Fertil Steril Sci 2022.
Clusters 0, 1, 2, 3 and 5 are grouped as mature fibroblasts. The mature fibroblasts were characterized as having an abundance of keratins, collagens and cellular matrix proteins, such as KRT17, ACTG2, VCAN. Besides, cluster 3 was enriched with DIO2, that has been associated with recurrent pregnancy loss (11) and pro-fibrotic factor IGFBP5 (28); Cluster 0 showed highly expressed retinoid synthesis related genes, such as Aldehyde Dehydrogenase ALDH1A1 and Retinol binding protein RBP1 (29, 30); Cluster 2 had higher levels of decidual regulators PRRX2 (31) and PTX2 (32); Cluster 1 had abundant Keratin KRT17, that was also detected in the cultured human skin fibroblast (33), and contractile related smooth muscle actin ACTG2 (34); Cluster 5 exhibited marker genes, such as extracellular matrix Versican (VCAN) and cell adhesion protein ITGA1, that were critical for the differentiation of the myofibroblast (35, 36);
Clusters 4, 6, 7, 8, 9 and 10 were grouped as proliferative fibroblasts. In the proliferative fibroblasts, the genes related with cell proliferation were enriched in all the clusters while only the ranking of these genes still varied between different clusters. Specifically, cluster 4 showed relatively higher expression of mitosis markers CCNB1 and CDC20 (37); The top marker genes in cluster 8 were DNA replication regulators CLSPN and FEN1 (38, 39); Cluster 6 was enriched with TM4SF1, that can facilitate cell migration (40) and the proliferative marker TOP2A; Cluster 7 had more ASPM and AURKA, that plays critical roles in spindle organization during mitosis; Cluster 9 was enriched with proliferative markers TOP2A and MKI67; Cluster 10 had relatively higher expressions of ribosome proteins RPL27A and RPL38A.
Finally, clusters 11 and 12 were clusters of active fibroblasts, which expressed several genes critical for cell differentiation. For example, LRRC75A, that labels mesenchymal stromal cells with ossification ability (41), and EGR1, that was essential for decidualization (42), were more enriched in cluster 11; Chemokine CXCL12 that mediates epithelial proliferation (43), and fibroblast growth factor FGF5 were expressed at much higher levels in cluster 12.
The expressions of 12 selected marker genes from different cell clusters were validated by Real-time PCR using the pooled total RNA from each sample (Fig S1B). Utilizing the marker gene expression in each cluster, differentially enriched pathways were predicted by Ingenuity Pathway Analysis (Fig. 1E). Indeed, the cardiac hypertrophy and fibrosis pathways that are related with mature fibroblast were more activated in the mature fibroblast group. The enhanced chromosome replication and inhibited G2/M checkpoint were mainly observed in the proliferative fibroblasts. Multiple signaling including EIF2 (translation) (44), mTOR (45), oxidative phosphorylation (mitochondria) (46), IGF1 (47), and Wnt/β-catenin (48) pathways, which are not only critical for maintaining the cellular homeostasis, but also have been associated with the decidualization ability of the HESCs, were more active in the two active fibroblast clusters.
Endometrial mesenchymal stem cells (eMSC) were a small subset of colony forming cells, characterized as co-expressions of MCAM and PDGFRB, and single expression of SUSD2 (49). Previous studies indicated eMSC can be cultured similarly as endometrial fibroblast in vitro but gradually differentiate into stromal fibroblasts (50, 51). We also checked eMSC marker expressions in the cultured HESCs and THESCs. To our surprise, 20–80% cells of the primary HESCs, while less than 20% cells of the THESCs in all the clusters except proliferative cluster 10 co-expressed MCAM and PDGFRB (Fig. S2A). And the highest co-expression levels were found in mature cluster 1 and 5 belonging to primary HESC P1 (Fig. S2A). Similar pattens were observed for SUSD2 with much lower percentages of positive cells (Fig. S2B). But the highest level of SUSD2 were detected in the mature cluster 3 which mainly contained the cells from primary HESC P2 (Fig. S2B). Eventually, less than 5% MCAM+/PDGFRB+/SUSD2+ cells were detected in most samples, except primary HESC P1 still maintained more than 10% triple positive cells in two mature fibroblast cluster 3 and 0 and one proliferative cluster 9 (Fig. S2C). In summary, the eMSC markers were still highly maintained in most cell subpopulations in the cultured primary HESCs and THESCs.
The cell cycle and trajectory prediction
Since several cell cycle genes, such as CCNB1, CCNB2, CENPF, CDC20, TOP2A, MKI67, PCNA, were enriched in the proliferative cell clusters including cluster 4, 6, 7. 8, 9, 10, respectively we hypothesized that the 13 subpopulations of fibroblasts may belong to the different stages of the cell cycle. To test it, we performed cell cycle prediction using the cell cycle score function in Seurat and labeled the cells at stage G1, G2/M and S with different colors (Fig. 2A). We found more than 80% of the mature and active fibroblasts were at the G1 stage; the proliferative fibroblasts were mainly at G2/M and S stages, expect cluster 10 showed a mixture of cells at all the three stages (Fig. 2B). These results unveiled the different cell stages in each cell cluster which may also contribute to the distinct characters of the cell clusters. According to the resemblance of the single cell transcriptome between each cluster, we predicted the cell trajectory in each sample (Fig. 2C). In general, if we assumed that the cell trajectory started from the proliferative fibroblast, then it branched into two routes in which one was toward the mature fibroblast, and the other pointed to the active fibroblast suggesting that the mature and active fibroblast may be two developing directions of these fibroblasts.
Fig. 2.

The cell cycle and trajectory predicted in the primary HESCs and THESC. A. UMAP analysis of cell cycle. The cell stage G1, G2/M and S were labeled with difference color. B. The percentage of cells at each stage within each cell cluster. C. Trajectory predictions of each primary HESC and THESC. P1, P2, and P3 were three primary HESCs.
The conserved cell subpopulations within primary HESCs and THESC
Having observed transcriptomic differences between the primary HESCs and THESC, we next focused on the conserved cell composition. Our scRNA-Seq analysis indicated that the cell clusters in all the cultured HESC samples can be divided into mature, proliferative and active fibroblasts suggesting that a consistent organization of cell subpopulations may exist in the cultured HESCs. Integration across multiple scRNA-Seq datasets have been widely used to identify the conserved clustering of different samples (52). Therefore, we integrated our scRNA-Seq data from all the cultured HESCs using Harmony (19) that removed the individual differences of all the samples and only focused on the conserved cell organization across the samples.
As expected, the three HESCs and THESC were largely overlapped with each other and shared similar cell clustering patterns after integration (Fig. 3A). Transcriptomic annotation identified 10 clusters (Fig. 3B). Among them, clusters 0 to 6 had a mixture of cells from the three HESCs and THESC. But cluster 7 was found in primary HESC P1 and P2 cells, cluster 8 was present in all three primary HESCs but not in THESC, and cluster 9 was found in primary HESC P2 and P3 cells, respectively (Fig. 3C, D). However, the clusters 7, 8, and 9 were comprised of a small number of cells between 1 to 52, that accounted for less than 2% cells in all the cells. Additionally, the numbers of cells from clusters 0 to 6 were comparable among HESCs and THESC (Fig. 3D). Similar to the previous analysis without Harmony integration, three categories of fibroblasts can be defined based on marker gene expression patterns (Fig. 3E), including mature fibroblasts (cluster 1, 8, 0, 9), active fibroblasts (cluster 3, 7, 6), and proliferative fibroblasts (cluster 2, 4, 5).
Fig. 3.
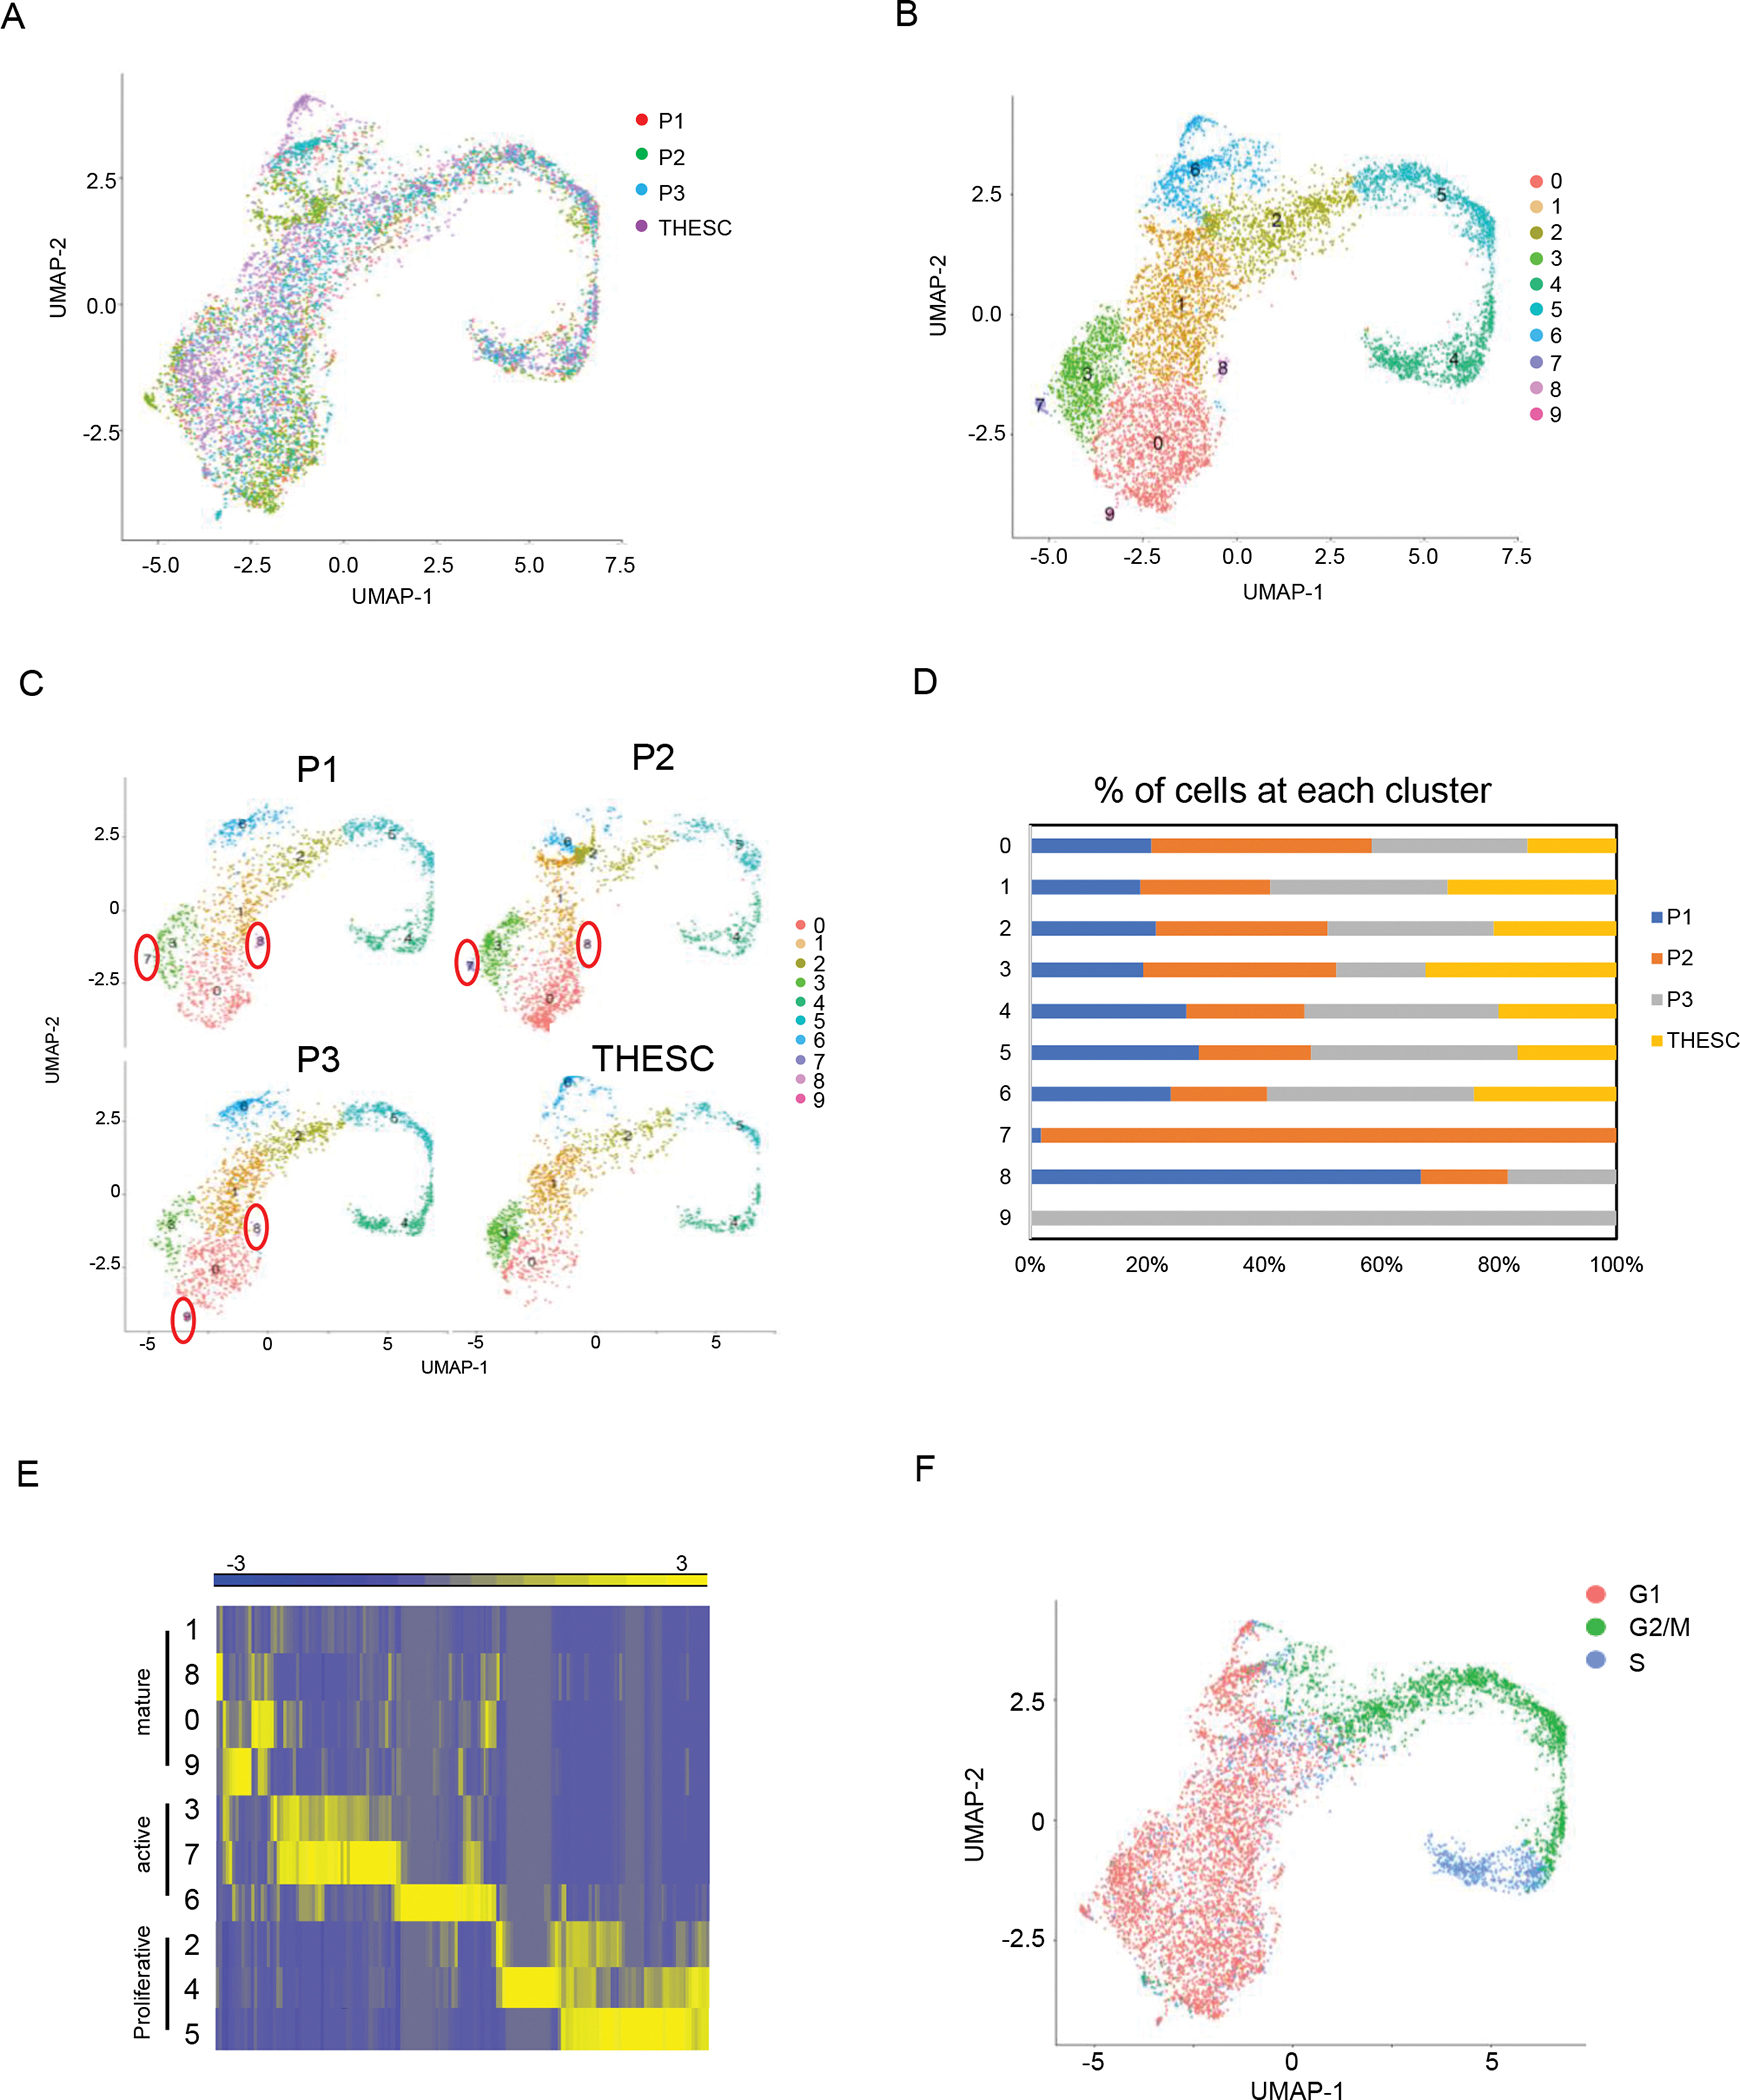
The conserved cell clustering in the primary HESCs and THESC after integration. A. UMAP analysis of four samples after integration. Each color labeled one sample. B. UMAP analysis of 10 cell clusters after integration. Each color labeled one cell cluster. C. UMAP analysis of 10 cell clusters within each sample. D. The percentage of cells from each sample at each cell cluster. E. The heatmap of DEGs of all the cell clusters. From yellow to blue, the gene expressions were from high to low. F. UMAP analysis of cell cycle. The cell stage G1, G2/M and S were labeled with different colors. P1, P2, and P3 were three primary HESCs.
The top marker genes of each cluster implied different biological characteristics (Table 2, Fig. S3 and Excel S3). In the mature fibroblasts, cluster 1 was enriched with muscle contraction gene KRT19 (53), stress response gene NUPR1 (54), and stem cell marker ALDH1A1 (55); Cluster 0 was enriched with IGF1 binding protein IGFBP5, basal cell marker KRT17 (56), and canonical smooth muscle marker ACTG2 (34); Cluster 8 only had six differentiated expressed marker genes, that mainly belong to the AP1 family including FOS, ATF3, and JUN (57); Cluster 9 shared the maker IGFBP5 with cluster 0, stem cell marker ALDH1A1 (55) with cluster 1, while cluster 9 also presented some unique markers related with aging including SRFBP1 and IGFBP2 (58, 59);
Table 2.
The top 20 marker genes in human endometrial stromal cell clusters after integration.
| Mature | Proliferative | Active | |||||||
|---|---|---|---|---|---|---|---|---|---|
| Cluster-0 | Cluster-1 | Cluster-8 | Cluster-9 | Cluster-2 | Cluster-4 | Cluster-5 | Cluster-3 | Cluster-6 | Cluster-7 |
| IGFBP5 | KRT19 | FOS | SFRP1 | PTTG1 | HIST1H4C | CKS2 | ACTA2 | LRRC7SA | PTX3 |
| KRT17 | NUPR1 | FOSB | IGFBP2 | UBE2S | HIST1H1B | CENPF | VCAN | RAB3B | VCAN |
| ACTG2 | ID1 | ATF3 | KCNMA1 | CDKN3 | CLSPN | CCNB1 | FN1 | AC092069.1 | FN1 |
| S100A4 | TFPI2 | JUN | RAMP1 | KRT17 | HIST1H1D | ASPM | TAGLN | SULF1 | ACTA2 |
| SPON2 | CCDC71L | AC020916.1 | TFPI2 | TUBAIC | ATAD2 | KPNA2 | CRYAB | CRIM1 | SCUBE3 |
| NEAT1 | HSPA5 | LACTB | BEX1 | TUBB4B | PCNA | HMGB2 | PPP1R14A | HNRNPH1 | TINAGL1 |
| POSTN | DKK1 | — | CCDC80 | H2AFZ | HMGB2 | TOP2A | IGFBP7 | CDKN1A | BGN |
| GLRX | ALDH1A1 | — | KRT18 | G0S2 | HELLS | ARL6IP1 | TIMP1 | GOLGA4 | RGS4 |
| CALD1 | GDF15 | — | ALDH1A1 | STMN1 | UBE2T | UBE2S | C0L1A2 | CTNNB1 | TIMP1 |
| FILIP1L | HTR2B | — | HLA-B | CKS1B | FEN1 | MKI67 | SERPINE2 | EGR1 | FAM43A |
| KRT34 | ID3 | — | MEST | CCNB1 | MCM3 | CDC20 | NUPR1 | HMGA1 | CEMIP |
| KRT18 | IGFBP6 | — | THY1 | BIRC5 | NASP | UBE2C | ACTC1 | AXL | BEX1 |
| RND3 | CTSC | — | PSMB9 | CENPW | TYMS | AURKA | IGFBP6 | TTC3 | CCN2 |
| AKAP12 | FGF7 | — | TFAP2A | HMGB1 | RRM2 | TPX2 | CCN2 | CDK2AP1 | TGFBI |
| SYNPO2 | CXCL12 | — | LAMA4 | TUBA1B | DEK | CENPE | DSP | ELL2 | ANKRD37 |
| SBF2-AS1 | LGALS3 | — | MGARP | PRC1 | DNAJC9 | PRC1 | BGN | GREM1 | PPP1R14A |
| CLIC3 | FST | — | MEIS2 | DTYMK | PCLAF | SMC4 | TP53I3 | CAVIN1 | FBN1 |
| ADAMT55 | UBC | — | ZFP36L2 | CCNB2 | USP1 | KIF20B | LOX | SET | SPARC |
| GPRC5A | TNFRSF11B | — | PSG4 | HMGN2 | TMPO | NUSAP1 | SCUBE3 | ADAMTS5 | FST |
| DAB2 | CEBPD | — | TKT | RAN | H2AFZ | HMMR | COL1A1 | MBNL1 | TAGLN |
Li. Single-cell ribonucleic acid sequencing of human endometrial stromal cells. Fertil Steril Sci 2022.
For the active fibroblasts, cluster 3 was enriched with myofibroblast transition markers, such as ACTA2, VCAN and CRYAB (35, 60, 61); Cluster 7 shared some cluster 3 marker genes including VCAN and ACTA2, but cluster 7 also had some unique marker, such as PTX3 that is a key immune mediator (62); Cluster 6 also had a unique marker gene LRR75A, that labels mesenchymal stromal cells with ossification ability (41).
Cluster 2, 4 and 5 belongs to the proliferative cells with higher expression of cell proliferative genes. Since MKI67 expression starts to increase at S phase and drastically drops at the later stages of G2/M phase (63), cluster 2 that showed higher expression of multiple cell mitosis regulators including PTTG1, CDKN3 and CCNB1, but not MKI67 implied that they were more likely at the late stages of G2/M (64–66). Both cluster 4 and 5 had higher levels of MKI67 suggesting they were around S and G2/M stages. Additionally, cluster 4 had abundant expression of chromatin regulators during DNA synthesis, such as HIST1H1B, CLSPN, and ATAD2 (67–69) suggesting that they may be at S phase. In contrast, cluster 5 was highly enriched with spindle regulators, such as CKS2, CENPF, and ASPM (70–72) suggesting that it was at the M phases. Furthermore, we used the CellCycleScoring in the Seurat package to predict the cell cycle stages in the integrated data. It also suggested cluster 2 and 5 were more likely at G2/M phases, while cluster 4 was probably at S phase (Fig. 3F).
Vision, a tool to describe the coordinated variation for scRNA-Seq data, has been used to interpret the functions of the cell clusters (20). The E2F and MYC signaling that is critical for DNA synthesis (73, 74) were more enhanced at the proliferative fibroblasts, including cluster 2, 4, and 5. The hypoxia signaling and the hypoxia stimulated myogenic signaling (75, 76) were more activated in the mature and active fibroblasts (Fig. 4A). Similarly, pathway analysis using the DEGs from each cluster also indicated that the cell cycle signaling was upregulated in the proliferative fibroblast. The fibrosis and its related ephrin signaling (77), the decidualization related integrin (78), RHOA (79), the IL8 signals that can be secreted by fibroblast to stimulate the immune cell motion (80), VEGF that can induce angiogenesis and fibroblast remodeling (81, 82) were more activated in the active fibroblasts (Fig. 4B).
Fig. 4.
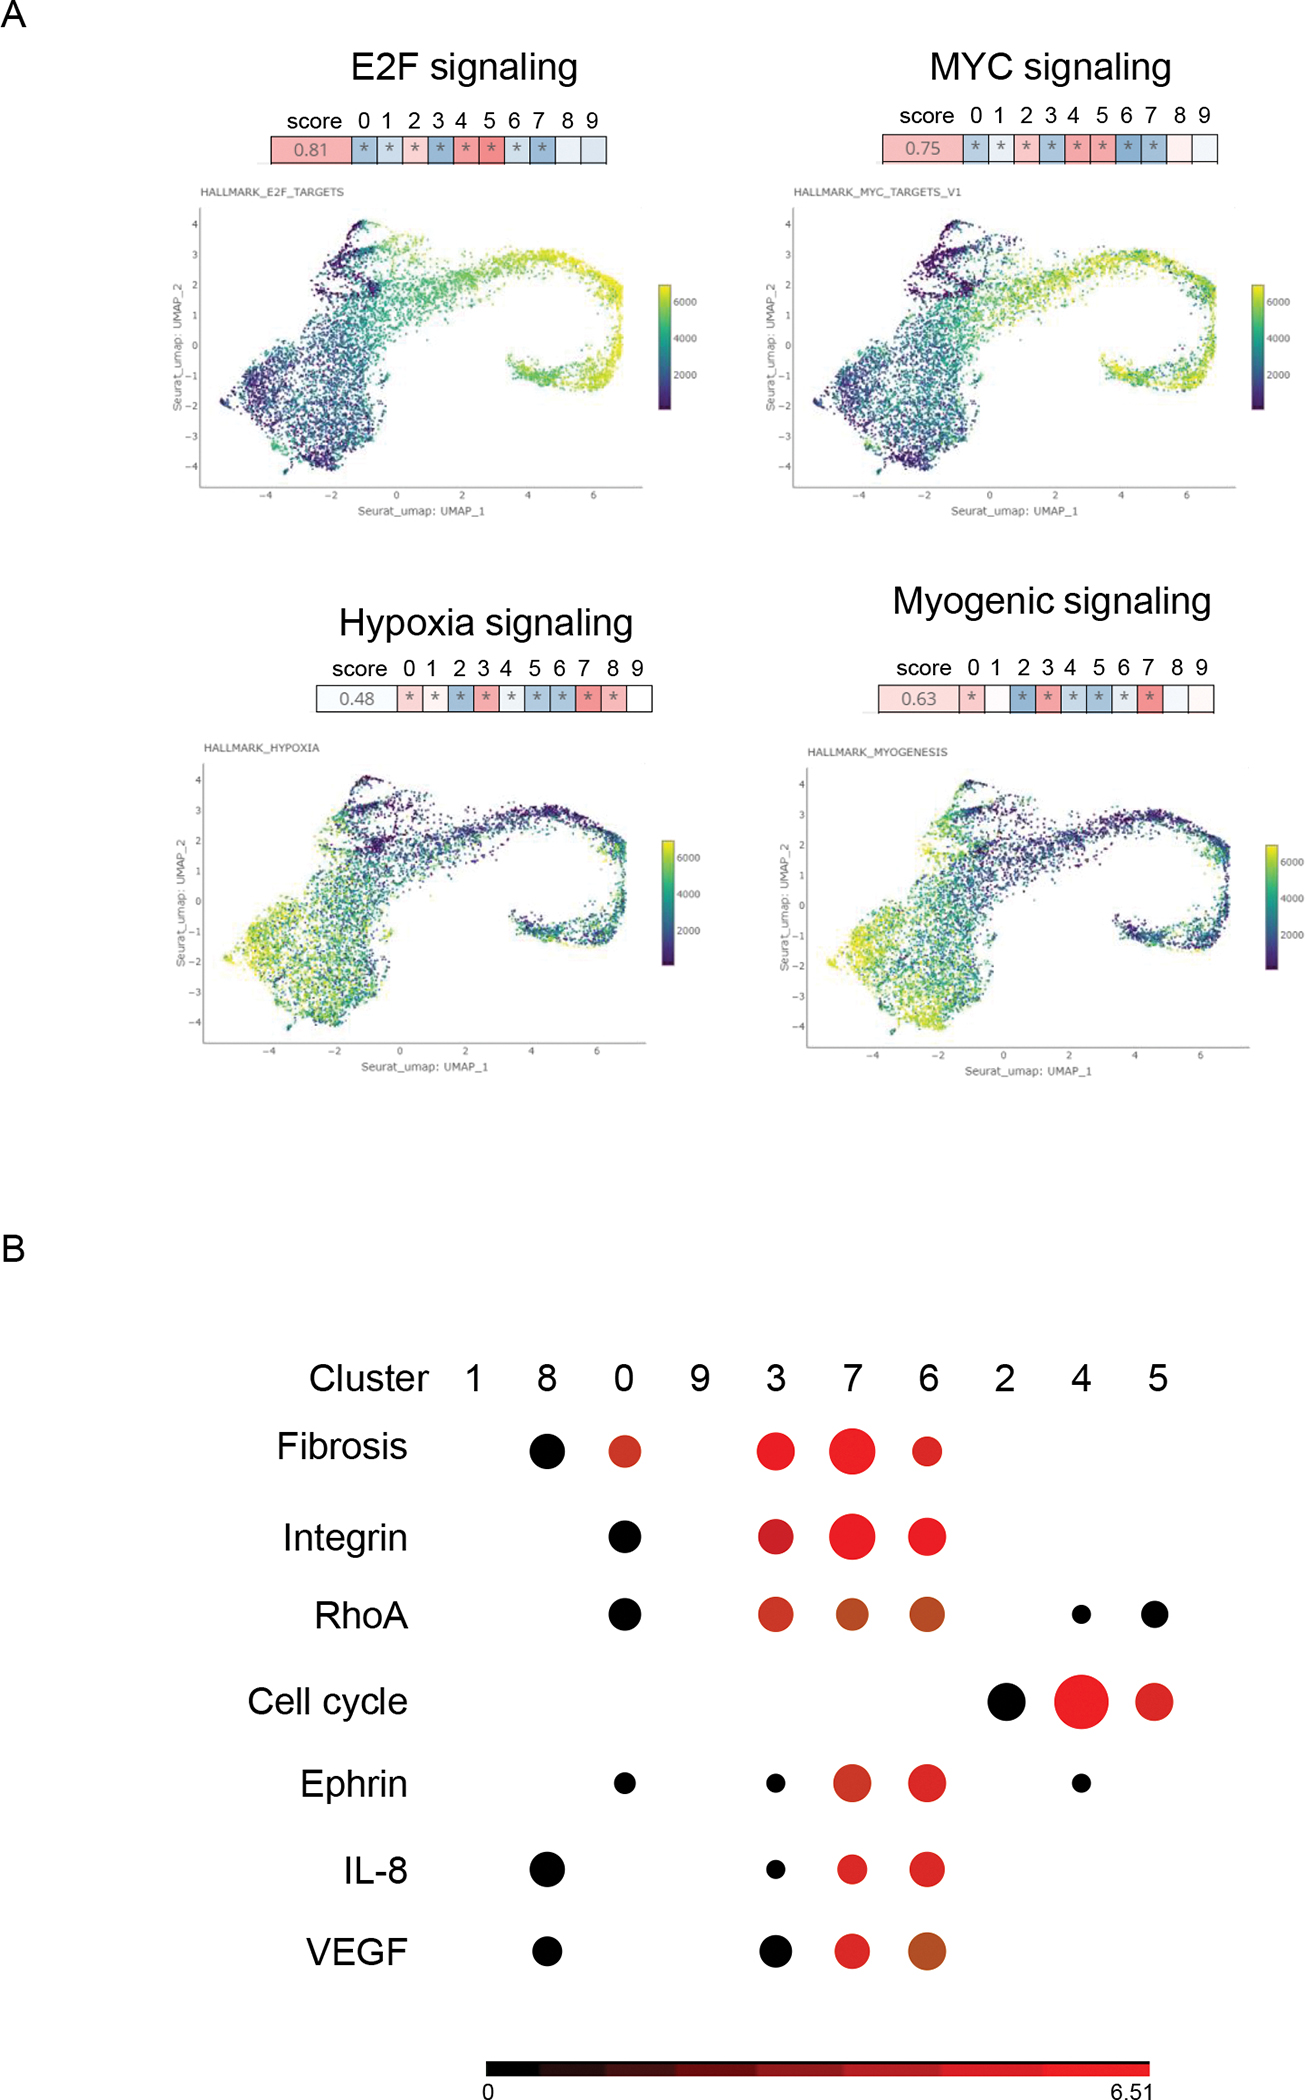
The functional annotation of cell clusters after integration. A. The pathways that were changed most among the cell clusters predicted by Vision. In the UMAP, the color changed from yellow to blue indicating the activity of the pathways were changed from suppressed to activated across the cell clusters. The score indicated the overall significance of the pathway in all the cell cluster. The higher the score was, the more significant the pathway was changed. The squares from 0 to 9 represented the pathway activity in all the cell cluster. The redder the more activated, the bluer the more suppressed. * indicated the pathway in this cluster was significantly changed compared to the rest of clusters. B. The top altered pathways of all the cell clusters predicted by Ingenuity pathway analysis (IPA). Red was activation. Black was no obvious change directions. The size of the circle corresponded to the p value. The bigger the size was, the more significant the result was.
The communications between cell clusters
In order to support the homeostasis of each cell culture system, cell communication plays a critical role. Having demonstrated that the four samples contained distinct cell clusters, we next examined the communications of these cell clusters within each sample using the CellChat program (24). In order to compare the communication between different samples, we still used the cell clusters that was generated without integration. All the samples contained at least one cell cluster from mature, active and proliferative fibroblasts, except primary HESC P2 that only had mature and proliferative fibroblasts (Fig. 5A). In total, strong communications between the mature, proliferative and active fibroblasts were observed in the all the samples. More interestingly, the cells located in cluster 10, one proliferative cluster in both P2 and P3, seems to have the least communication with other clusters.
Fig. 5.

The cell communication within the primary HESCs and THESC. A. The overall communication weight between the cell clusters. The communication weight was one summary data that was calculated by CellChat program based on the communication probability of all the ligand-receptor pairs. The cell clusters were ligand and receptor producers at the same time. The arrow pointed from the ligand producer to the receptor producer. The color of the arrow was the same as the ligand producer. The thickness of the arrow was positively associated with the overall communication weight. B. The top ligand-receptor pairs in each sample. From red to blue, the communication probability was maximum to minimum. P1, P2, and P3 were three primary HESCs.
The communication probability between cell clusters was predicted based on the expression levels of the ligand-receptor pairs at different clusters and presented as a circle with color changed from red to blue which was proportional to the communication signal strength from strong to weak (24). We listed the top ligand-receptor pairs that were enriched between clusters and within each sample (Fig. 5B). First, we focused on the common communication signals of all four samples. All the ligand-receptor pairs can be divided into two major groups. One group is the extracellular matrix, adhesion and membrane proteins. The other is growth factors and cytokines. Since extracellular proteins were abundantly expressed in HESCs and mediated multiple cellular activities (83), it was not surprising that collagen (84), fibronectin (FN1) (85), laminin (86), semaphorin (87), and thrombospondin (THBSs) (88) and their receptors including integrin, CD44, CD47, Syndecan, Neuropilin, and Plexin were the signals that were mostly transmitted between different clusters within all the samples. Among the growth factors, fibroblast growth factors (FGFs) and their receptors FGFRs that modulate a broad range of cell functions (89) were the most active signals. HBEGF-EGFRs, an embryo implantation regulating ligand-receptor pair (90, 91), Pleiotropin (PTN), a decidual mediator (92) that may interact with its receptor Nucleolin (NCL) to regulate inflammation (93), WNT-FDZs signaling, the key regulator in the uterus at both physiological and pathological conditions (94, 95), TNFSF12 and its receptor TNFSF12A that promotes the proliferation and collagen synthesis of fibroblast (96), also showed higher communication scores in all the HESCs.
In addition of these common ligand-receptor pairs, some specific communication signals within each sample were also detected. The VEGFs and its receptor VEGFR1 that may play complex roles in angiogenesis and inflammation, and the Delta-like 3 DLL3-NOTCH, an inhibitory NOTCH signaling (97) were only identified in the three primary HESCs, not the THESC. On the contrary, the ANGPTL2-Integtin ITGA/B signaling that promotes angiogenesis showed higher communication scores in the THESC than the primary HESCs, while the JAG1-NOTCH, an activating NOTCH signaling (98) was detected in the two primary HESCs P1 and P2, and the THESC. TGFβ-TGFBRs and PDGFs-PDGFRs that can coordinate to regulate the fibroblast proliferation and differentiation (99, 100) showed more intensive communication in P2 and P3 than others. Cardiotrophin-1 (CTF1) that shares the same receptors LIFR and IL6ST as LIF and OSM and regulates the cardiac hypertrophy (101, 102) was only observed in two primary HESCs P1 and P3.
Regardless of the sample identity, the cell clusters from mature, proliferative and active fibroblast also showed variable number, identity and communication probability of the same ligand-receptor pairs. Similar to the pathway analysis (Fig. 1E), the mature and active fibroblast showed stronger communication signals of collagens than the proliferative fibroblast. Additionally, IL11 that labels a subset of proliferative fibroblasts in the colorectal tumor (103) were also found synthesized mainly by the proliferative fibroblasts in our study and may interact with its receptors IL11RA and IL6ST in the mature and proliferative fibroblast. These results indicated the distinct communication signals between different cell clusters and samples.
The correlations of cultured HESCs with human endometrium
Since the purpose of the in vitro culture of primary HESCs and THESCs is to mimic their functions in vivo, we compared our cultured HESCs from the mid-secretory donors with the published human endometrial scRNA also collected at mid-secretory (25) using the ClusterMap program (26). In the published human endometrium at mid-secretory, there were epithelium (Epi), endothelium (Endo), perictyes (Peri), natural killer / T cells (NK/T), and several clusters of stroma fibroblast (Fibr) (Fig. 6A). The Circos plot connected the matched groups between our cultured HESCs and the published mid-secretory human endometrium (Fig. 6B). Based on similarity of the single cell transcriptome, two major connections were established labeled by the ribbons with green and yellow colors which are the least transparent color in the figure. One was the proliferative cluster 10 from all four cultured HESCs showed higher similarity to the Fibr cluster 1 of mid-secretory endometrium; the other was the active cluster 11 and 12 from the cultured HESCs that were more correlated with Fibr cluster 5 of mid-secretory endometrium. Furthermore, we combined our cultured HESCs and the published human endometrium together, re-run the clustering analysis and identified five major groups in the combined datasets (Fig. 6C). Similar to Circos plot (Fig. 6B), HESC active cluster 11 and 12 and mid-secretory endometrial cluster 5, while HESC proliferative cluster 10, 2, 7, 4, 8, 6, 9 and Mid-secretory endometrial Fibr cluster 1 were grouped as two groups, respectively. Besides, HESC mature fibr 1 and 5 from P2 + Mid-secretory Fibr 4, HESC mature fibroblast cluster 0 and 3 from P1 and P3 + Mid-Secretory fibr 0, 2, 3, 5 were grouped with each other, respectively. Additionally, all the non-fibroblast clusters from Mid-secretory endometrium, including the epithelium, endothelium, pericytes and immune cells were grouped together, which were quite different from all the stromal clusters from human endometrial and our HESCs. These results suggested the cultured HESCs share similar characters with some sub-populations of human endometrial stromal fibroblasts.
Fig. 6.

Correlations of the scRNA-Seq data from cultured HESCs and from human endometrium at mid-secretory. A. UMAP analysis of 12 cell clusters in human endometrium at mid-secretory. B: The matched subclusters between our cultured HESC and published human endometrium. The matured clusters were connected by the color ribbon. The transparency of the ribbon was inversely correlated with the similarity between the samples. C: Regrouping results of our cultured HESC and published human endometrial scRNA-Seq data. The five blue square labeled the five groups in the combined datasets. Epi: Epithelium; Endo: Endothelium; Fibr: Fibroblast; Peri: Pericytes; NK/T: Natural killer and T cell.
Discussion
Fibroblasts refer to the interstitial cells that are derived from the mesenchyme lacking the endothelial, immune and epithelial makers. Fibroblasts heterogeneity within and between organs has been extensively studied (34, 104, 105). The fibroblast subpopulations exhibited distinct characteristics that were largely affected by the microenvironment (106). In the human endometrium, subtypes of stromal fibroblasts have been proposed in multiple studies (11, 12, 25, 107, 108). Most studies have focused on the epithelial rather than the stromal subclusters and simply defined the stroma into decidual and non-decidual, and proliferative and non-proliferative clusters. Only one analysis that focused on the stroma compartment in the human endometrium reported more delicate structures within the endometrial stromal fibroblasts including three stromal clusters with no unique gene expression profiles, PAGE4+, ACAT2+, ECM, BMP+, CTNNB1+, THY1+, and ISG15+ clusters (107). In our study, we successfully identified multiple cell clusters in the primary and transformed HESCs that were cultured in vitro which can be correlated with several subtypes of stromal fibroblasts in the human endometrium in vivo.
The application of primary HESCs is limited by the scarcity of the material (109). Therefore, investigators have been tried multiple methods to establish a HESC cell line to extend their life span. Transfection with SV40 T antigen can immortalize the HESCs but transform them into the neoplastic cell lines with marked karyotypic abnormalities (110). Ectopic expression of telomerase catalytic subunit (TERT), whose shortening can lead to the cell division inhibition (111), has successfully generated the stable HESC cell lines that display similar phenotypes of primary HESCs (17, 112, 113). One novelty of our study is to directly compare the scRNA-Seq of HESCs and THESCs. In our scRNA-seq, we still observed distinct differences between each of the three primary HESCs and the THESC, with the THESC being the most divergent of the four analyzed. However, both the primary HESCs and THESC contained the conserved mature, proliferative and active fibroblasts supporting that THESC mimic some features of the primary HESCs. These differences between the primary HESCs and the THESC may stem from the different culture passages or the original donors, or the aftermath of the immortalization methods. The immortalized THESC are a good model for all kinds of genetic manipulations since it can provide consistent results across multiple passages. But the results from the THESC must be further validated with the primary HESCs. Recently, the generation of human endometrial stromal cells from induced pluripotent stem cells is attracting a lot of attention for its therapeutic roles (114). But there are still extensive knowledge gaps between the fully functional endometrial stromal cells and stem cells.
As expected, we also observed individual differences among the three primary HESCs, which were all collected at mid-secretory stages. These individual differences of the primary HESCs were most likely be inherited from the genetic and epigenetic differences of the donors who have distinct genetic polymorphism, experience variable environmental conditions and may undergo certain disease status that has not been checked during biopsy (115). Additionally, due to the temporal and spatial changes of endometrial tissues (25), the position of biopsy and the collection timing during mid-secretory may also influence the cell characters and compositions. Our observation of distinguished single-cell transcriptome among the primary HESCs further supported the importance of personal medicine in endometrial disorders, including infertility, endometriosis, fibrosis, endometrial cancers, and emphasized potential of the cultured HESCs as one valuable tool.
scRNA-Seq has been widely used in identifying cell identity and comparing transcriptome from cell subpopulations. But due to the sample variance, experimental changes and sequencing platform differences, the comparison of multiple scRNA-Seq is still challenging (116). In our study, we performed the scRNA-Seq of all four samples in the same experimental condition, but we still observed the undeniable sample differences that stem from individual patients. Actually, similar observations have been reported before, in which the cell type differences between immune, mesenchymal and epithelial were well conserved across the samples, but when the study focused on the subpopulations of one cell type, the mesenchyme, they showed variable clusters according to different development days (117). Therefore, we think the different fibroblast clusterings that were defined without any integration represent both sample difference and intrinsic fibroblast heterogeneity. In contrast, the fibroblast clusterings identified after integration by Harmony method (19) can override the sample differences and focus on the fibroblast heterogeneity. As expected, both cell clusterings with or without integration can identify the clusters belonging to mature, proliferative, and active fibroblasts suggesting a similar cell subpopulation existed in the primary and transformed human endometrial stromal cells.
Previous scRNA-Seq studies mainly detected the subpopulations in the cultured HESCs undergoing hormone induced decidualization or interacted with embryos (11, 118, 119). During decidualization, the senescent, activated and decidual fibroblasts have been detected simultaneously suggesting HESCs have distinct responses upon hormone treatment (11, 118). But it is intriguing to know whether these subtypes of fibroblasts were generated by different cellular responses to the hormones or the variable intrinsic cell identity before hormone treatment. The novelty of our study is to determine the distinct cell populations have already of the primary HESCs and THESC without any hormone treatment. Based on the enriched genes, all these cell clusters can be attributed to three major categories: mature, proliferative and active fibroblast. Among them, the mature fibroblast had abundant collagens and extracellular matrix proteins, the proliferative showed higher proliferation ability, while the active fibroblast was enriched with multiple growth factor and cytokine pathways. Therefore, we hypothesize that the different characteristics of the cells before any hormone treatment may be critical to the distinct decidual responses that were observed later. Further analysis using lineage tracing of these specific cell types can provide more direct evidence. Primary human endometrial fibroblasts were routinely used to check its functions at multiple physiological and pathological conditions. The cultured HESCs normally inherit the donor’s status, such as decidualization defects (11), endometriosis (50), menopause stages (120). But the rapid adaption of fibroblasts with the culture environment often leads to loss or gain of certain characteristics. Along with the passages, it is inherent that the fibroblasts gradually lose proliferation ability (121). Additionally, ACTA2 expression was normally restricted to the myofibroblast and pericytes, not the fibroblasts, but its levels were elevated in the cultured fibroblasts suggesting a switch to the myofibroblast phenotype (122). Similarly, keratin, an epithelial marker, has also been reported in the cultured non-transformed skin fibroblast (33) and transformed skin and lung fibroblasts (123). Our scRNA-Seq also showed ACTA2, KRT17 and 19 were readily detected in the cultured HESCs and were expressed at a relatively higher level in some subpopulations of cells suggesting some inevitable changes in the cultured HESCs compared to the in vivo stromal cells. Therefore, 2D culture of stromal cells can reflect some characters of the cells, but cautions in interpretation should be taken, as it could not fully recapitulate the features in vivo. Recent advancement of 3D co-culture of endometrial stromal cells and endometrial epithelia organoid models may shed light in establishing the appropriate microenvironment for the fully functional human endometrial stromal cells.
Human endometrium undergoes extensive regeneration during menstrual cycle, which are supported by a small subset of endometrial mesenchymal and epithelial stem cells. Among them, eMSC has been successfully isolated using the mesenchymal stem cell marker MCAM/PDGFRB or SUSD2 and cultured in vitro (50, 51). In both studies, ordinary endometrial fibroblast medium has been used, thus, the differentiation of eMSC into endometrial fibroblast were continuously observed. Similarly, we also cultured primary HESCs and THESCs in ordinary endometrial fibroblast medium. In contrast to the 1–4% cells in vivo (49), we found the eMSC markers were highly expressed in almost all the subpopulations in the both the primary HESCs and immortalized THESCs at the percentage from 0 to 80%. A relative higher number of eMSC marker positive cells in the specific primary HESCs while a much lower number in the THESC were detected. Since a gradual loss of mesenchymal stem cell gene signature has been reported along the passages (50), the reduced eMSC marker expressions in the THESCs may be caused by the higher passage numbers. All these results suggested the presence of eMSC in the cultured HESCs and individual differences still exist among the samples. However, our scRNA-Seq analysis failed to distinguish these eMSC marker positive cells from the rest cells in the same clusters. Further studies using flow sorting to enrich these potential stem cells or scRNA-Seq with more in-depth sequencing may reveal the identity of these cells.
Conclusion
The scRNA-Seq analysis of the three primary HESCs and one transformed THESC that were collected from the donors at mid-secretory phase identified individual differences between the donors and deviations between the primary and transformed HESCs. Each sample contained distinct cell clusters that can be characterized as mature, proliferative and active fibroblast with variable stages of cell cycles and intensive cell communications. More importantly, the cell clusters in the cultured primary and transformed HESCs showed higher correlation with the fibroblast clusters in the human endometrium in vivo suggesting the resemblance of the in vitro culture model and in vivo scenario.
Limitation of the study
One limitation of our study is the low sensitivity of the scRNA-Seq technology. Therefore, it is possible that we may fail to detect the low expressed genes which may also play crucial roles in the cell homeostasis. The technology development is required to provide a more delicate picture of the single cell transcriptome. The other limitation of our study is we only capture the scRNA-Seq of the cultured cells at one timepoint. Although we predicted the cell trajectory using the software, it is possible that the cultured HESCs may have more dynamic changes that may be another critical point for the cell identity and functions. We propose to perform scRNA-Seq at different timepoints may provide a more comprehensive understanding of the cell behaviors and fates.
Supplementary Material
Fig. S1. Gene expressions in the primary HESCs and THESC. A. The top marker genes in each cluster. From grey to blue, the expression levels were from low to high. B. The real-time PCR of the marker genes in the primary HESCs and THESC.
Fig. S2. Stem cell marker expression in the primary HESCs and THESC. A. The expression patterns of MCAM (red), PDGFRB (green), and co-expression (yellow). The percentages (%) of MCAM+/PDGFRB+ cells in each cluster from each sample. B. The expression patterns of SUSD2 (blue). The percentages (%) of SUSD2+ cells in each cluster from each sample. C. The percentages (%) of MCAM+/PDGFRB+/SUSD2+ cells in each cluster from each sample.
Fig. S3. Top marker genes in the primary HESCs and THESC after integration. From grey to red, the expression levels were from low to high.
Acknowledgements
This work was supported by an Intramural Research Program of the NIEHS, NIH project nos. Z1AES103311 (F.J.D.). The authors acknowledge the Epigenomic and DNA Sequencing Core, Epigenetics and Stem Cell Biology Laboratory and the Integrative Bioinformatics Supportive Group at NIEHS for their research support. The authors appreciate Ms. Janet DeMayo for proof reading.
Footnotes
Publisher's Disclaimer: This is a PDF file of an unedited manuscript that has been accepted for publication. As a service to our customers we are providing this early version of the manuscript. The manuscript will undergo copyediting, typesetting, and review of the resulting proof before it is published in its final form. Please note that during the production process errors may be discovered which could affect the content, and all legal disclaimers that apply to the journal pertain.
Reference
- 1.Farquhar CM, Bhattacharya S, Repping S, Mastenbroek S, Kamath MS, Marjoribanks J et al. Female subfertility. Nat Rev Dis Primers 2019;5:7. [DOI] [PubMed] [Google Scholar]
- 2.Bergmann S, Schindler M, Munger C, Penfold CA, Boroviak TE. Building a stem cell-based primate uterus. Commun Biol 2021;4. [DOI] [PMC free article] [PubMed] [Google Scholar]
- 3.Ng SW, Norwitz GA, Pavlicev M, Tilburgs T, Simon C, Norwitz ER. Endometrial Decidualization: The Primary Driver of Pregnancy Health. Int J Mol Sci 2020;21. [DOI] [PMC free article] [PubMed] [Google Scholar]
- 4.Maurya VK, DeMayo FJ, Lydon JP. Illuminating the “Black Box” of Progesterone-Dependent Embryo Implantation Using Engineered Mice. Front Cell Dev Biol 2021;9. [DOI] [PMC free article] [PubMed] [Google Scholar]
- 5.Spencer TE, Hansen TR. Implantation and Establishment of Pregnancy in Ruminants. Adv Anat Embryol Cel 2015;216:105–35. [DOI] [PubMed] [Google Scholar]
- 6.Su RW, Fazleabas AT. Implantation and Establishment of Pregnancy in Human and Nonhuman Primates. Adv Anat Embryol Cel 2015;216:189–213. [DOI] [PMC free article] [PubMed] [Google Scholar]
- 7.ClassenLinke I, Kusche M, Knauthe R, Beier HM. Establishment of a human endometrial cell culture system and characterization of its polarized hormone responsive epithelial cells. Cell Tissue Res 1997;287:171–85. [DOI] [PubMed] [Google Scholar]
- 8.Rawlings TM, Makwana K, Taylor DM, Mole MA, Fishwick KJ, Tryfonos M et al. Modelling the impact of decidual senescence on embryo implantation in human endometrial assembloids. Elife 2021;10. [DOI] [PMC free article] [PubMed] [Google Scholar]
- 9.Cheung VC, Peng CY, Marinic M, Sakabe NJ, Aneas I, Lynch VJ et al. Pluripotent stem cell-derived endometrial stromal fibroblasts in a cyclic, hormone-responsive, coculture model of human decidua. Cell Rep 2021;35. [DOI] [PubMed] [Google Scholar]
- 10.Okada H, Tsuzuki T, Murata H. Decidualization of the human endometrium. Reprod Med Biol 2018;17:220–7. [DOI] [PMC free article] [PubMed] [Google Scholar]
- 11.Lucas ES, Vrljicak P, Muter J, Diniz-da-Costa MM, Brighton PJ, Kong CS et al. Recurrent pregnancy loss is associated with a pro-senescent decidual response during the peri-implantation window. Commun Biol 2020;3. [DOI] [PMC free article] [PubMed] [Google Scholar]
- 12.Wang W, Vilella F, Alama P, Moreno I, Mignardi M, Isakova A et al. Single-cell transcriptomic atlas of the human endometrium during the menstrual cycle. Nat Med 2020;26:1644–53. [DOI] [PubMed] [Google Scholar]
- 13.Wang XY, Hawkins SM. Using advanced spatial and single-cell transcriptomics to characterize the human endometrium. Nat Genet 2021;53:1628–30. [DOI] [PMC free article] [PubMed] [Google Scholar]
- 14.Bogdanova N, Horst J, Chlystun M, Croucher PJP, Nebel A, Bohring A et al. A common haplotype of the annexin A5 (ANXA5) gene promoter is associated with recurrent pregnancy loss. Hum Mol Genet 2007;16:573–8. [DOI] [PubMed] [Google Scholar]
- 15.Cao DD, Chan RWS, Ng EHY, Gemzell-Danielsson K, Yeung WSB. Single-cell RNA sequencing of cultured human endometrial CD140b(+)CD146(+) perivascular cells highlights the importance of in vivo microenvironment. Stem Cell Res Ther 2021;12. [DOI] [PMC free article] [PubMed] [Google Scholar]
- 16.Fernandes IR, Russo FB, Pignatari GC, Evangelinellis MM, Tavolari S, Muotri AR et al. Fibroblast sources: Where can we get them? Cytotechnology 2016;68:223–8. [DOI] [PMC free article] [PubMed] [Google Scholar]
- 17.Krikun G, Mor G, Alvero A, Guller S, Schatz F, Sapi E et al. A novel immortalized human endometrial stromal cell line with normal progestational response. Endocrinology 2004;145:2291–6. [DOI] [PubMed] [Google Scholar]
- 18.Satija R, Farrell JA, Gennert D, Schier AF, Regev A. Spatial reconstruction of single-cell gene expression data. Nat Biotechnol 2015;33:495–502. [DOI] [PMC free article] [PubMed] [Google Scholar]
- 19.Korsunsky I, Millard N, Fan J, Slowikowski K, Zhang F, Wei K et al. Fast, sensitive and accurate integration of single-cell data with Harmony. Nat Methods 2019;16:1289–96. [DOI] [PMC free article] [PubMed] [Google Scholar]
- 20.DeTomaso D, Jones MG, Subramaniam M, Ashuach T, Ye CJ, Yosef N. Functional interpretation of single cell similarity maps. Nat Commun 2019;10:4376. [DOI] [PMC free article] [PubMed] [Google Scholar]
- 21.Huang DW, Sherman BT, Lempicki RA. Systematic and integrative analysis of large gene lists using DAVID bioinformatics resources. Nat Protoc 2009;4:44–57. [DOI] [PubMed] [Google Scholar]
- 22.Huang DW, Sherman BT, Lempicki RA. Bioinformatics enrichment tools: paths toward the comprehensive functional analysis of large gene lists. Nucleic Acids Res 2009;37:1–13. [DOI] [PMC free article] [PubMed] [Google Scholar]
- 23.Trapnell C, Cacchiarelli D, Grimsby J, Pokharel P, Li S, Morse M et al. The dynamics and regulators of cell fate decisions are revealed by pseudotemporal ordering of single cells. Nat Biotechnol 2014;32:381–6. [DOI] [PMC free article] [PubMed] [Google Scholar]
- 24.Jin S, Guerrero-Juarez CF, Zhang L, Chang I, Ramos R, Kuan CH et al. Inference and analysis of cell-cell communication using CellChat. Nat Commun 2021;12:1088. [DOI] [PMC free article] [PubMed] [Google Scholar]
- 25.Garcia-Alonso L, Handfield LF, Roberts K, Nikolakopoulou K, Fernando RC, Gardner L et al. Mapping the temporal and spatial dynamics of the human endometrium in vivo and in vitro. Nat Genet 2021;53:1698–711. [DOI] [PMC free article] [PubMed] [Google Scholar]
- 26.Gao X, Hu D, Gogol M, Li H. ClusterMap: compare multiple single cell RNA-Seq datasets across different experimental conditions. Bioinformatics 2019;35:3038–45. [DOI] [PubMed] [Google Scholar]
- 27.Spandidos A, Wang X, Wang H, Seed B. PrimerBank: a resource of human and mouse PCR primer pairs for gene expression detection and quantification. Nucleic Acids Res 2010;38:D792–9. [DOI] [PMC free article] [PubMed] [Google Scholar]
- 28.Yasuoka H, Yamaguchi Y, Feghali-Bostwick CA. The pro-fibrotic factor IGFBP-5 induces lung fibroblast and mononuclear cell migration. Am J Respir Cell Mol Biol 2009;41:179–88. [DOI] [PMC free article] [PubMed] [Google Scholar]
- 29.Vermot J, Fraulob V, Dolle P, Niederreither K. Expression of enzymes synthesizing (aldehyde dehydrogenase 1 and reinaldehyde dehydrogenase 2) and metabolizaing (Cyp26) retinoic acid in the mouse female reproductive system. Endocrinology 2000;141:3638–45. [DOI] [PubMed] [Google Scholar]
- 30.Pierzchalski K, Taylor RN, Nezhat C, Jones JW, Napoli JL, Yang GX et al. Retinoic Acid Biosynthesis Is Impaired in Human and Murine Endometriosis. Biology of Reproduction 2014;91. [DOI] [PMC free article] [PubMed] [Google Scholar]
- 31.Jiang YF, Kong SB, He B, Wang BY, Wang HB, Lu JH. Uterine Prx2 restrains decidual differentiation through inhibiting lipolysis in mice. Cell Tissue Res 2016;365:403–14. [DOI] [PubMed] [Google Scholar]
- 32.Tranguch S, Chakrabarty A, Guo Y, Wang HB, Dey SK. Maternal pentraxin 3 deficiency compromises implantation in mice. Biology of Reproduction 2007;77:425–32. [DOI] [PubMed] [Google Scholar]
- 33.Katagata Y, Takeda H, Ishizawa T, Hozumi Y, Kondo S. Occurrence and comparison of the expressed keratins in cultured human fibroblasts, endothelial cells and their sarcomas. J Dermatol Sci 2002;30:1–9. [DOI] [PubMed] [Google Scholar]
- 34.Muhl L, Genove G, Leptidis S, Liu J, He L, Mocci G et al. Single-cell analysis uncovers fibroblast heterogeneity and criteria for fibroblast and mural cell identification and discrimination. Nat Commun 2020;11:3953. [DOI] [PMC free article] [PubMed] [Google Scholar]
- 35.Hattori N, Carrino DA, Lauer ME, Vasanji A, Wylie JD, Nelson CM et al. Pericellular versican regulates the fibroblast-myofibroblast transition: a role for ADAMTS5 protease-mediated proteolysis. J Biol Chem 2011;286:34298–310. [DOI] [PMC free article] [PubMed] [Google Scholar]
- 36.Bansal R, Nakagawa S, Yazdani S, van Baarlen J, Venkatesh A, Koh AP et al. Integrin alpha 11 in the regulation of the myofibroblast phenotype: implications for fibrotic diseases. Exp Mol Med 2017;49:e396. [DOI] [PMC free article] [PubMed] [Google Scholar]
- 37.Vermeulen K, Van Bockstaele DR, Berneman ZN. The cell cycle: a review of regulation, deregulation and therapeutic targets in cancer. Cell Prolif 2003;36:131–49. [DOI] [PMC free article] [PubMed] [Google Scholar]
- 38.Kumagai A, Dunphy WG. Claspin, a novel protein required for the activation of Chk1 during a DNA replication checkpoint response in Xenopus egg extracts. Mol Cell 2000;6:839–49. [DOI] [PubMed] [Google Scholar]
- 39.Balakrishnan L, Bambara RA. Flap endonuclease 1. Annu Rev Biochem 2013;82:119–38. [DOI] [PMC free article] [PubMed] [Google Scholar]
- 40.Zukauskas A, Merley A, Li D, Ang LH, Sciuto TE, Salman S et al. TM4SF1: a tetraspanin-like protein necessary for nanopodia formation and endothelial cell migration. Angiogenesis 2011;14:345–54. [DOI] [PMC free article] [PubMed] [Google Scholar]
- 41.Guo P, Liu X, Zhang P, He Z, Li Z, Alini M et al. A single-cell transcriptome of mesenchymal stromal cells to fabricate bioactive hydroxyapatite materials for bone regeneration. Bioact Mater 2022;9:281–98. [DOI] [PMC free article] [PubMed] [Google Scholar]
- 42.Szwarc MM, Hai L, Gibbons WE, Mo Q, Lanz RB, DeMayo FJ et al. Early growth response 1 transcriptionally primes the human endometrial stromal cell for decidualization. J Steroid Biochem Mol Biol 2019;189:283–90. [DOI] [PMC free article] [PubMed] [Google Scholar]
- 43.Orimo A, Gupta PB, Sgroi DC, Arenzana-Seisdedos F, Delaunay T, Naeem R et al. Stromal fibroblasts present in invasive human breast carcinomas promote tumor growth and angiogenesis through elevated SDF-1/CXCL12 secretion. Cell 2005;121:335–48. [DOI] [PubMed] [Google Scholar]
- 44.Kimball SR. Eukaryotic initiation factor eIF2. Int J Biochem Cell Biol 1999;31:25–9. [DOI] [PubMed] [Google Scholar]
- 45.Baek MO, Song HI, Han JS, Yoon MS. Differential regulation of mTORC1 and mTORC2 is critical for 8-Br-cAMP-induced decidualization. Experimental and Molecular Medicine 2018;50. [DOI] [PMC free article] [PubMed] [Google Scholar]
- 46.Burnum KE, Hirota Y, Baker ES, Yoshie M, Ibrahim YM, Monroe ME et al. Uterine Deletion of Trp53 Compromises Antioxidant Responses in the Mouse Decidua. Endocrinology 2012;153:4568–79. [DOI] [PMC free article] [PubMed] [Google Scholar]
- 47.Ganeff C, Chatel G, Munaut C, Frankenne F, Foidart JM, Winkler R. The IGF system in in-vitro human decidualization. Mol Hum Reprod 2009;15:27–38. [DOI] [PubMed] [Google Scholar]
- 48.Zhang Q, Yan J. Update of Wnt signaling in implantation and decidualization. Reprod Med Biol 2016;15:95–105. [DOI] [PMC free article] [PubMed] [Google Scholar]
- 49.Bozorgmehr M, Gurung S, Darzi S, Nikoo S, Kazemnejad S, Zarnani AH et al. Endometrial and Menstrual Blood Mesenchymal Stem/Stromal Cells: Biological Properties and Clinical Application. Front Cell Dev Biol 2020;8. [DOI] [PMC free article] [PubMed] [Google Scholar]
- 50.Barragan F, Irwin JC, Balayan S, Erikson DW, Chen JC, Houshdaran S et al. Human Endometrial Fibroblasts Derived from Mesenchymal Progenitors Inherit Progesterone Resistance and Acquire an Inflammatory Phenotype in the Endometrial Niche in Endometriosis. Biol Reprod 2016;94:118. [DOI] [PMC free article] [PubMed] [Google Scholar]
- 51.Murakami K, Lee YH, Lucas ES, Chan YW, Durairaj RP, Takeda S et al. Decidualization Induces a Secretome Switch in Perivascular Niche Cells of the Human Endometrium. Endocrinology 2014;155:4542–53. [DOI] [PubMed] [Google Scholar]
- 52.Stuart T, Satija R. Integrative single-cell analysis. Nat Rev Genet 2019;20:257–72. [DOI] [PubMed] [Google Scholar]
- 53.Stone MR, O’Neill A, Lovering RM, Strong J, Resneck WG, Reed PW et al. Absence of keratin 19 in mice causes skeletal myopathy with mitochondrial and sarcolemmal reorganization. J Cell Sci 2007;120:3999–4008. [DOI] [PMC free article] [PubMed] [Google Scholar]
- 54.Cano CE, Hamidi T, Sandi MJ, Iovanna JL. Nupr1: the Swiss-knife of cancer. J Cell Physiol 2011;226:1439–43. [DOI] [PubMed] [Google Scholar]
- 55.Tomita H, Tanaka K, Tanaka T, Hara A. Aldehyde dehydrogenase 1A1 in stem cells and cancer. Oncotarget 2016;7:11018–32. [DOI] [PMC free article] [PubMed] [Google Scholar]
- 56.Habermann AC, Gutierrez AJ, Bui LT, Yahn SL, Winters NI, Calvi CL et al. Single-cell RNA sequencing reveals profibrotic roles of distinct epithelial and mesenchymal lineages in pulmonary fibrosis. Sci Adv 2020;6:eaba1972. [DOI] [PMC free article] [PubMed] [Google Scholar]
- 57.Shaulian E, Karin M. AP-1 in cell proliferation and survival. Oncogene 2001;20:2390–400. [DOI] [PubMed] [Google Scholar]
- 58.van den Beld AW, Carlson OD, Doyle ME, Rizopoulos D, Ferrucci L, van der Lely AJ et al. IGFBP-2 and aging: a 20-year longitudinal study on IGFBP-2, IGF-I, BMI, insulin sensitivity and mortality in an aging population. Eur J Endocrinol 2019;180:109–16. [DOI] [PMC free article] [PubMed] [Google Scholar]
- 59.Zhang X, Azhar G, Furr MC, Zhong Y, Wei JY. Model of functional cardiac aging: young adult mice with mild overexpression of serum response factor. Am J Physiol Regul Integr Comp Physiol 2003;285:R552–60. [DOI] [PubMed] [Google Scholar]
- 60.Rockey DC, Weymouth N, Shi Z. Smooth muscle alpha actin (Acta2) and myofibroblast function during hepatic wound healing. PLoS One 2013;8:e77166. [DOI] [PMC free article] [PubMed] [Google Scholar]
- 61.Wu A, Zhang L, Chen J, Li H, Yang P, Chen M et al. Limb-bud and Heart (LBH) mediates proliferation, fibroblast-to-myofibroblast transition and EMT-like processes in cardiac fibroblasts. Mol Cell Biochem 2021;476:2685–701. [DOI] [PubMed] [Google Scholar]
- 62.Bottazzi B, Inforzato A, Messa M, Barbagallo M, Magrini E, Garlanda C et al. The pentraxins PTX3 and SAP in innate immunity, regulation of inflammation and tissue remodelling. J Hepatol 2016;64:1416–27. [DOI] [PMC free article] [PubMed] [Google Scholar]
- 63.Amir G, Issakov J, Meller I, Sucher E, Peyser A, Cohen IJ et al. Expression of p53 gene product and cell proliferation marker Ki-67 in Ewing’s sarcoma: correlation with clinical outcome. Hum Pathol 2002;33:170–4. [DOI] [PubMed] [Google Scholar]
- 64.Tong Y, Eigler T. Transcriptional targets for pituitary tumor-transforming gene-1. J Mol Endocrinol 2009;43:179–85. [DOI] [PubMed] [Google Scholar]
- 65.Nalepa G, Barnholtz-Sloan J, Enzor R, Dey D, He Y, Gehlhausen JR et al. The tumor suppressor CDKN3 controls mitosis. J Cell Biol 2013;201:997–1012. [DOI] [PMC free article] [PubMed] [Google Scholar]
- 66.Strauss B, Harrison A, Coelho PA, Yata K, Zernicka-Goetz M, Pines J. Cyclin B1 is essential for mitosis in mouse embryos, and its nuclear export sets the time for mitosis. J Cell Biol 2018;217:179–93. [DOI] [PMC free article] [PubMed] [Google Scholar]
- 67.Shahid Z, Simpson B, Miao KH, Singh G. Genetics, Histone Code. In: StatPearls. Treasure Island (FL), 2021. [PubMed] [Google Scholar]
- 68.Koo SJ, Fernandez-Montalvan AE, Badock V, Ott CJ, Holton SJ, von Ahsen O et al. ATAD2 is an epigenetic reader of newly synthesized histone marks during DNA replication. Oncotarget 2016;7:70323–35. [DOI] [PMC free article] [PubMed] [Google Scholar]
- 69.Lee J, Kumagai A, Dunphy WG. Claspin, a Chk1-regulatory protein, monitors DNA replication on chromatin independently of RPA, ATR, and Rad17. Molecular Cell 2003;11:329–40. [DOI] [PubMed] [Google Scholar]
- 70.ShiYang XY, Miao YL, Cui ZK, Lu YJ, Zhou CY, Zhang Y et al. Casein kinase 2 modulates the spindle assembly checkpoint to orchestrate porcine oocyte meiotic progression. J Anim Sci Biotechno 2020;11. [DOI] [PMC free article] [PubMed] [Google Scholar]
- 71.Liao H, Winkfein RJ, Mack G, Rattner JB, Yen TJ. Cenp-F Is a Protein of the Nuclear Matrix That Assembles onto Kinetochores at Late G2 and Is Rapidly Degraded after Mitosis. J Cell Biol 1995;130:507–18. [DOI] [PMC free article] [PubMed] [Google Scholar]
- 72.Gai M, Bianchi FT, Vagnoni C, Verni F, Bonaccorsi S, Pasquero S et al. ASPM and CITK regulate spindle orientation by affecting the dynamics of astral microtubules. Embo Rep 2016;17:1396–409. [DOI] [PMC free article] [PubMed] [Google Scholar]
- 73.Dimova DK, Dyson NJ. The E2F transcriptional network: old acquaintances with new faces. Oncogene 2005;24:2810–26. [DOI] [PubMed] [Google Scholar]
- 74.Dang CV. MYC on the path to cancer. Cell 2012;149:22–35. [DOI] [PMC free article] [PubMed] [Google Scholar]
- 75.Zhao B, Guan H, Liu JQ, Zheng Z, Zhou Q, Zhang J et al. Hypoxia drives the transition of human dermal fibroblasts to a myofibroblast-like phenotype via the TGF-beta1/Smad3 pathway. Int J Mol Med 2017;39:153–9. [DOI] [PMC free article] [PubMed] [Google Scholar]
- 76.Steinbrech DS, Longaker MT, Mehrara BJ, Saadeh PB, Chin GS, Gerrets RP et al. Fibroblast response to hypoxia: the relationship between angiogenesis and matrix regulation. J Surg Res 1999;84:127–33. [DOI] [PubMed] [Google Scholar]
- 77.Wu B, Rockel JS, Lagares D, Kapoor M. Ephrins and Eph Receptor Signaling in Tissue Repair and Fibrosis. Curr Rheumatol Rep 2019;21:23. [DOI] [PMC free article] [PubMed] [Google Scholar]
- 78.Hwang JH, Park MI, Hwang YY, Yoo HJ, Mardon HJ. The characteristics of integrins expression in decidualized human endometrial stromal cell induced by 8-Br-cAMP in in vitro. Exp Mol Med 2002;34:194–200. [DOI] [PMC free article] [PubMed] [Google Scholar]
- 79.Lavogina D, Stepanjuk A, Peters M, Samuel K, Kasvandik S, Khatun M et al. Progesterone triggers Rho kinase-cofilin axis during in vitro and in vivo endometrial decidualization. Hum Reprod 2021;36:2230–48. [DOI] [PubMed] [Google Scholar]
- 80.Dunlevy JR, Couchman JR. Interleukin-8 induces motile behavior and loss of focal adhesions in primary fibroblasts. J Cell Sci 1995;108 ( Pt 1):311–21. [DOI] [PubMed] [Google Scholar]
- 81.Larsson-Callerfelt AK, Sjoland AA, Hallgren O, Bagher M, Thiman L, Lofdahl CG et al. VEGF induces ECM synthesis and fibroblast activity in human lung fibroblasts. Eur Respir J 2017;50. [Google Scholar]
- 82.Ito TK, Ishii G, Chiba H, Ochiai A. The VEGF angiogenic switch of. broblasts is regulated by MMP-7 from cancer cells. Oncogene 2007;26:7194–203. [DOI] [PubMed] [Google Scholar]
- 83.Lopez-Martinez S, Campo H, de Miguel-Gomez L, Faus A, Navarro AT, Diaz A et al. A Natural Xenogeneic Endometrial Extracellular Matrix Hydrogel Toward Improving Current Human in vitro Models and Future in vivo Applications. Front Bioeng Biotech 2021;9. [DOI] [PMC free article] [PubMed] [Google Scholar]
- 84.Schwarz RI. Collagen I and the fibroblast: high protein expression requires a new paradigm of post-transcriptional, feedback regulation. Biochem Biophys Rep 2015;3:38–44. [DOI] [PMC free article] [PubMed] [Google Scholar]
- 85.Bitterman PB, Rennard SI, Adelberg S, Crystal RG. Role of Fibronectin as a Growth-Factor for Fibroblasts. J Cell Biol 1983;97:1925–32. [DOI] [PMC free article] [PubMed] [Google Scholar]
- 86.Yap L, Tay HG, Nguyen MTX, Tjin MS, Tryggvason K. Laminins in Cellular Differentiation. Trends Cell Biol 2019;29:987–1000. [DOI] [PubMed] [Google Scholar]
- 87.Yazdani U, Terman JR. The semaphorins. Genome Biol 2006;7. [DOI] [PMC free article] [PubMed] [Google Scholar]
- 88.Jaffe EA, Ruggiero JT, Leung LLK, Doyle MJ, Mckeownlongo PJ, Mosher DF. Cultured Human-Fibroblasts Synthesize and Secrete Thrombospondin and Incorporate It into Extracellular-Matrix. P Natl Acad Sci-Biol 1983;80:998–1002. [DOI] [PMC free article] [PubMed] [Google Scholar]
- 89.Xie YL, Su N, Yang J, Tan QY, Huang S, Jin M et al. FGF/FGFR signaling in health and disease. Signal Transduct Tar 2020;5. [DOI] [PMC free article] [PubMed] [Google Scholar]
- 90.Lim HJ, Dey SK. HB-EGF: A unique mediator of embryo-uterine interactions during implantation. Exp Cell Res 2009;315:619–26. [DOI] [PMC free article] [PubMed] [Google Scholar]
- 91.Large MJ, Wetendorf M, Lanz RB, Hartig SM, Creighton CJ, Mancini MA et al. The epidermal growth factor receptor critically regulates endometrial function during early pregnancy. Plos Genet 2014;10:e1004451. [DOI] [PMC free article] [PubMed] [Google Scholar]
- 92.Yu HF, Tao R, Yang ZQ, Wang K, Yue ZP, Guo B. Ptn functions downstream of C/EBPbeta to mediate the effects of cAMP on uterine stromal cell differentiation through targeting Hand2 in response to progesterone. J Cell Physiol 2018;233:1612–26. [DOI] [PubMed] [Google Scholar]
- 93.Sorrelle N, Dominguez ATA, Brekken RA. From top to bottom: midkine and pleiotrophin as emerging players in immune regulation. J Leukocyte Biol 2017;102:277–86. [DOI] [PMC free article] [PubMed] [Google Scholar]
- 94.Tepekoy F, Akkoyunlu G, Demir R. The role of Wnt signaling members in the uterus and embryo during pre-implantation and implantation. J Assist Reprod Genet 2015;32:337–46. [DOI] [PMC free article] [PubMed] [Google Scholar]
- 95.McMellen A, Woodruff ER, Corr BR, Bitler BG, Moroney MR. Wnt Signaling in Gynecologic Malignancies. Int J Mol Sci 2020;21. [DOI] [PMC free article] [PubMed] [Google Scholar]
- 96.Chen HN, Wang DJ, Ren MY, Wang QL, Sui SJ. TWEAK/Fn14 promotes the proliferation and collagen synthesis of rat cardiac fibroblasts via the NF-kappa B pathway. Mol Biol Rep 2012;39:8231–41. [DOI] [PubMed] [Google Scholar]
- 97.Ladi E, Nichols JT, Ge W, Miyamoto A, Yao C, Yang LT et al. The divergent DSL ligand Dll3 does not activate Notch signaling but cell autonomously attenuates signaling induced by other DSL ligands. J Cell Biol 2005;170:983–92. [DOI] [PMC free article] [PubMed] [Google Scholar]
- 98.Xiu MX, Liu YM, Kuang BH. The oncogenic role of Jagged1/Notch signaling in cancer. Biomed Pharmacother 2020;129:110416. [DOI] [PubMed] [Google Scholar]
- 99.Meng XM, Nikolic-Paterson DJ, Lan HY. TGF-beta: the master regulator of fibrosis. Nat Rev Nephrol 2016;12:325–38. [DOI] [PubMed] [Google Scholar]
- 100.Pierce GF, Mustoe TA, Lingelbach J, Masakowski VR, Griffin GL, Senior RM et al. Platelet-derived growth factor and transforming growth factor-beta enhance tissue repair activities by unique mechanisms. J Cell Biol 1989;109:429–40. [DOI] [PMC free article] [PubMed] [Google Scholar]
- 101.Plun-Favreau H, Perret D, Diveu C, Froger J, Chevalier S, Lelievre E et al. Leukemia inhibitory factor (LIF), cardiotrophin-1, and oncostatin M share structural binding determinants in the immunoglobulin-like domain of LIF receptor. J Biol Chem 2003;278:27169–79. [DOI] [PubMed] [Google Scholar]
- 102.Freed DH, Cunnington RH, Dangerfield AL, Sutton JS, Dixon IM. Emerging evidence for the role of cardiotrophin-1 in cardiac repair in the infarcted heart. Cardiovasc Res 2005;65:782–92. [DOI] [PubMed] [Google Scholar]
- 103.Nishina T, Deguchi Y, Ohshima D, Takeda W, Ohtsuka M, Shichino S et al. Interleukin-11-expressing fibroblasts have a unique gene signature correlated with poor prognosis of colorectal cancer. Nat Commun 2021;12:2281. [DOI] [PMC free article] [PubMed] [Google Scholar]
- 104.Lynch MD, Watt FM. Fibroblast heterogeneity: implications for human disease. J Clin Invest 2018;128:26–35. [DOI] [PMC free article] [PubMed] [Google Scholar]
- 105.Lekic PC, Pender N, McCulloch CAG. Is fibroblast heterogeneity relevant to the health, diseases, and treatments of periodontal tissues? Crit Rev Oral Biol M 1997;8:253–68. [DOI] [PubMed] [Google Scholar]
- 106.Dzobo K, Dandara C. Architecture of Cancer-Associated Fibroblasts in Tumor Microenvironment: Mapping Their Origins, Heterogeneity, and Role in Cancer Therapy Resistance. Omics 2020;24:314–39. [DOI] [PubMed] [Google Scholar]
- 107.Queckborner S, von Grothusen C, Boggavarapu NR, Francis RM, Davies LC, Gemzell-Danielsson K. Stromal Heterogeneity in the Human Proliferative Endometrium-A Single-Cell RNA Sequencing Study. J Pers Med 2021;11:448. [DOI] [PMC free article] [PubMed] [Google Scholar]
- 108.Diniz-da-Costa M, Kong CS, Fishwick KJ, Rawlings T, Brighton PJ, Hawkes A et al. Characterization of highly proliferative decidual precursor cells during the window of implantation in human endometrium. Stem Cells 2021;39:1067–80. [DOI] [PubMed] [Google Scholar]
- 109.Rinehart CA, Haskill JS, Morris JS, Butler TD, Kaufman DG. Extended life span of human endometrial stromal cells transfected with cloned origin-defective, temperature-sensitive simian virus 40. J Virol 1991;65:1458–65. [DOI] [PMC free article] [PubMed] [Google Scholar]
- 110.Rinehart CA, Laundon CH, Mayben JP, Lyn-Cook BD, Kaufman DG. Conditional immortalization of human endometrial stromal cells with a temperature-sensitive simian virus 40. Carcinogenesis 1993;14:993–9. [DOI] [PubMed] [Google Scholar]
- 111.Sherr CJ, DePinho RA. Cellular senescence: mitotic clock or culture shock? Cell 2000;102:407–10. [DOI] [PubMed] [Google Scholar]
- 112.Yuhki M, Kajitani T, Mizuno T, Aoki Y, Maruyama T. Establishment of an immortalized human endometrial stromal cell line with functional responses to ovarian stimuli. Reprod Biol Endocrinol 2011;9:104. [DOI] [PMC free article] [PubMed] [Google Scholar]
- 113.Samalecos A, Reimann K, Wittmann S, Schulte HM, Brosens JJ, Bamberger AM et al. Characterization of a novel telomerase-immortalized human endometrial stromal cell line, St-T1b. Reprod Biol Endocrinol 2009;7:76. [DOI] [PMC free article] [PubMed] [Google Scholar]
- 114.Miyazaki K, Dyson MT, Coon VJ, Furukawa Y, Yilmaz BD, Maruyama T et al. Generation of Progesterone-Responsive Endometrial Stromal Fibroblasts from Human Induced Pluripotent Stem Cells: Role of the WNT/CTNNB1 Pathway. Stem Cell Reports 2018;11:1136–55. [DOI] [PMC free article] [PubMed] [Google Scholar]
- 115.Bateson P. Why are individuals so different from each other? Heredity 2015;115:285–92. [DOI] [PMC free article] [PubMed] [Google Scholar]
- 116.Stuart T, Butler A, Hoffman P, Hafemeister C, Papalexi E, Mauck WM et al. Comprehensive Integration of Single-Cell Data. Cell 2019;177:1888-+. [DOI] [PMC free article] [PubMed] [Google Scholar]
- 117.Amato CM, Yao HHC. Developmental and sexual dimorphic atlas of the prenatal mouse external genitalia at the-cell level. P Natl Acad Sci USA 2021;118. [DOI] [PMC free article] [PubMed] [Google Scholar]
- 118.Stadtmauer DJ, Wagner GP. Single-cell analysis of prostaglandin E2-induced human decidual cell in vitro differentiation: a minimal ancestral deciduogenic signaldagger. Biol Reprod 2022;106:155–72. [DOI] [PMC free article] [PubMed] [Google Scholar]
- 119.Lv B, Xu XY, Zhang XY, Qi LB, He W, Wang L et al. Activation of Blood Vessel Development in Endometrial Stromal Cells In Vitro Cocultured with Human Peri-Implantation Embryos Revealed by Single-Cell RNA-Seq. Life-Basel 2021;11. [DOI] [PMC free article] [PubMed] [Google Scholar]
- 120.Erikson DW, Barragan F, Piltonen TT, Chen JC, Balayan S, Irwin JC et al. Stromal fibroblasts from perimenopausal endometrium exhibit a different transcriptome than those from the premenopausal endometrium. Biol Reprod 2017;97:387–99. [DOI] [PMC free article] [PubMed] [Google Scholar]
- 121.Neumann E, Riepl B, Knedla A, Lefevre S, Tarner IH, Grifka J et al. Cell culture and passaging alters gene expression pattern and proliferation rate in rheumatoid arthritis synovial fibroblasts. Arthritis Res Ther 2010;12:R83. [DOI] [PMC free article] [PubMed] [Google Scholar]
- 122.Baranyi U, Winter B, Gugerell A, Hegedus B, Brostjan C, Laufer G et al. Primary Human Fibroblasts in Culture Switch to a Myofibroblast-Like Phenotype Independently of TGF Beta. Cells 2019;8. [DOI] [PMC free article] [PubMed] [Google Scholar]
- 123.Knapp AC, Franke WW. Spontaneous Losses of Control of Cytokeratin Gene-Expression in Transformed, Non-Epithelial Human-Cells Occurring at Different Levels of Regulation. Cell 1989;59:67–79. [DOI] [PubMed] [Google Scholar]
Associated Data
This section collects any data citations, data availability statements, or supplementary materials included in this article.
Supplementary Materials
Fig. S1. Gene expressions in the primary HESCs and THESC. A. The top marker genes in each cluster. From grey to blue, the expression levels were from low to high. B. The real-time PCR of the marker genes in the primary HESCs and THESC.
Fig. S2. Stem cell marker expression in the primary HESCs and THESC. A. The expression patterns of MCAM (red), PDGFRB (green), and co-expression (yellow). The percentages (%) of MCAM+/PDGFRB+ cells in each cluster from each sample. B. The expression patterns of SUSD2 (blue). The percentages (%) of SUSD2+ cells in each cluster from each sample. C. The percentages (%) of MCAM+/PDGFRB+/SUSD2+ cells in each cluster from each sample.
Fig. S3. Top marker genes in the primary HESCs and THESC after integration. From grey to red, the expression levels were from low to high.
Data Availability Statement
The raw and processed data for scRNA-Seq of the three primary HESCs and one THESC were uploaded to GEO as GSE195918.