

Abstract
Locus coeruleus (LC) is among the first brain areas to degenerate in Alzheimer’s disease and Parkinson’s disease; however, the underlying causes for the vulnerability of LC neurons are not well defined. Here we report a novel mechanism of degeneration of LC neurons caused by loss of the mitochondrial enzyme glutamate pyruvate transaminase 2 (GPT2). GPT2 Deficiency is a newly-recognized childhood neurometabolic disorder. The GPT2 enzyme regulates cell growth through replenishment of tricarboxylic acid (TCA) cycle intermediates and modulation of amino acid metabolism. In Gpt2-null mice, we observe an early loss of tyrosine hydroxylase (TH)-positive neurons in LC and reduced soma size at postnatal day 18. Gpt2-null LC shows selective positive Fluoro-Jade C staining. Neuron loss is accompanied by selective, prominent microgliosis and astrogliosis in LC. We observe reduced noradrenergic projections to and norepinephrine levels in hippocampus and spinal cord. Whole cell recordings in Gpt2-null LC slices show reduced soma size and abnormal action potentials with altered firing kinetics. Strikingly, we observe early decreases in phosphorylated S6 in Gpt2-null LC, preceding prominent p62 aggregation, increased LC3B-II to LC3B-I ratio, and neuronal loss. These data are consistent with a possible mechanism involving deficiency in protein synthesis and cell growth, associated subsequently with abnormal autophagy and neurodegeneration. As compared to the few genetic animal models with LC degeneration, loss of LC neurons in Gpt2-null mice is developmentally the earliest. Early neuron loss in LC in a model of human neurometabolic disease provides important clues regarding the metabolic vulnerability of LC and may lead to new therapeutic targets.
Keywords: Locus coeruleus, GPT2, Neurodegeneration, Neurometabolism, Neurogenetics, Selective vulnerability, Proteostasis, Autophagy
1. Introduction
Locus coeruleus (LC) is a major source of norepinephrine for the central nervous system, serving a multitude of functions including modulation of arousal, sleep-wake states, motor function, inflammatory response, and metabolism (Amaral and Sinnamon, 1977; Chandler et al., 2019; Dienel and Cruz, 2016; Fallon and Moore, 1978; Foote et al., 1983; Nestler et al., 1999; O’Donnell et al., 2012; Zhang et al., 2014a). LC dysfunction has been noted in psychiatric disorders, including anxiety, depression, attention-deficit hyperactivity disorder and addiction (Aston-Jones et al., 1999; Grueschow et al., 2021; Guitart et al., 1992; Klimek et al., 1997; Morris et al., 2020; Nestler and Aghajanian, 1997; Yamamoto et al., 2014). LC is also a particularly vulnerable brain area implicated in neurodegenerative diseases, including Alzheimer’s disease (AD) and Parkinson’s disease (PD), wherein LC is among the first brain regions to degenerate (Braak and Del Tredici, 2011; Grudzien et al., 2007; Oertel et al., 2019; Olivieri et al., 2019; Szot, 2012; Weinshenker, 2018). In these degenerative diseases, the underlying causes for LC vulnerability are not clear and pinpointing these mechanisms may pave the way for therapeutic interventions.
Genetic mutations offer a powerful and unbiased approach to identify disease mechanisms; however, there are very few known genetic mutations in animal models that lead to selective neurodegeneration in LC. Such mutations may reveal mechanisms of selective vulnerability of LC neurons. Previously reported mouse mutations with LC neurodegeneration include models of Parkinson’s disease: the Parkin-null (Von Coelln et al., 2004); the Pink1-null (Grant et al., 2015); and the Lrrk1/2 double knockout (Giaime et al., 2017). LC neuron loss is also seen in transgenic mouse models of Alzheimer’s disease (Tg2576) (Guerin et al., 2009) and Down Syndrome (Ts65Dn) (Lockrow et al., 2011). In all of these models, neuron loss generally occurs after six months of age. The only model reported to date that has early dysfunction of LC neurons, at two months of age, is the Mecp2-null mouse (Roux et al., 2010).
Here we report a novel mechanism of degeneration, gliosis, and neuron loss in LC in an animal model of Glutamate Pyruvate Transaminase 2 (GPT2) Deficiency. GPT2 is a metabolic enzyme in the mitochondria, catalyzing a reversible transfer of an amino group from glutamate to pyruvate producing alanine and alpha-ketoglutarate (Baytas et al., 2022; Ouyang et al., 2016). GPT2 is a major metabolic enzyme that links amino acid metabolism with the tricarboxylic acid (TCA) cycle. GPT2 supports cellular growth and energetics through replenishment of tricarboxylic acid (TCA) cycle intermediates (Hao et al., 2016; Kim et al., 2019; Schousboe et al., 2014). GPT2 also modulates levels of glutamate, the main excitatory neurotransmitter in the central nervous system (Hao et al., 2016; Kim et al., 2019; Schousboe et al., 2014). Importantly, human patients with recessive, loss-of-function mutations in GPT2 display postnatal microcephaly, intellectual disability, and motor abnormalities including spasticity and weakness in the lower limbs (spastic paraplegia) (Ouyang et al., 2019; Ouyang et al., 2016). Gpt2-null mice recapitulate the phenotype of postnatal microcephaly and motor dysfunction and prematurely die pre-weaning (Baytas et al., 2022; Ouyang et al., 2016); however, LC neurodegeneration in the Gpt2-null mouse has not been previously described. The degeneration and neuron loss in LC may provide important new clues regarding the underlying pathophysiology of GPT2 Deficiency. These findings may also pinpoint novel metabolic mechanisms involved in neuronal vulnerability of LC in more common neurodegenerative diseases.
2. Methods and materials
2.1. Ethics statement
All experiments involving mice were done in accordance with the National Institutes of Health Guide for the Care and Use of Laboratory Animals (Council, 2011) and approved by the Brown University Institutional Animal Care and Use Committee.
2.2. Animals
Gpt2-null animals were obtained from Knockout Mouse Project at University of California, Davis as described previously (Baytas et al., 2022; Ouyang et al., 2016). The background of all mice was C57BL/6J (the original C57BL/6N line was backcrossed to C57BL/6J for ten generations or greater) and both sexes were included in the study. The mice were maintained under a 12-h light/dark cycle (lights on at 7 am/off at 7 pm) throughout the year. Feed and water were given ad libitum.
2.3. Immunofluorescence
The brains and spinal cord from mice were dissected out after transcardial perfusion with 1× PBS then with 4% PFA. The tissues were cryoprotected by serially incubating in sucrose solutions of 10%, 20% and 30% overnight at 4 °C. The final solution was then changed to half by volume to sucrose/OCT (Optimal Cutting Temperature, FisherScientific, 23–730-571) and gently shaken for 1 h at 4 °C. The tissues were frozen in dry ice/methanol bath and stored at −80 °C until day of sectioning at the cryostat. The sections were cut at 30 μm thickness. The immunofluorescence protocol was as follows, in order: 3-min fixing with 4% PFA, 3 × 5-min 1× PBS washes, 2-h blocking in normal goat serum (NGS, Jackson ImmunoResearch, 005–000–121) with 1% (w/v) bovine serum albumin (FisherScientific, BP1600) and 0.4% TritonX-100 (Sigma-Aldrich, T8787) (Note: if a mouse-raised antibody was used, a 1-h incubation with 20 μg/mL AffiniPure Fab Fragment Goat Anti-Mouse IgG (H + L) (Jackson ImmunoResearch, 115–007–003) in blocking solution was performed), overnight incubation at 4 °C with primary antibody in blocking solution, 2 × 4-min washes with blocking solution, 3 × 4-min washes with 0.4% TritonX-100 in PBS, 2 h incubation with secondary antibody in blocking solution, 2 × 4-min washes with blocking solution, 3 × 4-min washes with 0.4% TritonX-100 in PBS, 5-min incubation in DAPI (Invitrogen, D1306) and 3 × 5-min washes with PBS. Coverslips were then mounted onto slides with Fluoromount G (SouthernBiotech, 0100–01). Primary antibodies used in this study: rabbit anti-catalase (abcam, ab16731, 1:400), rat anti-CD68 (Abd Serotec (Bio-rad), MCA1957, 1:100), chicken anti-GFAP (Aves, Gfap, 1:400), rabbit anti-IBA1 (Wako Chemicals, 019–19741, 1:500), rabbit anti-LC3B (Novus Biologicals, NB100–2220, 1:100), mouse anti-MTCO1 (abcam, ab14705, 1:400), mouse anti-norepinephrine transporter (NET, abcam, ab211463, 1:400), mouse anti-p62 (Novus Biologicals-Abnova, H00008878-M01, 1:400), rabbit anti-p62 (Proteintech, 18420–1-AP, 1:100), rabbit anti-pAMPKα (Thr172) (Cell Signaling, 2535, 1:200), rabbit anti-pS6 (Ser235/236) (Cell Signaling, 2211, 1:400), mouse anti-S6 (Santa Cruz, sc-74459, 1:200), rabbit tryptophan hydroxylase (TPH2) (Novus Biologicals, NB100–74555, 1:100), chicken anti-tyrosine hydroxylase (TH) (Aves, TH, 1:500), mouse anti-tyrosine hydroxylase (TH) (Millipore-Sigma, MAB318, 1:300), mouse anti-Ubiquitin (Santa Cruz, sc-8017, 1:50).
Secondary antibodies used in this study: Goat anti-chicken IgY (H + L) AlexaFluor 488 (Invitrogen, A-11039), goat anti-rabbit IgG (H + L) AlexaFluor 488 (Invitrogen, A-11034, 1:1000), goat anti-rabbit IgG (H + L) AlexaFluor 555 (Invitrogen, A-32732, 1:1000), goat anti-mouse IgG (H + L) AlexaFluor 594 (Invitrogen, A-11032, 1:1000), goat anti-chicken IgY (H + L) AlexaFluor 647 (Invitrogen, A-32933, 1:1000), goat anti-mouse IgG (H + L) AlexaFluor 647 (Invitrogen, A-21235, 1:1000), goat anti-rat IgG (H + L) AlexaFluor 647 (Invitrogen, A-21247, 1:1000).
For confocal microscopy on tissues, Olympus FV3000 confocal laser scanning microscope and FluoView software were used. Images were processed and analyzed with ImageJ. For the quantification in norepinephrine transporter staining, we measured the area covered by the fluorescence within the image via thresholding in ImageJ.
2.4. Quantification of tyrosine hydroxylase-positive (TH+) neurons in noradrenergic nuclei
2.4.1. Quantification of TH+ neurons in LC
Every serial coronal section (30 μm) starting approximately from the section where cerebral aqueduct first appears were stained with tyrosine hydroxylase (TH) to prevent loss of sections containing LC. The sections with LC proper, identified by the canonical boomerang shaped cluster of TH+ neurons, were selected for counting, two sections 30 μm apart were blindly counted for each animal.
2.4.2. Quantification of TH+ neurons in other noradrenergic nuclei
Work from Bucci and co-workers (Bucci et al., 2017) was used as reference points for identifying noradrenergic nuclei.
2.4.3. Medial Parabrachial nucleus (PB)
TH+ soma were found lateral to catecholaminergic cells surrounding the periaqueductal gray. The nucleus caudally merges with dorsal subcoeruleus and the LC proper emerges. The cells were counted in every other 30 μm section until there was no visible separation of PB and the dorsal subcoeruleus.
2.4.4. A7
TH+ soma were found lateral and anterior to dorsal subcoeruleus, medial to the middle cerebellar peduncle. The nucleus disappears when the LC proper appears. TH+ soma were counted in every other 30 μm section until the nucleus disappeared.
2.4.5. Dorsal subcoeruleus (SubD)
TH+ soma were found ventral to PB and have characteristically large TH+ puncta. The cells were counted until there was no visible separation of PB and the SubD.
2.4.6. Ventral subcoeruleus (SubV)
TH+ soma were found immediately ventral to SubD. The nucleus continues to appear ventral to LC proper.
2.4.7. A5
A5 appears on the same tissue sections as LC proper in the most ventral part of the coronal section, near the ventral spinocerebellar tract. TH+ soma were counted in every other 30 μm section until the nucleus disappeared.
2.4.8. A2
TH+ soma were found in the dorsal-most part of the coronal section, caudally after A5 disappears. The nucleus is lateral to Area postrema and spans almost the entire caudal medulla. The TH+ soma were counted in every other 30 μm section until the nucleus disappeared.
2.4.9. A1
A1 appears on the same sections as A2 in the ventrolateral-most part of the coronal section. The TH+ soma were counted in every other 30 μm section until the nucleus disappeared.
2.5. Fluoro-Jade C staining
The tissue cryostat sections were mounted on Superfrost Plus microscope slides (FisherScientific, 22–230-892) and dried at 50 °C for 30 min. The slides were immersed in the following solutions at room temperature in order: 0.2% NaOH in 80% ethanol for 5 min, 70% ethanol for 2 min, distilled water for 2 min, 0.06% potassium permanganate for 10 min, distilled water for 2 min, 0.0001% Fluoro-Jade C (Sigma-Aldrich, AG325) in 0.1% acetic acid for 10 min and 3 times distilled water for 1 min. The slides were dried at 50 °C for 10 min, immersed in xylene for 1 min and coverslipped with DPX Mounting medium (Millipore Sigma, 06522).
For double labeling, regular Immunofluorescence protocol as described above was performed first, followed by the Fluoro-Jade staining protocol.
2.6. Hematoxylin & Eosin (H&E) staining
10 μm sections obtained from paraffin embedded tissue were processed in the following steps in order: 2 × 10-min deparaffinization with xylene; 2 × 5-min rehydration in 100% ethanol; 2 min 95% ethanol and 2 min with 70% ethanol; wash in distilled water; 8 min stain in Mayer hematoxylin solution (Sigma-Aldrich, MHS1); 10 min rinse in warm running tap water; wash in distilled water for 30 s; dip slides in 95% ethanol 10 times; stain in Eosin Y solution (Sigma-Aldrich, HT110116) for 30 s; 95% ethanol 5 min; 100% ethanol 5 min each 2 times; clear in xylene 5 min each 2 times; mount with DPX Mounting medium (Millipore Sigma, 06522).
2.7. Norepinephrine Enzyme-Linked Immunosorbent Assay (ELISA)
Tissues were acutely dissected after cervical dislocation and weighed immediately before flash freezing in liquid nitrogen. The spinal cord and hippocampus tissues were homogenized in 300 μl ddH2O and cortex tissues in 500 μl ddH2O using a Kimble pestle and motor. The homogenate was spun at 5000 x g for 5 min and 200 μl was extracted from each sample. The norepinephrine in tissues was detected using Norepinephrine ELISA Kit (Abnova, KA1891) according to the manufacturer’s manual.
2.8. Brain slice preparation
Coronal slices (250 μm) were prepared from anesthetized mice. The brain was immediately extracted and placed in a vibratome (Leica, VT1000). Slices were cut in ice-cold oxygenated artificial cerebrospinal fluid (ACSF, in mM): 119 NaCl, 2.5 KCl, 2.5 CaCl2.2H2O, 1.0 NaH2PO4. H2O, 1.3 MgSO4.7H2O, 26.0 NaHCO3, 11 glucose. Slices were recovered in the same oxygenated ACSF solution at room temperature for 1 h and then transferred to a recording chamber where they were continuously submerged in ACSF at 28 °C with a flow rate of 1–2 ml/min.
2.9. Electrophysiological recordings
Locus coeruleus was recognized by its proximity to the fourth ventricle bordering lateral pons and all LC neurons had a characteristic pacemaking activity. Whole cell recordings were performed at current-clamp mode using a MultiClamp 700B Amplifier (Molecular Devices). Signals were low-pass filtered at 3 kHz and digitized at 10 kHz through Digidata 1550 digitizer (Molecular Devices). Patch electrodes were fabricated from borosilicate glass capillaries (Sutter Instruments) using a P-97 micropipette puller (Sutter Instruments). Patch pipettes had a resistance of 3–8 MΩ filled with patch pipette internal solution consisting of (in mM): 125.0 KCl, 2.8 NaCl, 10.0 HEPES, 2.0 MgCl2, 2.37 ATP-Mg, 0.32 GTP-Na, 0.6 EGTA, (pH 7.23–7.28, 270–278 mOsm). Capacitance and membrane resistance were calculated from voltage response to an injection of −100 pA. For constructing averaged action potential, action potentials within pacemaking activity in each cell were detected and averaged. All electrophysiological recordings were analyzed using Clampfit software.
2.10. Collection of locus coeruleus for western blotting using the NET-GFP mouse line
The germline Gpt2-null mouse line (Knockout Mouse Project at University of California, Davis, KOMP CSD24977) was crossed with a transgenic strain containing EGFP fused to a ribosomal protein expressed under the control of Slc6a2 (norepinephrine transporter) promoter (Jackson Laboratory Strain no. 031151, NET-GFP) (Mulvey et al., 2018). The background of all mice were C57BL/6J. At postnatal day 18, the mice were euthanized via cervical dislocation. The brain was extracted, a vertical cut was made using a razor blade near the anterior tip of the brain. The tissue was put in 1.5 ml Eppendorf tube, flash frozen in liquid nitrogen and stored at −80 °C until sample collection. The brains were placed in the cryostat and 150 μm thick sections of the hindbrain were mounted on slides. Using an inverted microscope with a 488 nm excitation filter cube, soma with GFP in the locus coeruleus were identified. The outer perimeter of LC was cut with an insulin syringe needle and LC was collected with forceps. The tissue samples were put in RIPA buffer for western blotting.
2.11. Western blotting
Locus coeruleus tissue samples were collected in 30 μl RIPA buffer (50 mM Tris, 0.15 M NaCl, 1 mM EDTA, 1% TritonX-100, 0.5% (w/v) sodium deoxycholate, 0.1% SDS) with 1× PhosStop (Roche, 04906845001) and 1× Protease Inhibitor Cocktail (PIC) (Roche, 05892970001). Protein samples (3–5 μg) were incubated in 1× NuPage Sample buffer (Invitrogen, NP0007) and 1× NuPage reducing agent (Invitrogen, NP0004) at 70 °C for 10 min and immediately placed on ice. For hippocampus and cortex tissue samples, the collection volume of the RIPA buffer was 250 μl and the protein amount loaded in the gel was 20 μg. The samples were run in NuPage 4–12% Bis-Tris gel (Invitrogen, NP0321) at 170 V until the dye front was at the end of the gel. The gel was transferred to a nitrocellulose membrane (Invitrogen, LC2000) in 1× FisherScientific Pierce Western Blot Transfer Buffer (35040) with 20% methanol at 30 V for 1 h. The blot was blocked with Li-Cor Blocking Buffer (Li-Cor Biosciences, 927–50000) for 30 min and permeabilized for 5 min in TBST (FisherScientific, BP2411) with 0.05% Tween20 (Sigma-Aldrich, P7949). The blot was incubated with primary anti-bodies in Li-Cor Intercept Antibody Diluent (Li-cor Biosciences, 927–65001) at 4 °C overnight. The blot was washed 3 × 5 min with TBST, incubated with secondary antibodies diluted in TBST for 1 h, washed with TBST and finally placed in TBS. The blot was imaged using the Li-Cor Odyssey CLx Imaging System (resolution: 84 μm, background subtraction: median) and analyzed using Image Studio Lite software. Protein amount in each sample was determined using the bicinchoninic acid (BCA) assay (ThermoScientific Pierce, PI23227).
Primary antibodies used in this study: mouse anti-Actin (Sigma, A3853, 1:2000, 42 kDa), rabbit anti-GFP (Cell Signaling, 2956, 1:1000, predicted molecular weight of the fused protein, EGFP-RPL10A: 52 kDa), rabbit anti-LC3B [Novus Biologicals, NB100–2220, 1:1000, 17 kDa (LC3B-II), 19 kDa (LC3B-I)], rabbit anti-p62 (Proteintech, 18420–1-AP, 1:1000, 62 kDa), rabbit anti-pAMPKα (Thr172) (Cell Signaling, 2535, 1:1000, 62 kDa), rabbit anti-pS6 (Ser235/236) (Cell Signaling, 2211, 1:1000, 32 kDa), mouse anti-S6 (Santa Cruz, sc-74459, 1:100, 32 kDa), mouse anti-tyrosine hydroxylase (TH) (Millipore-Sigma, MAB318, 1:1000, 60 kDa). Secondary antibodies used in this study: goat anti-rabbit IRDye 680RD (Li-Cor Biosciences, 926–68071, 1:20,000), goat anti-rabbit IRDye 800CW (Li-Cor Biosciences, 925–32211, 1:20,000), goat anti-mouse IRDye 680RD (Li-Cor Biosciences, 925–68070, 1:20,000), goat anti-mouse IRDye 800CW (Li-Cor Biosciences, 926–32210, 1:20,000).
2.12. MitoSOX staining in LC slices
Brain slices were collected at P18 and processed as described above in Brain slice preparation. After incubation of the slices in ACSF for 1 h, the slices were transferred to a solution of ACSF with 200 nM MitoSOX (Invitrogen, M36008) for 15 min. The slices were fixed in 4% PFA overnight at 4 °C and the next day embedded in 2% agarose and sectioned using a vibratome. 50 μm sections were stained for TH and p62 as described above in Immunofluorescence.
2.13. Statistical analysis
All data presented in the Figures and the Results section are presented as average ± standard error of the mean, unless otherwise noted. The statistical test for comparisons of two groups was unpaired two-tailed Student t-test unless otherwise noted. All statistical analyses were compiled using GraphPad Prism software. Mixed model analysis was done using JMP Pro 14.
3. Results
3.1. Neurodegeneration and gliosis in Gpt2-null locus coeruleus
We observed prominent microgliosis in the LC of Gpt2-null mice at postnatal day 18 (P18) (Fig. 1). Screening in sagittal sections of Gpt2-null mouse brains revealed selective microglial activation in a pontine region, later confirmed to be LC (Fig. 1, Fig. S1A). The microgliosis in Gpt2-null LC was already visible in images taken with a 2× objective, indicating the severity of microglial activation (Fig. 1B, left). The zoomed-in images of the LC showed clustered microglia with increased fluorescence intensity for Ionized calcium binding adaptor molecule 1 (IBA1), a marker for microglia (Fig. 1B, right). The microglia appeared more amoeboid in shape and clustered particularly around the ventral LC. Microglia were evenly distributed without enhanced IBA1 signal throughout the rest of the sagittal section of Gpt2-null mouse brain indicating that there was a selective microgliosis in LC after loss of GPT2. The microglial response in the ventral LC was visible in the coronal sections (Fig. 1C) and astrogliosis was also apparent (Fig. S2A). CD68, a lysosomal glycoprotein that is expressed at high levels in activated, phagocytic microglia (Neher et al., 2013), was also elevated in Gpt2-null LC, detected as enlarged immunofluorescent puncta (Fig. S3). Microgliosis and astrogliosis were absent with no cell loss in LC of Gpt2-null mice at P14 and P7 (Fig. S2B), suggesting that the damage in LC is apparent in postnatal development after P14 and by P18.
Fig. 1. GPT2 Deficiency leads to selective gliosis in locus coeruleus.
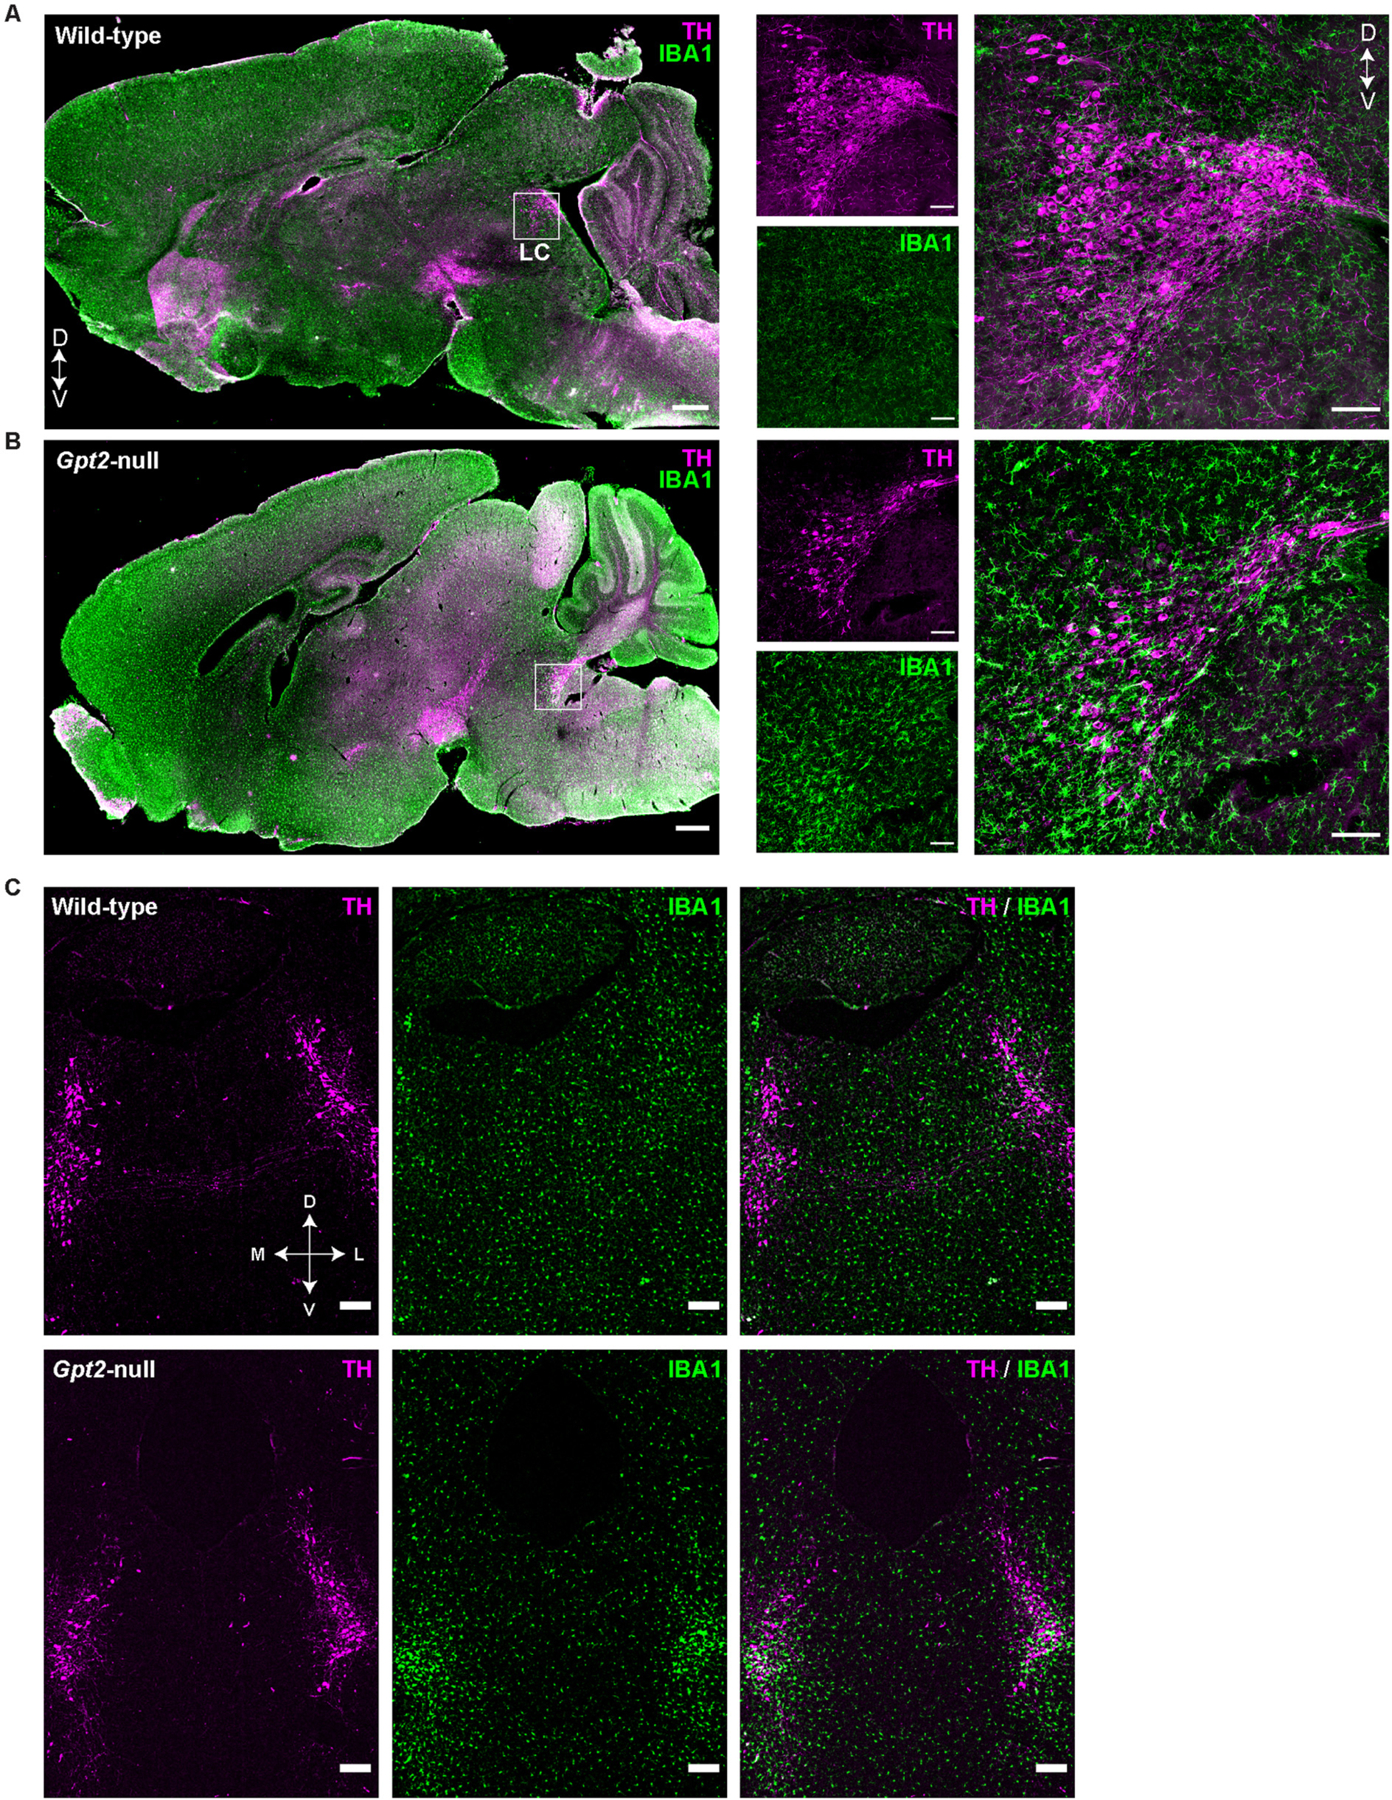
Selective microgliosis in Gpt2-null LC in sagittal brain sections at P18. Images of tyrosine hydroxylase (TH, magenta), IBA1 (green) staining in wild-type (A) and Gpt2-null (B) sagittal sections. D: Dorsal V: Ventral. Low magnification images taken with a 2× objective are shown on the left, (scale bar: 500 μm), high magnification images taken with a 60× objective are on the right (scale bar: 100 μm). C. Selective microgliosis in Gpt2-null LC in coronal brain sections at P18. Images of tyrosine hydroxylase (TH, magenta), IBA1 (green) staining in wild-type and Gpt2-null coronal sections containing LC. D: Dorsal, V: Ventral, M: Medial, L: Lateral. Scale bar: 200 μm.
There was significant degeneration and neuron loss in Gpt2-null LC. Given the strong microgliosis phenotype, we tested for loss of neurons in Gpt2-null LC (Fig. 2). We quantified the tyrosine hydroxylase (TH) + cell count in the LC proper and there was a significant loss in TH + cells in Gpt2-null LC (Fig. 2B). The soma size of the remaining Gpt2-null TH + cells in LC was also greatly reduced. Interestingly, while some of the Gpt2-null LC neurons showed very bright TH signal and others appeared dim, the overall TH relative fluorescence intensity was increased in the Gpt2-null LC. Consistent with microglial activation, average IBA1 relative fluorescence intensity in Gpt2-null LC was increased.
Fig. 2. Smaller TH+ neurons and loss of TH+ neurons in Gpt2-null LC at P18.
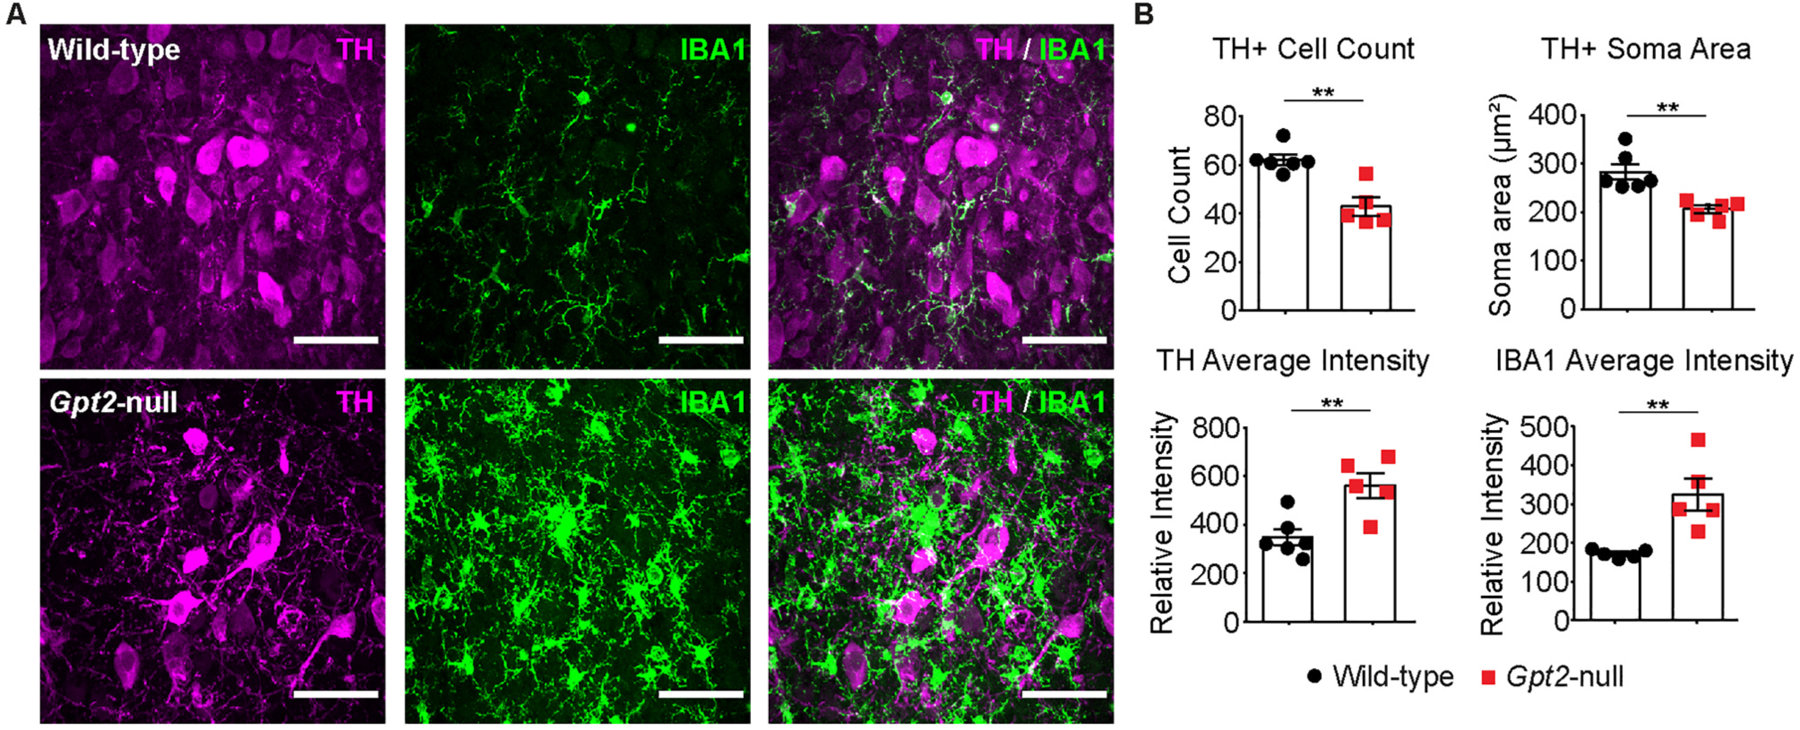
A. High magnification images of microgliosis in Gpt2-null ventral LC at P18. Tyrosine hydroxylase (TH, magenta) and IBA1 (green) staining in wild-type and Gpt2-null LC. Scale bar: 50 μm.
B. Quantification of TH+ cell count, TH+ soma area, TH average relative fluorescence intensity and IBA1 average relative fluorescence intensity. Each dot represents the average of staining in 3 sections per animal (wild-type: black, n = 5; Gpt2-null: red, n = 5 mice). The statistical test for comparisons of two groups was unpaired two-tailed Student t-test. **0.001 < P < 0.01.
To further investigate the pathology, we stained the LC with Fluoro-Jade C (FJC), a fluorescein derivative that is selectively taken up by degenerating neurons (Schmued et al., 1997). There were FJC+ cells in Gpt2-null LC, particularly on the ventral side (Fig. 3A). We also did hematoxylin and eosin (H&E) stains on Gpt2-null LC and observed hypereosinophilic and necrotic neurons, consistent with neurodegeneration (Fig. 3B).
Fig. 3. Degeneration of neurons in Gpt2-null LC.
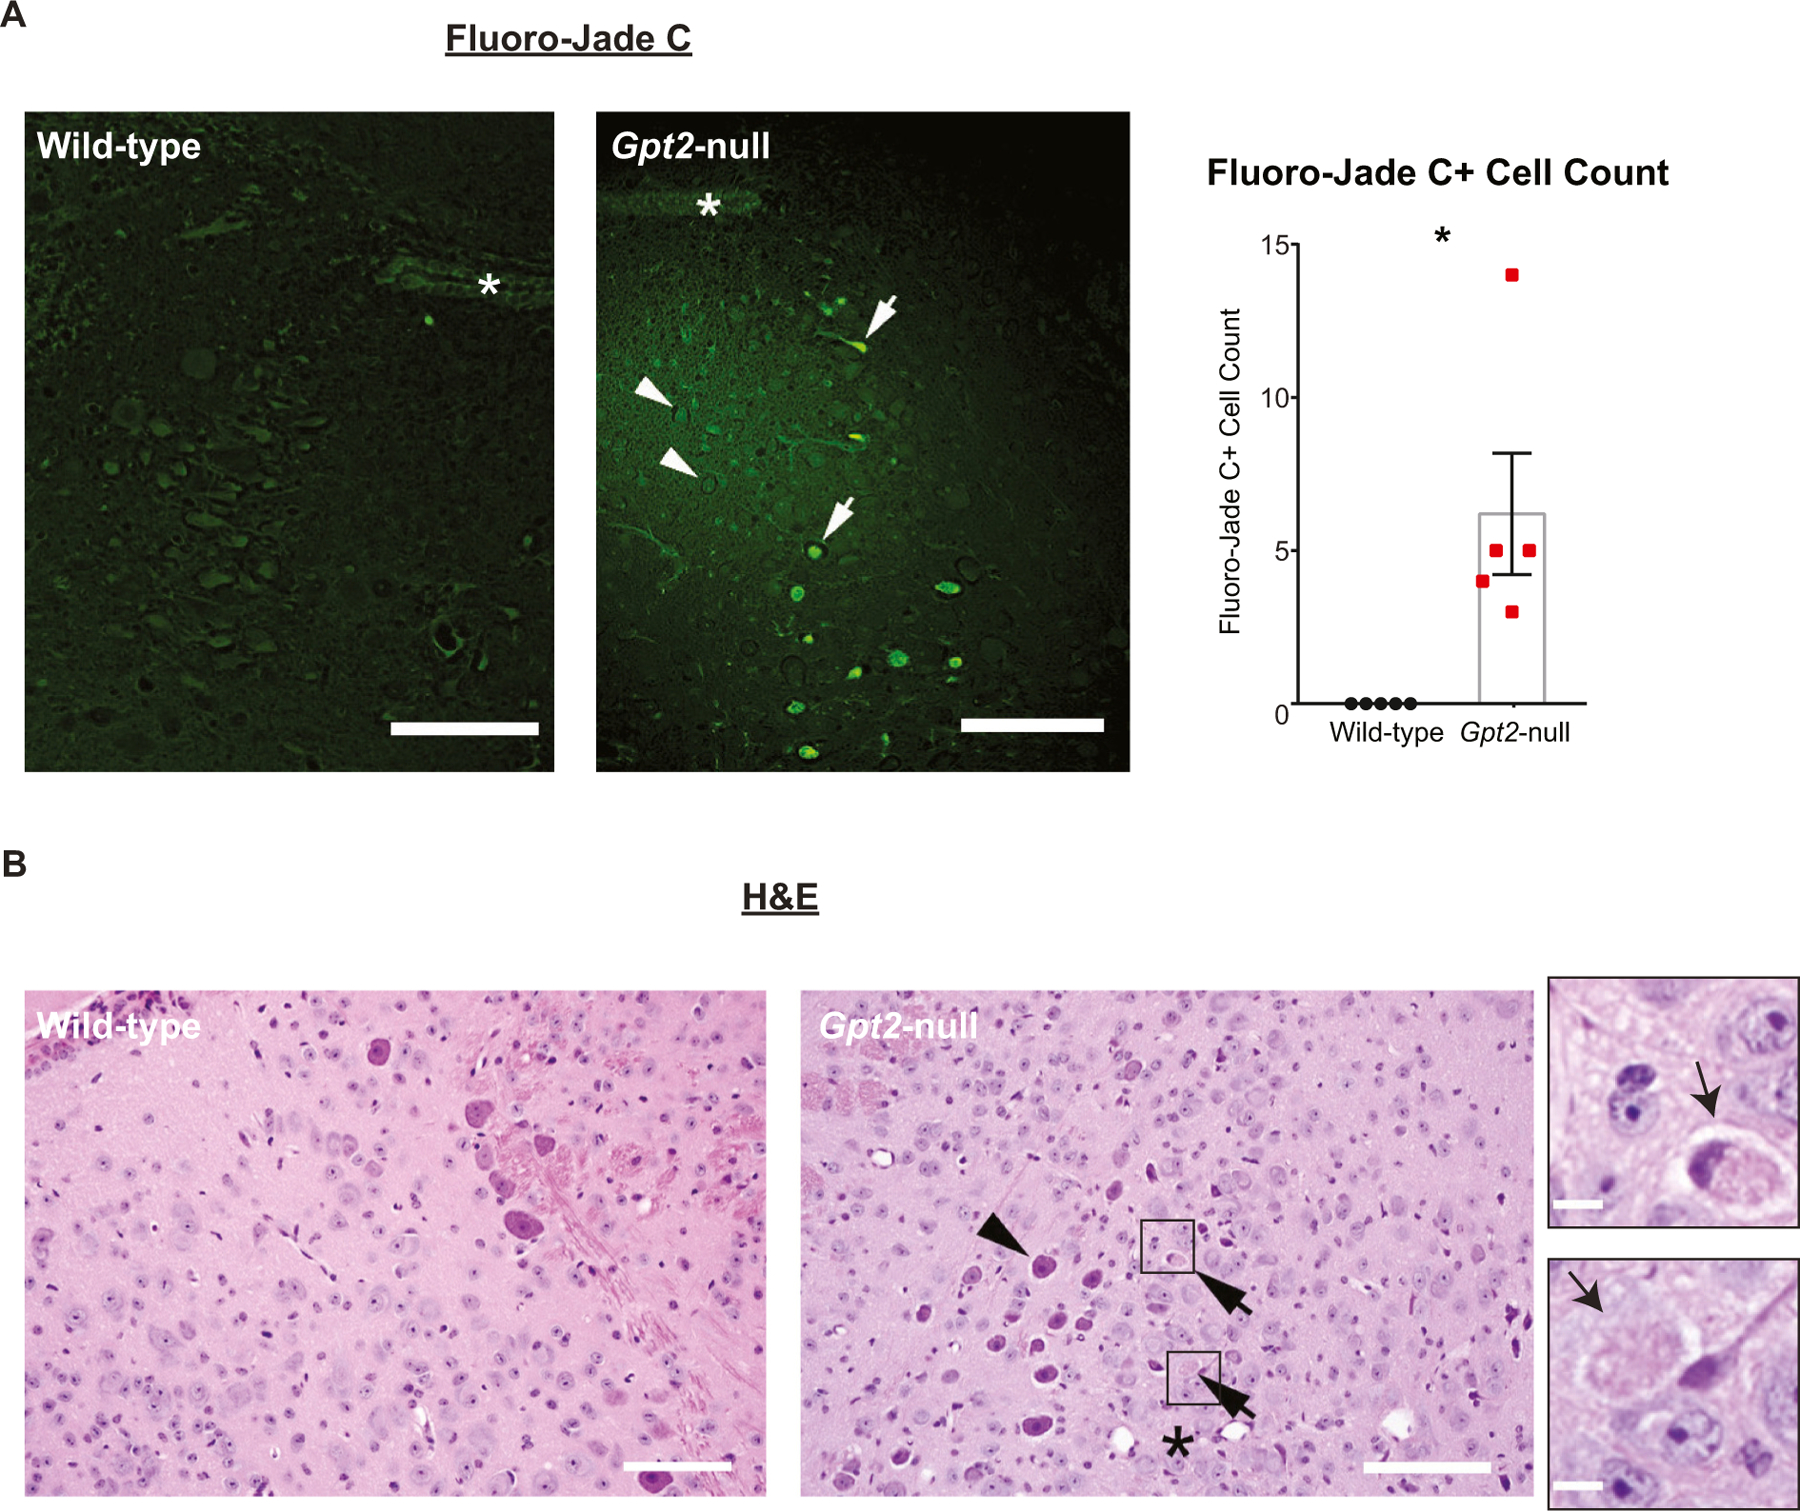
A. Fluoro-Jade C staining in wildtype and Gpt2-null LC at P18. Arrows point to degenerating cells and arrowheads point to normal cells. The asterisk denotes the 4th ventricle. Quantification of Fluoro-Jade C+ cells is given on the right. Each dot represents the average of counts in 2–3 sections per animal (wild-type: black, n = 5; Gpt2-null: red, n = 5 mice). *0.01 < P < 0.05. Scale bar: 100 μm.
B. Eosinophilic and necrotic neurons are present in Gpt2-null LC at P18. Images of hematoxylin and eosin (H&E) staining in wild-type and Gpt2-null LC (Scale bar: 100 μm). The top arrow points to a necrotic neuron and the bottom arrow points to a hypereosinophilic neuron in Gpt2-null LC, both visualized with higher magnification on the right (Scale bar: 5 μm). The arrowhead points to a healthy neuron of the motor nucleus of the trigeminal nerve bordering the LC laterally. The asterisk denotes the LC.
Microgliosis and cell loss were relatively specific to Gpt2-null LC. Absence of microgliosis was observed in coronal sections of other areas of the Gpt2-null brain, including various regions of cortex, hippocampus, thalamus, hypothalamus, midbrain, cerebellum and medulla (Fig. S1B–E). In addition, we did not observe any Fluoro-Jade C positive signals in the rest of Gpt2-null brain (Fig. S4). To investigate whether other neuron groups that share the common noradrenergic phenotype with LC neurons show any similar signs of cell loss or gliosis, we counted TH+ neurons in other noradrenergic nuclei; medial parabrachial nucleus (PB), A7, dorsal subcoeruleus (SubD), ventral subcoeruleus (SubV), A5, A2 and A1 (Figs. S5–10). We used a comprehensive study conducted by Bucci and co-workers (Bucci et al., 2017) as reference points for identifying noradrenergic nuclei. We did not find any TH+ neuron loss in noradrenergic nuclei except LC (quantified in Fig. S5A), however most of the nuclei had reduced soma size (Fig. S5B). Apart from LC, microgliosis and astrogliosis were present in SubD (Fig. S6&7) but absent in all other noradrenergic nuclei (Fig. S6–10). These results confirm selective vulnerability of LC with regard to cell loss, as determined by both cell counting and FJC staining.
In order to define the degeneration of LC in Gpt2-null mice further, we quantified noradrenergic projections by staining coronal mouse brain sections for norepinephrine transporter (NET) (Fig. 4). Coronal sections that contained hippocampus proper and surrounding cortical and subcortical areas showed overall reductions of NET staining in Gpt2-null mice (Fig. 4A). We quantified the noradrenergic innervation in the hippocampus CA1 region and the retrosplenial cortex (RSC) (Fig. 4B & C). The RSC was chosen due to the easy identification of its anatomical location with respect to the hippocampus proper. NET staining was decreased in Gpt2-null brain in the RSC (Fig. 4B), but was most strongly and significantly reduced in the Gpt2-null hippocampus CA1 area (Fig. 4C).
Fig. 4. Noradrenergic innervation in hippocampus and spinal cord is reduced in Gpt2-null mice.
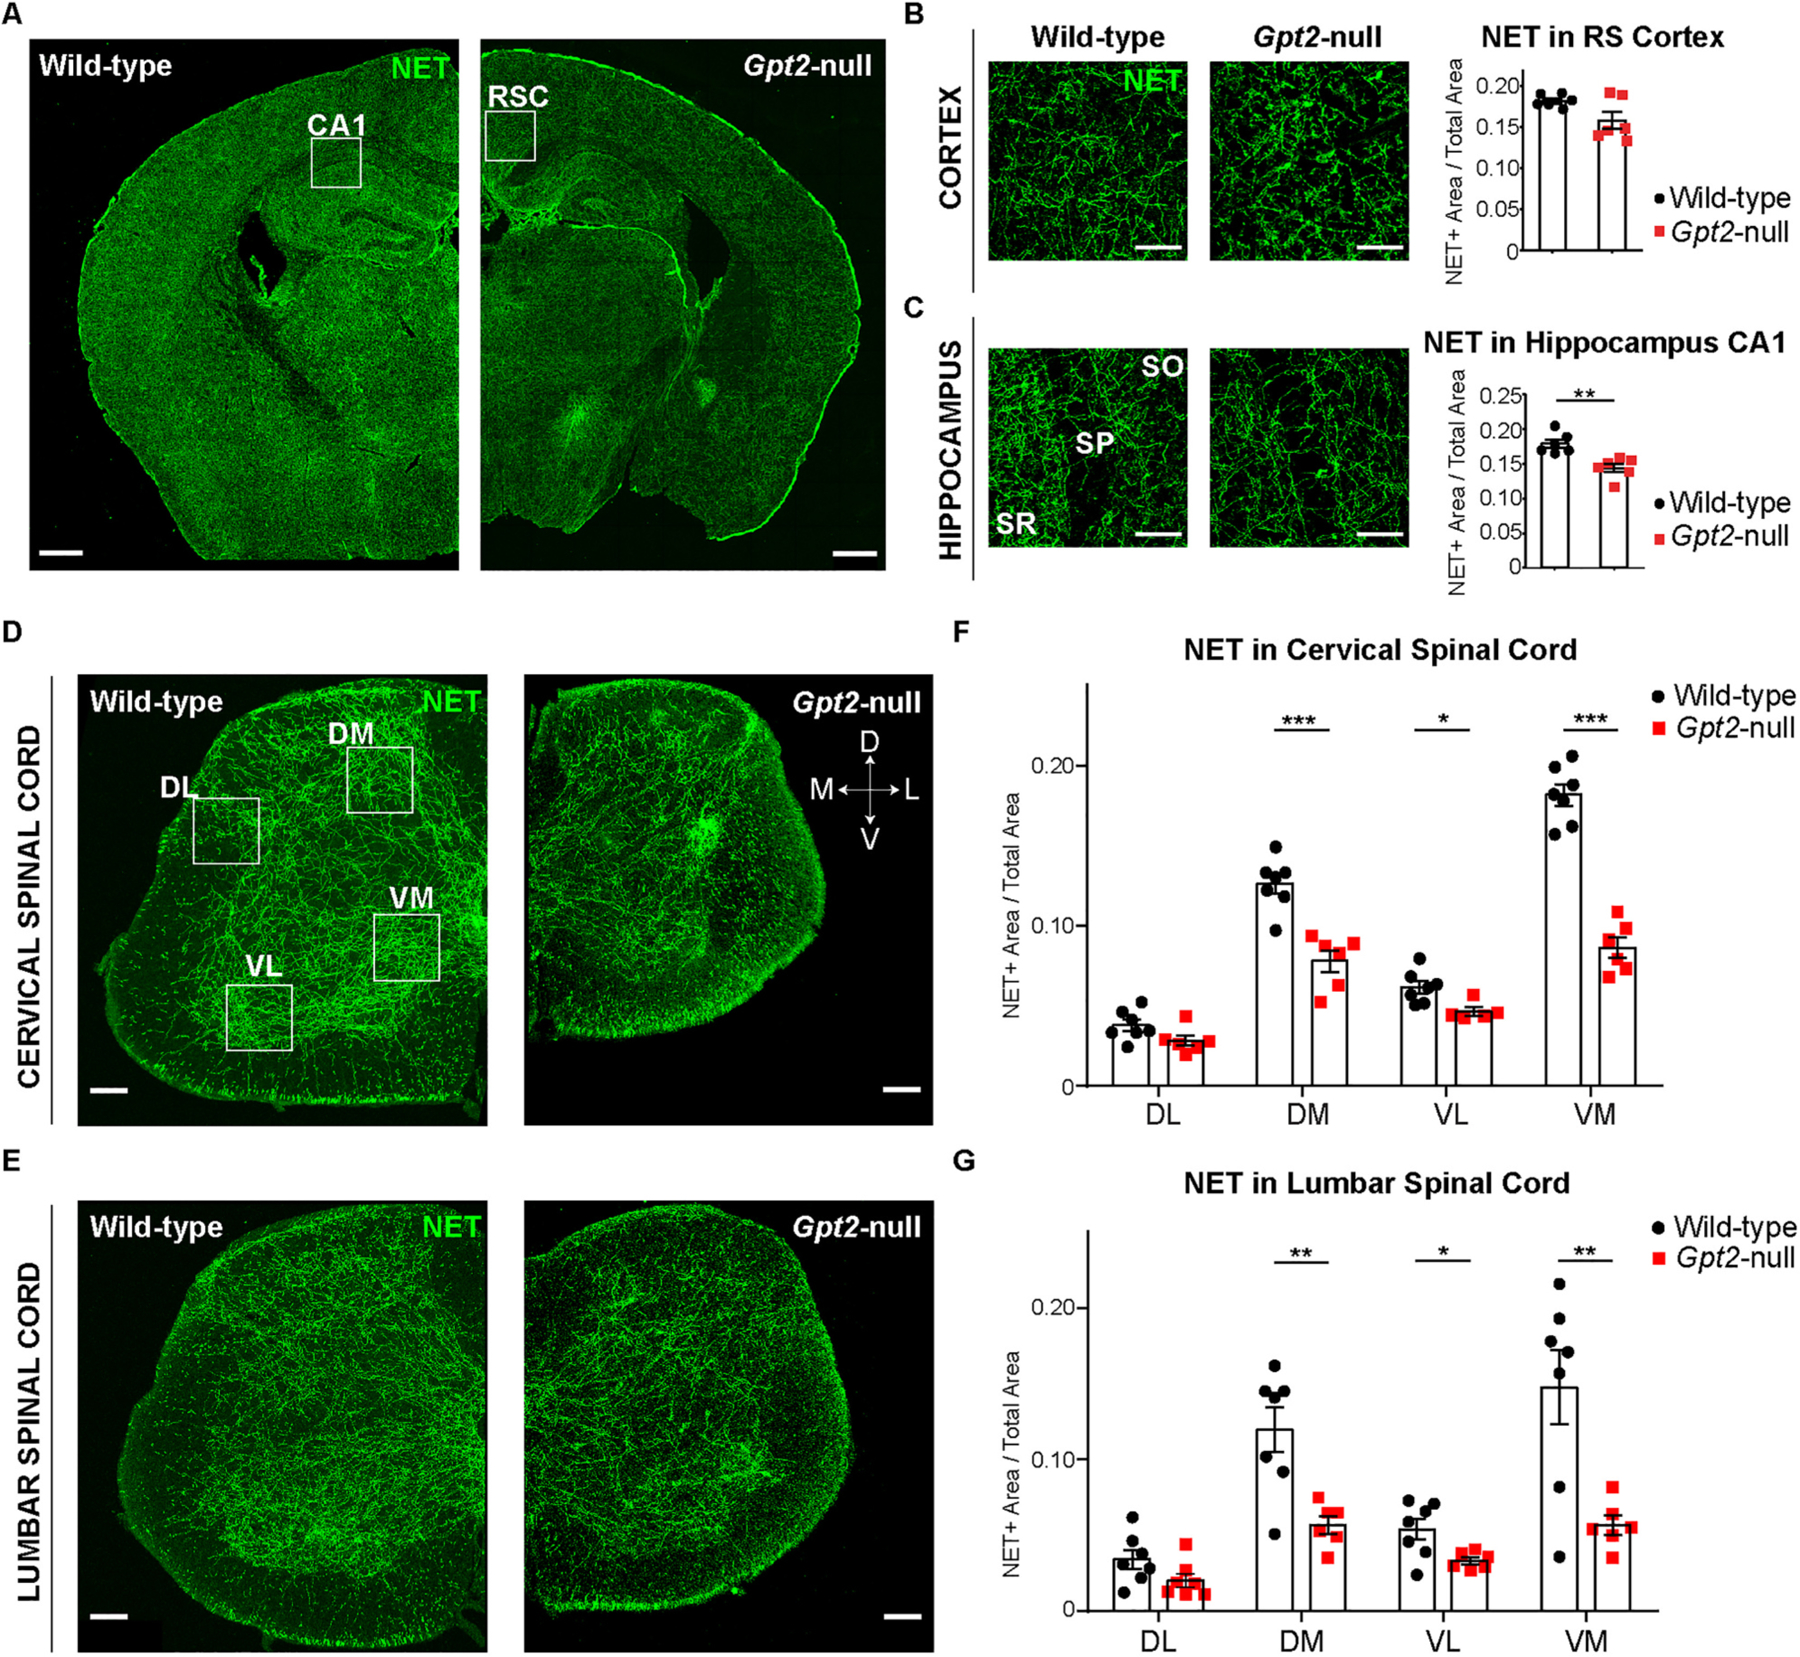
A. Noradrenergic innervation in hippocampus of Gpt2-null mice at P18 is reduced. Images of norepinephrine transporter (NET, green) staining in coronal sections containing hippocampus of wild-type and Gpt2-null mice (scale bar: 500 μm). The white boxes indicate example areas of CA1 of hippocampus and retrospenial cortex (RSC) where the staining was quantified.
B. Representative images of higher magnification for RSC and quantification of NET staining as a fraction of the total field of view. Each dot represents the average of staining in 2–3 sections per animal (wild-type: black, n = 6; Gpt2-null: red, n = 6 mice). Decrease in RSC demonstrates a statistical trend (two-tailed Student’s t-test, P = 0.0553). The statistical test for comparisons of two groups was unpaired two-tailed Student t-test. Scale bar: 100 μm.
C. Representative images of higher magnification for CA1 hippocampus and quantification of NET staining as a fraction of the total field of view. Each dot represents the average of staining in 2–3 sections per animal (wild-type: black, n = 6; Gpt2-null: red, n = 6 mice). SR: stratum radiatum, SP: stratum pyramidale, SO: stratum oriens. Scale bar: 100 μm. The statistical test for comparisons of two groups was unpaired two-tailed Student t-test. **0.001 < P < 0.01.
D. Images of norepinephrine transporter (NET, green) staining in coronal sections of cervical spinal cord of wild-type and Gpt2-null mice at P18. Each dot represents the average of staining in 3 sections per animal (wild-type: black, n = 7; Gpt2-null: red, n = 6 mice). The white boxes indicate example areas where the staining was quantified for cervical spinal cord and lumbar spinal cord (DL: dorsolateral, DM: dorsomedial, VL: ventrolateral, VM: ventromedial). Scale bar: 200 μm.
E. Images of NET (green) staining in coronal sections of lumbar spinal cord of wild-type and Gpt2-null mice at P18. Scale bar: 200 μm.
F. Quantification of NET staining in cervical spinal cord as a fraction of the total field of view. Each dot represents the average of staining in 3 sections per animal (wild-type: black, n = 7; Gpt2-null: red, n = 6 mice). The statistical test for comparisons of two groups was unpaired two-tailed Student t-test. Two-way ANOVA was performed to determine statistical effects of region and genotype (interaction: F (3,43) = 27.67, P < 0.0001; region factor: F (3,43) = 149.6, P < 0.0001; genotype factor: F (3,43) = 124.1, P < 0.0001). *0.01 < P < 0.05; ***P < 0.001.
G. Quantification of NET staining in lumbar spinal cord as a fraction of the total field of view. Each dot represents the average of staining in 3 sections per animal (wild-type: black, n = 7; Gpt2-null: red, n = 6 mice). The statistical test for comparisons of two groups was unpaired two-tailed Student t-test. Two-way ANOVA was performed to determine statistical effects of region and genotype (interaction: F (3,45) = 4.8, P = 0.0056; region factor: F (3,45) = 18.4, P < 0.0001; genotype factor: F (1,45) = 31.8, P < 0.0001). *0.01 < P < 0.05; **0.001 < P < 0.01; ***P < 0.001.
We found severe denervation of noradrenergic projections in Gpt2-null spinal cord. The degeneration of the ventral LC may be exacerbated due to its long-range projections to the spinal cord (Amaral and Sinnamon, 1977; Bruinstroop et al., 2012). We hypothesized that NET staining in the cervical and lumbar enlargements of Gpt2-null mice would be reduced. We examined the spinal cord in four anatomical areas for quantification: dorsolateral (DL), dorsomedial (DM), ventrolateral (VL) and ventromedial (VM) areas corresponding to approximately lateral spinal nucleus, laminae 3–4 of the dorsal horn, lamina 9 of the ventral horn and laminae 7–8 of the ventral horn, respectively (Fig. 4D). There were significant reductions of NET staining in both cervical and lumbar spinal cord of Gpt2-null mice (Fig. 4D–G). There were no significant differences of NET staining in the DL area of either cervical or lumbar enlargements albeit with trend toward a decrease in Gpt2-null mice (two-tailed Student’s t-test, cervical DL: P = 0.0754; lumbar DL: P = 0.0932).
Norepinephrine levels were profoundly decreased in Gpt2-null mice. We tested for alterations of norepinephrine levels in acutely dissected cortex, hippocampus, cervical and lumbar spinal cord of Gpt2-null mice by an enzyme-linked immunosorbent assay (ELISA) (Fig. 5). Consistent with the NET staining results from above (Fig. 4), there was a significant reduction in norepinephrine levels of Gpt2-null hippocampus, cervical and lumbar spinal cord but not in the cortex (Fig. 5A). Decreased norepinephrine levels were also observed at P14 but not at P7 (Fig. 5B&C), suggesting that the denervation occurs after P7 in postnatal development. Reduction in norepinephrine levels was particularly profound in the spinal cord, consistent with the observation of prominent microgliosis in ventral LC, which preferentially projects to the spinal cord (Bruinstroop et al., 2012; Schwarz and Luo, 2015). Overall, these data suggest a dramatic decrease in noradrenergic inputs into various regions of the central nervous system of Gpt2-null mice.
Fig. 5. Norepinephrine levels in hippocampus and spinal cord of Gpt2-null mice are reduced at P18 and P14 but unchanged at P7.
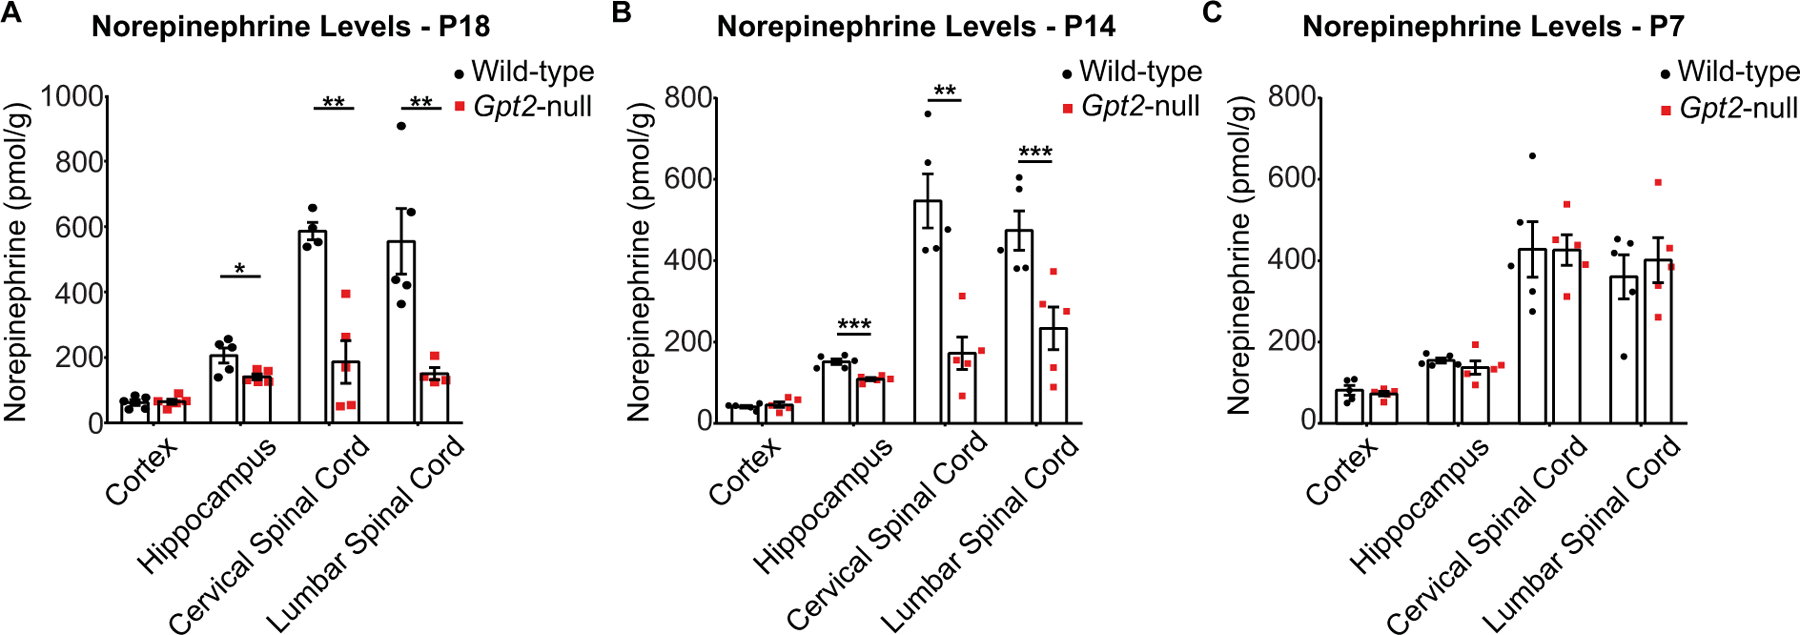
A. Quantification of norepinephrine levels per wet weight of tissue (pmol/g) in cortex, hippocampus, cervical and lumbar spinal cord of wild-type and Gpt2-null mice at P18 as detected by enzyme-linked immunosorbent assay (ELISA). Each dot represents the average of duplicates of a tissue sample from one animal (wild-type: black, n = 5; Gpt2-null: red, n = 5 mice). The statistical test for comparisons of two groups was unpaired two-tailed Student t-test. Two-way ANOVA was performed to determine statistical effects of region and genotype (interaction: F (3,30) = 10.50, P < 0.0001; region factor: F (3,30) = 20.98, P < 0.0001; genotype factor: F (1,30) = 42.24, P < 0.0001). *0.01 < P < 0.05; **0.001 < P < 0.01.
B. Quantification of norepinephrine levels per wet weight of tissue (pmol/g) in cortex, hippocampus, cervical and lumbar spinal cord of wild-type and Gpt2-null mice at P14. Each dot represents the average of duplicates of a tissue sample from one animal (wild-type: black, n = 5; Gpt2-null: red, n = 5 mice). The statistical test for comparisons of two groups was unpaired two-tailed Student t-test. Two-way ANOVA was performed to determine statistical effects of region and genotype (interaction: F (3,32) = 11.13, P < 0.0001; region factor: F (3,32) = 36.52, P < 0.0001; genotype factor: F (1,32) = 38.05, P < 0.0001). *0.01 < P < 0.05; **0.001 < P < 0.01.
C. Quantification of norepinephrine levels per wet weight of tissue (pmol/g) in cortex, hippocampus, cervical and lumbar spinal cord of wild-type and Gpt2-null mice at P7. Each dot represents the average of duplicates of a tissue sample from one animal (wild-type: black, n = 5; Gpt2-null: red, n = 5 mice). The statistical test for comparisons of two groups was unpaired two-tailed Student t-test. Two-way ANOVA was performed to determine statistical effects of region and genotype (interaction: F (3,32) = 0.22, P = 0.88; region factor: F (3,32) = 37.91, P < 0.0001; genotype factor: F (1,32) = 0.01, P = 0.90). *0.01 < P < 0.05; **0.001 < P < 0.01.
Given the LC neurodegeneration and decreased noradrenergic innervation in central nervous system, we hypothesized that performing whole-cell recordings in Gpt2-null LC neurons at P18 may capture alterations in electrophysiological properties associated with decreases in norepinephrine levels (Fig. 6). Gpt2-null LC neurons had lower capacitance, consistent with a decreased soma size (Fig. 6B), which corroborates our findings of decreased cell area as quantified by immunohistochemistry (Fig. 2B). This finding also fits with a proposed function of GPT2 in cell growth (Baytas et al., 2022). We also observe an increased membrane resistance (Fig. 6C). Interestingly, there was a slightly increased pacemaking frequency in the Gpt2-null LC neurons (Fig. 6D), as apparent in the representative recordings (Fig. 6A). This may be due to decreased autoinhibition caused by reduced norepinephrine levels and innervation (Fig. 5) (Hein et al., 1999). Averaged action potential was plotted to visualize abnormalities in the overall shape of the spikes (Fig. 6E). Several parameters were significantly changed. Peak amplitude of Gpt2-null LC neuron spikes was increased (Fig. 6F). Time to decay to half of the peak amplitude in Gpt2-null spikes was reduced, indicating faster action potential kinetics (Fig. 6G). Hyperpolarization peak amplitude of Gpt2-null LC neurons was also increased (Fig. 6H). Overall, the electrophysiological characterization of Gpt2-null LC neurons indicated intrinsic cell properties consistent with reduced neuron size and altered action potential parameters that may in part underlie the deficiencies in norepinephrine supply in Gpt2-null mice.
Fig. 6. Electrophysiological characterization of LC in Gpt2-null mice reveals changes in intrinsic cell properties and action potential parameters.
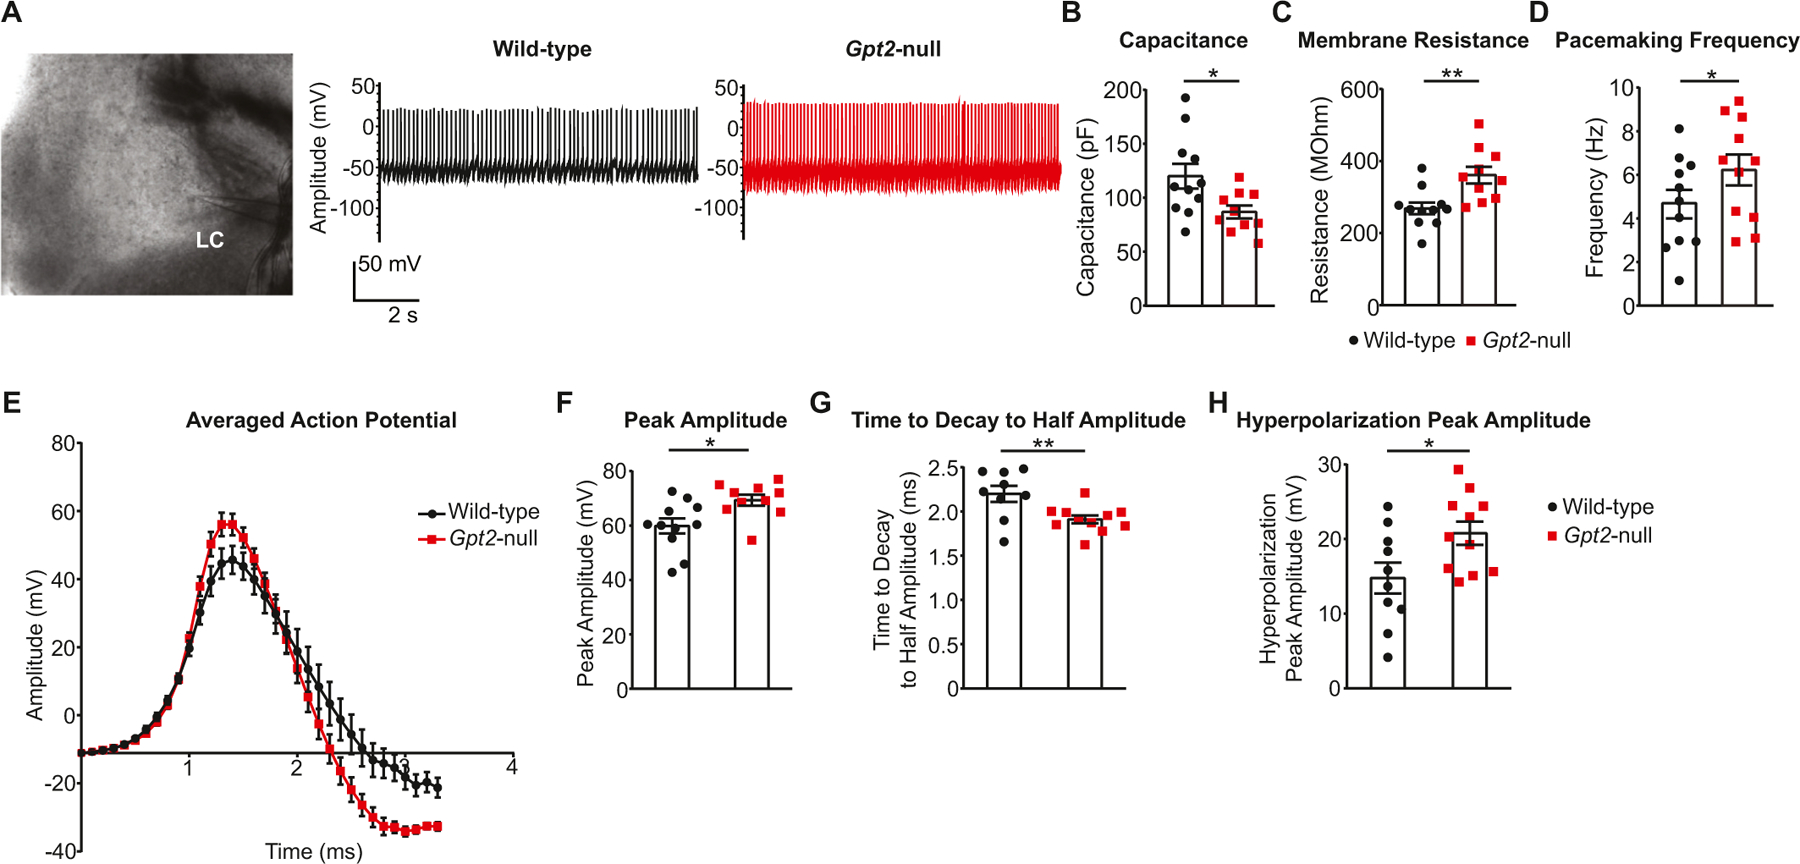
A. Representative image of LC with a patch pipette (left) and representative traces of recordings in LC neurons of wild-type (black) and Gpt2-null (red) mice at P18.
B. Capacitance of Gpt2-null LC neurons at P18 is reduced. Each dot represents a different cell (wild-type: black, n = 11 cells, n = 4 mice; Gpt2-null: red, n = 10 cells, n = 4 mice). The statistical test for comparisons of two groups was unpaired two-tailed Student t-test. *0.01 < P < 0.05.
C. Membrane resistance of Gpt2-null LC neurons at P18 is increased. Each dot represents a different cell (wild-type: black, n = 11 cells, n = 4 mice; Gpt2-null: red, n = 10 cells, n = 4 mice). The statistical test for comparisons of two groups was unpaired two-tailed Student t-test. ***0.001 < P < 0.01.
D. Pacemaking frequency of Gpt2-null LC neurons at P18 is slightly increased. Each dot represents a different cell (wild-type: black, n = 11 cells, n = 4 mice; Gpt2-null: red, n = 11 cells, n = 4 mice). Mixed model analysis was employed here with fixed effects: genotype, presence of hyperpolarization in resting membrane potential toward the end of recording and whether the pacemaking activity was retained throughout the recording, random effects: day of recording. *P = 0.0318.
E. Shape of the averaged action potential from the pacemaking activity of wild-type (black, n = 11 cells, n = 4 mice) and Gpt2-null (red, n = 11 cells, n = 4 mice) LC neurons at P18.
F. Peak amplitude of Gpt2-null LC neuron action potential at P18 is increased. Each dot represents a different cell (wild-type: black, n = 11 cells, n = 4 mice; Gpt2-null: red, n = 10 cells, n = 4 mice). The statistical test for comparisons of two groups was unpaired two-tailed Student t-test. *0.01 < P < 0.05.
G. Time to decay to half amplitude of Gpt2-null LC neuron action potential at P18 is decreased. Each dot represents a different cell (wild-type: black, n = 9 cells, n = 4 mice; Gpt2-null: red, n = 11 cells, n = 4 mice). The statistical test for comparisons of two groups was unpaired two-tailed Student t-test. **0.001 < P < 0.01.
H. Hyperpolarization peak amplitude of Gpt2-null LC neuron action potential at P18 is increased. Each dot represents a different cell (wild-type: black, n = 10 cells, n = 4 mice; Gpt2-null: red, n = 11 cells, n = 4 mice). The statistical test for comparisons of two groups was unpaired two-tailed Student t-test. *0.01 < P < 0.05.
3.2. Prominent p62 aggregation in Gpt2-null locus coeruleus neurons
Following characterization of the neurodegeneration in Gpt2-null LC, we set out to investigate potential mechanisms underlying this vulnerability in LC. GPT2 is an equilibrium enzyme that modulates levels of its substrates such that the concentrations of the two sides are balanced (Krebs, 1953). Given the influence of GPT2 over alanine and glutamate levels as well as other metabolites involved in amino acid metabolism in the mouse brain (Baytas et al., 2022), we hypothesized that GPT2 loss may lead to dysregulation in protein homeostasis (proteostasis) such that protein degradative and synthetic pathways are altered. We first tested for aggregation of p62 (Sequestosome 1, SQSTM1), a well-studied receptor of autophagy (Bartlett et al., 2011; Deng et al., 2017; Komatsu et al., 2007; Seibenhener et al., 2004; Vadlamudi et al., 1996) that has been shown to aggregate in neurons of various models of neurodegenerative diseases including Alzheimer’s disease (Kuusisto et al., 2002; Zatloukal et al., 2002), Parkinson’s (Kuusisto et al., 2002; Nakaso et al., 2004), Huntington’s disease (Bjorkoy et al., 2005; Nagaoka et al., 2004) and amyotrophic lateral sclerosis (ALS) (Gal et al., 2007). We observe prominent p62 aggregation in Gpt2-null LC at P18. Approximately 20% of TH+ neurons in a given section of LC had p62 aggregates (Fig. 7A & C). Both dorsal and ventral Gpt2-null LC are affected with p62 aggregation (Fig. 7A&B) unlike the microgliosis and astrogliosis which appeared more pronounced in the ventral LC (Figs. 1, 2 & S2A). As noted above in Fig. 2, we again observed an unequal TH intensity within the same coronal section of neurons in Gpt2-null LC. Some neurons appeared comparatively very bright and some very dim for TH (Fig. 7A). Paired analysis of TH intensity obtained from TH+ soma revealed that Gpt2-null LC neurons with p62 aggregates had lower TH intensity (Fig. 7D). To characterize this increase in variability of intensities across neurons, we calculated a measure of variability named “coefficient of variation” of fluorescence intensity (σ / μ; standard deviation divided by the mean of fluorescence intensities). Increased coefficient of variation for a particular signal of protein may indicate that levels of that protein are affected differentially across cells; thereby pinpointing a dysregulation of level of the protein of interest. We observed increased coefficient of variation for TH and p62 intensities in Gpt2-null LC compared to their wild-type controls (Fig. S11A & B), mathematically identifying the variability observed in the staining. p62 aggregation did not occur in Gpt2-null LC at P14 (Fig. S11C), suggesting that both gliosis (Fig. 1 & S2B) and p62 aggregates appear later in postnatal development. In addition, Gpt2-null LC neurons with p62 aggregates showed positive Fluoro-Jade C signal (Fig. S12), indicating that p62 aggregation may occur simultaneously with neurodegeneration.
Fig. 7. p62 aggregates in Gpt2-null LC.
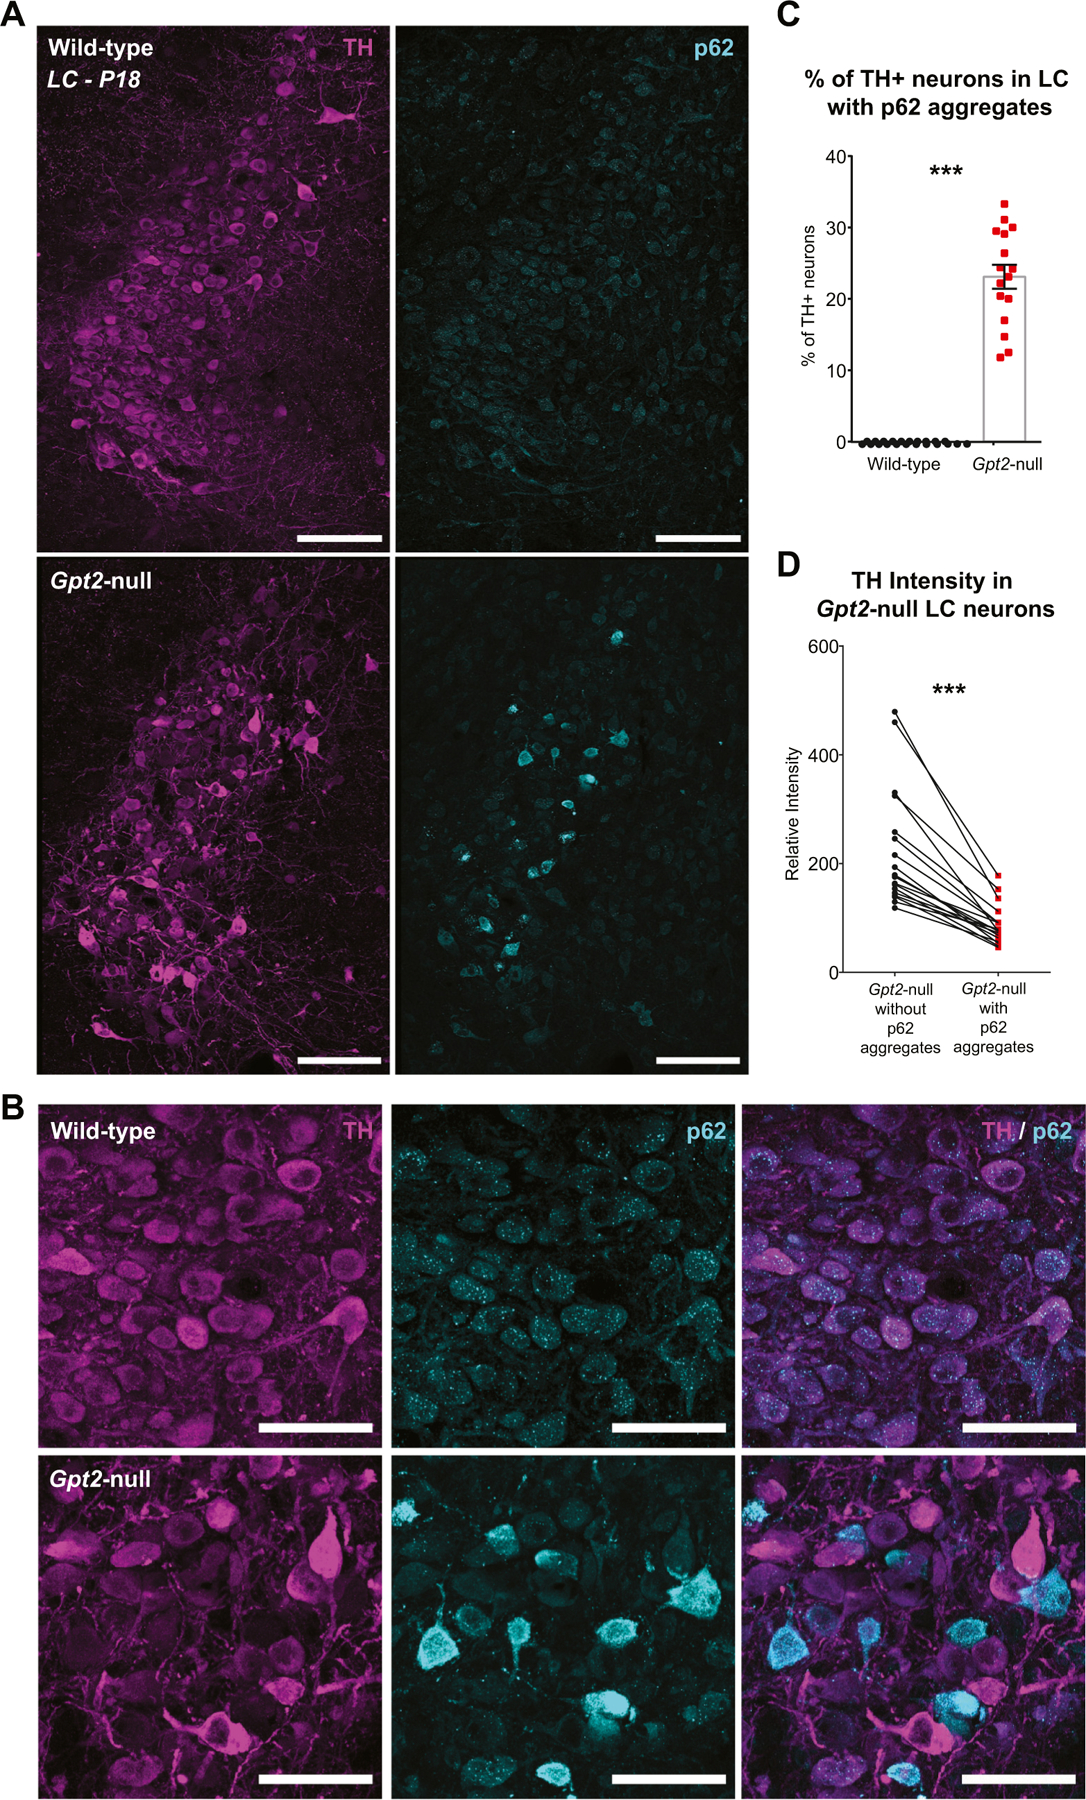
A. Representative images of TH (magenta) and p62 (cyan) staining in wild-type and Gpt2-null LC at P18. Scale bar: 100 μm.
B. Higher magnification images of tissue sections provided in (A) showing TH (magenta) and p62 (cyan) staining in wild-type and Gpt2-null LC at P18. Note that the TH intensity is lower in Gpt2-null LC neurons with p62 aggregates and the remaining Gpt2-null LC neurons without p62 aggregates may have increased TH intensity. Scale bar: 50 μm.
C. Approximately 20% of TH+ neurons have p62 aggregates in Gpt2-null LC. Each dot represents a different coronal section of LC (wild-type: black, n = 18 sections, n = 7 mice; Gpt2-null: red, n = 16 sections, n = 7 mice). The statistical test for comparisons of two groups was unpaired two-tailed Student t-test. ***P < 0.0001.
D. TH intensity is reduced in Gpt2-null LC neurons with p62 aggregates. Each dot represents a different coronal section of LC (n = 16 sections, n = 7 mice). The statistical test for comparisons of two groups was paired Student t-test.
We next tested for changes in levels of LC3B, a microtubule associated protein that helps formation of autophagosome and phagophores and one of the key mediators of autophagy (Johansen and Lamark, 2011; Kabeya et al., 2000). Gpt2-null LC at P18 did not show any overt change in the LC3B intensity (Fig. S13A), however there was a slight reduction in LC3B intensity in Gpt2-null LC neurons with p62 aggregates (Fig. S13B) as well as an increased coefficient of variation in Gpt2-null LC sections (Fig. S13C). In addition, we tested for increases in ubiquitination of proteins or co-localization of ubiquitin with p62 aggregates in Gpt2-null LC at P18, however we could not find any visible differences between wild-type and Gpt2-null LC (Fig. S14A & B).
p62 aggregation is not specific to Gpt2-null LC neurons and occurs in serotonergic neurons of raphe nuclei and other select neurons in the Gpt2-null midbrain. We assessed the specificity of p62 aggregation in LC by examining p62 levels in the rest of the Gpt2-null brain at P18. Among the noradrenergic nuclei, both medial parabrachial nucleus (PB) and dorsal subcoeruleus (SubD) had p62 aggregates (Fig. S15B & C). p62 levels were normal in Gpt2-null ventral subcoeruleus (SubV), A7, A5, A2 and A1 (Fig. S15D–F & S16). We screened the rest of Gpt2-null brain for any p62 aggregates by examining every 10th 30 μm section. p62 aggregates appeared in dorsal and central raphe (Fig. S17), that co-localized with tryptophan hydroxylase (TPH2) (Fig. S18). There was no overt prominent gliosis in the raphe nuclei, however we did observe some amoeboid-shape microglia around Gpt2-null serotonergic neurons with p62 aggregates (Fig. S17B). Brain areas likely to be the red nucleus and midbrain reticular nucleus also showed p62 aggregates (Fig. S19) but no gliosis. We could not find any p62 aggregates in the rest of the forebrain areas including primary motor area, primary somatosensory area, caudoputamen, hippocampus, thalamus, amygdala and hypothalamus (Fig. S20). As norepinephrine belongs to catecholamines, we specifically assessed gliosis and p62 aggregation in dopaminergic neurons of the substantia nigra (SN) and ventral tegmental area (VTA). Gpt2-null dopaminergic neurons in SN and VTA were free of gliosis and p62 aggregation (Fig. S21). These data indicate that p62 aggregation occurs not only in LC neurons but also in select neurons of the midbrain, however prominent microgliosis and astrogliosis as well as neuronal Fluoro-Jade C signal are specific to Gpt2-null LC at the stages examined. p62 has been proposed to have redox sensitivity that reacts to oxidative stress leading to pathological degradation of proteins in cells (Carroll et al., 2018). Glutamate, one enzymatic substrate of GPT2, is a precursor of glutathione, a major anti-oxidant in cells, and glutathione levels in Gpt2-null whole brain and hippocampus were previously found to be decreased (Baytas et al., 2022; Ouyang et al., 2016). We hypothesized that if oxidative stress is elevated in Gpt2-null LC neurons, oxidized p62 may undergo a conformational change and lead to aggregation. We sought to test this by labeling mitochondria-specific superoxide anion in acutely dissected mouse brain slices that contain LC via MitoSOX incubation (Johnson-Cadwell et al., 2007; Santini et al., 2015). Mitochondrial localization of MitoSOX was verified in cortex and locus coeruleus (Fig. S22). We did not see any overt changes of MitoSOX intensity in either Gpt2-null LC (Fig. S23A-C) or CA1 of the hippocampus (Fig. S23D,E). Furthermore, protein levels of catalase, an enzyme that decomposes hydrogen peroxide, has been shown to elevate as a result of metabolic perturbation in LC neurons (Zhang et al., 2014a), however, we did not find any changes in catalase levels via immunohistochemistry in Gpt2-null LC (Fig. S24. We were unable to find remarkable features in the tests we applied to assess oxidative stress in Gpt2-null LC neurons with p62 aggregates.
Since GPT2 is an enzyme that feeds metabolites into the TCA cycle, we tested the possibility of the involvement of AMPK signaling pathway as an upstream energy sensor mechanism in Gpt2-null LC. Phosphorated AMPKα indicates high AMP to ATP ratio thereby activates cellular degradative processes and inhibits anabolic processes (Mihaylova and Shaw, 2011). We did not observe any differences of pAMPKα levels between wild-type, Gpt2-null LC neurons with or without p62 aggregates via immunohistochemistry (Fig. S25). While pAMPKα levels were unchanged, we did find slight decreases in intensity of MTCO1 (Mitochondrially Encoded Cytochrome C Oxidase I), a marker for mitochondria, in Gpt2-null LC neurons with p62 aggregates (Fig. S26). There was no visible difference in mitochondrial footprint in these neurons and the slight decreases in intensity may reflect overall cellular degradation.
3.3. Reductions in phosphorylated ribosomal protein 6 (pS6) levels precede indicators of abnormal autophagy and neurodegeneration in Gpt2-null locus coeruleus
We then assessed for perturbations in an anabolic process of proteostasis, mRNA translation in Gpt2-null LC. If the metabolic building blocks provided by GPT2 (glutamate and alanine, amino acids that are frequently found in the primary structure proteins) are of high demand, protein synthesis may be altered and the cells may not be able to grow or function. In our prior metabolomics studies of Gpt2-null brain, metabolite set enrichment analysis identified protein biosynthesis as a top pathway that was abnormal (Ouyang et al., 2016). Phosphorylation of the ribosomal protein 6 (pS6) has been linked to many synthetic pathways including protein synthesis, glucose homeostasis, cell size, as well as neuronal activity (Biever et al., 2015; Bohlen et al., 2021; Puighermanal et al., 2017; Ruvinsky et al., 2005). We find major reductions in pS6 levels in Gpt2-null LC neurons at P18 by immunohistochemistry. Within the representative image of Gpt2-null LC, most neurons had reduced pS6 intensity as determined by immunohistochemistry (Fig. 8A). Overall pS6 intensity was reduced in Gpt2-null LC neurons and further reduced in neurons with p62 aggregates compared to wild-type LC neurons (Fig. 8A & C). There were very few Gpt2-null LC neurons with a bright pS6 signal and the neighboring neurons of the motor nucleus of the trigeminal nerve showed wild-type-like staining (Fig. 8A). High magnification images of the Gpt2-null LC showed that neurons with p62 aggregates had little to no pS6 signal (Fig. 8B). This change in pS6 intensity was also reflected in an increase of coefficient of variation of pS6 intensity across Gpt2-null LC neurons compared to their wild-type controls (Fig. 8D). The stark reductions in pS6 were not accompanied by overall reductions in S6 (Fig. S27), suggesting that ribosomal protein 6 is present in normal levels in Gpt2-null LC but the phosphorylation of S6 is reduced. We did observe decreases in S6 intensity in Gpt2-null LC neurons with p62 aggregates compared to Gpt2-null neurons without aggregates and wild-type controls at P18 (Fig. S27), likely reflecting overall cellular degradation.
Fig. 8. Reduced levels of phosphorylated ribosomal protein S6 (pS6) in Gpt2-null LC.
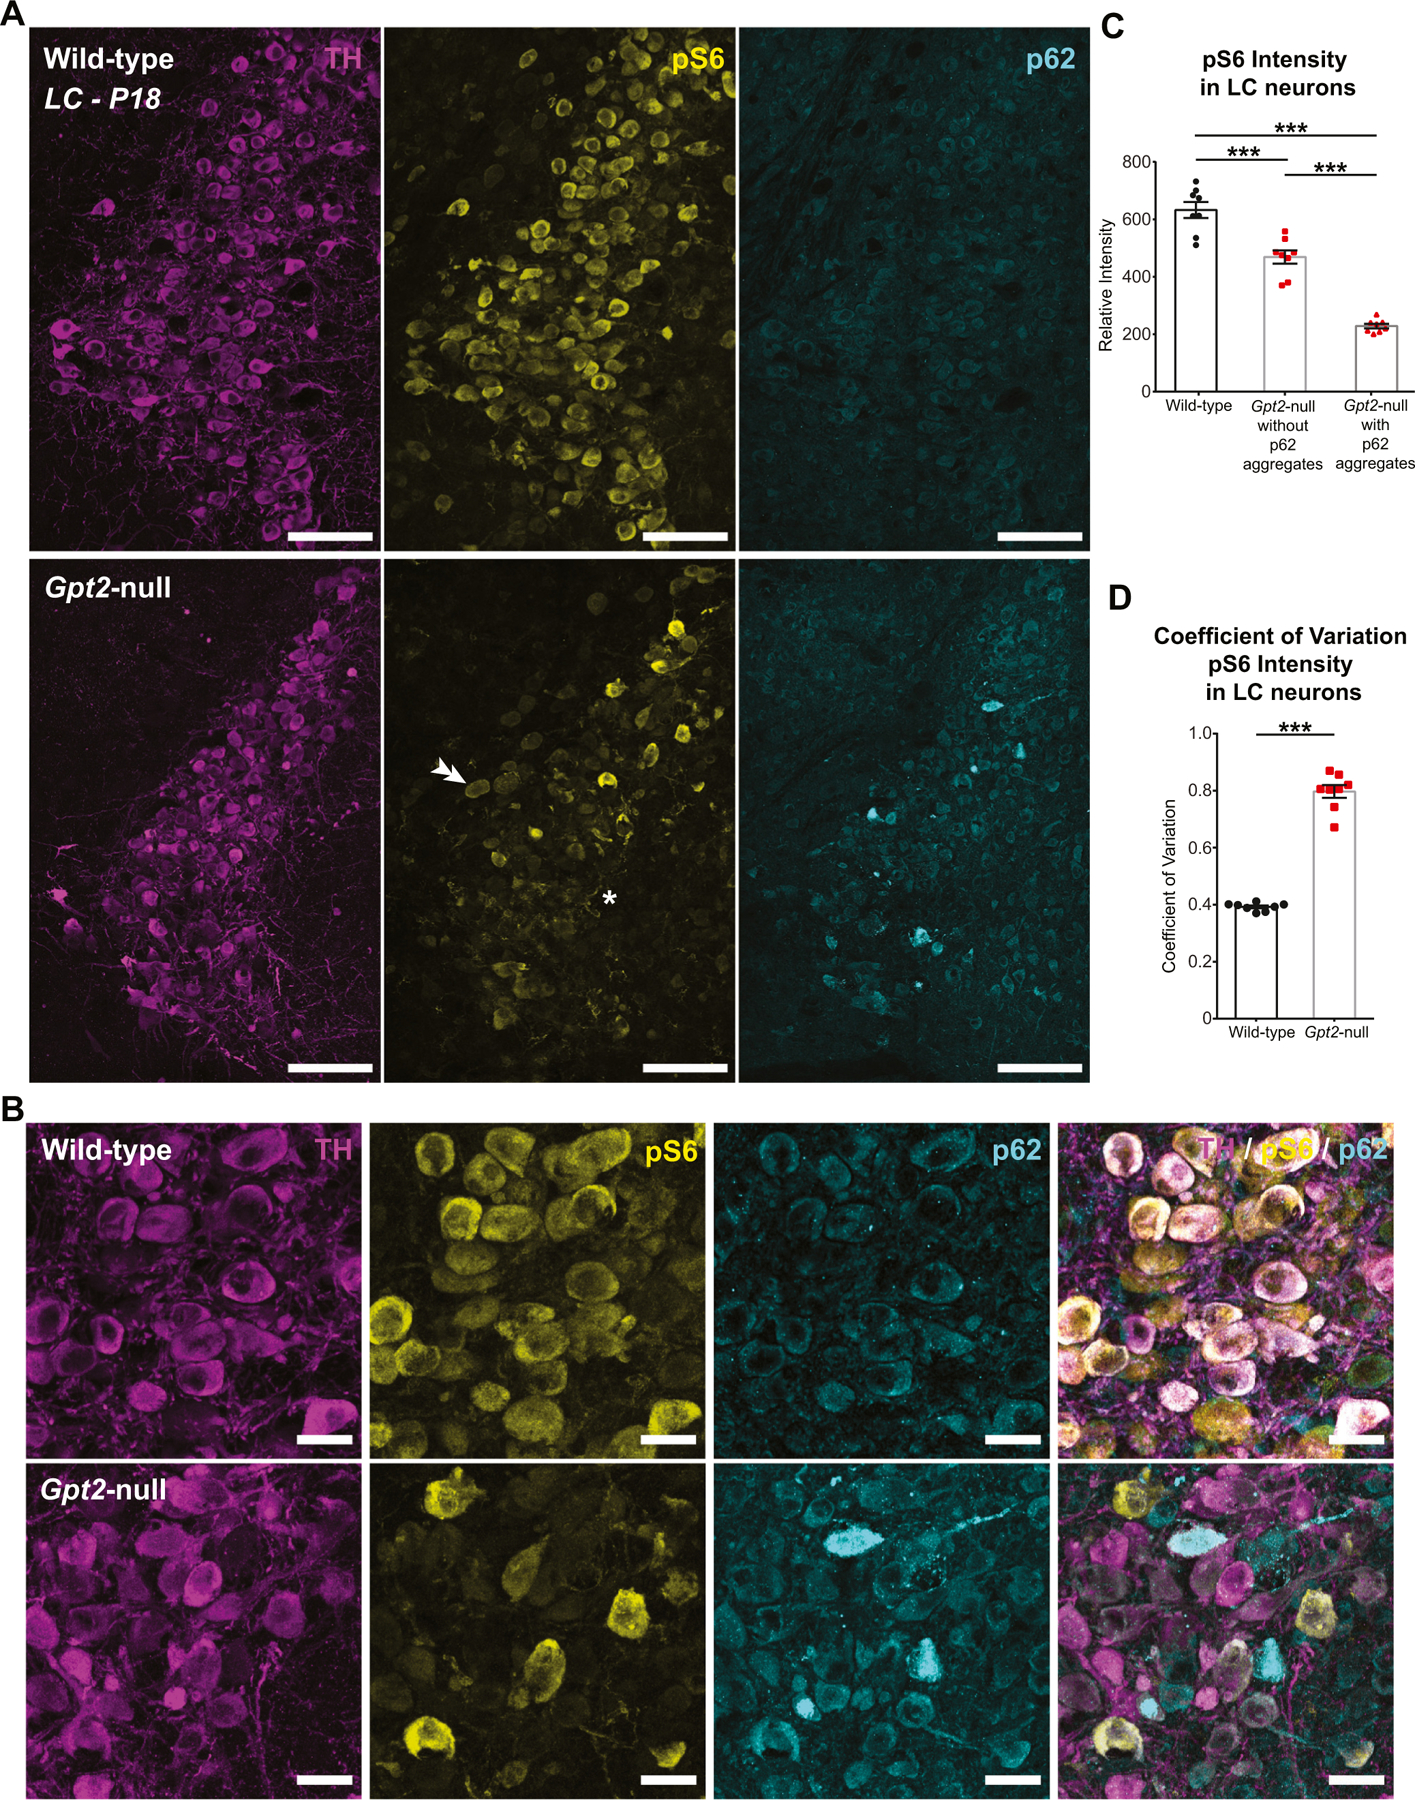
A. Representative images of TH (magenta), pS6 (yellow) and p62 (cyan) in wild-type and Gpt2-null LC at P18. Note the very dim pS6 intensity across the Gpt2-null LC (asterisk) and normal pS6 intensity in motor nucleus of the trigeminal nerve (double arrowheads).
B. Higher magnification images of tissue sections provided in (A) showing TH (magenta), pS6 (yellow) and p62 (cyan) staining in wild-type and Gpt2-null LC at P18. Note that the Gpt2-null LC neurons with p62 aggregates have little to no pS6 signal.
C. Overall pS6 intensity is reduced in Gpt2-null LC neurons and further reduced in neurons with p62 aggregates. Each dot represents a different coronal section of LC (wild-type: black, n = 8 sections, n = 4 mice; Gpt2-null: red, n = 8 sections, n = 4 mice). The statistical test for comparisons of two groups was unpaired two-tailed Student t-test. ***P < 0.001.
D. pS6 intensity is differentially affected across TH+ neurons in Gpt2-null LC at P18 as quantified by coefficient of variation of intensities. Each dot represents a different coronal section of LC (wild-type: black, n = 8 sections, n = 4 mice; Gpt2-null: red, n = 8 sections, n = 4 mice). The statistical test for comparisons of two groups was unpaired two-tailed Student t-test. ***P < 0.001.
Importantly, reductions in pS6 levels in Gpt2-null LC neurons appeared early at P14 (Fig. S28A), and therefore, represents one of the first cellular abnormalities observed in LC neurons. This overall change in pS6 intensity was also reflected in an increase in coefficient of variation (Fig. S28A). At P7, we did not observe any change in pS6 intensity (Fig. S28B) and there was no change in S6 intensity in Gpt2-null LC neurons (Fig. S29). These results also aligned well with the observation that norepinephrine levels in brain and spinal cord of Gpt2-null mice started to decline at P14 but not at P7 (Fig. 5). At this time point in postnatal development (P14), there were no gliosis (Fig. S2) or p62 aggregates (Fig. S11), suggesting that reductions in pS6 at P14 precede the pathology seen at P18 in Gpt2-null LC.
To corroborate our microscopy findings by assessing the levels of proteins of interest in LC more quantitatively, we devised a method by which we isolated locus coeruleus for protein lysate collection. We crossed the germline Gpt2-null mouse line with a mouse line expressing EGFP fused to a ribosomal protein RPL10A that is expressed under the promoter of norepinephrine transporter, Slc6a2 (NET-GFP) (Mulvey et al., 2018). This allowed us to visualize the LC under an inverted epifluorescent microscope and dissect it out specifically (Fig. 9A). We validated the use of the method by showing enrichment of the EGFP protein in the LC protein samples obtained from the mice with the transgene NET-GFP (Fig. 9B).
Fig. 9. Increased ratio of LC3B-II to LC3B-I protein levels in Gpt2-null LC.
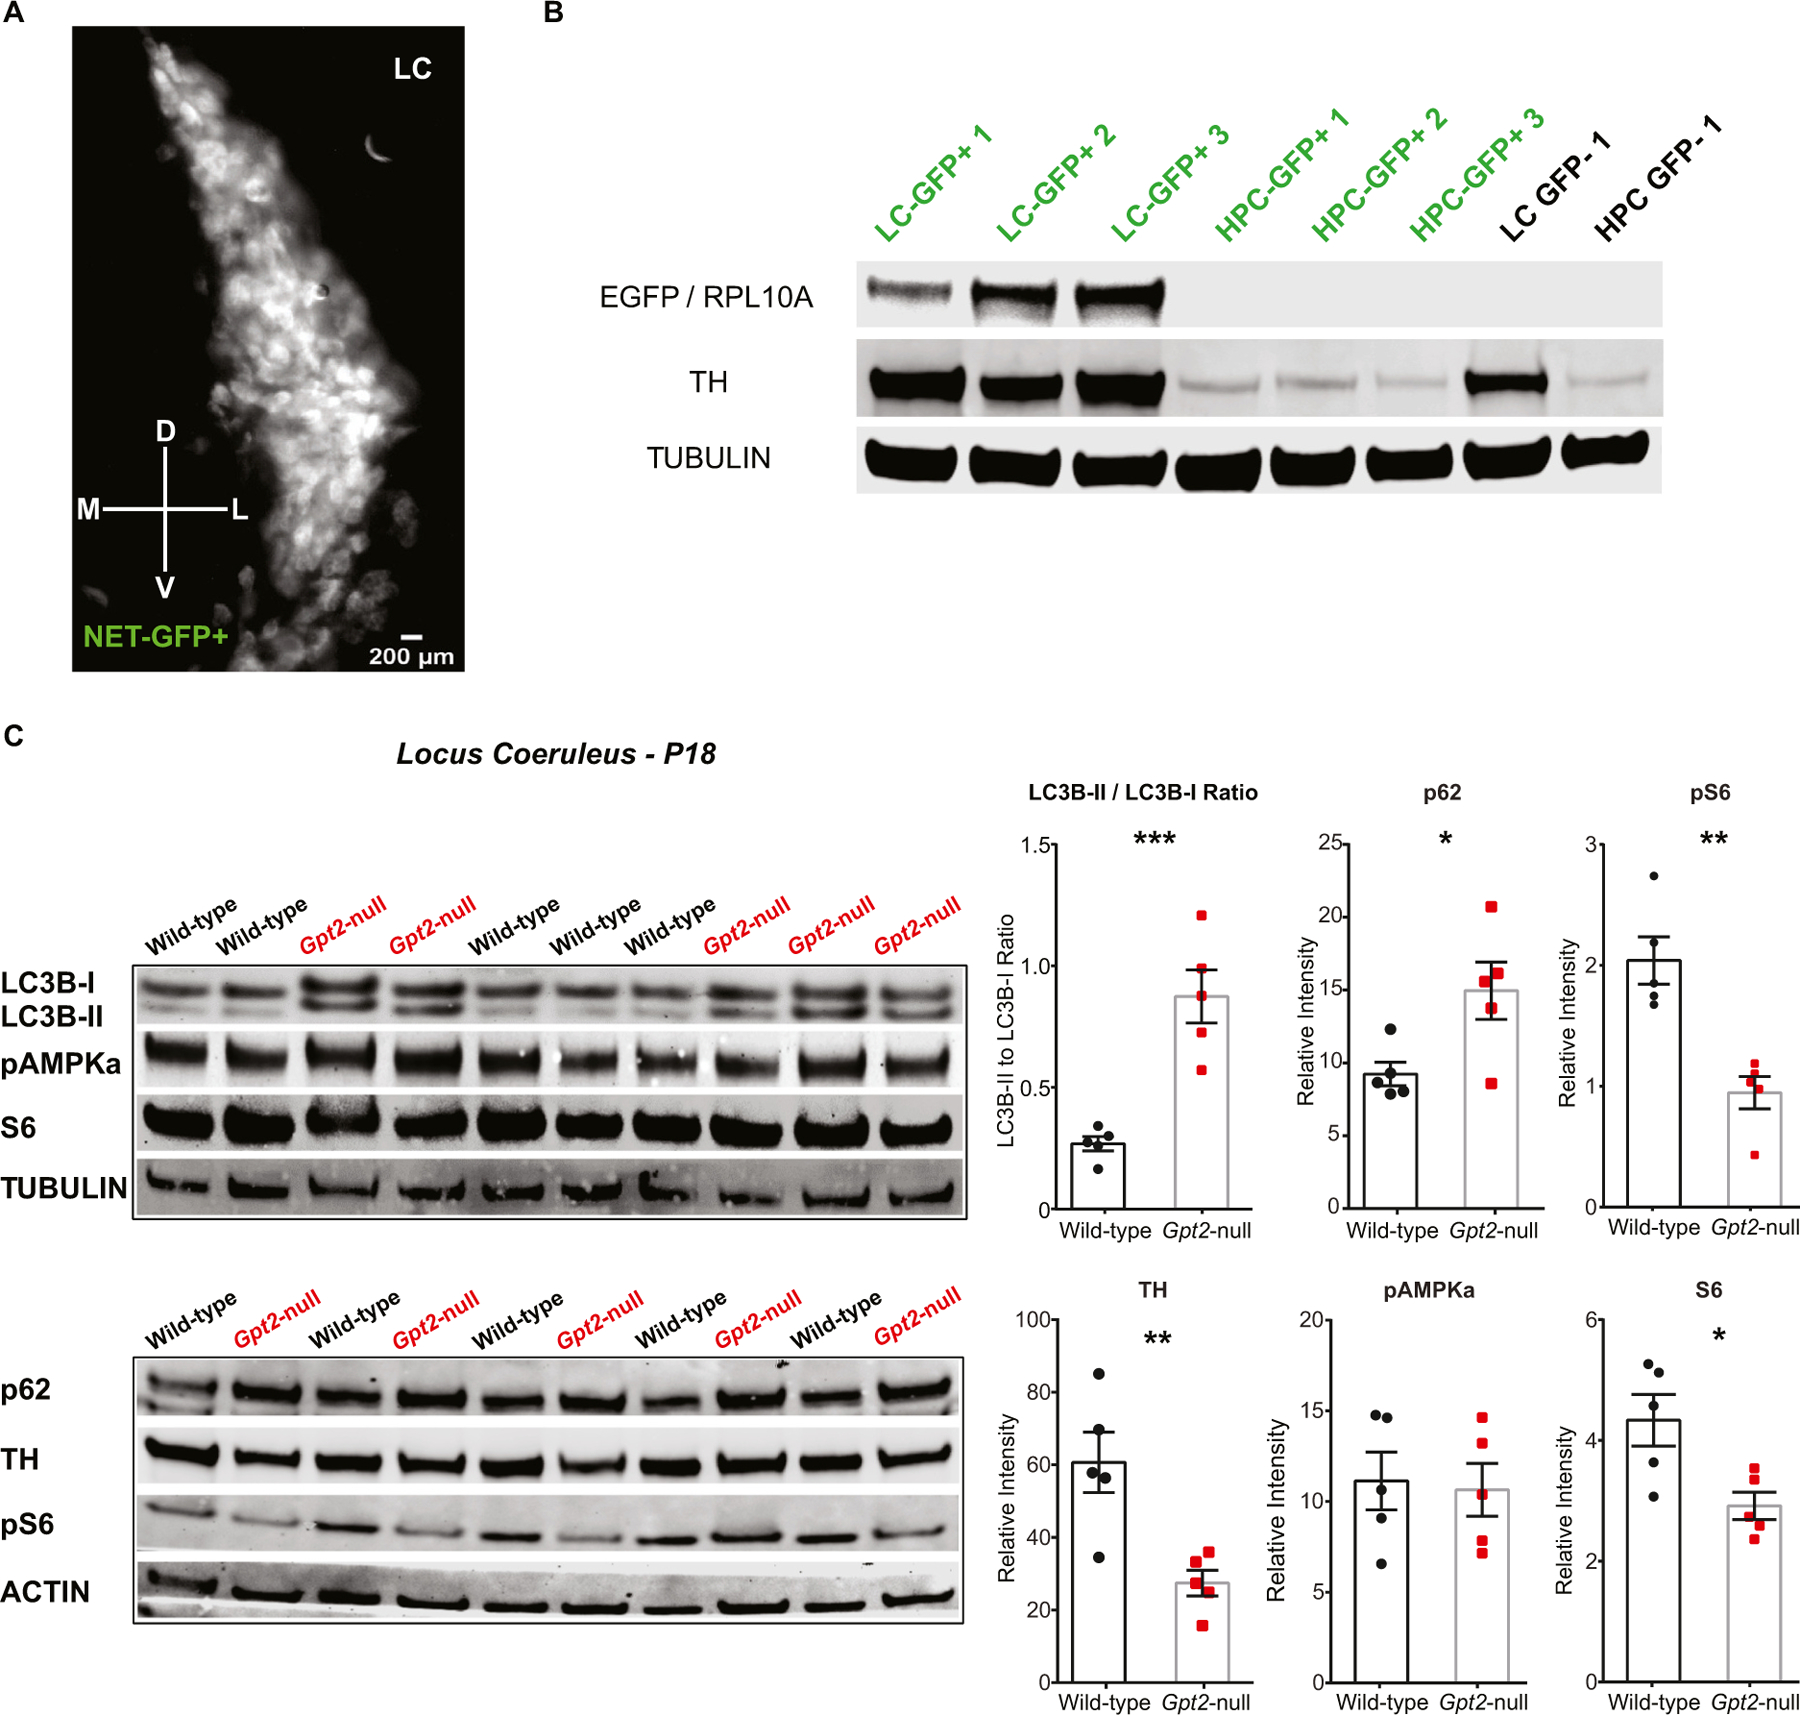
A. Validation of the use of NET-GFP (EGFP fused to the ribosomal protein RPL10A that is expressed under the promoter of norepinephrine transporter, Slc6a2). A representative image of neurons with EGFP in LC at P18, taken using an inverted epifluorescent microscope. Scale bar: 200 μm.
B. TH and EGFP in LC tissue samples of NET-GFP+ mice as determined by western blotting, indicating that the GFP marker assists with efforts to enrich for TH+ LC cells relative to the dissection without GFP (GFP-). Each lane represents a protein lysate sample obtained from a different mouse. Note that the EGFP / RPL10A protein is absent in the hippocampus (HPC) of NET-GFP+ mice as well as in LC and HPC samples of an animal without the NET-GFP transgene (GFP-). Tubulin was used as loading control. There is a relative enrichment of TH+ tissue in the GFP+ as compared to GFP-dissections.
C. Increased LC3B-II to LC3B-I ratio, increased p62 and decreased pS6 protein levels in Gpt2-null LC at P18. Each lane represents a protein lysate sample obtained from a different mouse and each protein level was normalized either to tubulin or actin (wild-type: black, n = 5 mice; Gpt2-null: red, n = 5 mice). The statistical test for comparisons of two groups was unpaired two-tailed Student t-test. *0.01 < P < 0.05, **0.001 < P < 0.01, ***P < 0.001.
Most strikingly, there was an elevation of LC3B-II to LC3B-I ratio in Gpt2-null LC at P18 (Fig. 9C). Conversion of LC3B-I to LC3B-II has been shown to be necessary for autophagy (Ichimura et al., 2000; Kabeya et al., 2004; Rubinsztein et al., 2009). This suggests that autophagy may play a role as a mechanism in the degeneration of Gpt2-null LC neurons. Complimentary to our immunohistochemistry experiments (Figs. 7, 8), we reaffirmed the increases in p62, decreases in TH and pS6 protein levels in Gpt2-null LC at P18 (Fig. 9C). We also find decreases in S6, however this was not as visibly striking as the decreases in pS6. There was no change in pAMPKα levels in Gpt2-null LC (Fig. 9C) confirming the results obtained from immunohistochemistry (Fig. S25). We did not observe any changes in levels of proteins tested in Gpt2-null cortex or hippocampus at P18 (Fig. S30), suggesting that the changes in levels of autophagy-related proteins are specific to LC. Overall, our results demonstrate early neurodegeneration and gliosis in Gpt2-null LC with specific vulnerabilities for altered proteostasis involving protein aggregation, degradative pathways and probable primary deficiencies in protein synthesis.
4. Discussion
LC has been shown to be one of the first brain areas that degenerate in AD and PD (Braak and Del Tredici, 2011; German et al., 1992; Grudzien et al., 2007; Oertel et al., 2019; Zarow et al., 2003). The underlying causes for the vulnerability of LC have not been clearly defined. One intriguing possibility is that LC neurons have a distinct metabolic enzyme and metabolome profile that confers a selective neuronal vulnerability. To our knowledge, this mouse model of GPT2 Deficiency demonstrates the only example of early LC neurodegeneration. The fact that GPT2 Deficiency represents a neurometabolic disease suggests that this genetic disease may provide important clues regarding metabolic mechanisms of neuronal vulnerability in the LC. While the exact causes of this phenotype are unclear, we observe earliest indicators of altered protein synthesis, followed by indicators of abnormal autophagy in Gpt2-null LC. In our study of Gpt2-null mouse, we observe small neuronal soma size across several brain regions; however, early neuronal loss (as measured by cell counting and Fluoro-Jade C) and microgliosis are relatively selective for LC. Our study identifies a novel mechanism of degeneration of LC neurons caused by loss of GPT2 and provides a new outlook on metabolic arsenal and vulnerabilities of LC.
The GPT2 enzyme, the mitochondrial GPT, regulates several critical metabolic pathways including the TCA cycle and amino acid metabolism. In our prior work, we demonstrate via metabolite set enrichment analysis that protein biosynthesis was among the most significantly altered defective pathways in Gpt2-null mouse brain (Baytas et al., 2022; Ouyang et al., 2016). We demonstrated that one of the earliest metabolic defects is low alanine, and that neuronal alanine synthesis is profoundly diminished in Gpt2-null neurons (Baytas et al., 2022). Thereby one potential mechanistic sequence leading to LC neuron death in Gpt2-null brains may be: 1) diminished protein synthesis and cell growth, as reflected by early reduced pS6 levels; and 2) subsequently abnormal autophagy and cellular degradation, as reflected by increased p62 and elevation of LC3B-II to LC3B-I ratio. While the exact causes for this phenotype are unclear, they point toward a relatively enhanced vulnerability of LC neurons to the metabolic pathways governed by GPT2. It is imperative that links between the observed phenotype and proposed alterations in protein synthesis and degradation are drawn carefully. For example, the functional consequence and necessity of pS6 in global protein synthesis are still debated and unclear particularly in the context of neuronal activity (Biever et al., 2015; Bohlen et al., 2021). Furthermore, pS6 function may have regional differences (Puighermanal et al., 2017). However, the observation that decreased pS6 preceded both gliosis and p62 aggregates suggest that this pathway is implicated in the phenotype of GPT2 Deficiency in LC. Another noteworthy caution is the absence of ubiquitin co-localization with p62 aggregates. While ubiquitin-independent mechanisms have been described both in neurodegenerative disease (Gal et al., 2009) and normal conditions (Jariel-Encontre et al., 2008), it is also possible that ubiquitination may follow p62 aggregation later (Nakaso et al., 2004).
Notably, there are aspects of the studied phenotype that are relatively selective to the LC. Loss of noradrenergic neurons seems specific to LC, and also FJC staining appears isolated to the LC at the developmental stages examined. Microgliosis and astrogliosis were found in the LC and also present in SubD, but absent in all other noradrenergic nuclei. It is possible that cell death and gliosis may extend beyond LC if Gpt2-null animals were examined at older ages; however, we were confined to the first three weeks of age in our studies as the Gpt2-null mice die around weaning age (P21). Both premature death and the phenotype seen in the LC did not appear to vary with sex but it is also possible that after development, sex differences may surface. It is very intriguing that p62 aggregation is also observed in serotonergic neurons in the midbrain, suggesting that over time, neurons of other nuclei may show signs of altered proteostasis, possibly accompanied by gliosis as well. Future studies delving into the mechanisms of this selective phenotype in LC may identify why this locus is implicated in many neurodegenerative diseases and provide potential therapeutics.
Among other diseases with LC degeneration or dysfunction, the neurodevelopmental disorder Rett Syndrome has clinical features that are the most similar to GPT2 Deficiency. In Rett Syndrome, females with MECP2 mutations display cognitive and motor abnormalities, including intellectual disability, loss of speech, spasticity, ataxia as well as postnatal microcephaly and seizures (Chahrour and Zoghbi, 2007; Hagberg et al., 1983). The Rett Syndrome mouse model (Mecp2-null) displays reduced LC neuron size, similar to our data in Gpt2-null mice (Fig. 6) as well as decreased norepinephrine levels in the pons and cingulate cortex (Taneja et al., 2009; Zhang et al., 2010). While the Mecp2-null mouse has early dysfunction of LC neurons, no clear evidence of neurodegeneration or gliosis has been demonstrated in the Mecp2-null LC. Rett Syndrome and GPT2 Deficiency may have commonalities regarding the role of LC dysfunction in their pathophysiology.
Human patients with GPT2 Deficiency display cognitive as well as motor abnormalities including spastic paraplegia (Ouyang et al., 2016). LC projects to virtually the entire central nervous system and descending noradrenergic tracts have been shown to influence motor function (Amaral and Sinnamon, 1977; Foote et al., 1983; Harro et al., 2008; Kwasniewska et al., 2020; Loughlin et al., 1986; Rekling et al., 2000). LC neurons that project to the cortex are spread out along the dorsal-ventral axis of LC and those that project to the hippocampus remain dorsally whereas the spinal cord-projecting LC neurons reside at the ventral most region of LC (Loughlin et al., 1986; Mason and Fibiger, 1979; O’Donnell et al., 2012; Schwarz and Luo, 2015). Given the strong gliosis phenotype seen in the ventral LC and greatest reduction of norepinephrine levels in the spinal cord, it is possible that the LC neurons projecting to the spinal cord are particularly affected in Gpt2-null mice. An intriguing connection between GPT2 Deficiency in human patients and LC metabolism has recently emerged, where Ruaud and co-workers found reduced amount of pterins and homovanilic acid in the cerebrospinal fluid of patients with GPT2 Deficiency (Ruaud et al., 2021). A decreased level of homovanilic acid, a metabolite of tyrosine metabolism in dopaminergic and noradrenergic neurons, may reflect a secondary consequence of LC dysfunction in human patients with GPT2 Deficiency. Future experiments in patients with GPT2 Deficiency will be required to examine phenotypes relevant to LC deficiency in order to translate findings in this mouse model to humans.
In addition to measures of proteostasis, we examined oxidative stress via MitoSOX intensity and catalase expression in Gpt2-null LC as a possible mechanism of cell death, especially given the fact that one of the precursors for glutathione is glutamate, a substrate of GPT2. However, there was another reason to look at oxidative stress concerning the possibility of increased activity in remaining Gpt2-null LC neurons. Decreases in norepinephrine levels seen in Gpt2-null mouse brain (Fig. 5) may lead to increased TH expression that manifests as unevenly bright TH intensity in some LC neurons (Fig. 2). Increased TH enzyme activity has been observed after degeneration of brain catecholaminergic nerve terminals induced by 6-hydroxydopamine (Acheson and Zigmond, 1981). Increased pacemaking activity (Fig. 6) may be correlated with the unevenly increased TH intensity and may lead to increases in Ca2+ levels resulting in more oxidative stress and possibly apoptosis (Sanchez-Padilla et al., 2014). While we have not found any positive indicators of oxidative stress either by MitoSOX or catalase, it is worth noting that oxidative stress remains a possible mechanism of neurodegeneration in Gpt2-null LC and warrants further study.
Two isoforms of glutamate pyruvate transaminase exist, a cytosolic, GPT1, and a mitochondrial isoform, GPT2 (Glinghammar et al., 2009; Yang et al., 2009). In a recent study of transcriptomic profiling by translating ribosome affinity purification (TRAP) in LC neurons (Mulvey et al., 2018), GPT2 expression turned out to be almost 4 times the expression of GPT1, suggesting GPT2 is the primary glutamate pyruvate transaminase in LC neurons. Other cells including astrocytes also express GPT2 (Zhang et al., 2014b). However, whether the degeneration of LC in Gpt2-null mice occur cell or non-cell autonomously needs to be clarified by future experiments.
In summary, our results identify a novel metabolic mechanism of neurodegeneration in LC mediated by the mitochondrial enzyme GPT2. The neuronal death in LC is caused by loss of GPT2, an enzyme that replenishes the TCA cycle and modulates amino acid metabolism. These processes are critical for cell growth and protein synthesis, and LC degeneration in Gpt2-null mice may be a consequence of defects in these pathways. Studies of GPT2-mediated metabolism in LC may allow us to deepen our understanding of metabolic mechanisms involved in vulnerability in LC. This Gpt2-null mouse demonstrates the earliest example of LC neurodegeneration, and the fact that this occurs in a model of neurometabolic disease may have pinpointed a specific pathway underlying metabolic vulnerabilities in LC. This knowledge may lead to new therapeutic targets with benefit to a wide range of neurological and psychiatric diseases.
Supplementary Material
Acknowledgements
This work was supported by a Brain & Behavior Research Foundation NARSAD Independent Investigator grant (25701) to E.M.M., a Dr. Ralph and Marian Falk Medical Research Trust Catalyst Award to E.M.M., a Brown University Research Seed Award to E.M.M., NIH NINDS grants (R01NS113141, R01NS121618) to E.M.M., funding from the Spastic Paraplegia Foundation, Inc. (SPF) to E.M.M., an NIH NIDA grant (R01DA011289) to J.A.K., and the Carney Institute for Brain Science and Suna Kıraç Fellowship Graduate Award in Brain Science to O.B. We would like to thank Erin Fingleton for her help in Fig. 4.
Footnotes
Declaration of Competing Interest
The authors declare no competing interests.
Supplementary data to this article can be found online at https://doi.org/10.1016/j.nbd.2022.105831.
References
- Acheson AL, Zigmond MJ, 1981. Short and long term changes in tyrosine hydroxylase activity in rat brain after subtotal destruction of central noradrenergic neurons. J. Neurosci 1, 493–504. [DOI] [PMC free article] [PubMed] [Google Scholar]
- Amaral D, Sinnamon H, 1977. The locus coeruleus: neurobiology of a central noradrenergic nucleus. Prog. Neurobiol 9, 147–196. [DOI] [PubMed] [Google Scholar]
- Aston-Jones G, Rajkowski J, Cohen J, 1999. Role of locus coeruleus in attention and behavioral flexibility. Biol. Psychiatry 46, 1309–1320. [DOI] [PubMed] [Google Scholar]
- Bartlett BJ, Isakson P, Lewerenz J, Sanchez H, Kotzebue RW, Cumming RC, Harris GL, Nezis IP, Schubert DR, Simonsen A, et al. , 2011. p62, ref(2)P and ubiquitinated proteins are conserved markers of neuronal aging, aggregate formation and progressive autophagic defects. Autophagy 7, 572–583. [DOI] [PMC free article] [PubMed] [Google Scholar]
- Baytas O, Davidson SM, DeBerardinis RJ, Morrow EM, 2022. Mitochondrial enzyme GPT2 regulates metabolic mechanisms required for neuron growth and motor function in vivo. Hum. Mol. Genet 31, 587–603. [DOI] [PMC free article] [PubMed] [Google Scholar]
- Biever A, Valjent E, Puighermanal E, 2015. Ribosomal protein S6 phosphorylation in the nervous system: from regulation to function. Front. Mol. Neurosci 8, 75. [DOI] [PMC free article] [PubMed] [Google Scholar]
- Bjorkoy G, Lamark T, Brech A, Outzen H, Perander M, Overvatn A, Stenmark H, Johansen T, 2005. p62/SQSTM1 forms protein aggregates degraded by autophagy and has a protective effect on huntingtin-induced cell death. J. Cell Biol 171, 603–614. [DOI] [PMC free article] [PubMed] [Google Scholar]
- Bohlen J, Roiuk M, Teleman AA, 2021. Phosphorylation of ribosomal protein S6 differentially affects mRNA translation based on ORF length. Nucleic Acids Res 49, 13062–13074. [DOI] [PMC free article] [PubMed] [Google Scholar]
- Braak H, Del Tredici K, 2011. The pathological process underlying Alzheimer’s disease in individuals under thirty. Acta Neuropathol 121, 171–181. [DOI] [PubMed] [Google Scholar]
- Bruinstroop E, Cano G, Vanderhorst VG, Cavalcante JC, Wirth J, Sena-Esteves M, Saper CB, 2012. Spinal projections of the A5, A6 (locus coeruleus), and A7 noradrenergic cell groups in rats. J. Comp. Neurol 520, 1985–2001. [DOI] [PMC free article] [PubMed] [Google Scholar]
- Bucci D, Busceti CL, Calierno MT, Di Pietro P, Madonna M, Biagioni F, Ryskalin L, Limanaqi F, Nicoletti F, Fornai F, 2017. Systematic morphometry of catecholamine nuclei in the brainstem. Front. Neuroanat 11, 98. [DOI] [PMC free article] [PubMed] [Google Scholar]
- Carroll B, Otten EG, Manni D, Stefanatos R, Menzies FM, Smith GR, Jurk D, Kenneth N, Wilkinson S, Passos JF, et al. , 2018. Oxidation of SQSTM1/p62 mediates the link between redox state and protein homeostasis. Nat. Commun 9, 256. [DOI] [PMC free article] [PubMed] [Google Scholar]
- Chahrour M, Zoghbi HY, 2007. The story of Rett syndrome: from clinic to neurobiology. Neuron 56, 422–437. [DOI] [PubMed] [Google Scholar]
- Chandler DJ, Jensen P, McCall JG, Pickering AE, Schwarz LA, Totah NK, 2019. Redefining noradrenergic neuromodulation of behavior: impacts of a modular locus coeruleus architecture. J. Neurosci 39, 8239–8249. [DOI] [PMC free article] [PubMed] [Google Scholar]
- Council NR, 2011. Guide for the Care and Use of Laboratory Animals, Eighth edition. The National Academies Press, Washington, DC. [Google Scholar]
- Deng Z, Purtell K, Lachance V, Wold MS, Chen S, Yue Z, 2017. Autophagy receptors and neurodegenerative diseases. Trends Cell Biol 27, 491–504. [DOI] [PubMed] [Google Scholar]
- Dienel GA, Cruz NF, 2016. Aerobic glycolysis during brain activation: adrenergic regulation and influence of norepinephrine on astrocytic metabolism. J. Neurochem 138, 14–52. [DOI] [PubMed] [Google Scholar]
- Fallon JH, Moore RY, 1978. Catecholamine innervation of the basal forebrain. III. Olfactory bulb, anterior olfactory nuclei, olfactory tubercle and piriform cortex. J. Comp. Neurol 180, 533–544. [DOI] [PubMed] [Google Scholar]
- Foote SL, Bloom FE, Aston-Jones G, 1983. Nucleus locus ceruleus: new evidence of anatomical and physiological specificity. Physiol. Rev 63, 844–914. [DOI] [PubMed] [Google Scholar]
- Gal J, Strom AL, Kilty R, Zhang F, Zhu H, 2007. p62 accumulates and enhances aggregate formation in model systems of familial amyotrophic lateral sclerosis. J. Biol. Chem 282, 11068–11077. [DOI] [PubMed] [Google Scholar]
- Gal J, Strom AL, Kwinter DM, Kilty R, Zhang J, Shi P, Fu W, Wooten MW, Zhu H, 2009. Sequestosome 1/p62 links familial ALS mutant SOD1 to LC3 via an ubiquitin-independent mechanism. J. Neurochem 111, 1062–1073. [DOI] [PMC free article] [PubMed] [Google Scholar]
- German DC, Manaye KF, White CL 3rd, Woodward DJ, McIntire DD, Smith WK, Kalaria RN, Mann DM, 1992. Disease-specific patterns of locus coeruleus cell loss. Ann. Neurol 32, 667–676. [DOI] [PubMed] [Google Scholar]
- Giaime E, Tong Y, Wagner LK, Yuan Y, Huang G, Shen J, 2017. Age-dependent dopaminergic neurodegeneration and impairment of the autophagy-lysosomal pathway in LRRK-deficient mice. Neuron 96 (796–807), e796. [DOI] [PMC free article] [PubMed] [Google Scholar]
- Glinghammar B, Rafter I, Lindstrom AK, Hedberg JJ, Andersson HB, Lindblom P, Berg AL, Cotgreave I, 2009. Detection of the mitochondrial and catalytically active alanine aminotransferase in human tissues and plasma. Int. J. Mol. Med 23, 621–631. [DOI] [PubMed] [Google Scholar]
- Grant LM, Kelm-Nelson CA, Hilby BL, Blue KV, Paul Rajamanickam ES, Pultorak JD, Fleming SM, Ciucci MR, 2015. Evidence for early and progressive ultrasonic vocalization and oromotor deficits in a PINK1 gene knockout rat model of Parkinson’s disease. J. Neurosci. Res 93, 1713–1727. [DOI] [PMC free article] [PubMed] [Google Scholar]
- Grudzien A, Shaw P, Weintraub S, Bigio E, Mash DC, Mesulam MM, 2007. Locus coeruleus neurofibrillary degeneration in aging, mild cognitive impairment and early Alzheimer’s disease. Neurobiol. Aging 28, 327–335. [DOI] [PubMed] [Google Scholar]
- Grueschow M, Stenz N, Thorn H, Ehlert U, Breckwoldt J, Brodmann Maeder M, Exadaktylos AK, Bingisser R, Ruff CC, Kleim B, 2021. Real-world stress resilience is associated with the responsivity of the locus coeruleus. Nat. Commun 12, 2275. [DOI] [PMC free article] [PubMed] [Google Scholar]
- Guerin D, Sacquet J, Mandairon N, Jourdan F, Didier A, 2009. Early locus coeruleus degeneration and olfactory dysfunctions in Tg2576 mice. Neurobiol. Aging 30, 272–283. [DOI] [PubMed] [Google Scholar]
- Guitart X, Thompson MA, Mirante CK, Greenberg ME, Nestler EJ, 1992. Regulation of cyclic AMP response element-binding protein (CREB) phosphorylation by acute and chronic morphine in the rat locus coeruleus. J. Neurochem 58, 1168–1171. [DOI] [PubMed] [Google Scholar]
- Hagberg B, Aicardi J, Dias K, Ramos O, 1983. A progressive syndrome of autism, dementia, ataxia, and loss of purposeful hand use in girls: Rett’s syndrome: report of 35 cases. Ann. Neurol 14, 471–479. [DOI] [PubMed] [Google Scholar]
- Hao Y, Samuels Y, Li Q, Krokowski D, Guan BJ, Wang C, Jin Z, Dong B, Cao B, Feng X, et al. , 2016. Oncogenic PIK3CA mutations reprogram glutamine metabolism in colorectal cancer. Nat. Commun 7, 11971. [DOI] [PMC free article] [PubMed] [Google Scholar]
- Harro J, Meriküla A, Lepiku M, Modiri A-R, Rinken A, Oreland L, 2008. Lesioning of locus coeruleus projections by DSP-4 neurotoxin treatment: effect on amphetamine-induced hyperlocomotion and dopamine D2 receptor binding in rats. Pharmacol. Toxicol 86, 197–202. [DOI] [PubMed] [Google Scholar]
- Hein L, Altman JD, Kobilka BK, 1999. Two functionally distinct alpha2-adrenergic receptors regulate sympathetic neurotransmission. Nature 402, 181–184. [DOI] [PubMed] [Google Scholar]
- Ichimura Y, Kirisako T, Takao T, Satomi Y, Shimonishi Y, Ishihara N, Mizushima N, Tanida I, Kominami E, Ohsumi M, et al. , 2000. A ubiquitin-like system mediates protein lipidation. Nature 408, 488–492. [DOI] [PubMed] [Google Scholar]
- Jariel-Encontre I, Bossis G, Piechaczyk M, 2008. Ubiquitin-independent degradation of proteins by the proteasome. Biochim. Biophys. Acta 1786, 153–177. [DOI] [PubMed] [Google Scholar]
- Johansen T, Lamark T, 2011. Selective autophagy mediated by autophagic adapter proteins. Autophagy 7, 279–296. [DOI] [PMC free article] [PubMed] [Google Scholar]
- Johnson-Cadwell LI, Jekabsons MB, Wang A, Polster BM, Nicholls DG, 2007. ‘Mild Uncoupling’ does not decrease mitochondrial superoxide levels in cultured cerebellar granule neurons but decreases spare respiratory capacity and increases toxicity to glutamate and oxidative stress. J. Neurochem 101, 1619–1631. [DOI] [PubMed] [Google Scholar]
- Kabeya Y, Mizushima N, Ueno T, Yamamoto A, Kirisako T, Noda T, Kominami E, Ohsumi Y, Yoshimori T, 2000. LC3, a mammalian homologue of yeast Apg8p, is localized in autophagosome membranes after processing. EMBO J 19, 5720–5728. [DOI] [PMC free article] [PubMed] [Google Scholar]
- Kabeya Y, Mizushima N, Yamamoto A, Oshitani-Okamoto S, Ohsumi Y, Yoshimori T, 2004. LC3, GABARAP and GATE16 localize to autophagosomal membrane depending on form-II formation. J. Cell Sci 117, 2805–2812. [DOI] [PubMed] [Google Scholar]
- Kim M, Gwak J, Hwang S, Yang S, Jeong SM, 2019. Mitochondrial GPT2 plays a pivotal role in metabolic adaptation to the perturbation of mitochondrial glutamine metabolism. Oncogene 38, 4729–4738. [DOI] [PubMed] [Google Scholar]
- Klimek V, Stockmeier C, Overholser J, Meltzer HY, Kalka S, Dilley G, Ordway GA, 1997. Reduced levels of norepinephrine transporters in the locus coeruleus in major depression. J. Neurosci 17, 8451–8458. [DOI] [PMC free article] [PubMed] [Google Scholar]
- Komatsu M, Waguri S, Koike M, Sou YS, Ueno T, Hara T, Mizushima N, Iwata J, Ezaki J, Murata S, et al. , 2007. Homeostatic levels of p62 control cytoplasmic inclusion body formation in autophagy-deficient mice. Cell 131, 1149–1163. [DOI] [PubMed] [Google Scholar]
- Krebs HA, 1953. Equilibria in transamination systems. Biochem. J 54, 82–86. [DOI] [PMC free article] [PubMed] [Google Scholar]
- Kuusisto E, Salminen A, Alafuzoff I, 2002. Early accumulation of p62 in neurofibrillary tangles in Alzheimer’s disease: possible role in tangle formation. Neuropathol. Appl. Neurobiol 28, 228–237. [DOI] [PubMed] [Google Scholar]
- Kwasniewska A, Miazga K, Majczynski H, Jordan LM, Zawadzka M, Slawinska U, 2020. Noradrenergic components of locomotor recovery induced by intraspinal grafting of the embryonic brainstem in adult paraplegic rats. Int. J. Mol. Sci 21. [DOI] [PMC free article] [PubMed] [Google Scholar]
- Lockrow J, Boger H, Bimonte-Nelson H, Granholm AC, 2011. Effects of long-term memantine on memory and neuropathology in Ts65Dn mice, a model for Down syndrome. Behav. Brain Res 221, 610–622. [DOI] [PMC free article] [PubMed] [Google Scholar]
- Loughlin SE, Foote SL, Grzanna R, 1986. Efferent projections of nucleus locus coeruleus: morphologic subpopulations have different efferent targets. Neuroscience 18, 307–319. [DOI] [PubMed] [Google Scholar]
- Mason ST, Fibiger HC, 1979. Regional topography within noradrenergic locus coeruleus as revealed by retrograde transport of horseradish peroxidase. J. Comp. Neurol 187, 703–724. [DOI] [PubMed] [Google Scholar]
- Mihaylova MM, Shaw RJ, 2011. The AMPK signalling pathway coordinates cell growth, autophagy and metabolism. Nat. Cell Biol 13, 1016–1023. [DOI] [PMC free article] [PubMed] [Google Scholar]
- Morris LS, McCall JG, Charney DS, Murrough JW, 2020. The role of the locus coeruleus in the generation of pathological anxiety. Brain Neurosci. Adv 4, 2398212820930321. [DOI] [PMC free article] [PubMed] [Google Scholar]
- Mulvey B, Bhatti DL, Gyawali S, Lake AM, Kriaucionis S, Ford CP, Bruchas MR, Heintz N, Dougherty JD, 2018. Molecular and functional sex differences of noradrenergic neurons in the mouse locus coeruleus. Cell Rep 23, 2225–2235. [DOI] [PMC free article] [PubMed] [Google Scholar]
- Nagaoka U, Kim K, Jana NR, Doi H, Maruyama M, Mitsui K, Oyama F, Nukina N, 2004. Increased expression of p62 in expanded polyglutamine-expressing cells and its association with polyglutamine inclusions. J. Neurochem 91, 57–68. [DOI] [PubMed] [Google Scholar]
- Nakaso K, Yoshimoto Y, Nakano T, Takeshima T, Fukuhara Y, Yasui K, Araga S, Yanagawa T, Ishii T, Nakashima K, 2004. Transcriptional activation of p62/ A170/ZIP during the formation of the aggregates: possible mechanisms and the role in Lewy body formation in Parkinson’s disease. Brain Res 1012, 42–51. [DOI] [PubMed] [Google Scholar]
- Neher JJ, Emmrich JV, Fricker M, Mander PK, Thery C, Brown GC, 2013. Phagocytosis executes delayed neuronal death after focal brain ischemia. Proc. Natl. Acad. Sci. U. S. A 110, E4098–E4107. [DOI] [PMC free article] [PubMed] [Google Scholar]
- Nestler EJ, Aghajanian GK, 1997. Molecular and cellular basis of addiction. Science 278, 58–63. [DOI] [PubMed] [Google Scholar]
- Nestler EJ, Alreja M, Aghajanian GK, 1999. Molecular control of locus coeruleus neurotransmission. Biol. Psychiatry 46, 1131–1139. [DOI] [PubMed] [Google Scholar]
- O’Donnell J, Zeppenfeld D, McConnell E, Pena S, Nedergaard M, 2012. Norepinephrine: a neuromodulator that boosts the function of multiple cell types to optimize CNS performance. Neurochem. Res 37, 2496–2512. [DOI] [PMC free article] [PubMed] [Google Scholar]
- Oertel WH, Henrich MT, Janzen A, Geibl FF, 2019. The locus coeruleus: another vulnerability target in Parkinson’s disease. Mov. Disord 34, 1423–1429. [DOI] [PubMed] [Google Scholar]
- Olivieri P, Lagarde J, Lehericy S, Valabregue R, Michel A, Mace P, Caille F, Gervais P, Bottlaender M, Sarazin M, 2019. Early alteration of the locus coeruleus in phenotypic variants of Alzheimer’s disease. Ann. Clin. Transl. Neurol 6, 1345–1351. [DOI] [PMC free article] [PubMed] [Google Scholar]
- Ouyang Q, Nakayama T, Baytas O, Davidson SM, Yang C, Schmidt M, Lizarraga SB, Mishra S, Ei-Quessny M, Niaz S, et al. , 2016. Mutations in mitochondrial enzyme GPT2 cause metabolic dysfunction and neurological disease with developmental and progressive features. Proc. Natl. Acad. Sci. U. S. A 113, E5598–E5607. [DOI] [PMC free article] [PubMed] [Google Scholar]
- Ouyang Q, Kavanaugh BC, Joesch-Cohen L, Dubois B, Wu Q, Schmidt M, Baytas O, Pastore SF, Harripaul R, Mishra S, et al. , 2019. GPT2 mutations in autosomal recessive developmental disability: extending the clinical phenotype and population prevalence estimates. Hum. Genet 138, 1183–1200. [DOI] [PMC free article] [PubMed] [Google Scholar]
- Puighermanal E, Biever A, Pascoli V, Melser S, Pratlong M, Cutando L, Rialle S, Severac D, Boubaker-Vitre J, Meyuhas O, et al. , 2017. Ribosomal protein S6 phosphorylation is involved in novelty-induced locomotion, synaptic plasticity and mRNA translation. Front. Mol. Neurosci 10, 419. [DOI] [PMC free article] [PubMed] [Google Scholar]
- Rekling JC, Funk GD, Bayliss DA, Dong XW, Feldman JL, 2000. Synaptic control of motoneuronal excitability. Physiol. Rev 80, 767–852. [DOI] [PMC free article] [PubMed] [Google Scholar]
- Roux JC, Panayotis N, Dura E, Villard L, 2010. Progressive noradrenergic deficits in the locus coeruleus of Mecp2 deficient mice. J. Neurosci. Res 88, 1500–1509. [DOI] [PubMed] [Google Scholar]
- Ruaud L, Keren B, Debs R, Mignot C, Mochel F, 2021. Demyelinating motor neuropathy associated with a homozygous GPT2 pathogenic variant. Muscle Nerve 63 (5), 41–44. [DOI] [PubMed] [Google Scholar]
- Rubinsztein DC, Cuervo AM, Ravikumar B, Sarkar S, Korolchuk V, Kaushik S, Klionsky DJ, 2009. In search of an “autophagomometer” Autophagy; 5, 585–589. [DOI] [PubMed] [Google Scholar]
- Ruvinsky I, Sharon N, Lerer T, Cohen H, Stolovich-Rain M, Nir T, Dor Y, Zisman P, Meyuhas O, 2005. Ribosomal protein S6 phosphorylation is a determinant of cell size and glucose homeostasis. Genes Dev 19, 2199–2211. [DOI] [PMC free article] [PubMed] [Google Scholar]
- Sanchez-Padilla J, Guzman JN, Ilijic E, Kondapalli J, Galtieri DJ, Yang B, Schieber S, Oertel W, Wokosin D, Schumacker PT, et al. , 2014. Mitochondrial oxidant stress in locus coeruleus is regulated by activity and nitric oxide synthase. Nat. Neurosci 17, 832–840. [DOI] [PMC free article] [PubMed] [Google Scholar]
- Santini E, Turner KL, Ramaraj AB, Murphy MP, Klann E, Kaphzan H, 2015. Mitochondrial superoxide contributes to hippocampal synaptic dysfunction and memory deficits in Angelman syndrome model mice. J. Neurosci 35, 16213–16220. [DOI] [PMC free article] [PubMed] [Google Scholar]
- Schmued LC, Albertson C, Slikker W, 1997. Fluoro-Jade: a novel fluorochrome for the sensitive and reliable histochemical localization of neuronal degeneration. Brain Res 751, 37–46. [DOI] [PubMed] [Google Scholar]
- Schousboe A, Scafidi S, Bak LK, Waagepetersen HS, McKenna MC, 2014. Glutamate metabolism in the brain focusing on astrocytes. Adv. Neurobiol 11, 13–30. [DOI] [PMC free article] [PubMed] [Google Scholar]
- Schwarz LA, Luo L, 2015. Organization of the locus coeruleus-norepinephrine system. Curr. Biol 25, R1051–R1056. [DOI] [PubMed] [Google Scholar]
- Seibenhener ML, Babu JR, Geetha T, Wong HC, Krishna NR, Wooten MW, 2004. Sequestosome 1/p62 is a polyubiquitin chain binding protein involved in ubiquitin proteasome degradation. Mol. Cell. Biol 24, 8055–8068. [DOI] [PMC free article] [PubMed] [Google Scholar]
- Szot P, 2012. Common factors among Alzheimer’s disease, Parkinson’s disease, and epilepsy: possible role of the noradrenergic nervous system. Epilepsia 53 (Suppl. 1), 61–66. [DOI] [PubMed] [Google Scholar]
- Taneja P, Ogier M, Brooks-Harris G, Schmid DA, Katz DM, Nelson SB, 2009. Pathophysiology of locus ceruleus neurons in a mouse model of Rett syndrome. J. Neurosci 29, 12187–12195. [DOI] [PMC free article] [PubMed] [Google Scholar]
- Vadlamudi RK, Joung I, Strominger JL, Shin J, 1996. p62, a phosphotyrosine-independent ligand of the SH2 domain of p56lck, belongs to a new class of ubiquitin-binding proteins. J. Biol. Chem 271, 20235–20237. [DOI] [PubMed] [Google Scholar]
- Von Coelln R, Thomas B, Savitt JM, Lim KL, Sasaki M, Hess EJ, Dawson VL, Dawson TM, 2004. Loss of locus coeruleus neurons and reduced startle in parkin null mice. Proc. Natl. Acad. Sci. U. S. A 101, 10744–10749. [DOI] [PMC free article] [PubMed] [Google Scholar]
- Weinshenker D, 2018. Long road to ruin: noradrenergic dysfunction in neurodegenerative disease. Trends Neurosci 41, 211–223. [DOI] [PMC free article] [PubMed] [Google Scholar]
- Yamamoto K, Shinba T, Yoshii M, 2014. Psychiatric symptoms of noradrenergic dysfunction: a pathophysiological view. Psychiatry Clin. Neurosci 68, 1–20. [DOI] [PubMed] [Google Scholar]
- Yang RZ, Park S, Reagan WJ, Goldstein R, Zhong S, Lawton M, Rajamohan F, Qian K, Liu L, Gong DW, 2009. Alanine aminotransferase isoenzymes: molecular cloning and quantitative analysis of tissue expression in rats and serum elevation in liver toxicity. Hepatology 49, 598–607. [DOI] [PMC free article] [PubMed] [Google Scholar]
- Zarow C, Lyness SA, Mortimer JA, Chui HC, 2003. Neuronal loss is greater in the locus coeruleus than nucleus basalis and substantia nigra in Alzheimer and Parkinson diseases. Arch. Neurol 60, 337–341. [DOI] [PubMed] [Google Scholar]
- Zatloukal K, Stumptner C, Fuchsbichler A, Heid H, Schnoelzer M, Kenner L, Kleinert R, Prinz M, Aguzzi A, Denk H, 2002. p62 is a common component of cytoplasmic inclusions in protein aggregation diseases. Am. J. Pathol 160, 255–263. [DOI] [PMC free article] [PubMed] [Google Scholar]
- Zhang X, Cui N, Wu Z, Su J, Tadepalli JS, Sekizar S, Jiang C, 2010. Intrinsic membrane properties of locus coeruleus neurons in Mecp2-null mice. Am. J. Phys. Cell Physiol 298, C635–C646. [DOI] [PMC free article] [PubMed] [Google Scholar]
- Zhang J, Zhu Y, Zhan G, Fenik P, Panossian L, Wang MM, Reid S, Lai D, Davis JG, Baur JA, et al. , 2014a. Extended wakefulness: compromised metabolics in and degeneration of locus ceruleus neurons. J. Neurosci 34, 4418–4431. [DOI] [PMC free article] [PubMed] [Google Scholar]
- Zhang Y, Chen K, Sloan SA, Bennett ML, Scholze AR, O’Keeffe S, Phatnani HP, Guarnieri P, Caneda C, Ruderisch N, et al. , 2014b. An RNA-sequencing transcriptome and splicing database of glia, neurons, and vascular cells of the cerebral cortex. J. Neurosci 34, 11929–11947. [DOI] [PMC free article] [PubMed] [Google Scholar]
Associated Data
This section collects any data citations, data availability statements, or supplementary materials included in this article.