

Abstract
NR2F6 is considered an orphan nuclear receptor since its endogenous ligand has yet to be identified. Recently, NR2F6 has emerged as a novel cancer therapeutic target. NR2F6 has been demonstrated to be upregulated or overexpressed in several cancers. Importantly, Nr2f6−/− mice spontaneously reject tumors and develop host-protective immunological memory, a consequence of NR2F6 acting as an immune checkpoint in effector T cells. Collectively, these data suggest that modulation of NR2F6 activity may have important clinical applications in the fight against cancer. The nuclear receptor superfamily of ligand-regulated transcription factors has proven to be an excellent source of targets for therapeutic intervention of a broad range of diseases. Approximately 15% of FDA approved drugs target NRs, demonstrating their clinical efficacy. To identify small molecule regulators of NR2F6 activity, with the overall goal of immuno-oncology, we developed and initiated a high-throughput cell-based assay that specifically measures the transcriptional activity of NR2F6. We completed automated screening of approximately 666,000 compounds and identified 5,008 initial hits. Further screening efforts, including counterscreening assays, confirmed 128 of these hits, most of which had IC50s of equal to or less than 5μM potencies. Here, we report, for the first time, the identification of several small molecule compounds to the orphan nuclear receptor, NR2F6.
Keywords: NR2F6, nuclear receptor, immuno-oncology drug discovery, high-throughput screening (HTS), cancer
Introduction
Cancer is among the leading causes of death worldwide and continues to be a significant emotional and financial burden on modern society and healthcare systems. The past few decades have brought forth significant advances in our understanding of and novel treatments for this deadly disease. Of those novel therapies, immune checkpoint blockade is proving to be an effective approach to enhance host antitumor immunity for the treatment of a variety of cancers. Novel therapeutics that block immune system inhibitory pathways, such as programmed cell death-1 (PD-1)/PD-1 ligand (PD-L1) and cytotoxic T lymphocyte-associated antigen protein 4 (CTLA-4), have been developed and proven to have some success in the clinic1. However, only a subset of patients exhibit dramatic responses, with the frequency of tumor shrinkage from a single agent (i.e. anti-PD-L1/PD-1 antibodies) ranging from 10–40%2. Responses to other agents, including anti-CTLA-4 antibodies, are even lower and significant side effects are common3. These data highlight the critical need for the identification of novel options to enhance the efficacy of the current treatment regimens as well as to minimize the treatment-related side effects.
The nuclear receptor (NR) superfamily of ligand-regulated transcription factors has proven to be an excellent source of targets for therapeutic intervention of a broad range of diseases, including cancer, diabetes, atherosclerosis, inflammation, and endocrine/reproductive disorders. Currently, approximately 15% of FDA approved drugs target NRs, demonstrating their clinical efficacy4. However, approximately half of NRs are classified as orphan receptors since they do not have identified endogenous ligands5–9. The NR2F subfamily of NRs, (NR2F1, NR2F2, and NR2F6), are the most evolutionarily conserved NRs and are still considered orphans since their endogenous ligands have not been identified. Significantly more is known about NR2F1 and NR2F2; synthetic ligands have been identified that modulate NR2F1 and NR2F2s function10, 11. However, little is known about the function of NR2F6 in vitro and in vivo, which is due, in part, to lack of specific molecular probes that would enable interrogation of its function. NR2F6 has recently emerged as a novel cancer therapeutic target. NR2F6 is upregulated or overexpressed in several cancers12. Mouse experiments have demonstrated that genetic ablation of NR2F6 significantly reduces tumor size and improves survival in a prostate cancer mouse model as a consequence of NR2F6 acting as an intracellular immune checkpoint in effector T cells13. Nr2f6−/− mice are also hypersusceptible to the development of symptoms in a mouse model of multiple sclerosis14. TH17 cells, a pro-inflammatory CD4+ T lymphocyte population, play a significant role in this disease and NR2F6 has been demonstrated to directly regulate cytokine expression15. Tumor-infiltrating TH17 cells have been reported in many cancers16 and their presence is associated with good or poor prognoses, depending on the cancer. Therefore, NR2F6-modulators represent a novel, therapeutic target for the treatment of a number of dysregulated physiological functions, including inflammation and cancer.
With our overall goal to identify ligands that affect NR2F6 activity, here, we report the development and optimization of a cell-based high-throughput screening (HTS) compatible primary assay that specifically measures the transcriptional activity of NR2F6. This was accomplished using a unique system encompassing transient transfected cells with a luciferase-based reporter system. Ligands that enhanced NR2F6’s repressive activity decreased the luminescence as compared to untreated cells. The high-throughput assay design can be found in Figure 1. We validated this system and completed a HTS screening campaign, testing approximately 666,000 compounds to modulate NR2F6 transcriptional activity. At the completion of the campaign, several hits were identified. The results of the HTS screen are found here.
Figure 1. Schematic representation of the assay design.

(A) NR2F6 binds to the Il17a promoter to repress transcription measured by luciferase signal (left). Ligand binding to NR2F6 enhances its repressor activity to further repress Il17a luciferase signal (right). Note: in this schematic we depict NR2F6 as a monomer. However, it has been shown to function as a dimer as well. How NR2F6 represses Il17a (monomer or dimer) is still unknown. (B) Graph representing NR2F6 dose-dependently represses Il17a luciferase signal in transiently transfected HEK293 cells.
Materials and Methods
Plasmids and Reagents
The pGL4 mIl17a-0.6kb promoter was a gift from Warren Strober (Addgene plasmid #20126; http://n2t.net/addgene:20126; RRID: Addgene_20126)17. The pCMV-SPORT6 mouse Nr2f6 (Gene ID 13864) was from the Mammalian Genome Collection (MGC)18. Plasmids were amplified and purified from XL10-Gold Escherichia coli (Agilent Technologies, Santa Clara, CA) using Nucleobond Midi-prep kits (Macherey-Nagel, Duren, Germany) and fully sequenced to confirm the correct sequence. The human NR2F6 LBD (ligand binding domain; residues 54–204) was PCR amplified and cloned into the pET46 vector using the Ek/LIC system (EMD chemicals/Novagen) as a tobacco etch virus (TEV) protease-cleavable N-terminal 6xHis tag fusion protein. RID1 (PPAMDFSRRLREL AGNTSSP) peptide was purchased with >95% purity from LifeTein with a N-terminal FITC label, a six-carbon linker (Ahx), and an amidated C-terminus for stability and prepared as 50 mM stocks in DMSO stored at −80°C.
Recombinant Protein Expression and Purification
Protein was expressed in Escherichia coli BL21(DE3) grown in M9 minimum medium for 4 hours at 37 °C. When the cell density reached an A600 of 0.8–1.0, protein expression was induced with 0.2% L-Arabinose and 0.5 mM isopropyl-1-thio-d-galactopyranoside (IPTG) and grown for another 18h at 20°C and 230 rpm then harvested. Cells were resuspended and lysed, and protein was purified using His-Trap affinity chromatography followed His tag excision by tobacco etch virus and a final purification size exclusion step (S200 GE HealthCare) in buffer containing 10 mM HEPES, pH 7.4, 50 mM NaCl, and 5 mM DTT.
TR-FRET Coregulator Recruitment Assays
Time-resolved fluorescence resonance energy transfer (TR-FRET) assays were performed in black 384-well plates (Greiner) with 15 μL final well volume. For this assay, each well contained 4 nM 6xHis-NR2F6 LBD, 1 nM LanthaScreen Elite Tb-anti-His Antibody (ThermoFisher), and 30uM FITC-labeled RID1 peptide in a buffer containing 10mM HEPES (pH 7.4), 50mM NaCl, 5mM DTT, and 0.01% Tween-20. Compounds were assessed in a dose response, maintaining a constant final DMSO concentration of 2.8%. Compound stocks were prepared in DMSO via serial dilution, added to wells in triplicate, and plates were read using a BioTek Synergy Neo multimode plate reader after incubation at 4 °C for 2 h. The Tb donor was excited at 340 nm; the Tb donor emission was measured at 495 nm, and the acceptor FITC emission was measured at 520 nm. Reads were measured with a 250us delay between initial excitation and emission reading to avoid potential compound background fluorescence. Data were plotted using GraphPad Prism as TR-FRET ratio 520 nm/495 nm vs. ligand concentration. Data were fit to a sigmoidal dose-response curve equation, with variable slope, allowing for a reasonable fitting of non-saturating dose response data to obtain EC50/IC50 potency.
MaxCyte Transient Transfection
HEK293 cells were grown in Dulbecco’s Modified Eagle Medium (DMEM; Life Technologies, Carlsbad, CA) supplemented with 10% heat-inactivated fetal bovine serum (HI FBS; Life Technologies, Carlsbad, CA) and 1% Penicillin-streptomycin (Life Technologies, Carlsbad, CA). At 70% confluency, HEK293 cells were harvested and resuspended in MaxCyte Electroporation Buffer at 1×10^8 cells/mL. Il17a::luc plus pSport6 NR2F6 or empty vector were added to the cells at ratios of 2:1 (400ug/ml DNA total). The cells were electroporated using MaxCyte cassettes and the MaxCyte device per the manufacturer’s instructions. The cells were transferred to a 10cm cell culture dish and incubated for 5 hours at 37oC. The cells were then resuspended in growth media, counted, centrifuged, cryopreserved, and stored in liquid nitrogen to be used during high-throughput screening (HTS), as assay ready cells. Notably, this process is completely scalable such that we were able to transfect greater than 5×10^9 cells [5×10^7 cells/100ml growth media/3 tier flasks (3 × 175cm, Nunc)], cryopreserve them as an HTS ready batch, and complete the HTS campaign with the same prep of cells. Freezing conditions post electroporation recovery were as follows: 3 tier flasks (3 × 175cm, Nunc) were seeded at 5×10^7 cells/flask in 100ml growth media for 5 hours. After 5 hours, flasks were tapped to dislodge and collect cells. Cells were centrifuged and resuspended in Cell recovery media (Life Technologies) at 3×10^7 cells/ml. Cells were stored in −80 freezer overnight prior to being placed in liquid nitrogen.
Il17a 1536-well Luciferase Assay
The pCMV-SPORT6 NR2F6 and empty vector (pCMV-SPORT6) cells were thawed and counted. The cells were seeded at 3,750 cells/well in 50% transfection media and 50% Optimem at 5 µL/well in 1536 well, white solid tissue culture treated polystyrene plates (Greiner Bio-One, Monroe, NC). 30nL of compounds or controls were added to the cells, plates were briefly spun for 1 minute at 1000 rpm (183g) and incubated overnight at 37 °C, 5% CO2, and 95% relative humidity. After the overnight incubation, the plates were removed from the incubator and allowed to equilibrate to room temperature for 10 min. ONE-Glo (Promega, Madison, WI) luciferase reagent was added at 5 µL/well with the BioRaptr FRD, and the plates were again briefly spun. After a 10 min incubation at room temperature, the luminescence was measured using a ViewLux (PerkinElmer, Waltham, MA) for 30 s. The high control was pCMV-SPORT6 + DMSO, and the low control was pCMV-SPORT6 NR2F6 + Il17a::luc + DMSO.
Compound Library
The Scripps Drug Discovery Library (SDDL) currently consists of 666,120 unique compounds representing a diversity of drug-like compound scaffolds targeted to traditional and non-traditional drug-discovery biological targets19. SDDL compounds are selected based on scaffold novelty, physical properties, and spatial connectivity. The SDDL contains focused sub-libraries targeted to popular drug-discovery targets (i.e. Bioactive lipid collection; FDA-approved drug collection, NCI oncology set), drug-discovery target classes (i.e. kinases/transferases, GPCRs, ion channels, NRs, hydrolases, transporters), diverse chemistries (i.e. click-chemistry, PAINS-free, Fsp3 enriched, and natural product collections), and desirable physical properties (“rule-of-five”, “rule-of-three”, polar surface area, etc.)20–25.
The LOPAC®1280 (Sigma-Aldrich, St. Louis, MO) is a well-known sub library of highly characterized molecules that comes pre-associated with highly useful target and class based pharmacological activity as metadata that researchers can use to help determine HTS amenability for their target of interest.
Screening Data Acquisition, Normalization, and Analysis
Raw assay data was imported into Scripps’ corporate database and subsequently analyzed using Symyx software. Activity of each compound was calculated on a per-plate basis using the following equation:
“High Control” represents wells containing Empty Vector cells and DMSO and “Low Control” represents wells containing NR2F6 + Luc + DMSO whereas “Data Wells” contain the same (NR2F6 + Luc) including test compound. “Low Control” for each assay will produce a high luminescent signal. This will be particularly useful for the counterscreen to eliminate responses that are due to effects acting at the Il17a luciferase vector only and not at NR2F6. “High Control” for each assay will produce a low luciferase signal and enable us to identify compounds that increase NR2F6’s repressive responses. Use of cells transfected with no luciferase show low luciferase signal, generating robust statistics for HTS analysis. The Z’ and signal to background ratio (S:B) was calculated using the High Control and Low Control wells. A plate was considered acceptable with a Z’ of greater than 0.526.
Results
The nuclear receptor, RORγt, binds to the promoter and enhancer regions of the Il17a gene as a monomer at its cognate hormone response element (HRE), driving Il17a expression17. NR2F6 has been shown to bind to the hormone response element in the Il17a promoter/enhancer region competing with RORγt for this DNA site to control Il17a gene expression15. Whether NR2F6 competes with RORγt as a monomer or dimer is still unknown. The principle behind our use of the NR2F6/Il17a luciferase assay was based on this previously published data (Figure 1A). Figure 1B demonstrates that NR2F6 dose dependently inhibits the Il17a luciferase reporter construct (Il17a::luc) when co-transfected in HEK293 cells, indicating that NR2F6 can modulate Il17a expression and this assay may be suitable for identifying NR2F6 small molecules. Importantly, luciferase signal from this reporter can be increased or decreased and we proposed to use this system to identify ligands that modulate NR2F6 activity.
1536-Well-Format Assay Optimization and LOPAC pilot screen
Given the primary assay’s initial performance in the 384-well format, with Z’s greater than 0.5, miniaturization and optimization into a 1536-well format was performed. This involved the following: optimization of the MaxCyte transient transfection system to generate a large stock of frozen readily available cells27; maintenance of the assay S:B; assay signal window (Z′); DMSO tolerance; assay robustness by pilot screening against the LOPAC library. Incubation times and determination of the optimal seeding cell conditions for the 1,536-well format was also performed.
To start, the Il17a luciferase assay optimization needed to scale the transfection for large-scale production of transiently transfected cells to be aliquoted and frozen in bulk for later use. We initially compared the Lipofectamine 3000 system versus the MaxCyte system, at varying transfection and incubation times. The transfected cells were tested against the control compound (Tro, Troglitazone) to detect the luciferase response compared with untreated samples. Troglitazone, originally identified from the patent literature, was used as a positive reference control for optimization 28. Troglitazone is thought to interact with NR2F6 to enhance its repressive function. Figure 2A shows the comparison of the Maxcyte transfection under varying concentrations of DNA. The data also indicate that Troglitazone further enhanced NR2F6’s repressive transcriptional response. Based on these data, we chose the Maxcyte approach for speed generating large batches of cells, reduced cost, and inter-experimental consistency.
Figure 2. Optimization for the high-throughput screen (HTS) along with LOPAC pilot screen data.

(A) DNA titration in Maxcyte transfected cells in a 384-well format. Troglitazone (Tro) concentration was 62.5uM. (EV, empty vector; LUC, Il17a luciferase construct). (B) Cell titration of Maxcyte transfected cells (40ug DNA) into a 1536-well plate format. RLU indicates Relative luciferase units. (C) The NR2F6/Il17a luciferase assay was tested for HTS compatibility using the 1280 LOPAC pilot screen in triplicate. The scatterplot demonstrates the assay results, and the run statistics are shown in Table 1.
We next optimized cell number using the Maxcyte transfected cells. Transfected cells were tested in a 1536-well format at 937 cells per well (c/w), 1,875 c/w, and 3,750 c/w (Figure 2B). While all three conditions showed the expected pattern of responses, the 3,750 c/w showed the best response generating optimal S:B. While the assay performance trended the correct way, the Z′ for these assays was still below the 0.5 threshold. However, upon further optimization, including testing of transfection and cell incubation times (5h vs 24h) demonstrated that a 5-hour incubation, with overnight plating was superior, giving good, reproducible Z’ and S:B. Collectively, results from these experiments determined that a density of 7.5e5 cells/mL, or 3,750 cells/5ul per well, using the Maxcyte transfection system and overnight incubation was ideal for our assay conditions. Supplemental Tables 1 and 2 demonstrate the steps followed for optimization and the final assay conditions, respectively.
To determine whether our assay was ready for an HTS screen, we performed a pilot screen using the LOPAC 1280 library29. The LOPAC pilot was run in triplicate with activity scatterplot and statistical data found in Figure 2C. Assay performance was excellent, with a Z’ of 0.71±0.06 and an average S:B of 3.68±1.27 (n=12 plates). LOPAC pilot screen statistics can be found in Table 1.
Table 1.
NR2F6 assay 1536 High-Throughput Screening Campaign
| Screen Stage | Target | No. Tested | Hit Cutoffa | No. Selected | Z’ | Signal: Background | |
|---|---|---|---|---|---|---|---|
| Pilot | LOPAC Pilot 3X | NR 2F 6 | 1280 | 77.75% b | 8 (0.21%) | 0.71 ± 0.06 | 3.68 ± 1.27 |
| 1 | Primary | NR 2F 6 | 666,120 | 43.87% b | 5008 (0.75%) | 0.64 ± 0.07 | 148.04 ± 12.36 |
| 2a | Confirmation 3X | NR 2F 6 | 4994 | 46.87%* | 1925 (38.55%) | 0.63 ± 0.04 | 182.81 ± 14.48 |
| 2b | Counter screen 3X | Empty vector | 4994 | 21.09%* | 2334 (46.74%) | 0.77 ± 0.03 | 166.24 ± 14.48 |
| 3a | Titration 3X | NR 2F 6 | 498 | IC50 < 5µM | 270 | 0.61 ± 0.06 | 197.97 ± 13.67 |
| 3b | Titration 3X | Empty vector | 498 | IC50 > 10µM | 192 | 0.76 ± 0.04 | 215.84 ± 7.54 |
The concentrations used were 9.9∞M for steps 1, 2a, and 2b; 25.2∞M titration starts for titration assays
Standard-based cutoffs
DMSO sample field cutoff
Primary HTS
The first step of the HTS campaign was to screen our HTS-ready NR2F6/Il17a luciferase assay against the SDDL. In this primary screen, 666,120 compounds were tested at one concentration in singlicate, with a final concentration for each compound tested in the library at 9.9μM. Since we are using luciferase as a direct reporter to identify activators/enhancers of NR2F6 repression, molecules such as Troglitazone (Tro) will reduce the constitutive luciferase signal of DMSO+NR2F6+Luc (i.e., induce greater repression), thus NR2F6+Luc+Tro acts as an additional control. Raw assay data was imported into Scripps’ corporate database and subsequently analyzed using Symyx software. Activity of each compound was calculated on a per-plate basis using the equation described in the Materials and Methods section. Briefly, “High Control” represents wells containing Empty Vector cells and DMSO. Due to the lack of luciferase transfected in the cells, the “High control” produces a low luminescent response. “Low Control” represents wells containing NR2F6 plus Luc plus DMSO and “Data Wells” contain the same (NR2F6 + Luc) including test compound. Use of these controls enables identification of compounds that enhance NR2F6s repressive function (High controls) while eliminating responses due to compounds acting on the Il17a luciferase only and not at NR2F6 (Low Control). The Z’ and S:B for this assay was calculated using the High Control and Low Control wells. Assay performance was excellent, with a Z’ of 0.64±0.07 and an average S:B of 148.04±12.36 (n=536 plates). A summary of the results can be found in Figure 3 and Table 1. To identify active compounds, a mathematical algorithm was used to determine an interval cut-off. Any samples that exhibited activity greater than or less than three standard deviations above the high or low control, respectively, were identified and excluded from the next step in the assay funnel. Next, two values were calculated: (1) the average percent activation of all compounds tested in the screen, and (2) three times their standard deviation. The cutoff parameter was calculated as the sum of these two values. A compound was considered active when any compound demonstrated greater percent activation than the cutoff parameter. Using this “Interval Cutoff” (43.87%), the primary assay yielded 5,008 active compounds, also referred to as “hits”. We also calculated a “promiscuity index” using former HTS primary data for greater selectivity; the expression “X out of Y” was interpreted as “this compound was a hit in X out of Y total primary screens”, with X also including the current screen. Compounds with high X values relative to Y values, i.e., >5, were considered promiscuous and excluded from further consideration. These compounds tended to be nonspecific agonists, detection artifact, etc. A total of 5,008 compounds were selected for confirmation, of which 4,994 were available for further screening.
Figure 3.
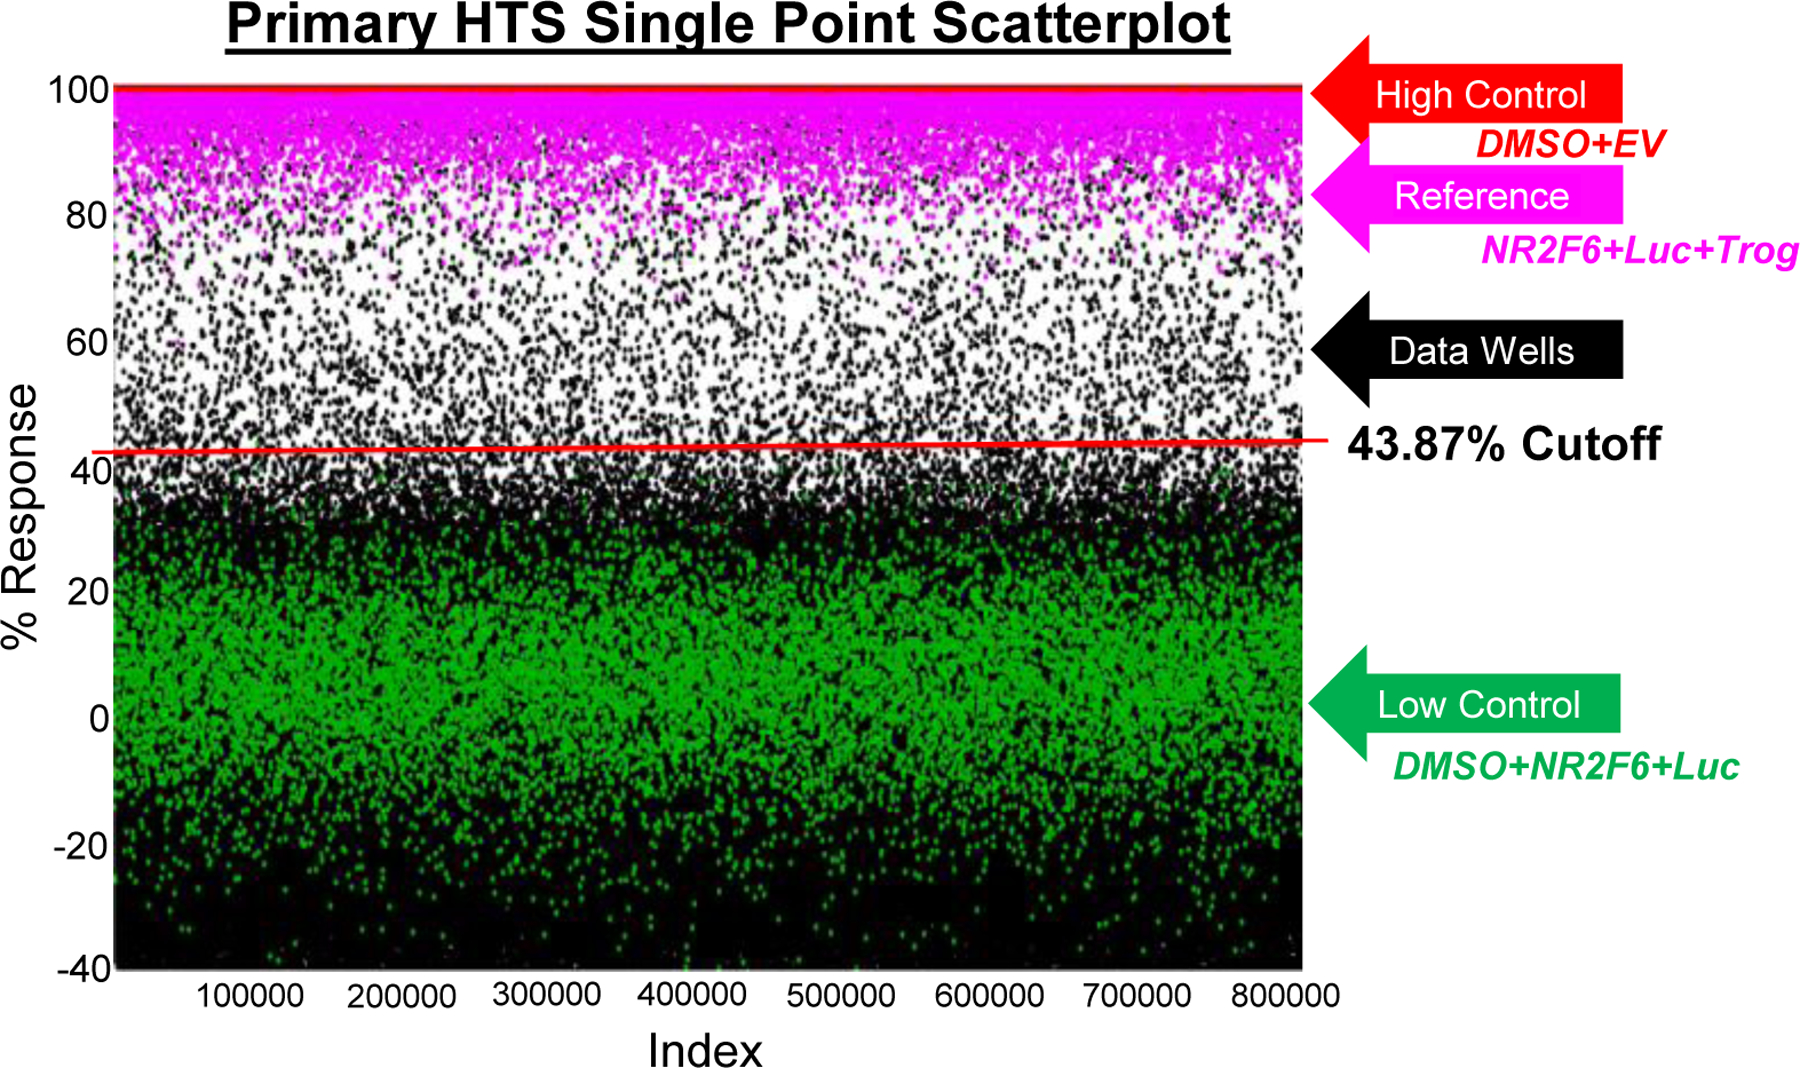
Primary screen. Scatterplot of all 666,120 compounds tested. Each dot represents the activity result of a well containing test compound (black dots) or controls (red and green). One hundred precent normalization is shown in pink. The red line indicates the hit cutoff used for the screen. The run statistics for the assay can be found in Table 1.
Confirmation and Counterscreen Assays
We used the same HTS-ready NR2F6/Il17a luciferase assay and reagents for confirmation assays, post completion of cherry-picking. As stated above, only 4,994 compounds of the 5,008 hits were available for testing, of which we tested at a single concentration (9.9μM) in triplicate.
The counterscreen assay was similar in format to the NR2F6/Il17a assay but used HEK293 cells transfected with empty vector (pSPORT6) + luciferase (Il17a) as the “Low control” and “Sample field” cells. The “High Control” for this assay employed the same empty vector cells without luciferase (Il17a). This assay was used to identify “off-target” hits and other compounds that modify the luciferase signal. The NR2F6 confirmation assay performance was excellent with an average Z’ of 0.63±0.04 and a S:B of 182.81±27.46. Using the primary cutoff, 1,925 compounds were found active above 43.87% activity (38.55% hit rate). A summary of the results for confirmation screening assay are shown in Figure 4A. The empty vector plus luciferase counterscreen assay performance passed with an average Z’ of 0.77±0.03 and a S:B of 166.24±14.48. 2,334 compounds were found active above the DMSO cutoff (n=6 plates) of 21.09% activity (46.74% hit rate). A summary of the results of the counter-screen assay are shown in Figure 4B. Using this method, as well as medicinal chemistry input for compounds with lead tractability, in total, 500 compounds were selected to proceed to titration assays, of which 498 were available for cherry picking (Supplemental Table 3).
Figure 4. Confirmation and counterscreen screens.

(A) Scatterplot of confirmation screen of 4,998 primary active compounds identified from the primary screen. Each dot represents the activity result of a well containing test compound (black dots) or controls (red and green). The red line indicates the hit cutoff used for the screen. (B) Empty vector counterscreen. The run statistics for these two assays can be found in Table 1. (C) Comparison of overlap of compounds found active in the NR2F6 and empty vector counterscreen assays. Of the 498 compounds tested, 128 were considered selective for NR2F6.
Titration Assays
The NR2F6 titration assay format was similar to what has been described in the primary (NR2F6/Il17a) and counterscreen assays, respectively, incorporating the same reagents and detection system in order to test the 498 compounds that were cherry picked. These compounds were tested in a 10-point dose-response titration format (threefold dilutions), run in triplicate, with starting concentrations at 25.2μM.
The NR2F6 titration assay performance was excellent with an average Z’ of 0.61±0.06 and a S:B of 197.97±13.67. The empty vector plus Il17a luciferase counterscreen titration assay performance was passing with an average Z’ of 0.76±0.04 and a S:B of 215.84±7.54. For each test compound, percent activation was plotted against compound concentration. A four-parameter equation describing a sigmoidal dose-response curve was then fitted with adjustable baseline using Assay Explorer software (Symyx Technologies Inc.). The reported IC50 values were generated from fitted curves by solving for the X-intercept value at the 50% activity level of the Y-intercept value. The following rule was used to declare a compound as “active” or “inactive”: Compounds with an IC50 greater than 5 micromolar were considered inactive. Compounds with an IC50 value equal to or less than 5 micromolar were considered active. All titration assay results are shown in Table 1. A Venn diagram shows the selective ligands that enhance NR2F6s repressive function in Figure 4C. All compounds cherry-picked for titration assays were analyzed by LC-MS to confirm purity and identify mass. Of the 498 samples submitted for LC-MS analysis 460 samples confirmed mass, i.e., the molecular weight of the structure in Scripps’ database matched that identified by LC-MS analysis of the screening sample. As determined by nominal methods (UV-vis spectroscopy, MS and ELSD), 451 of those samples demonstrated purity of >80%.
TR-FRET assays
To determine whether hit compounds directly bind to the NR2F6 LBD and modify its function, we developed a time-resolved fluorescence resonance energy transfer (TR-FRET)-based biochemical assay to be used as an orthogonal assay. FITC-labeled peptides containing a non-canonical interaction motif identified in the Bcl11a protein were used to detect ligand-NR2F6 interaction. This assay was based on previously published data demonstrating that NR2F6 interacts with cofactors containing “non-canonical” RID (receptor interaction domain) motifs (F/YSXXLXXL/Y)30. In solution, this assay measures a ligand-induced conformational change in the His-NR2F6 LBD, which causes a change in the interaction of the LBD with a cofactor peptide (FITC labeled Bcl11a RID1). Incubation with small molecule compounds, if binding to the receptor, should affect the NR2F6 - RID peptide interaction. This would be observed with a dose-dependent change in protein-peptide interaction translating to changes in TR-FRET signal (Figure 5A).
Figure 5. Confirmation of active compounds using TR-FRET assays.

(A) Assay principle: TR-FRET biochemical assay for detecting NR2F6 ligands. HIS-tagged NR2F6 LBD protein constitutively interacts with FITC-labeled Bcl11a RID1 peptide at basal level. When incubated with terbium (Tb)-anti-HIS donor antibody, the Tb-donor (anti-HIS antibody) and FITC acceptor (RID1) are in close proximity. Excitation of the Tb donor leads to TR-FRET emission at 520nm (FITC acceptor) and 495nm (Tb donor). TR-FRET is calculated as a ratio of emission values divided by donor values. (B) Dose response of select compounds in the TR-FRET assay. The IC50 for each compound is shown in the graph.
Following titration and counterscreening, several candidate compounds anticipated to be amendable to further SAR (structure activity relationship) studies were chosen (Supplemental Table 4). Screening hits were prioritized based on potency and selectivity, excluding those analogs which profiled as PAINS (pan-assay interference compounds) or with high promiscuity. Hit scaffolds with instability issues or toxicology structure alerts were also removed from consideration unless chemistry strategies existed to quickly address those concerns. Ease of analog synthesis and chemical tractability (including evaluation of parameters such as H-bond donor/acceptor count, polar surface area, cLogP, chemical stability, and absence of toxicity associated groups) guided the selection of preferred hits for follow-up studies. Searches of the primary and patent literature (SciFinder, PubMed) were conducted on selected leads to help understand the chemistry, biochemistry, biology, and pharmacology of lead hits and to address issues relevant to the design of future analogs. While some of the hits had previously been identified in the literature with potential targets (enzymes, kinases, etc.), some had no references or etiology associated. Compounds tested were derived from fresh powders obtained from chemical vendors or synthesized in-house. Select compounds were screened in a full 10-point dose response to try and generate EC/IC50’s (Figure 5B). While not highly potent, compounds 499673 and 545397 generated IC50 values of less than 30uM, with 545397 showing the best potency (IC50 = 16.7uM). Several compounds, including 526863, showed no response in this assay.
Discussion
We have successfully completed an HTS campaign, identifying compounds that can affect NR2F6 activity. Given the genetic evidence surrounding NR2F6, ligands targeting NR2F6 may be extremely valuable alone or in combination with other immune checkpoint inhibitors to enhance T cell responses and tumor killing. Given its high expression level in certain cancers, NR2F6 ligands may also be valuable as a direct cancer agent. NR2F6 has also been shown to be a negative regulator of TH17 cell development and function14. Therefore, it may hold therapeutic value for specific TH17-mediated autoimmune diseases as well. Thus, depending on the application, the choice of use of a NR2F6 agonist or antagonist is going to be context dependent. To our knowledge, this is the first study to report the methods and outcomes of a large-scale HTS to target NR2F6. Through the primary screen, use of the counterscreen, and titration assays we identified 128 compounds that selectively enhance NR2F6s repressive function. As an orphan nuclear receptor, with no bona fide ligands, either endogenous or synthetic, this is the first identification of NR2F6 ligands in the primary literature.
While these ligands are novel, we performed further studies to investigate their activity specifically at NR2F6. Downstream characterization of hit compounds included investigation of direct ligand binding to NR2F6’s ligand binding domain (LBD) in a TR-FRET assay. Direct binding of ligands to the receptor LBD is always a critical task to validate a bona fide ligand. Of the selected compounds used in our TR-FRET assay, only a small number of compounds appeared to bind and alter NR2F6 conformation. As a putative transcriptional repressor, we anticipated that ligand binding would recruit co-factor peptide (RID1). In contrast, ligand binding dissociated RID1. However, we need to stress that this is a biochemical assay reporting on change in receptor conformation resulting from ligand binding. Given little is known about the molecular workings of NR2F6, future experiments need to occur to better understand its function at the molecular level.
To further validate the selectivity of these ligands at NR2F6, assessment of ligand binding and activity of other NR2F family members needs to occur. There are 3 members of the NR2F family of nuclear receptors and while NR2F6 is more distantly related, its LBD shares ~75% sequence homology to NR2F1 and NR2F2. Given NR2F1 and NR2F2’s roles in various cellular processes, including insulin regulation, cell signaling, development, and tissue homeostasis31, 32, identifying NR2F6-selective ligands would be ideal. Finally, determining their activity in primary cells, including primary T cells, is key to understanding whether they would be functional for immune-oncology.
We have successfully completed an HTS campaign, identified and confirmed multiple active compound classes using the HTS strategy described. Outside of the work described above, future work to identify potent NR2F6-selective modulators would include chemical optimization, pharmacokinetic evaluation, and biological characterization efforts.
Supplementary Material
Funding
The authors disclosed receipt of the following financial support for the research, authorship, and/or publication of this article: Research reported in this publication was supported by the National Cancer Institute of the National Institutes of Health under award number R01CA225890. The content is solely the responsibility of the authors and does not necessarily represent the official views of the National Institutes of Health. ChemAxon (https://www.chemaxon.com) academic licensing was provided for the use of Instant JChem (ver. 15.10.12.0) to perform compound mining of the SDDL deck.
Footnotes
Declaration of Conflicting Interests
The authors declared no potential conflicts of interest with respect to the research, authorship, and/or publication of this article.
References
- 1.Klevorn LE; Teague RM Adapting Cancer Immunotherapy Models for the Real World. Trends in immunology 2016, 37, 354–63. [DOI] [PMC free article] [PubMed] [Google Scholar]
- 2.Chen DS; Mellman I Elements of cancer immunity and the cancer-immune set point. Nature 2017, 541, 321–330. [DOI] [PubMed] [Google Scholar]
- 3.Gangadhar TC; Vonderheide RH Mitigating the toxic effects of anticancer immunotherapy. Nature reviews. Clinical oncology 2014, 11, 91–9. [DOI] [PubMed] [Google Scholar]
- 4.Marciano DP; Chang MR; Corzo CA; et al. The therapeutic potential of nuclear receptor modulators for treatment of metabolic disorders: PPARgamma, RORs, and Rev-erbs. Cell metabolism 2014, 19, 193–208. [DOI] [PubMed] [Google Scholar]
- 5.Kliewer SA; Lehmann JM; Willson TM Orphan nuclear receptors: shifting endocrinology into reverse. Science 1999, 284, 757–60. [DOI] [PubMed] [Google Scholar]
- 6.Giguere V Orphan nuclear receptors: from gene to function. Endocrine reviews 1999, 20, 689–725. [DOI] [PubMed] [Google Scholar]
- 7.Mangelsdorf DJ; Evans RM The RXR heterodimers and orphan receptors. Cell 1995, 83, 841–50. [DOI] [PubMed] [Google Scholar]
- 8.O’Malley BW; Conneely OM Orphan receptors: in search of a unifying hypothesis for activation. Molecular endocrinology 1992, 6, 1359–61. [DOI] [PubMed] [Google Scholar]
- 9.de Vera IM S. Advances in Orphan Nuclear Receptor Pharmacology: A New Era in Drug Discovery. ACS Pharmacol Transl Sci 2018, 1, 134–137. [DOI] [PMC free article] [PubMed] [Google Scholar]
- 10.Khalil BD; Sanchez R; Rahman T; et al. An NR2F1-specific agonist suppresses metastasis by inducing cancer cell dormancy. J Exp Med 2022, 219. [DOI] [PMC free article] [PubMed]
- 11.Wang L; Cheng CM; Qin J; et al. Small-molecule inhibitor targeting orphan nuclear receptor COUP-TFII for prostate cancer treatment. Sci Adv 2020, 6, eaaz8031. [DOI] [PMC free article] [PubMed] [Google Scholar]
- 12.Hermann-Kleiter N; Baier G Orphan nuclear receptor NR2F6 acts as an essential gatekeeper of Th17 CD4+ T cell effector functions. Cell communication and signaling : CCS 2014, 12, 38. [DOI] [PMC free article] [PubMed] [Google Scholar]
- 13.Hermann-Kleiter N; Klepsch V; Wallner S; et al. The Nuclear Orphan Receptor NR2F6 Is a Central Checkpoint for Cancer Immune Surveillance. Cell reports 2015. [DOI] [PMC free article] [PubMed]
- 14.Hermann-Kleiter N; Gruber T; Lutz-Nicoladoni C; et al. The nuclear orphan receptor NR2F6 suppresses lymphocyte activation and T helper 17-dependent autoimmunity. Immunity 2008, 29, 205–16. [DOI] [PMC free article] [PubMed] [Google Scholar]
- 15.Hermann-Kleiter N; Meisel M; Fresser F; et al. Nuclear orphan receptor NR2F6 directly antagonizes NFAT and RORgammat binding to the Il17a promoter. Journal of autoimmunity 2012, 39, 428–40. [DOI] [PMC free article] [PubMed] [Google Scholar]
- 16.Guery L; Hugues S Th17 Cell Plasticity and Functions in Cancer Immunity. BioMed research international 2015, 2015, 314620. [DOI] [PMC free article] [PubMed] [Google Scholar]
- 17.Zhang F; Meng G; Strober W Interactions among the transcription factors Runx1, RORgammat and Foxp3 regulate the differentiation of interleukin 17-producing T cells. Nature immunology 2008, 9, 1297–306. [DOI] [PMC free article] [PubMed] [Google Scholar]
- 18.Team MGCP; Temple G; Gerhard DS; et al. The completion of the Mammalian Gene Collection (MGC). Genome Res 2009, 19, 2324–33. [DOI] [PMC free article] [PubMed] [Google Scholar]
- 19.Baillargeon P; Fernandez-Vega V; Sridharan BP; et al. The Scripps Molecular Screening Center and Translational Research Institute. SLAS Discov 2019, 24, 386–397. [DOI] [PMC free article] [PubMed] [Google Scholar]
- 20.Lipinski CA; Lombardo F; Dominy BW; et al. Experimental and computational approaches to estimate solubility and permeability in drug discovery and development settings. Advanced drug delivery reviews 2001, 46, 3–26. [DOI] [PubMed] [Google Scholar]
- 21.Baell JB; Holloway GA New substructure filters for removal of pan assay interference compounds (PAINS) from screening libraries and for their exclusion in bioassays. Journal of medicinal chemistry 2010, 53, 2719–40. [DOI] [PubMed] [Google Scholar]
- 22.Ding S; Gray NS; Wu X; et al. A combinatorial scaffold approach toward kinase-directed heterocycle libraries. Journal of the American Chemical Society 2002, 124, 1594–6. [DOI] [PubMed] [Google Scholar]
- 23.Kolb HC; Sharpless KB The growing impact of click chemistry on drug discovery. Drug discovery today 2003, 8, 1128–37. [DOI] [PubMed] [Google Scholar]
- 24.Lovering F; Bikker J; Humblet C Escape from flatland: increasing saturation as an approach to improving clinical success. Journal of medicinal chemistry 2009, 52, 6752–6. [DOI] [PubMed] [Google Scholar]
- 25.Congreve M; Carr R; Murray C; et al. A ‘rule of three’ for fragment-based lead discovery? Drug discovery today 2003, 8, 876–7. [DOI] [PubMed] [Google Scholar]
- 26.Zhang JH; Chung TD; Oldenburg KR A Simple Statistical Parameter for Use in Evaluation and Validation of High Throughput Screening Assays. Journal of biomolecular screening 1999, 4, 67–73. [DOI] [PubMed] [Google Scholar]
- 27.Smith E; Davis-Gardner ME; Garcia-Ordonez RD; et al. High-Throughput Screening for Drugs That Inhibit Papain-Like Protease in SARS-CoV-2. SLAS Discov 2020, 25, 1152–1161. [DOI] [PMC free article] [PubMed] [Google Scholar]
- 28.Ichim CV Methods of Screening Compounds That Can Modulate NR2F6 By Displacement of a Reference Ligand 2016.
- 29.Conn PM; Smith E; Hodder P; et al. High-throughput screen for pharmacoperones of the vasopressin type 2 receptor. Journal of biomolecular screening 2013, 18, 930–7. [DOI] [PMC free article] [PubMed] [Google Scholar]
- 30.Chan CM; Fulton J; Montiel-Duarte C; et al. A signature motif mediating selective interactions of BCL11A with the NR2E/F subfamily of orphan nuclear receptors. Nucleic acids research 2013, 41, 9663–79. [DOI] [PMC free article] [PubMed] [Google Scholar]
- 31.Polvani S; Pepe S; Milani S; et al. COUP-TFII in Health and Disease. Cells 2019, 9. [DOI] [PMC free article] [PubMed]
- 32.Bertacchi M; Parisot J; Studer M The pleiotropic transcriptional regulator COUP-TFI plays multiple roles in neural development and disease. Brain Res 2019, 1705, 75–94. [DOI] [PubMed] [Google Scholar]
Associated Data
This section collects any data citations, data availability statements, or supplementary materials included in this article.