

Abstract
The ribonuclease DIS3 is one of the most frequently mutated genes in the hematological cancer multiple myeloma, yet the basis of its tumor suppressor function in this disease remains unclear. Herein, exploiting the TCGA dataset, we found that DIS3 plays a prominent role in the DNA damage response. DIS3 inactivation causes genomic instability by increasing mutational load, and a pervasive accumulation of DNA:RNA hybrids that induces genomic DNA double‐strand breaks (DSBs). DNA:RNA hybrid accumulation also prevents binding of the homologous recombination (HR) machinery to double‐strand breaks, hampering DSB repair. DIS3‐inactivated cells become sensitive to PARP inhibitors, suggestive of a defect in homologous recombination repair. Accordingly, multiple myeloma patient cells mutated for DIS3 harbor an increased mutational burden and a pervasive overexpression of pro‐inflammatory interferon, correlating with the accumulation of DNA:RNA hybrids. We propose DIS3 loss in myeloma to be a driving force for tumorigenesis via DNA:RNA hybrid‐dependent enhanced genome instability and increased mutational rate. At the same time, DIS3 loss represents a liability that might be therapeutically exploited in patients whose cancer cells harbor DIS3 mutations.
Keywords: DNA damage repair, DNA:RNA Hybrids, interferon, multiple myeloma, R‐loops
Subject Categories: Cancer; DNA Replication, Recombination & Repair; RNA Biology
DIS3 mutation in hematological cancer causes reduced homologous recombination repair, increased mutational burden, and overactivation of inflammatory interferon responses.

Introduction
DNA:RNA hybrids are structures where an RNA transcript hybridizes with the DNA template, leaving the nontemplate DNA single‐stranded. The resulting DNA:RNA hybrid and the displaced single‐stranded DNA are collectively called R‐loop (Sanz et al, 2016). DNA:RNA hybrids mostly arise as RNA polymerases progress through the genes during transcription, by the rehybridization of the nascent RNA to the template DNA strand. Genome‐wide mapping experiments have revealed that the formation of DNA:RNA hybrids is diffuse, occupying up to 5% of mammalian genomes (Sanz et al, 2016). R‐loops impact fundamental cellular functions, such as the regulation of gene expression (Ginno et al, 2012; Chédin, 2016) and transcriptional termination (Skourti‐Stathaki & Proudfoot, 2014). Paradoxically, despite their broad involvement in many biological functions, when unbridled, they can also induce DNA damage and genome instability (Santos‐Pereira & Aguilera, 2015). Cells have evolved different mechanisms to regulate DNA:RNA hybrid levels, based on the swift removal of the RNA component and its transfer into the cytoplasm (Aguilera & Huertas, 2003; Mischo et al, 2011; Hamperl & Cimprich, 2014; Santos‐Pereira & Aguilera, 2015; Salas‐Armenteros et al, 2017), or their immediate resolution through protein complexes, including RNases, helicases, and topoisomerases (Sordet et al, 2009; Tuduri et al, 2009; Wahba et al, 2011).
Several human genetic diseases have been associated with the accumulation of DNA:RNA hybrids, including the hereditary neurological disorders amyotrophic lateral sclerosis type 4 (ALS4) and a recessive form of ataxia oculomotor apraxia type 2 (AOA2), Aicardi–Goutières syndrome (AGS)13.
R‐loop accumulation is associated with DNA replication stress and genome instability, and its role in cancer is increasingly recognized (Petermann et al, 2022). The link between R‐loops and cancer has been further supported by the finding that the tumor suppressors BRCA2 and BRCA1, mutated in breast and ovarian cancers, are required for R‐loop processing and prevention of genome instability (Bhatia et al, 2014; Hatchi et al, 2015).
Multiple myeloma (MM), the second most common hematological malignancy in the United States, is characterized by the abnormal proliferation of plasma cells in the bone marrow (Kumar et al, 2017). Despite the recent introduction of a large array of innovative therapies, MM remains an incurable cancer. Chromosomal translocations involving the IgH locus and hyperdiploidy drive the initial stages of MM, which are followed by a myriad of secondary genetic events, so that during the progression of the disease, unlike other blood cancers, the MM genome is heavily rearranged, endowed with high mutational burden, and characterized by rampant genomic instability, as we have recently shown (Cottini et al, 2014, 2015). Next‐generation sequencing surveys in MM have confirmed frequent somatic mutations of established cancer genes, including KRAS, NRAS, and TP53. Surprisingly, these studies have also revealed somatic mutations in another gene, DIS3, not previously reported as altered in any other cancer type (Chapman et al, 2011; Bolli et al, 2014; Lohr et al, 2014). DIS3 is the catalytic subunit of RNA exosome, involved in the processing, turnover, and surveillance of a large number of coding and noncoding RNAs even if the role of most of these transcripts remains unknown (Bernstein & Toth, 2012; Ogami et al, 2018). It has been reported that DNA:RNA hybrids formed at DSBs can also be resolved by another subunit of the exosome, EXOSC10. Indeed, depletion of EXOSC10 in human cells increases DNA:RNA hybrids at DSB (Domingo‐Prim et al, 2019). Moreover, the exosome is also associated with AID in the R‐loop‐enriched switch region of B cells (Basu et al, 2011). At the IgH locus, in the absence of DIS3 and ncRNA turnover, DNA:RNA hybrids accumulate, formed by ncRNA aggregation on transcribed DNA, thus preventing cohesin‐mediated loop extrusion and CTCF–cohesin complex stabilization (Laffleur et al, 2021).
Mutations in DIS3 occur in up to 18% of MM patients and are mainly missense and localized in the catalytic domains of the protein strongly implying a tumor suppressor role for DIS3 in MM (Walker et al, 2012; Lohr et al, 2014; Lionetti et al, 2015; Segalla et al, 2015; Weißbach et al, 2015).
How DIS3 inactivation sustains MM tumorigenesis remains largely unknown.
Results
DIS3 silencing affects genome integrity.
To define the role of DIS3 in carcinogenesis, we exploited The Cancer Genome Atlas (TCGA) RNA‐seq expression datasets, which include almost 7,000 transcriptomes in about 30 different tumor types (Reshef et al, 2011). We found that genes mostly coregulated with DIS3 at the expression level belonged to double‐strand breaks response, suggesting a potential role of DIS3 in genome integrity and DNA damage (Fig 1A). To validate this hypothesis, we assessed genome stability using the comet assay in cells silenced for DIS3. For these experiments, we choose as a cellular model the osteosarcoma U2OS cell line, widely used in the field of DNA damage response and repair. The depletion of DIS3 by short interfering RNAs (siRNAs; Fig 1B) triggered a robust increase in comet tail lengths, suggesting that DIS3 inactivation disrupts genome stability (Fig 1C). To assess the specificity of the response, we designed a rescue experiment, where DIS3 was reintroduced in cells silenced for the gene (Fig 1B). The reintroduction of DIS3 in U2OS transfected with scrambled siRNAs had no significant impact on DSBs. However, the reintroduction of DIS3 in cells where the gene had been downregulated rescued the phenotype, as DSBs were reduced to the levels of control cells (Fig 1C). We then explored whether DIS3 silencing with another tool (shRNAs) and in a different cellular system (the MM cell line RPMI‐8226) provided similar results as in U2OS cells silenced with siRNAs. Indeed, silencing of DIS3 by lentiviral infection with a specific shRNA in RPMI‐8226 cells, elicited a significant increase in DNA DSBs (Figs 2, EV1A and B and EV2). These data demonstrate that DIS3 downregulation increases DNA damage, irrespective of the silencing method and cellular context, suggesting a consistent role of DIS3 in controlling DNA integrity. Importantly, DIS3 inactivation is associated with increased DSBs also in the MM context.
Figure 1. DIS3 loss triggers genomic instability.

- Enrichr screenshot of biological processes in which are involved the top 1% of genes whose expression varies together with the deregulation of DIS3.
- DIS3 expression in total cell lysates of control (siCTRL) and DIS3 U2OS silenced cells (siDIS3) was analyzed by Western blot upon rescue with empty vector (EV) or DIS3 expressing vector (DIS3). Lamin B was used as the loading control.
- Representative images of comet assays performed under alkaline conditions in U2OS cells transfected with siCTRL or siDIS3 and then infected with a vector expressing DIS3 (DIS3) or an empty vector (EV). Quantitative analysis of comet tail lengths for each condition. Plots represent three biological replicates, with more than 150 cells for each point. The analysis is performed using Casplab software, error bars indicate s.e.m. (n = 3). ****P‐value < 0.0001. ns—not statistically significant, two‐way ANOVA, scale bar is 200 μm.
- Immunostaining against RPA in U2OS cells transfected with siCTRL or with siDIS3 and 48 h later infected with a vector expressing DIS3 (DIS3) or an empty vector (EV). The averages of foci number per cell were calculated from three independent experiments using Cell Profiler software. At least 150 cells were counted for each point, error bars indicate s.e.m. (n = 3). *P‐value < 0.05. ns—not statistically significant, two‐way ANOVA, scale bar is 10 μm.
Figure 2. DIS3 silencing affects genome integrity by increasing DNA:RNA hybrids.

- Immunostaining with S9.6 (green) and DAPI (blue) in U2OS cells, transfected for 48 h with siCTRL or siDIS3 and then mock‐treated (UNTR) or treated with RNase H or RNase III for 1 h before fixation. Histograms show S9.6 signal intensity per cell, error bars indicate s.e.m. (n = 3, biological replicates). More than 150 cells were counted, and error bars indicate s.e.m. (n = 3 biological replicates). ****P < 0.0001, ***P < 0.001, ns—not statistically significant, two‐way ANOVA, scale bar is 10 μm.
- Immunostaining with J2 (green) and DAPI (blue) in U2OS cells, as in panel A. More than 150 cells were counted, and error bars indicate s.e.m. (n = 3 biological replicates). For all conditions, differences between siCTRL and siDIS3 were not statistically significant, two‐way ANOVA, scale bar is 10 μm.
- Dot blot analysis of DNA:RNA hybrids formation: serial dilutions (750 ng, 375 ng, 187.5 ng, 93.75 ng, 46.87 ng) of genomic DNA extracted from WT or DIS3 silenced U2OS cells and pretreated with RNase H, RNase III or mock‐treated, were arrayed on a membrane and probed using the S9.6 antibody. The histogram shows the S9.6 signal quantification in three biological replicates, error bars indicate s.e.m., normalized on SYBR®‐Gold signal (Adj. Vol.), using Image lab software. ***P < 0.001, **P < 0.01, ns—not statistically significant, two‐way ANOVA.
- DRIP‐qPCR analysis at four different R‐loops sites, RPL13A, ACTB, ENSA, and TRIM33 in U2OS cells transduced with shScr or shDIS3 and treated or not with RNase H. Results are shown as mean + s.e.m of three independent experiments.****P < 0.0001, ***P < 0.001, *P < 0.05, two‐way ANOVA.
- Representative pictures of comet assays performed under alkaline conditions in U2OS cells transfected for 48 h with siCTRL or siDIS3, untreated (UNTR) or treated with RNase H (RNase H). Tail moments analysis was performed using Casplab software, error bars indicate s.e.m. Plots represent three biological replicates, with 150 cells for each cell line. ****P < 0.0001, ns—not statistically significant, two‐way ANOVA, scale bar is 200 μm.
Figure EV1. DIS3 loss increases DNA damage and ssDNA in multiple myeloma cells.

- Representative pictures of comet assays performed under alkaline conditions in RPMI‐8226 cells. Data presented are from the same experiments reported in Fig EV2D. Analysis was performed using Casplab software, error bars indicate s.e.m. (n = 3 independent experiments, 50 cells for each shRNA). ****P < 0.0001, two‐way ANOVA, scale bar is 20 μm.
- Western blot of DIS3, RPA, phospho‐RPA levels in RPMI‐8226 cells, 72 h after infection with control shRNA (shScr) or shRNA targeting (shDIS3).
Source data are available online for this figure.
Figure EV2. DNA:RNA hybrids accumulate in cells after DIS3 depletion and induce genome instability.

- Immunostaining with S9.6 (green) and DAPI (blue) in U2OS cells, infected with control shRNA (shScr) or shRNA against DIS3 (shDIS3) and then treated (RNase H) or not (UNTR) with RNase H for 1 h. Histograms show S9.6 signal intensity per cell, either in the nucleus or in the cytoplasm. More than 100 cells were counted in each replicate, error bars indicate s.e.m. (n = 3 biological replicates). ****P < 0.0001, ns—not statistically significant one‐way ANOVA, scale bar is 10 μm.
- Immunostaining with S9.6 (green) and DAPI (blue) in RPMI‐8226 cells, infected with control shRNA (shScr) or shRNA against DIS3 (shDIS3) and then treated (RNase H) or not (UNTR) with RNase H for 1 h. Histograms show S9.6 signal intensity per cell. More than 100 cells were counted in each replicate, error bars indicate s.e.m. (n = 3 biological replicates). ****P < 0.0001, ns—not statistically significant one‐way ANOVA, scale bar is 10 μm.
- Immunostaining with S9.6 (green), anti‐DDX21 (Sordet et al, 2009), and DAPI (blue) in shScr and shDIS3 infected cells, before (‐4OHT) and after (+4OHT) damage induction, and treatment (RNase H) or not (UNTR) with RNase H for 1 h. Histograms below show the median of the S9.6 signal intensity per nucleus after nucleolar signal removal, using Cell Profiler software. 150 cells were counted in each replicate, error bars indicate s.e.m. (n = 3). ****P < 0.0001, ns—not statistically significant one‐way ANOVA, scale bar is 10 μm.
- Representative pictures of comet assays performed under alkaline conditions in RPMI‐8226 cells, treated (RNase H) or not (UNTR) with RNase H. Relative comet tail moments are plotted for shScr (black circles) and shDIS3 (red circles). Data presented are from the same experiments reported in Fig EV1A. Analysis was performed using Casplab software, error bars indicate s.e.m. (n = 3 independent experiments, 50 cells for each shRNA). ****P < 0.0001, ns—not statistically significant, one‐way ANOVA, scale bar is 20 μm.
Besides the increase in DNA damage, we asked whether DIS3 depletion was also able to induce the accumulation of single‐stranded DNA (ssDNA). Indeed, immunofluorescence staining revealed that upon DIS3 depletion, there was a strong increase in the number of cells showing RPA foci, a marker used to detect ssDNA (Fig 1D). Again, RPA positivity decreased after re‐expression of DIS3. We assessed ssDNA using a different method, with another silencing approach in a different cellular setting and a Western blot using a different antibody directed against phospho‐RPA confirmed the increase in ssDNA also in RPMI‐8226 cells after DIS3 silencing with shRNA (Fig EV1B).
Overall, these results suggest that DIS3 loss increases DSBs and ssDNA levels, dramatically impairing genome stability.
DIS3 depletion increases DNA:RNA hybrids leading to genomic instability
One of the events responsible for the simultaneous increase in DSBs and ssDNA accumulation is R‐loop formation. We, therefore, asked whether the inactivation of DIS3 was associated with the regulation of R‐loop levels. To this end, we stained U2OS cells with the S9.6 monoclonal antibody, which specifically recognizes the DNA:RNA hybrid component of the R‐loops. In line with the previous reports (Sollier & Cimprich, 2015; Shen et al, 2017; Choi et al, 2018), we detected the immunofluorescence signal for S9.6 mostly in the nucleus and more faintly in the cytoplasm. DIS3 depletion elicited a robust increase of the S9.6 signal in both compartments (Figs 2A and EV2A). We assessed the impact of DIS3 inactivation on the levels of DNA:RNA hybrids also in MM cells, where we confirmed a strong overall increase of the S9.6 signal in this cellular setting (Fig EV2B).
RNase H selectively degrades DNA:RNA hybrids (Skourti‐Stathaki et al, 2011). To assess the specificity of the signal, we thus performed immunofluorescence staining in the presence of RNaseH. Previous reports have shown how mammalian cells tolerate transient membrane permeabilization and treatment with various RNases (Pryde et al, 2005; Francia et al, 2012). We thus permeabilized and treated cells with RNase H and, after fixation, we stained them with the S9.6 antibody. We found that the immunofluorescence S9.6 signal was markedly reduced upon RNase H treatment, especially in the cells knocked down for DIS3, where the difference in the S9.6 signal between DIS3 silenced and control cells was completely ablated (Figs 2A and EV2A–C). Of note, it was previously reported that S9.6 can also recognize dsRNAs (Phillips et al, 2013). Therefore, to exclude that S9.6 may also report dsRNAs, we treated the cells with a different RNase, RNase III, which degrades dsRNA substrates without affecting DNA:RNA hybrids (Hartono et al, 2018). Immunofluorescence experiments revealed that RNase III did not impact the S9.6 signal (Fig 2A). To confirm that dsRNA were degraded after RNase III, we quantified these structures before and after treatment with this enzyme, by staining cells with the J2 antibody, which specifically recognizes RNA:RNA (Hartono et al, 2018). As expected, the treatment with RNase III reduced the J2 signal in all cells, while RNase H had no effect (Fig 2B). Importantly, no changes in the J2 immunofluorescence signal were apparent after DIS3 loss (Fig 2B), suggesting that indeed DIS3 depletion specifically increases the levels of DNA:RNA hybrids, without affecting dsRNAs.
To confirm the role of DIS3 in regulating DNA:RNA hybrids, we quantified their levels with a dot blot approach. In line with the immunofluorescence results, we found a robust increase in DNA:RNA hybrids signal after DIS3 depletion (Fig 2C). We also tested RNase H and RNase III treatment in this setting. While RNase III had no effect, RNase H almost entirely ablated the dot blot signal, further confirming the specificity of S9.6 antibody staining. Overall, these results demonstrate that DIS3 loss selectively increases the levels of DNA:RNA hybrids without affecting dsRNA.
Previous studies have suggested that DNA:RNA hybrids accumulate in several loci throughout the genome, including at the mammalian Ig class‐switch region in activated B lymphocytes (Pefanis et al, 2014), at the mitochondrial origin of replication (Xu & Clayton, 1996), over intergenic and/or repetitive regions, such as rDNA (Nadel et al, 2015) and at telomeric region (Graf et al, 2017). Additionally, R‐loops form at CpG Isalnd promoters and are directly implicated in the transcriptional termination of some human genes (Skourti‐Stathaki et al, 2011). We thus investigated the impact of DIS3 knockdown on DNA:RNA hybrids formation at four loci (RPL13A, ACTB, ENSA, and TRIM33) that have been previously shown to exhibit prominent R‐loop peaks. Specifically, in RPL13A DNA:RNA hybrids accumulate on the gene body, while TRIM33 represents a lncRNA promoter, and ACTB and ENSA transcriptional pause site regions. We found that DIS3 knockdown significantly increased R‐loops in all these regions (Fig 2D), an increase that was ablated by RNase H treatment. Altogether, these data suggest that DIS3 controls DNA:RNA hybrid levels in several locations throughout the genome.
We next sought to causally link the accumulation of hybrids with the increase in DSBs observed in DIS3 knocked down cells. To this end, we assessed the presence of DNA damage with the comet assay after treatment with RNase H (Fig 2E). RNase H significantly reduced the comet tail moment in DIS3‐silenced cells, abolishing the differences with control cells. This suggests that the accumulation of DNA:RNA hybrids is indeed responsible for the increase in DNA breaks in DIS3‐depleted cells.
We then explored whether RNase H had a similar effect in MM cells knocked down for DIS3. Treatment of the MM cells RPMI‐8226 with RNase H ablated DNA damage in DIS3 silenced cells, to a point where the comet tail moment was similar between control and silenced cells (Fig EV2D).
In all, our results suggest that DIS3 exerts an important role in the maintenance of genome integrity through the control of intracellular levels of DNA:RNA hybrids. Accordingly, its depletion dramatically increases hybrid levels eliciting DNA damage and impairing genome integrity.
DIS3 loss hampers DNA repair impairing homologous recombination
Based on the intense DNA damage emerging from DIS3 inactivation, we anticipated that the cells would attempt to repair these DNA lesions, to reduce the accumulation of DNA‐free ends, highly recombinogenic and thus threatening to cellular survival. One of the major enzymes recruited to DNA lesions is RAD51, which promotes homologous pairing, strand invasion, and ligation of free ends. Unexpectedly, however, we found that the number of RAD51 foci was comparable in the control and DIS3 deficient cells (Fig 3A). Even more surprising, after the exposure of the cells to γ irradiation (IR), the anticipated increase in the RAD51 foci formation was absent in DIS3 silenced cells, unlike control cells which presented the expected robust response (Fig 3A).
Figure 3. DIS3 is required for efficient homologous recombination repair.
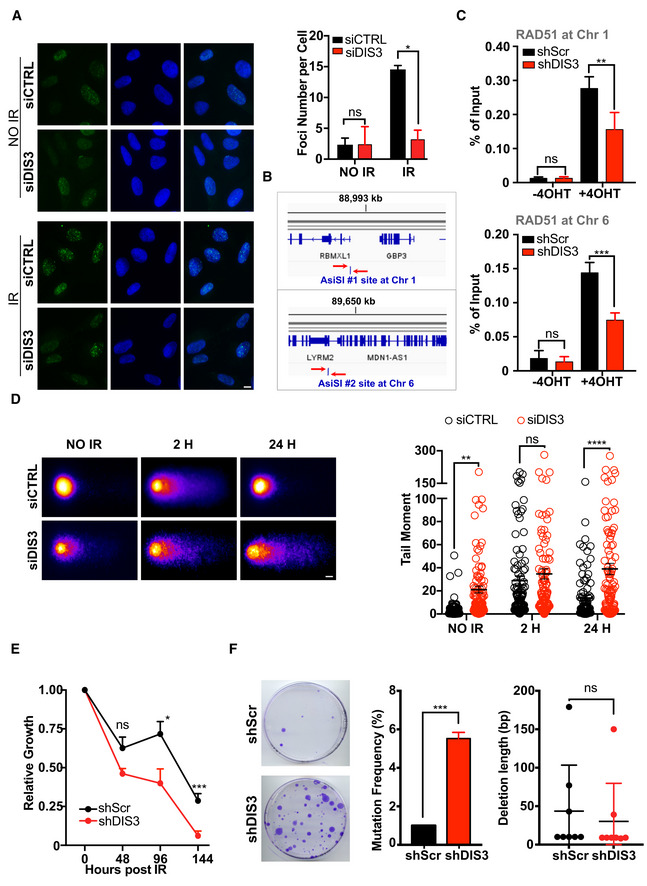
- U2OS cells were transfected with siCTRL or with siDIS3 and 48 h later were irradiated (IR) or left untreated (NO IR). Cells were fixed 4 h after IR and stained for RAD51. Histograms show foci number per cell, analyzed with Cell Profiler. The average number of foci per cell was calculated from three independent experiments. At least 200 cells were counted for each point, error bars indicate s.e.m. (n = 3). *P < 0.05, two‐way ANOVA, ns—not statistically significant, scale bar is 10 μm.
- Design of qPCR primers for measurement of RAD51 and BRCA1 recruitment at two AsiSI sites (red arrows) located on Chromosome 1 and Chromosome 6.
- ChIP against RAD51 was performed in DIvA cells, infected with scramble shRNA (shScr) or shRNA specific for DIS3 (shDIS3), before (− 4OHT), and after (+ 4OHT) 4OHT administration. Immunoprecipitated was analyzed by qPCR with primers specific for two AsiSI sites, on chromosomes 1 and 6. Results are expressed as the percentage of input. Error bars represent the s.e.m. of three independent experiments. **P < 0.01, ***P < 0.001, ns—not statistically significant, one‐way ANOVA.
- Representative pictures of alkaline comet assays performed in U2OS silenced (siDIS3) or not (siCTRL) for DIS3, at sequential time points after exposure to 3 Gy irradiation. Relative comet tail moments were plotted for siCTRL (black circles) and siDIS3 (red circles). Analysis was performed using Casplab software, error bars indicate s.e.m. Plots represent three biological replicates, with more than 150 cells for each siRNA. ****P < 0.0001, **P < 0.001, ns—not statistically significant, two‐way ANOVA, scale bar is 20 μm.
- Growth curves of DIS3 WT and DIS3 silenced cells U2OS irradiated with 3 Gy, 72 h after lentiviral infection with specific shRNAs. The relative growth was assessed by trypan blue exclusion at different time points after irradiation. Values were normalized against cells not irradiated. Results are shown as mean + s.e.m of three independent experiments. ***P < 0.001, *P < 0.05, ns—not statistically significant, two‐way ANOVA.
- Representative images of HPRT‐negative mutants in HT1080 cells infected with scramble shRNA (shScr) or shRNA against DIS3 (shDIS3). Histograms show the mutation frequency and the deletion length of DIS3 WT (shScr) and DIS3 depleted cells (shDIS3) after I‐SceI induced DSB. Error bars represent s.e.m. (n = 3). ***P < 0.001, ns—not statistically significant Student t‐test.
We reasoned that this phenomenon could stem either from reduced levels of RAD51 after DIS3 depletion, or an inability of the protein to reach and bind DNA damage. We ruled out the first option, as the overall RAD51 protein levels were not different between DIS3 knocked down and control cells (Fig EV3B). Additionally, to exclude that DIS3 knockdown might impact the transcription of RAD51 and other DNA repair genes, we analyzed published RNA‐seq data (Davidson et al, 2019), where an auxin‐inducible degron (AID) system was used to eliminate an AID‐tagged DIS3. None of the main genes involved in DNA repair, as well as in R‐loop processing (Gómez‐González & Aguilera, 2019), did show any relevant expression change (Fig EV4D), confirming our previous findings of a modest impact of DIS3 on mRNA transcription (Segalla et al, 2015).
Figure EV3. DIS3 loss does not affect DDR foci formation.

- U2OS cells were transfected with siCTRL or with siDIS3. 48 h later, cells were 3 Gy irradiated or left untreated (NO IR), fixed, and probed for MDC1, pS/TQ, pATM, and γH2AX at different time points (hours) after irradiation. Histograms show quantification of the average foci number per cell with Cell Profiler. At least 200 cells were counted for each point, error bars indicate s.e.m. (n = 3 biological replicates). Differences between control and DIS3 silenced cells for each antibody tested were not statistically significant, two‐way ANOVA, scale bar is 10 μm.
- RAD51 and BRCA1 protein levels were assayed by western blot. Lamin B was used as a loading control.
Figure EV4. Cell cycle progression and NHEJ processes are not impaired in DIS3 silenced cells.

- Immunostaining of DNA‐PK (upper panel) and 53BP1 (lower panel) in U2OS cells transfected with siCTRL or with siDIS3, at different time points (0.5, 2, 24 h) after exposure to 3 Gy irradiation or not irradiated (NO IR). Histograms show the average foci number per cell, analyzed with Cell Profiler. At least 200 cells were counted for each point, error bars indicate s.e.m. (n = 3 biological replicates,). Differences between control and DIS3 silenced cells for each antibody tested were not statistically significant, two‐way ANOVA, scale bar is 10 μm.
- Cell cycle analysis of U2OS control cells compared to DIS3 silenced cells, using propidium iodide (PI) staining, and flow cytometry. FACS analysis was performed 48 h after transfection.
- Cyclin A level assessed by western blot analysis in CTRL and DIS3 depleted U2OS cells. Lamin B was loaded as the loading control.
- Log fold change (log FC) before and after DIS3 ablation (RNA‐seq data from 44 of various proteins belonging to R‐loop processing and DNA repair mediators45).
We hence explored whether the binding of RAD51 to regions of the genomes harboring DSBs was indeed reduced after DIS3 loss. To this end, we exploited the DIvA (DSB inducible via AsiSI) U2OS cellular system, where 4OHT induces the nuclear localization of the AsiSI restriction enzyme, to generate DSBs at specific locations (Iacovoni et al, 2010). ChIP‐qPCR experiments on sites where RAD51 is preferentially recruited upon AsiSI cutting (Aymard et al, 2014) confirmed that RAD51 was efficiently recruited at DSBs in control cells. However, RAD51 binding was severely reduced because of DIS3 silencing (Fig 3C). We then explored whether such impaired recruitment was due to defective activation of the DNA damage response upstream. This was not the case, as demonstrated by the efficient formation of the DNA damage response (DDR) foci (as assessed with immunofluorescence for MDC1, pATM, pS/TQ, γH2AX foci) in γ irradiated DIS3 knocked down compared with control cells (Fig EV3A). These results suggest that DIS3 depleted cells properly sense the damage but are unable to induce the downstream pathway required to activate RAD51 and allow the repair of DSBs.
Two main pathways are responsible for DSBs repair: error‐free homologous recombination (HR), based on the RAD51 activity, and error‐prone nonhomologous end‐joining (NHEJ), involving 53BP1 and DNA‐PK proteins. Of note, HR occurs during the S/G2 cell cycle phase, while NHEJ intervenes during G1. We then explored whether the NHEJ pathway was affected following DIS3 silencing. To this end, we assessed the relocalization of 53BP1 and DNA‐PK after induced DNA damage. Immunofluorescence experiments revealed that DIS3 silencing did not affect 53BP1 and DNA‐PK foci formation kinetic after DSBs induction (Fig EV4A). Moreover, we did not observe any alteration in cell cycle distribution between control and DIS3 silenced cells suggesting that the selective impairment of the HR repair pathway upon DIS3 depletion was not a consequence of the arrest of the cells in specific cell cycle phases (Fig EV4B and C).
We then aimed to confirm that cells lacking DIS3 are unable to properly repair their damaged DNA. Beyond the increase in DNA damage, exposure to γ irradiation increased DNA damage in DIS3 silenced cells, to levels comparable with WT cells (Fig 3D). However, 24 h after irradiation, control cells had repaired most of the DSBs, since the tail moment returned to basal levels. Conversely, DNA damage levels remained high even 24 h following irradiation in DIS3 deficient cells, suggesting an impairment in break repair. To corroborate these results, we exposed the cells to a different source of DNA damage, exploiting a second cellular model, the AID‐DIvA AsiSI cells, whereby AsiSI‐ER is also fused to an auxin‐inducible degron (AID; Aymard et al, 2014). In this system, the activity of the AsiSI restriction enzyme could be modulated through the administration of auxin which degrades the enzyme, allowing the repair to take over. We thus silenced DIS3 in these cells, treated them with 4OHT for 4 h to induce the nuclear translocation of AsiSI and the ensuing DSBs formation, and then we added auxin to stop the DNA damage. As anticipated, the addition of auxin restored DNA integrity in the control cells, as assessed with the comet assay. Instead, DSB repair was dramatically impaired after DIS3 depletion (Fig EV5A). In agreement, we also found that DIS3 depleted cells showed a significantly reduced growth after DSB induction, compared with control cells (Figs 3E and EV5B), consistent with an impairment in DNA repair potential of DIS3 knocked down cells (Surova & Zhivotovsky, 2013).
Figure EV5. DIS3 loss hampers DSBs repair.

- Representative pictures of comet assays performed under alkaline conditions in AID‐DIvA cells infected with control shRNA (shScr) or shRNA against DIS3 (shDIS3), treated with 4OHT for 4 h to induce DSBs followed by treatment with auxin for 2 h to allow DSBs repair. Plots represent three biological replicates, with 100 cells for each point, error bars indicate s.e.m. The analysis is performed using Casplab software. ****P < 0.0001, *P < 0.05, ns—not statistically significant, two‐way ANOVA, scale bar is 20 μm.
- AID‐DIvA cells silenced (shDIS3) or not (shScr) for DIS3 were treated with 4OHT for 4 h to induce DSBs. The relative growth (+ 4OHT/− 4OHT) was assessed by trypan blue exclusion at different time points after 4OHT administration. Results are shown as mean + s.e.m. of three independent experiments. **P < 0.01, *P < 0.05 two‐way ANOVA.
Impaired HR leads to increased mutational burden (Pfister et al, 2014). We then tested whether DIS3 loss was associated with an increased mutational burden. To this end, we exploited a cellular model presenting an I‐SceI‐cleavable reporter assay, engineered within the human endogenous HPRT gene (Fig 3F). In this system, I‐SceI induction generates a DSB which, if inaccurately repaired, produces selectable HPRT‐negative mutants (Pfister et al, 2014). We thus depleted DIS3 in these cells and measured the frequency of HPRT inactivation (a proxy of mutational frequency) following I‐SceI‐induced DSBs. Knockdown of DIS3 profoundly increased I‐SceI‐induced mutation frequency compared with cells infected with a control shRNA (Fig 3F). These findings closely resemble those observed upon inactivation of other HR proteins, including RAD51 itself (Ahrabi et al, 2016), suggesting that the inactivation of DIS3 increases mutational burden through inaccurate DNA repair.
Taken together, these results strongly support the notion that DIS3 exerts a crucial role in repairing DSBs and in suppressing DNA break‐induced mutations through direct modulation of the homologous recombination pathway.
DIS3 loss induces a state reminiscent of BRCAness, dependent on DNA:RNA accumulation
The phenotype seen in DIS3 deficient cells is reminiscent of the so‐called “BRCAness” status, a condition whereby BRCA1 is not functional as a consequence of BRCA1 mutations or is not present as a result of the hypermethylation of BRCA1 promoter (Tirkkonen et al, 1997; D'Andrea & Grompe, 2003; Venkitaraman, 2004). BRCAness is not only linked to BRCA1 and BRCA2 genetic or epigenetic alterations (Turner et al, 2004) but also may arise as a result of, or mutations in, other genes involved in HR, such as germline mutations in PALB2, hypermethylation of RAD51C promoter, and also TP53 mutations (Domagala et al, 2017; Polak et al, 2017).
Hence, we surmised that DIS3 inactivation might induce a status reminiscent of the BRCAness identified in breast cancer. To address this question, we thus assessed BRCA1 activity by quantifying the BRCA1 foci formation after exposure to irradiation (Fig 4A). BRCA1 foci were efficiently induced after irradiation in control cells. Despite similar BRCA1 protein levels (Fig EV3B), BRCA1 foci were reduced in cells silenced for DIS3 (Fig 4A). As in the case of RAD51, we then sought to determine whether BRCA1 was unable to bind DNA damage sites after DIS3 knockdown. ChIP‐qPCR experiments revealed that BRCA1 was engaged at the assayed AsiSI sites upon DNA damage induction, yet the binding was reduced in the absence of DIS3 (Fig 4B). In all, these results suggest that the binding of BRCA1 to DSBs is markedly reduced in DIS3 depleted cells.
Figure 4. DIS3 loss induces BRCAness through DNA:RNA hybrids accumulation.

- U2OS cells were transfected with siCTRL or with siDIS3 and 48 h later were 3 Gy irradiated (IR) or left untreated (NO IR). Cells were fixed 4 h after IR and stained for BRCA1. Histograms show foci number per cell, analyzed with Cell Profiler. The average number of foci per cell was calculated from three independent experiments. At least 200 cells were counted for each point, error bars indicate s.e.m. (n = 3 biological replicates). **P < 0.01, ns—not statistically significant, two‐way ANOVA, scale bar is 10 μm.
- ChIP analysis was performed in DIvA cells, infected with scramble shRNA or shRNA against DIS3, before (− 4OHT) and after (+ 4OHT) 4OHT treatment, using an anti‐BRCA1 antibody. Immunoprecipitated was analyzed by qPCR with primers specific for two AsiSI sites, on chromosomes 1 and 6. Results are expressed as the percentage of input. Error bars represent the s.e.m. of three independent experiments. *P < 0.05, ns—not statistically significant, one‐way ANOVA.
- Representative images of BRCA1 staining on U2OS cells transfected with siCTRL or with siDIS3. 48 h after transfection cells were irradiated and 4 h later were treated with RNase H or left untreated (UNTR). Histograms show the average foci number per cell from three independent experiments analyzed with Cell Profiler. At least 200 cells were counted for each point, error bars indicate s.e.m. (n = 3). **P < 0.01, ns—not statistically significant, one‐way ANOVA, scale bar is 10 μm.
- Representative pictures of comet assays performed under alkaline conditions in U2OS cells, silenced (siDIS3) or not (siCTRL) for DIS3 untreated (UNTR) or treated with RNase H (RNase H). Relative comet tail moments are plotted for siCTRL (black circles) and siDIS3 (red circles). Analysis was performed using Casplab software, error bars indicate s.e.m. Plots represent three biological replicates, with 150 cells for each siRNA. ****P < 0.0001, one‐way ANOVA, scale bar is 20 μm.
- U2OS cells silenced (shDIS3) or not for DIS3 (shScr) were treated with Olaparib for 72 h and viable cell counts were determined by Trypan blue exclusion. Data showed the percentage relative to the untreated cells of three independent experiments. ***P < 0.001, ns—not statistically significant, two‐way ANOVA.
We then explored whether DNA:RNA hybrid accumulation, driven by the loss of DIS3, is implicated in the binding of BRCA1 to DSBs. To this end, control and DIS3 silenced cells were exposed to irradiation and, after 3 h, permeabilized, treated with RNase H, and stained for BRCA1. We found that RNase H treatment restored BRCA1 foci in DIS3 depleted cells, suggesting that the impaired BRCA1 foci formation in DIS3 knocked down cells is caused by the accumulation of DNA:RNA hybrids (Fig 4C). To determine whether the rescue of BRCA1 activity was sufficient to restore DSBs repair, we monitored DNA damage of DIS3 silenced cells irradiated and treated with RNase H. We found that the RNase H treatment abolished differences in DNA damage among control cells and DIS3 deficient cells (Fig 4D). Overall, our results demonstrate that DIS3 depletion induces a BRCAness state, whereby BRCA1 activity is impaired as a consequence of DNA:RNA hybrids accumulation. The elimination of the excess of the DNA:RNA hybrids rescues genome integrity, likely through the restoration of BRCA1 activity.
Cancer cells mutated for BRCA1, or more broadly bestowed with a BRCAness status, are particularly sensitive to poly(ADP‐ribose) polymerase inhibitors (PARP) inhibition (Ratta et al, 2020). We thus asked whether DIS3 depletion increases the sensitivity to PARP inhibitors. To this end, we exposed U2OS cells to various concentrations of FDA‐approved PARP inhibitor Olaparib. We found that Olaparib treatment profoundly decreased the cell viability of DIS3‐silenced cells compared with control cells (Fig 4E).
Altogether, these results demonstrate that DIS3 loss induces a BRCAness condition driven by the accumulation of DNA:RNA hybrids at the sites of DNA damage, which could be exploited for therapeutic purposes.
DIS3 promotes DNA:RNA hybrids clearance at DSBs
A large body of evidence suggests that DNA:RNA hybrids specifically accumulate at sites of DNA damage (Ohle et al, 2016; Cohen et al, 2018; Lu et al, 2018). To determine whether DIS3 has a direct role in locally regulating these structures, we first examined its recruitment to DSBs by carrying out laser micro‐irradiation experiments. Immunofluorescence experiments with antibodies recognizing DIS3 and γH2AX, to visualize the damaged regions, revealed enrichment of DIS3 on the laser path, suggesting that DIS3 accumulates at the site of laser‐induced damage (Fig 5A–C). To further investigate the recruitment of DIS3 to sites of DNA damage, we performed a ChIP experiment against a tagged form of DIS3 on DIvA cells, before and after DSBs induction and we quantified DIS3 enrichment on AsiSI sites by qPCR. We found that DIS3 accumulated on the AsiSI sites after DNA damage induction (Fig 5D). We then tested whether DIS3 recruitment at DSBs was mediated by the presence of DNA:RNA hybrids accumulating at DNA damage lesion sites. To answer this question, we induced damage in U2OS cells overexpressing DIS3 in the presence of RNase H. RNase H treatment significantly reduced DIS3 recruitment at damage sites (Fig 5E). Overall, these data demonstrate that DIS3 is recruited to sites of DNA damage and that its recruitment depends on DNA:RNA hybrids formation.
Figure 5. DIS3 ensures DSBs repair by controlling DNA:RNA hybrid levels at damage sites.

- Representative confocal images upon irradiation with the 405 nm laser. U2OS cells were presensitized with BrdU for 24 h, micro‐irradiated, fixed after 10 min, and stained with antibodies against γH2AX and DIS3 scale bar is 10 μm.
- Magnification image of the white box in panel A.
- Intensity profiles of γH2AX (green) and DIS3 (Sordet et al, 2009) signals through the yellow line in panel B. Quantification is performed with ImageJ software scale bar is 10 μm.
- ChIP using anti‐flag antibody performed in DIvA cells, infected with a vector expressing DIS3 (DIS3) or an empty vector (EV), exposed (+) or not (−) to 4OHT for 4 h. Immunoprecipitated was analyzed by qPCR with primers specific for two AsiSI sites, on chromosomes 1 and 6. Results are expressed as the percentage of input. Error bars represent the s.e.m. of three independent experiments. **P < 0.01, *P < 0.05, two‐way ANOVA.
- ChIP was performed on DIS3 overexpressing DIvA cells treated or not with RNase H, 3 h after exposure to 4OHT. Results are expressed as the percentage of input. Error bars represent the s.e.m. of three independent experiments. **P < 0.01, *P < 0.05, two‐way ANOVA.
- DRIP‐qPCR analysis at the AsiSI sites on chromosomes 1 and 6 in DIvA cells depleted (shDIS3) or not (shScr) for DIS3, before (‐4OHT) and after (+4OHT) damage induction. Results are expressed as the percentage of input. Error bars represent the s.e.m. of three independent experiments. **P < 0.01, *P < 0.05, two‐way ANOVA.
To assess whether DIS3 processes DNA:RNA hybrids at damage sites, we quantified hybrids levels at DSBs with a DRIP qPCR in DIvA cells. In line with the recent literature (Cohen et al, 2018; Lu et al, 2018), we found that DNA:RNA hybrids efficiently form at AsiSI sites upon DSBs induction (Fig 5F). Interestingly, upon DIS3 depletion, DNA:RNA hybrids levels further increased, implying a crucial role of DIS3 in regulating DNA:RNA hybrids levels at DSBS.
Altogether, our data suggest that DIS3 is recruited at damage sites and actively involved in the degradation of DNA:RNA hybrids formed upon DSBs induction.
DIS3 mutants display higher DNA damage and DNA:RNA hybrids accumulation
Since DIS3 is mutated in MM, with a pattern of mutations reminiscent of a tumor suppressor gene, we then explored whether MM cell lines endowed with mutated DIS3 were associated with reduced genome integrity, enhanced DNA damage, and altered DNA:RNA hybrid metabolism, as described before in U2OS cells and MM cell lines upon DIS3 knockdown. To this end, we took advantage of two MM cell lines, PCM6 and OPM2, which carry the R780K DIS3 mutation, the most frequent mutational hot spot found in MM patients and Y121S mutation, respectively. We first investigated whether DIS3 mutations are associated with genome instability. Comet assay analysis revealed that PCM6 and OPM2 presented a much higher DNA damage when compared with cell lines wild type for DIS3 (Fig 6A). Importantly, RNase H treatment significantly reduced the comet tails in PCM6 and OPM2 abolishing differences in DNA damage between DIS3 mutated and wild‐type cells (Fig 6A). These data suggest that DIS3 mutations induce genome instability which appears linked to R‐loops accumulation.
Figure 6. DIS3 mutants show increased genomic instability, DNA:RNA hybrids accumulation, and interferon activation.

- Representative pictures of comet assays performed under alkaline conditions in DIS3 WT MM cell lines MM.1S and RPMI‐8226 (RPMI), and in DIS3 mutated MM cell lines PCM6 and OPM2, untreated (UNTR) or treated with RNase H (RNase H). Tail moments analysis was performed using Casplab software, error bars indicate s.e.m. Plots represent three biological replicates, with 150 cells for each cell line. ****P < 0.0001, ns—not statistically significant, two‐way ANOVA, scale bar is 20 μm.
- Immunostaining with S9.6 (green) and DAPI (blue) in MM.1S, RPMI‐8226, PCM6, and OPM2 cells, treated (RNase H) or not (UNTR) with RNase H for 1 h. Histograms show S9.6 signal intensity per cell. More than 150 cells were counted, error bars indicate s.e.m. (n = 3 biological replicates). ****P < 0.0001, one‐way ANOVA, scale bar is 10 μm.
- DRIP‐qPCR analysis at four different R‐loops sites, RPL13A, ACTB, ENSA, and TRIM33 in RPMI‐8226 and OPM2 cells infected with shScr or shDIS3 and treated or not with RNase H. Results are shown as mean + s.e.m of three independent experiments. ****P < 0.0001, **P < 0.01, two‐way ANOVA.
- RPMI‐8226 and PCM6 cells were treated with Olaparib for 72 h and viable cell counts were determined by Trypan blue exclusion. Data showed the percentage relative to the untreated cells of three independent experiments. **P < 0.01, *P < 0.05, ns—not statistically significant, two‐way ANOVA.
We next asked whether DNA:RNA hybrids were indeed increased also in DIS3 mutated cells. Immunofluorescence with the S9.6 antibody revealed a strong signal in PCM6 and OPM2 cells when compared with the DIS3 wild‐type MM cell lines (Fig 6B). Furthermore, RNase H treatment significantly reduced the signal, abolishing the differences between DIS3 mutated and wild‐type cells, suggesting that increased S9.6 signal reflected indeed an increase in DNA:RNA hybrids levels.
We also tested in mutated versus wild‐type MM cell lines, the levels of DNA:RNA hybrids at the RPL13A, ACTB, ENSA, and TRIM33 loci. In DIS3 mutated cells, R‐loops were significantly higher than in wild‐type cells, again an increase that was ablated by RNase H treatment (Fig 6C).
The high frequency of double‐strand breaks in PCM6 suggests that DIS3 mutated cells are impaired in DNA repair, in line with the defects in homologous recombination observed in DIS3 depleted cells. To assess whether DIS3 mutated cells were also impaired in the HR process, we tested the sensibility to PARP inhibitors. We found the PCM6 cell line was exclusively sensitive to PARP inhibitors suggesting that DIS3 mutation induces a BRCAness condition (Fig 6D).
DIS3 mutations elicit a robust interferon response and increased mutational burden in MM tumor cells
Recent reports have demonstrated that DNA:RNA hybrids trigger a robust cellular interferon (IFN) response (Shen et al, 2015). We first asked whether the introduction of wild‐type DIS3 in MM cell lines mutated for DIS3 may reduce the levels of IFN genes. Indeed, overexpression of DIS3 in OPM2 cells strongly reduced the levels of IFN genes, as well as of c‐GAS and STING (Fig 7A). We then asked whether tumor cells from MM patients endowed with DIS3 mutations do show an enhanced expression of interferon‐related genes. To answer this question, we exploited the MMRF CoMMpass dataset, which includes matched mutational and transcriptomic data from 853 MM patients, of which 88 presented mutated DIS3 (Keats et al, 2016 ). We found 4,176 differentially expressed genes (DEGs) between DIS3 mutated (DIS3‐mut) and DIS3 wild‐type (DIS3‐WT) samples (FDR <0.05; Dataset EV1). The functional interpretation of the DEGs using ingenuity pathway analysis (IPA) demonstrated a strong enrichment of genes involved in the IFN signaling, which displayed the highest proportion of dysregulated transcripts among the top 10 differentially modulated IPA canonical pathways (Fig 7B). The transcriptional targets of the IFN signaling canonical pathway, which includes genes involved in both IFN type I (IFN alpha and beta) and type II (IFN gamma) signaling (Fig EV6A), were coherently activated in DIS3‐mut samples, as substantiated by the positive activation z‐score, a metric that predicts activation status of a pathway according to the putative downstream effect of the modulated genes. These data suggest that DIS3 mutations in MM patients result in the activation of the IFN signaling canonical pathway.
Figure 7. DIS3 mutation in patients is associated with upregulation of interferon genes and a higher mutational burden.

-
ARelative mRNA expression level of interferon genes IFI6, ISG15, IFITM1, IFIT3, IFI27, MCL1, cGAS, and STING in OPM2 cells infected with a vector expressing DIS3 (DIS3) or an empty vector (EV). Values are relative to housekeeping gene expression, normalized on EV, and represent SE of three biological replicates. ***P < 0.001, **P < 0.01, multiple t‐tests.
-
B–FDifferentially expressed genes (DEGs) between mutant and WT samples; P‐values are from limma and false‐discovery rate (FDR) is calculated using the Benjamini‐Hochberg procedure; FDR <0.05 was used as cutoff. Functional annotation analysis by IPA of the DEGs between DIS3 mutant and WT samples based on FDR cutoff. (B) The top 10 canonical pathways are represented. Percentage enrichment (bottom) and ‐log 10 P‐value (top) indicate the number of genes belonging to the respective pathways significantly deregulated; the number of genes included in each pathway (right). In red are indicated overexpressed genes, in green downregulated. Dashed red line represents the threshold for enrichment or depletion, orange line represents gene count. (C) Volcano plot of DEGs between mutant and WT samples; labeled genes are the IFN‐related genes with an FDR <0.05 (red horizontal line) and absolute log 2‐fold change above or below 0.5 (red vertical lines), respectively; additional representative IFN‐related genes are also labeled. (D) Differentially Enrichment Score (ES) of IFN pathways between mutant and WT using t‐test and P < 0.05 was used as cutoff. Stacked bar chart showing the number of patients with low (yellow), medium (orange), or high (red) (Sordet et al, 2009) enrichment scores in each significant IFN pathway (left). (E) Hierarchical clustering heatmap of individual samples based on differentially ES of the IFN pathways included in (D); the expression of IFN genes in each pathway is presented. The z‐score was used to indicate the direction of the respective gene expression. Within each group defined by hierarchical clustering, DIS3 mutant and WT samples are contrasted (orange and blue bars respectively). (F) Violin plot of the number of non‐synonymous (NS) mutation load comparison between DIS3 mutant versus DIS3 WT performed on the entire CoMMpass dataset, including 853 MM patients, 88 presenting DIS3 mutations (all samples) and on the CoMMpass dataset, stratified according to the intensity of the IFN responsiveness (clusters C1, C2, C3). Wilcoxon rank‐sum test was used for comparison between DIS3 mutant vs WT. ****P < 0.0001, **P < 0.01, *P < 0.05. Black color dots represent the median in each group.
Figure EV6. Differentially expressed genes between DIS3 mutant and WT samples.

- Canonical Interferon signaling pathways by IPA. The abundance of transcripts that are increased or decreased in DIS3 mutated samples are colored with various intensities according to log2 fold change, represented in red or green, respectively.
- Differentially expressed IFN‐related pathways (N = 14 out of 26 tested) between DIS3 mutant vs DIS3 WT. Enrichment scores of each pathway were compared between DIS3 mutant vs DIS3 WT using a t‐test. FDR is calculated using the Benjamini–Hochberg procedure. Red color dots represent the median value in each group (88 DIS3 mutated DIS3, 765 DIS3 WT samples), the line the interquartile range.
- Log 2 expression of 72 IFN‐related genes belonging to any of the 26 curated IFN signatures and IPA canonical IFN signaling pathways were represented by violin plots (blue, DIS3 WT samples; orange, DIS3 mutant). Red color dots represent the median in each group (88 DIS3 mutated DIS3, 765 DIS3 WT samples), the line the interquartile range.
To define which components of the IFN response were mostly influenced by DIS3 mutations, we dissected the IFN network by performing single sample gene set enrichment analysis (ssGSEA) using 26 curated IFN‐related signatures (see Materials and Methods for details). The large majority (75%) of the differentially expressed IFN‐related genes (i.e., genes belonging to any of the IFN‐related signatures) were upregulated in the DIS3‐mut group (Dataset EV1), as shown also in Fig 7C, where all the IFN‐related genes with an absolute Log 2‐fold change > 0.5 and FDR < 0.05 were labeled together. Furthermore, 14 of the 26 IFN signatures were differentially modulated according to the DIS3 mutational status (FDR < 0.05, Table EV1, Fig EV6B). Notably, these pathways were all pervasively upregulated in the DIS3‐mut group, reflecting the activation of type I and type II IFN, associated with a positive engagement of the antigen presentation machinery (Chapman et al, 2011), which includes many genes IFN inducible. The transcript abundance of significant 72 IFN‐related genes (FDR < 0.05) and belonging to any of the 26 IFN‐related pathways or IPA canonical IFN signaling pathways are represented in Fig EV6C.
Prompted by these results, we sought to quantify the effect of DIS3 mutations on IFN response at a single patient level. When samples were stratified according to the intensity of the IFN responsiveness (i.e., in Low, Medium, and High categories based on enrichment score (ES) tertiles for each of the differentially modulated signatures), we observed that the large majority of DIS3‐mut samples had a High or Medium expression of the aforementioned IFN‐related pathways, while the DIS3 wild‐type ones were equally distributed among the three responsiveness categories (Fig 7D). Moreover, when samples were clustered based on IFN‐related DEGs, they were segregated into three major groups (Fig 7E). The first cluster (INF++) was characterized by a robust and coordinated type I and type II IFN response. The second cluster (INF+) was typified by an intermediate IFN response, mostly related to IFN type II signaling (i.e., IFN‐gamma signature, MHC I, and antigen presentation signature). Finally, IFN signaling was for the most part muted in Cluster 3 (IFN−). Importantly, DIS3 mutated samples were significantly enriched in clusters 1 and 2 (Chi‐square P < 0.00001). In all, these results suggest that DIS3 mutations are associated with a prominent and pervasive interferon type 1 and 2 response in MM patients that could be dependent on hybrids accumulation.
Having demonstrated that hybrids dysfunction induced genome damage and increased mutational load, we explored whether MM cells in patients with DIS3 mutations presented more somatic mutations than cells with wild‐type DIS3. In the CoMMpass dataset, we analyzed the allele frequencies of single nucleotide variations. We found that DIS3 mutated samples displayed a higher mutational burden, with a significant increase in nonsynonymous mutations (Fig 7F). Interestingly, the increase in nonsynonymous mutations was observed both in clusters associated with an interferon‐activated pathway (C1 and C2) and in clusters in which the interferon signaling is more muted (C3), suggesting that the increased mutational load is not related to interferon upregulation.
Overall, our findings indicate that two major consequences of DIS3 mutations in multiple myeloma patients are a strong induction of intrinsic IFN activating state and an increase in somatic mutations.
Discussion
In this study, we have demonstrated that the catalytic component of the RNA exosome, DIS3, frequently mutated in the hematological cancer multiple myeloma, exerts a prominent and widespread role in regulating DNA:RNA hybrids throughout the genome. DIS3 inactivation leads to the accumulation of DNA:RNA hybrids that cause dramatic DNA damage. Additionally, the binding of key homologous recombination repair factors, such as BRCA1 and RAD51 to breakage sites, is hampered by this RNA species, preventing proper DNA repair (Fig 8). Altogether, the accumulation of DNA:RNA hybrids elicited by DIS3 inactivation compounds toward the generation of a rampant genomic instability. These data suggest that DIS3 mutations could drive tumorigenesis not by directly altering transcriptional profiles, but by promoting DNA:RNA hybrids accumulation that triggers genomic instability and increase mutational rate in the heavily rearranged and mutated multiple myeloma genome (Lawrence et al, 2013). We (Segalla et al, 2015) and others (Szczepińska et al, 2015) have previously failed to demonstrate any significant impact of DIS3 loss on the overall levels of mature mRNAs. DIS3 regulates PROMPT RNA species (Preker et al, 2008, 2011; Tomecki et al, 2010; Szczepińska et al, 2015). Additionally, the RNA exosome is an important regulator of some ncRNAs within heterochromatic regions (Reyes‐Turcu et al, 2011). Finally, RNA exosome has been implicated in transcription termination, coupled to RNAPII pausing and arrest (Lemay et al, 2014).
Figure 8. Proposed model of DIS3 activity at DSBs.

Our data strongly suggest that DIS3 tightly regulates the levels of DNA:RNA hybrids. The role of DIS3 in this setting has been controversial, with one study failing to demonstrate an active role of DIS3 in the processing of these RNA species (Domingo‐Prim et al, 2019), but another recent report detailing the role of DIS3 during murine B‐cell development through the regulation of DNA:RNA hybrids (Laffleur et al, 2017).
Herein, we show not only that hybrids increase in human cells after DIS3 loss but also that the same phenotype is observed in the presence of mutated DIS3, the same mutation found in patients. Furthermore, we found that the increase in DNA:RNA hybrids is not accompanied by an increase in dsRNAs, suggesting that the enhanced DNA:RNA hybrids does not arise from a widespread accumulation of RNA species but rather result from a more specific activity of DIS3 at genomic loci.
It has been recently reported that DIS3 modulates DNA:RNA hybrid levels at the immunoglobulin heavy chain (Nadel et al, 2015) loci, where it regulates class‐switch recombination and somatic hypermutation processes during the development of B cells within the germinal centers (Laffleur et al, 2017). Our results support the notion that DIS3 exerts a broader, more comprehensive role, preventing DNA damage and fostering its repair, which is not confined to a single cellular system but is shared among various contexts. We would then argue that the role of DIS3 in myeloma is not confined to the critical step of switch recombination but appears much broader. The recent findings (Cottini et al, 2014, 2015) by our group of the pervasive DNA damage featured by MM cells could be tied to the inactivation of DIS3 in the subset of patients where this gene is mutated.
The role of R‐loops and DNA:RNA hybrids in DNA repair is fascinating (Puget et al, 2019). Some evidence suggests that DNA:RNA hybrids promote DNA repair, acting as a recruitment platform for epigenetic enzymes and factors required for repair, or controlling the speed and the length of the strand resection process (Ohle et al, 2016; Ratta et al, 2020). As a counterpoint, other evidence, including our results, suggests that DNA:RNA hybrids interfere and hamper DNA repair (Ohle et al, 2016; Cohen et al, 2018; Costantino & Koshland, 2018). We propose a model where DNA:RNA hybrids ought to be removed from the sites of DSBs, and that DIS3 exerts a central role in mammalian cells in this regard. It is tempting to speculate that DNA:RNA hybrids are required in the first stages of the DNA repair response, but in the second phase, they become harmful and need to be removed, to allow the proper execution of the DNA repair program. Toward this end, DIS3 is pivotal in mammalian cells, and its inactivation, as it occurs in MM, leads to the accumulation of R‐loops throughout the genome, and in correspondence with DSBs, leading to widespread genomic instability. Accordingly, one of the major conclusions of our study is the finding that DIS3 has a role in the metabolism of DNA:RNA is produced in response to damage at DSBs. We show that the initial accumulation of DNA:RNA hybrids at the damage sites is required for the swift recruitment of DIS3, which in turn is conducive to the subsequent degradation of these structures. As such, DIS3 seems to exert a central role in DNA repair, through its activity toward DNA:RNA hybrids.
As for the mechanism leading to the recruitment of DIS3 to R‐loops, DIS3 encodes a ribonuclease endowed with two different RNase activities, a 3′‐5′ exonucleolytic activity via the RNB domain and an endonucleolytic activity via the PIN domain (Robinson et al, 2015). However, it has been reported the RNA exosome is unable to engage RNA substrates that lack a free single‐stranded 3′ end (Basu et al, 2011; Januszyk & Lima, 2014). DIS3 might rely on RNA‐unwinding proteins, to resolve hybrid structures, thus allowing its access to RNA. One of the main cofactors of the nuclear exosome activity is the TRAMP complex, which contains the RNA helicase MTR4. However, a study has shown how this helicase unwinds RNA duplex but is unable to separate DNA:RNA hybrids (Gu et al, 2016). A yeast two‐hybrid screen has identified the helicase senataxin (SETX) as an interactor of Rrp45, a core subunit of the exosome (Richard et al, 2013). SETX interacts with the sumoylated fraction of Rrp45 also in humans and SETX and RRP45 colocalize in nuclear foci following the induction of transcription‐related DNA damage, suggesting a functional interaction between SETX and the exosome (Richard et al, 2013). Moreover, SETX is recruited specifically at DSBs induced in transcriptionally active genes, which exhibit DNA:RNA hybrids accumulation following DSB induction and its depletion triggered an increase in DSB‐dependent DNA:RNA hybrids accumulation proximally to a DSB (Cohen et al, 2018). Therefore, upon DSB induction, SETX, or potentially the TRAMP complex, might be recruited to damage sites to unwinding hybrids, thus allowing the subsequent degradation by the RNase DIS3.
Interestingly, we showed for the first time that the increase in DNA:RNA hybrids in the tumor cells of MM patients harboring DIS3 mutations leads to a BRCAness status. BRCA genes are the most frequently mutated genes in familial breast and ovarian cancers. The discovery that PARPi selectively targets cancer cells harboring mutations in these genes has been a groundbreaking result, with major clinical implications (Polyak & Garber, 2011). The subsequent finding, that tumors often harbor several hallmark features of cancers mutated for BRCA1 or 2, in the absence of mutations in these genes, has been another unexpected breakthrough. As such, the clinical use of PARPi has been expanded to subsets of other cancers, including tumors as diverse as ovarian, prostate, and pancreatic cancer, with important clinical benefits for the patients whose tumor cells present these features (Bitler et al, 2017; Pant et al, 2019; Shen et al, 2019; Ratta et al, 2020). We have found that DIS3 mutations and inactivation are linked to a BRCAness status in MM cells, adding a large new subgroup of cancer patients which could benefit from the PARPi treatment, a proposition that should be tested in additional studies and ad‐hoc clinical trials.
Another unanticipated aspect of DIS3 mutations uncovered by our study consists in a vigorous interferon activation. The interferon‐mediated antiviral response is classically induced by the presence of foreign DNA in the cytoplasm of the host cell (Sun et al, 2013). Cells derived from DIS3 mutated patients revealed strong upregulation of genes and pathways associated with the type I and II IFN. We surmised that these responses could arise from a dysregulation of DNA:RNA hybrids metabolism, and we propose that this interferon activation status could enhance cell immunogenicity, potentially leading to novel enticing therapeutic opportunities for patients affected by myeloma endowed with DIS3 mutations. Future studies would be needed to explore the consequences of the induction of these pathways.
We have recently shown that MM cells present rampant DNA damage (Cottini et al, 2015) that in a subset of MM patients could be exploited for therapeutic purposes, with ATR inhibitors and ROS inducers (Botrugno et al, 2020). We have now found a third entry point to therapeutically exploit genomic instability in MM. The bewildering and extensive disruption of the normal physiology within MM cells arising from DIS3 mutations, on one site, fosters the evolutionary armamentarium of cancer cells through genomic instability, yet on the other exposes cells to weaknesses that could be exploited for therapeutic purposes, using already established and successful synthetic lethal approaches.
Materials and Methods
Cell culture and irradiation
U2OS cells, DIvA (AsiSI‐ER‐U2OS), AID‐DIvA (AID‐AsiSI‐ER‐U2OS), and HT1080 cells were cultured in Dulbecco's modified Eagle's medium (DMEM; Euroclone, ECM0728L) supplemented with antibiotics, 10% FBS (Thermo Fisher) and either 1 μg/ml puromycin (DIvA cells) or 800 μg/ml G418 (AID‐DIvA cells) at 37°C, under a humidified atmosphere with 5% CO2. For AsiSI‐dependent DSB induction, cells were treated with 300 nM 4OHT (Sigma; H7904) for 4 h. When indicated, 4OHT‐treated cells were washed three times in prewarmed PBS and further incubated with 500 μg/ml auxin (Sigma; I5148). RPMI‐8226, MM1.S cells were cultured in RPMI medium (Euroclone ECB2000L), supplemented with antibiotics and 10% FBS.
siRNA transfection
To silence DIS3, we used Dharmacon SMART pool siRNAs (Dharmacon, Lafayette, CO, USA) specific for DIS3 (cat. noFE5L015405010010) or a SMART pool of scrambled siRNAs (cat. no. D‐001810‐01‐20) as control. U20S plated the day before at 250,000 cells in six‐well plates were transfected by lipofectamine RNAiMAx (Invitrogen, Carlsbad, CA, USA) with siRNAs at a final concentration of 30 nM according to the manufacturer's instructions. DIS3 protein levels and biological effects were studied within 72 h post‐transfection.
Lentiviral infection
To knock down DIS3 expression, pLKO.1 lentiviral vector carrying short hairpin RNAs targeting human DIS3 was used in infection experiments. Nontargeting scrambled shRNA was used as the negative control. The hairpin sequences are provided below:
scrambled shRNA: CAACAAGATGAAGAGCACCAA.
DIS3 shRNA: AAACCCAGGGCTGCCTTGGAAAAG.
To overexpress DIS3, we subcloned the PCR amplified ORF of DIS3 (from Open biosystem, GenBank: BC056143.1) in pLenti‐C‐Myc‐DDK‐IRES‐PUR vectors. Empty Vectors were used as control.
For lentivirus production, HEK293T cells were transfected with the CaCl2 method. To this end, a mix containing 10 μg of transfer vector, 6.5 μg of packaging vector Δr 8.74, 3.5 μg of Env VSV‐G, 2.5 μg of REV, ddH2O to 450 μl, 50 μl of 2.5 M CaCl2, and 500 μl of 2X HBS was added dropwise over a monolayer of HEK293T cells seeded on a 10 cm2 dish. After 16 h, the medium was replaced. 24 h later, the medium containing virus particles was collected, 0.22 μm filtered, and used to transduce cells. The day after, infected cells were selected with puromycin for 3 days (3 μg/ml for RPMI‐8226 and MM1S, 2 μg/ml for U2OS and AID‐DIvA, and 0.5 μg/ml for MO4).
Antibodies
Anti‐H2A.X Phospho (Ser139), (mouse, Biolegend, 1:200 for immunofluorescence; rabbit, abcam ab2893, 2 μg for ChIP); anti‐ATM pS1981 (mouse, Rockland 200‐301‐400, 1:200 for immunofluorescence); anti‐pS/TQ (rabbit, Cell Signalling 2851, 1:200 for immunofluorescence); anti‐53BP1 (rabbit, abcam ab36823, 1:200 for immunofluorescence); anti‐MDC1 (mouse, M2444 Sigma‐Aldrich, 1:200 for immunofluorescence); anti‐BRCA1 (mouse, Santa Cruz Biotechnology (D‐9): sc‐6954, 1:200 for immunofluorescence, 4 μg for ChIP); anti‐RAD51 (rabbit, Santa Cruz Biotechnology, sc‐8349, 1:200 for immunofluorescence, 4 μg for ChIP); anti‐DNA‐PK (rabbit, abcam ab18192, 1:200 for immunofluorescence); anti‐DIS3 (rabbit, proteintech 14689‐1‐AP, 1:1,000 for immunoblotting); anti‐laminB (goat, Santa Cruz Biotechnology sc‐6216, 1:1,000 for immunoblotting), anti‐DNA:RNA hybrids S9.6 (gift from Frederic Chedin and Philippe Pasero 1:100 for immunofluorescence, 0.02 μg/ml for Dot blot); anti‐DDX21 (rabbit, Novus Biological NB 100‐1718, 1:500 for immunofluorescence); anti‐IgG (mouse, Santa Cruz Biotechnology, sc‐2025; rabbit, abcam ab171870); J2 dsRNA (J2; mouse, Merck, 1:200). As secondary antibodies for immunofluorescence: Alexa Fluor 488 (donkey anti‐mouse IgG, 1:1,000), Alexa Fluor 546 (goat anti‐rabbit IgG, 1:1,000). As secondary antibodies for western blot: ECL anti‐mouse IgG, peroxidase‐linked species‐specific F(ab')2 fragment (from sheep), GE Healthcare; ECL rabbit IgG, HRP‐linked whole Ab (from donkey), GE Healthcare; donkey anti‐goat, Santa Cruz Biotechnology sc‐6216.
Immunofluorescence
The immunofluorescence technique was used to study DDR proteins localization at the single cell level and DNA:RNA hybrids formation. Cells were plated on a 13 mm coverslip and transfected as reported. After 24 h, cells were washed twice with PBS, fixed for 10 min in 4% paraformaldehyde, and washed twice in PBS. Permeabilization was performed with 0.3% Triton X‐100 (Sigma‐Aldrich) in PBS. For immunofluorescence staining, coverslips were blocked with 3% bovine serum albumin (BSA) in PBS (blocking solution; 30 min in a wet and dark chamber) and incubated with primary antibodies for 1 h at room temperature. Cells were then washed three times with PBS and incubated with secondary antibodies diluted in blocking solution for 1 h at RT, in a dark humidified chamber. Finally, coverslips were washed both in PBS and water, mounted on microscope slides using ProLong Gold Antifade Reagent with DAPI (Invitrogen), and analyzed with Axio Imager 2 (ZEISS).
For DNA:RNA hybrids staining, cells were fixed in ice‐cold methanol for 10 min at −20°C, followed by incubation for 1 min in cold acetone at RT. The coverslips were then quickly washed in saline sodium citrate (SCC) 4× buffer twice and incubated for 30 min in SSC 3% BSA to prevent nonspecific interaction. Primary antibodies S9.6 and anti‐DDX21 were incubated overnight at 4°C. After three washes with PBS‐tween 0.05%, coverslips were incubated at RT with secondary antibodies. Coverslips were then washed with PBS‐tween 0.05%, mounted on microscope slides using ProLong Gold Antifade Reagent with DAPI (Invitrogen), and analyzed with a TCS SP2 confocal microscope (Leica).
Quantification of DDR foci number per cell and hybrids signal intensity was performed by counting at least 150 cells per condition in each experiment, and analyses were made using Cell Profiler 2.2.0 (Carpenter et al, 2006).
For counting DDR foci, the pipeline identifies nuclei in the DAPI channel as objects of diameter between 60 and 200 pixels, above a threshold intensity, identified through Otsu thresholding. It then enhances foci smaller than 10 pixels in the Red channel and then maps the identified foci to the segmented nuclei. Data are then exported to an excel sheet for analysis in GraphPad Prism.
To quantify the intensity of hybrids signal and dsRNA, the pipeline identifies the nuclei in the Dapi channel as above and then identifies the cytosol in the hybrids channel using the identified nuclei as seeds through Voronoi‐based segmentation (Jones et al, 2005). The cell‐by‐cell nuclear and cytosolic intensities are then exported to an excel sheet for analysis in GraphPad Prism 8.4.0.
Laser micro‐irradiation
Micro‐irradiation technique was used to study the recruitment of DIS3 in response to DNA damage. U2OS cells were plated 2–3 days before starting the micro‐irradiation experiment in a grid dish, to relocate cells after micro‐irradiation and immunofluorescence staining. 24 h later, the experiment cells were sensitized with BrdU. Laser micro‐irradiation was performed with a Confocal Spinning disk microscope (Olympus) equipped with an iXon 897 Ultra camera (ANDOR) and a FRAP module furnished with a 405 nm laser (laser set 100%, five iterations, ROI 0.7 μm). The environmental control is maintained with an OKOlab incubator. 5 min after DNA damage induction, cells were fixed with PFA 4% for 15 min at RT and after three washes with PBS, cells were blocked with PBS 3% BSA for 30 min. Then, cells were incubated with anti‐DIS3 and anti‐γH2AX antibodies, overnight at 4°C. After three washes, cells were incubated with secondary antibodies. Finally, coverslips were washed both in PBS and in water and mounted on microscope slides using ProLong Gold Antifade Reagent with DAPI (Invitrogen). Images were acquired using the DeltaVision Elite imaging system (GE) based on an inverted microscope (IX71; Olympus) with a camera (CoolSNAP HQ2; Photometrics) and a UPlan‐Apochromat 60× (1.4 NA) oil immersion objective lens (Olympus). Quantification analysis of DIS3 and γH2AX signal colocalization was performed by ImageJ.
Western blotting
Cells were pelleted and lysed in Laemmli buffer (10% glycerol, 0.08 M Tris–HCl pH 6.8, 2% SDS, 100 mM DTT). Cells were then sonicated using the ultrasonic homogenizers BANDELIN SONOPULS (amplitude 10%, 15 s on 30 s off, for three times) and proteins were quantified using the Bio‐Rad Protein Assay Dye Reagent, based on the Bradford method. Proteins were electrophoretically separated with precast polyacrylamide gels (Bio‐Rad) 4–15% and transferred onto nitrocellulose membrane (Amersham Hybond ECL, GE Healthcare) with a Bio‐Rad Trans‐Blot system. Ponceau S staining was performed on membranes. After blocking with 5% non‐fat dry milk (Bio‐Rad) in Tris‐buffered saline containing 0.1% Tween‐20 at RT for about 1 h, membranes were incubated overnight at 4°C with primary antibodies. Then, membranes were incubated with a secondary antibody. ECL Detection System (GE Healthcare) was used for the chemiluminescent reaction and signals were collected on films developed with Agfa developing machine or by the Bio‐Rad ChemiDoc system.
Comet assay
The comet assay or single cell gel electrophoresis is a sensitive and rapid technique for quantifying DNA damage and repair. The resulting image that is obtained resembles a comet with a distinct head and tail. The head is composed of intact DNA, while the tail consists of single‐strand or double‐strand DNA breaks. Alkaline comet assays were performed on U2OS cells using a Single Cell Gel Electrophoresis Assay Kit (Trevigen) according to the manufacturer's instructions. 1,500 cells were spotted in each sample area and comet tail moments were analyzed using Casp Lab software.
Dot blot
Genomic DNA was extracted according to DRIP protocol and digested with restriction enzyme cocktail mix, purified and then treated with 2 U di RNase III or 4 U di RNase H or left untreated for 2 h at 37°C. Serial dilutions of DNA (750 ng, 375 ng, 187.5 ng, 93.75 ng) were spotted on a nitrocellulose membrane and cross‐linked with UV light (700 mJ/cm2). The membrane was blocked with PBS‐Tween (0.2%) and 5% nonfat dry milk for 1 h and then incubated with S9.6 antibody diluted to 0.02 μg/ml in PBS‐Tween (0.2%), 5% milk. After washing, the membrane was incubated with Alexa‐fluor 488 anti‐mouse secondary antibodies, further washed, and developed with ECL techniques. The membrane was then incubated with SYBR®‐Gold (Invitrogen; S11494. 1:10,000 in PBS‐T) for 30 min, as a loading control. The membrane was then imaged in a GelDoc (Bio‐rad) using trans UV illumination. Immunoblot and DNA staining were then analyzed using ImageJ software.
I‐SceI‐Inducible HPRT mutation assay
The assay was based on human fibrosarcoma (HT1080) cells with a functional but I‐SceI‐cleavable HPRT gene (clone 5.2.1), as described previously (Gravells et al, 2015).
Reporter cells were transfected with the I‐SceI plasmid 96 h after cell infection with scramble shRNA or shRNA against DIS3. The cells were allowed to repair in a nonselective medium for 5 days before seeding and selecting for HPRT‐negative cells using 6‐TG (15 mg/ml). Cells were then incubated for 10–12 days to form colonies, which were stained and counted for the mutation frequencies, calculated as the number of HPRT‐negative colonies divided by the number of cells plated, after correcting for plating efficiency.
Cell cycle
For cell cycle analysis by flow cytometry, U2OS cells were transfected as reported and after 48 h were collected and fixed in pure ethanol for at least 1 h. Cells were then washed with PBS 1% BSA, resuspended in a solution containing 50 μg/ml propidium iodide and 200 μg/ml RNase A, and incubated for 3 h at RT or overnight at 4°C. At least 20,000 events per sample were acquired and the cell cycle was evaluated by analyzing the acquired events with FCS Express 6.0 software (De Novo Software).
Proliferation studies
To study the sensitivity of DIS3 silenced cells to DNA damage, cells were plated in six‐well dishes and transfected with control siRNA or siRNA against DIS3, as described above. 48 h following transfection, 250,000 cells were plated in triplicate in six‐well plates and treated with 300 nM 4OHT for 4 h to induce DSBs or 3 Gy irradiated. At 48, 96, and 144 h after DNA damage induction, cells were detached and counted in triplicate with a Bürker cell chamber after Trypan Blue staining to exclude apoptotic/necrotic cells.
Cell sensitivity to drug treatment
To study whether DIS3 depleted cells were sensitive to PARP inhibitors, DIvA cells were transfected with siRNA against DIS3, as described above, and after 48 h, cells were exposed to increasing concentrations of Olaparib (AZD2281, Selleck), an FDA‐approved PARP inhibitor. After 72 h, cells were detached and counted in triplicate with a Bürker cell chamber after Trypan Blue staining to exclude apoptotic/necrotic cells.
RNase III and RNase H treatment
For IF experiments, U2OS transfected cells were plated on coverslips and irradiated (3 Gy). 3 h later, cells were permeabilized with 1% Tween 20 in HBSS (HBSS 10× Gibco, 0.037% Sodium Bicarbonate Gibco, 0.01% HEPES 1M Gibco), for 10 min at RT. Cells were then treated with 10 U of RNase III (NEB) or 10 U of RNase H (NEB), in HBSS for 1 h at RT. Cells were then fixed with 4% paraformaldehyde and stained for BRCA1 foci formation. For comet assay experiments, U2OS transfected cells were irradiated (3 Gy) and 24 h were permeabilized with 1% Tween 20 in HBSS for 10 min at RT. Then, cells were treated with 10 U of RNase H (NEB) in HBSS for 1 h at RT and processed for comet assay experiments.
ChIP
Cells were cross‐linked with formaldehyde (1%) and added to the culture medium for 8 min at RT. To stop the reaction, glycine was added to a final concentration of 0.125 M. After 5 min, cells were washed twice with cold PBS and harvested by scraping. Pelleted cells were first subjected to lysis in the SDS buffer (100 mM NaCl, 50 mM Tris–HCl pH 7.9, 5 mM EDTA, 0.5% SDS). Then, 1/3 volume of TRITON DILUTION buffer (100 mM NaCl, 100 mM Tris–HCl pH 8.6, 5 mM EDTA, 5% TRITON X‐100) and protease inhibitors cocktail tablet (Roche) were added to reconstitute IP buffer. Cells were then sonicated 10 times, 30 s ON and 60 s OFF, at a power setting of 50% cycle (Branson Sonifier 250), to obtain DNA fragments of about 500 bp. Samples were subjected to 1‐h preclearing with 50 μl of previously blocked protein‐A agarose (KPL) or protein‐G agarose beads (KPL). Beads blocking was achieved by incubating the agarose beads with 0.5% BSA at 4°C. 200 μg of chromatin was incubated overnight at 4°C with antibodies specific for anti‐RAD51, anti‐BRCA1, anti‐γH2AX, anti‐FLAG, or IgG as a negative control. Immune complexes were then recovered by incubating the samples with 50 μl of blocked protein A or protein G beads for 2 h at 4°C on a rotating wheel. Beads were washed two times in: mixed micelle buffer (20 mM Tris HCl pH 8, 150 mM NaCl, 5 mM EDTA pH 8, 5% sucrose, 1% Triton X‐100, 0.2% SDS), buffer 500 (50 mM HEPES pH 7.5, 0.1% deoxycholic acid, 1% Triton X‐100, 500 mM NaCl, 1 mM EDTA pH 8), LiCl buffer (10 mM Tris HCl pH 8, 0.5% NP40, 250 mM LiCl, 1 mM EDTA pH 8) and TE buffer (10 mM Tris‐Cl pH 8, 1 mM EDTA pH 8). Cross‐link was reversed by adding RNase A to the samples for 30 s at 37°C and proteinase K (PK) overnight at 65°C. DNA was finally extracted with phenol‐chloroform and EtOH precipitation. Quantitative real‐time PCR was performed using SYBR® Green Master Mix (Applied Biosystems) on the ViiA7 Real‐Time PCR System (Applied Biosystems). The signal intensity plotted is the relative abundance of protein immuno‐precipitated in each region, normalized to input values.
A list of the primers used for the different ChIP‐qPCR experiments is provided below:
Chr1_6 FWR: GAATGGATGGAAATGGAGGA
Chr1_6 REV: TGTCCCCTTCCTCACTCAAG
Chr6_7 + 0.1 kb FWR: GTTGGGGATAGGGACAGATG
Chr6_7 + 0.1 kb REV: GCAGCTTACCTGGGTCTGAG
DRIP
DNA:RNA hybrids immunoprecipitation (DRIP) assay was performed following a protocol kindly provided by Frederic Chedin. Briefly, DiVA cells, treated or not with 4OHT were trypsinized, pelletized, and washed with DPBS. DNA was extracted gently with SDS and PK treatment at 37°C and recovered by phenol: chloroform extraction and ethanol precipitation. Purified DNA was then digested with an enzyme cocktail (HindIII, EcoRI, BsrGI, XbaI, and SspI) overnight at 37°C. 4.4 μg of purified and digested DNA was incubated overnight at 4°C on a rotating wheel with 10 μg of S9.6 antibody in 1X binding buffer (10 mM NaPO4 pH 7, 0.14 M NaCl, 0.05% Triton X‐100). Then, DNA:antibody complexes were incubated with 50 μl agarose beads, pre‐equilibrated with 700 μl binding buffer (10 mM NaPO4 pH 7, 0.14 M NaCl, 0.05% Triton X‐100), for 2 h at 4°C, on a rotating wheel. Beads: antibody complexes were then washed three times with 700 μl binding buffer for 10 min at 4°C, on a rotating wheel. Elution was performed by incubating samples with 250 μl elution buffer (50 mM Tris pH 8, 10 mM EDTA, 0.5% SDS) and PK at 55°C for 45 min. After elution, DNA was cleaned up with phenol‐chloroform extraction followed by standard EtOH precipitation. Quantitative real‐time PCR was performed using SYBR Green Master Mix (Applied Biosystems) on the ViiA7 Real‐Time PCR System (Applied Biosystems). The signal intensity plotted is the relative abundance of protein immuno‐precipitated in each region, normalized to input values and expressed as relative enrichment versus shScr DiVA cells.
TCGA analysis
Co‐expression was evaluated by using the maximal information coefficient (MIC), able to detect interdependence between two variables even when the relationship is not linear, applied to the TCGA RNA‐seq expression dataset. For each tumor, MIC has been calculated between DIS3 and other 20,000 genes, and results were ranked to identify the, say, top 1% of genes that are related to DIS3 mostly. The top 1% list was put in the EnrichR software application.
Transcriptome data and mutational load analysis
Data from CoMMpass dataset, which include genomic and transcriptomic data from 853 MM patients, 88 presenting DIS3 mutations, were quantile normalized using preprocess Core (v1.36.0) (https://www.bioconductor.org/packages/release/bioc/html/preprocessCore.html).
Normalized data were log2 transformed, and all downstream analysis was performed using R (Version 1.0.44, RStudio Inc.) and ingenuity pathway analysis (QIAGEN Bioinformatics). The comparison between DIS3 mutant vs wild‐type (WT) data was performed using the Bioconductor “limma” package. For detection of differentially expressed genes (DEGs), we used the Benjamini–Hochberg procedure, to control for the false‐discovery rate (FDR), which we set at 0.05 and provided as a descriptive statistic in Dataset EV1. A volcano plot was used to present the significant transcript. Differentially expressed transcripts related to interferon (IFN) pathways (Dataset EV1) were represented by hierarchical clustering that was performed using the function “Heatmap” from the R package “ComplexHeatmap.”
The mutational load was evaluated on the list of nonsynonymous variants distributed within the CoMMpass study. Gene‐wise counts were evaluated for samples with or without DIS3 reported mutations.
Pathway analysis
Gene ontology analyses were performed using ingenuity pathway analysis (IPA, QIAGEN Bioinformatics). DEGs at FDR 0.05 were used to select transcripts for pathway analysis. The proportion of upregulated and downregulated transcripts was represented. The z‐score was used to indicate the direction of pathway deregulation, with a positive z‐score representing activation and a negative z‐score inhibition.
Single sample gene set enrichment analysis (ssGSEA)
To estimate the enrichment of IFN signature related to IFN pathways, gene expression deconvolution analyses were performed with ssGSEA implemented in the “GSVA package.” Enrichment scores (ES) were calculated by ssGSEA on the log2 transformed, normalized gene‐level data. Gene sets to define ES of 26 IFN‐related pathways (423 transcripts) were used as described in Table EV1 including; “[IPA] Interferon Signaling(32),” “STAT1_score(89),” “Module3_IFN_score(24),” “IFNG_score_21050467(64),” “Interferon_19272155(13),” “MHC‐I_19272155(5),” “MHC‐II_19272155(12),” “STAT1_19272155(10),” “Interferon_Cluster_21214954(36),” “IFN_21978456(13),” “MHC1_21978456(7),” “MHC2_21978456(15),” “APM1(7),” “APM2(15),” “IFIT3(10),” Hallmark of Cancer; “[HM] INTERFERON ALPHA RESPONSE(97),” “[HM] INTERFERON GAMMA RESPONSE(200),” “M10.1.Interferon(21),” “M13.17.Interferon(31),” “M15.64.Interferon(21),” “M15.86.Interferon(15),” “M15.127.Interferon(14),” “M8.3.Type 1 Interferon(17),” “ISG.RS(38),” “IFNG.GS(176),” and “STING(4).” Differentially expressed ESs between DIS3 mutant and wild‐type data were calculated through a t‐test (P < 0.05).
Author contributions
Ilaria Gritti: Conceptualization; data curation; validation; investigation; methodology; writing—original draft; project administration; writing—review and editing. Veronica Basso: Methodology. Darawan Rinchai: Software. Federica Corigliano: Methodology. Silvia Pivetti: Methodology. Marco Gaviraghi: Methodology. Dalia Rosano: Resources; supervision. Davide Mazza: Software. Sara Barozzi: Methodology. Marco Roncador: Software. Giovanni Parmigiani: Software. Gaelle Legube: Supervision. Dario Parazzoli: Methodology. Davide Cittaro: Software. Davide Bedognetti: Software. Anna Mondino: Resources. Simona Segalla: Conceptualization; supervision; investigation; writing—original draft. Giovanni Tonon: Conceptualization; data curation; supervision; funding acquisition; investigation; writing—original draft; project administration; writing—review and editing.
Disclosure and competing interests statement
The authors declare that they have no conflict of interest.
Supporting information
Expanded View Figures PDF
Table EV1
Dataset EV1
Source Data for Expanded View
PDF+
Acknowledgments
We thank all the members of the Tonon laboratory for their discussions, support, and critical reading of the manuscript. We also thank Drs. Aguilera, Livingston, Scully, Libri, Agresti, and Di Micco for helpful discussions and Dr. Pasero and Dr. Lin for sharing reagents. We thank Drs. Chedin and Sanz provide technical assistance and expertise for hybrids detection studies. HT1080 cells were a gift from Dr. Humphrey. This work was supported by Associazione Italiana per la Ricerca sul Cancro, AIRC (fellowship AIRC ID. 20998) (IG), International Myeloma Foundation (IMF, 2018 Brian D. Novis Senior Research Grant) (SS), Associazione Italiana per la Ricerca sul Cancro, AIRC (IG grant ID. 17109) (GT) and Ministero della salute (Ministry of Health, Italy) (RF‐2011‐02351474) (GT). Open access funding provided by BIBLIOSAN.
The EMBO Journal (2022) 41: e108040
Contributor Information
Simona Segalla, Email: segalla.simona@hsr.it.
Giovanni Tonon, Email: tonon.giovanni@hsr.it.
Data availability
This study includes no data deposited in external repositories.
References
- Aguilera A, Huertas P (2003) Cotranscriptionally formed DNA:RNA hybrids mediate transcription elongation impairment and transcription‐associated recombination. Mol Cell 12: 711–721 [DOI] [PubMed] [Google Scholar]
- Ahrabi S, Sarkar S, Pfister SX, Pirovano G, Higgins GS, Porter AC, Humphrey TC (2016) A role for human homologous recombination factors in suppressing microhomology‐mediated end joining. Nucleic Acids Res 44: 5743–5757 [DOI] [PMC free article] [PubMed] [Google Scholar]
- Aymard F, Bugler B, Schmidt CK, Guillou E, Caron P, Briois S, Iacovoni JS, Daburon V, Miller KM, Jackson SP et al (2014) Transcriptionally active chromatin recruits homologous recombination at DNA double‐strand breaks. Nat Struct Mol Biol 21: 366–374 [DOI] [PMC free article] [PubMed] [Google Scholar]
- Basu U, Meng FL, Keim C, Grinstein V, Pefanis E, Eccleston J, Zhang T, Myers D, Wasserman CR, Wesemann DR et al (2011) The RNA exosome targets the AID cytidine deaminase to both strands of transcribed duplex DNA substrates. Cell 144: 353–363 [DOI] [PMC free article] [PubMed] [Google Scholar]
- Bernstein J, Toth EA (2012) Yeast nuclear RNA processing. World J Biol Chem 3: 7–26 [DOI] [PMC free article] [PubMed] [Google Scholar]
- Bhatia V, Barroso SI, García‐Rubio ML, Tumini E, Herrera‐Moyano E, Aguilera A (2014) BRCA2 prevents R‐loop accumulation and associates with TREX‐2 mRNA export factor PCID2. Nature 511: 362–365 [DOI] [PubMed] [Google Scholar]
- Bitler BG, Watson ZL, Wheeler LJ, Behbakht K (2017) PARP inhibitors: clinical utility and possibilities of overcoming resistance. Gynecol Oncol 147: 695–704 [DOI] [PMC free article] [PubMed] [Google Scholar]
- Bolli N, Avet‐Loiseau H, Wedge DC, Van Loo P, Alexandrov LB, Martincorena I, Dawson KJ, Iorio F, Nik‐Zainal S, Bignell GR et al (2014) Heterogeneity of genomic evolution and mutational profiles in multiple myeloma. Nat Commun 5: 2997 [DOI] [PMC free article] [PubMed] [Google Scholar]
- Botrugno OA, Bianchessi S, Zambroni D, Frenquelli M, Belloni D, Bongiovanni L, Girlanda S, Di Terlizzi S, Ferrarini M, Ferrero E et al (2020) ATR addiction in multiple myeloma: synthetic lethal approaches exploiting established therapies. Haematologica 105: 2440–2447 [DOI] [PMC free article] [PubMed] [Google Scholar]
- Carpenter AE, Jones TR, Lamprecht MR, Clarke C, Kang IH, Friman O, Guertin DA, Chang JH, Lindquist RA, Moffat J et al (2006) CellProfiler: image analysis software for identifying and quantifying cell phenotypes. Genome Biol 7: R100 [DOI] [PMC free article] [PubMed] [Google Scholar]
- Chapman MA, Lawrence MS, Keats JJ, Cibulskis K, Sougnez C, Schinzel AC, Harview CL, Brunet JP, Ahmann GJ, Adli M et al (2011) Initial genome sequencing and analysis of multiple myeloma. Nature 471: 467–472 [DOI] [PMC free article] [PubMed] [Google Scholar]
- Chédin F (2016) Nascent connections: R‐loops and chromatin patterning. Trends Genet 32: 828–838 [DOI] [PMC free article] [PubMed] [Google Scholar]
- Choi J, Hwang SY, Ahn K (2018) Interplay between RNASEH2 and MOV10 controls LINE‐1 retrotransposition. Nucleic Acids Res 46: 1912–1926 [DOI] [PMC free article] [PubMed] [Google Scholar]
- Cohen S, Puget N, Lin YL, Clouaire T, Aguirrebengoa M, Rocher V, Pasero P, Canitrot Y, Legube G (2018) Senataxin resolves RNA:DNA hybrids forming at DNA double‐strand breaks to prevent translocations. Nat Commun 9: 533 [DOI] [PMC free article] [PubMed] [Google Scholar]
- Costantino L, Koshland D (2018) Genome‐wide map of R‐loop‐induced damage reveals how a subset of R‐loops contributes to genomic instability. Mol Cell 71: 487–497 [DOI] [PMC free article] [PubMed] [Google Scholar]
- Cottini F, Hideshima T, Suzuki R, Tai YT, Bianchini G, Richardson PG, Anderson KC, Tonon G (2015) Synthetic lethal approaches exploiting DNA damage in aggressive myeloma. Cancer Discov 5: 972–987 [DOI] [PMC free article] [PubMed] [Google Scholar]
- Cottini F, Hideshima T, Xu C, Sattler M, Dori M, Agnelli L, ten Hacken E, Bertilaccio MT, Antonini E, Neri A et al (2014) Rescue of Hippo coactivator YAP1 triggers DNA damage‐induced apoptosis in hematological cancers. Nat Med 20: 599–606 [DOI] [PMC free article] [PubMed] [Google Scholar]
- D'Andrea AD, Grompe M (2003) The Fanconi anaemia/BRCA pathway. Nat Rev Cancer 3: 23–34 [DOI] [PubMed] [Google Scholar]
- Davidson L, Francis L, Cordiner RA, Eaton JD, Estell C, Macias S, Cáceres JF, West S (2019) Rapid depletion of DIS3, EXOSC10, or XRN2 reveals the immediate impact of exoribonucleolysis on nuclear RNA metabolism and transcriptional control. Cell Rep 26: 2779–2791 [DOI] [PMC free article] [PubMed] [Google Scholar]
- Domagala P, Hybiak J, Cybulski C, Lubinski J (2017) BRCA1/2‐negative hereditary triple‐negative breast cancers exhibit BRCAness. Int J Cancer 140: 1545–1550 [DOI] [PubMed] [Google Scholar]
- Domingo‐Prim J, Endara‐Coll M, Bonath F, Jimeno S, Prados‐Carvajal R, Friedländer MR, Huertas P, Visa N (2019) EXOSC10 is required for RPA assembly and controlled DNA end resection at DNA double‐strand breaks. Nat Commun 10: 2135 [DOI] [PMC free article] [PubMed] [Google Scholar]
- Francia S, Michelini F, Saxena A, Tang D, de Hoon M, Anelli V, Mione M, Carninci P, d'Adda di Fagagna F (2012) Site‐specific DICER and DROSHA RNA products control the DNA‐damage response. Nature 488: 231–235 [DOI] [PMC free article] [PubMed] [Google Scholar]
- Ginno PA, Lott PL, Christensen HC, Korf I, Chedin F (2012) R‐loop formation is a distinctive characteristic of unmethylated human CpG island promoters. Mol Cell 45: 814–825 [DOI] [PMC free article] [PubMed] [Google Scholar]
- Gómez‐González B, Aguilera A (2019) Transcription‐mediated replication hindrance: a major driver of genome instability. Genes Dev 33: 1008–1026 [DOI] [PMC free article] [PubMed] [Google Scholar]
- Graf M, Bonetti D, Lockhart A, Serhal K, Kellner V, Maicher A, Jolivet P, Teixeira MT, Luke B (2017) Telomere length determines TERRA and R‐loop regulation through the cell cycle. Cell 170: 72–85 [DOI] [PubMed] [Google Scholar]
- Gravells P, Ahrabi S, Vangala RK, Tomita K, Brash JT, Brustle LA, Chung C, Hong JM, Kaloudi A, Humphrey TC et al (2015) Use of the HPRT gene to study nuclease‐induced DNA double‐strand break repair. Hum Mol Genet 24: 7097–7110 [DOI] [PMC free article] [PubMed] [Google Scholar]
- Gu Z, Eils R, Schlesner M (2016) Complex heatmaps reveal patterns and correlations in multidimensional genomic data. Bioinformatics 32: 2847–2849 [DOI] [PubMed] [Google Scholar]
- Hamperl S, Cimprich KA (2014) The contribution of co‐transcriptional RNA:DNA hybrid structures to DNA damage and genome instability. DNA Repair (Amst) 19: 84–94 [DOI] [PMC free article] [PubMed] [Google Scholar]
- Hartono SR, Malapert A, Legros P, Bernard P, Chédin F, Vanoosthuyse V (2018) The affinity of the S9.6 antibody for double‐stranded RNAs impacts the accurate mapping of R‐loops in fission yeast. J Mol Biol 430: 272–284 [DOI] [PMC free article] [PubMed] [Google Scholar]
- Hatchi E, Skourti‐Stathaki K, Ventz S, Pinello L, Yen A, Kamieniarz‐Gdula K, Dimitrov S, Pathania S, McKinney KM, Eaton ML et al (2015) BRCA1 recruitment to transcriptional pause sites is required for R‐loop‐driven DNA damage repair. Mol Cell 57: 636–647 [DOI] [PMC free article] [PubMed] [Google Scholar]
- Iacovoni JS, Caron P, Lassadi I, Nicolas E, Massip L, Trouche D, Legube G (2010) High‐resolution profiling of gammaH2AX around DNA double strand breaks in the mammalian genome. EMBO J 29: 1446–1457 [DOI] [PMC free article] [PubMed] [Google Scholar]
- Januszyk K, Lima CD (2014) The eukaryotic RNA exosome. Curr Opin Struct Biol 24: 132–140 [DOI] [PMC free article] [PubMed] [Google Scholar]
- Jones TR, Carpenter A, Golland P (2005) Voronoi‐based segmentation of cells on image manifolds. In Computer Vision for Biomedical Image Applications, Liu Y, Jiang T, Zhang C (eds), pp 535–543. Berlin Heidelberg: Springer; [Google Scholar]
- Keats JJ, Speyer G, Christofferson A, Legendre C, Aldrich J, Russell M, Cuyugan L, Adkins J, Blanski A, Hodges M et al (2016) Molecular predictors of outcome and drug response in multiple myeloma: an interim analysis of the Mmrf CoMMpass Study. Blood 128: 194 [Google Scholar]
- Kumar SK, Rajkumar V, Kyle RA, van Duin M, Sonneveld P, Mateos MV, Gay F, Anderson KC (2017) Multiple myeloma. Nat Rev Dis Primers 3: 17046 [DOI] [PubMed] [Google Scholar]
- Laffleur B, Basu U, Lim J (2017) RNA exosome and non‐coding RNA‐coupled mechanisms in AID‐mediated genomic alterations. J Mol Biol 429: 3230–3241 [DOI] [PMC free article] [PubMed] [Google Scholar]
- Laffleur B, Lim J, Zhang W, Chen Y, Pefanis E, Bizarro J, Batista CR, Wu L, Economides AN, Wang J et al (2021) Noncoding RNA processing by DIS3 regulates chromosomal architecture and somatic hypermutation in B cells. Nat Genet 53: 230–242 [DOI] [PMC free article] [PubMed] [Google Scholar]
- Lawrence MS, Stojanov P, Polak P, Kryukov GV, Cibulskis K, Sivachenko A, Carter SL, Stewart C, Mermel CH, Roberts SA et al (2013) Mutational heterogeneity in cancer and the search for new cancer‐associated genes. Nature 499: 214–218 [DOI] [PMC free article] [PubMed] [Google Scholar]
- Lemay JF, Larochelle M, Marguerat S, Atkinson S, Bähler J, Bachand F (2014) The RNA exosome promotes transcription termination of backtracked RNA polymerase II. Nat Struct Mol Biol 21: 919–926 [DOI] [PubMed] [Google Scholar]
- Lionetti M, Barbieri M, Todoerti K, Agnelli L, Fabris S, Tonon G, Segalla S, Cifola I, Pinatel E, Tassone P et al (2015) A compendium of DIS3 mutations and associated transcriptional signatures in plasma cell dyscrasias. Oncotarget 6: 26129–26141 [DOI] [PMC free article] [PubMed] [Google Scholar]
- Lohr JG, Stojanov P, Carter SL, Cruz‐Gordillo P, Lawrence MS, Auclair D, Sougnez C, Knoechel B, Gould J, Saksena G et al (2014) Widespread genetic heterogeneity in multiple myeloma: implications for targeted therapy. Cancer Cell 25: 91–101 [DOI] [PMC free article] [PubMed] [Google Scholar]
- Lu WT, Hawley BR, Skalka GL, Baldock RA, Smith EM, Bader AS, Malewicz M, Watts FZ, Wilczynska A, Bushell M (2018) Drosha drives the formation of DNA:RNA hybrids around DNA break sites to facilitate DNA repair. Nat Commun 9: 532 [DOI] [PMC free article] [PubMed] [Google Scholar]
- Mischo HE, Gómez‐González B, Grzechnik P, Rondón AG, Wei W, Steinmetz L, Aguilera A, Proudfoot NJ (2011) Yeast Sen1 helicase protects the genome from transcription‐associated instability. Mol Cell 41: 21–32 [DOI] [PMC free article] [PubMed] [Google Scholar]
- Nadel J, Athanasiadou R, Lemetre C, Wijetunga NA, Ó Broin P, Sato H, Zhang Z, Jeddeloh J, Montagna C, Golden A et al (2015) RNA:DNA hybrids in the human genome have distinctive nucleotide characteristics, chromatin composition, and transcriptional relationships. Epigenetics Chromatin 8: 46 [DOI] [PMC free article] [PubMed] [Google Scholar]
- Ogami K, Chen Y, Manley JL (2018) RNA surveillance by the nuclear RNA exosome: mechanisms and significance. Noncoding RNA 4: 8 [DOI] [PMC free article] [PubMed] [Google Scholar]
- Ohle C, Tesorero R, Schermann G, Dobrev N, Sinning I, Fischer T (2016) Transient RNA‐DNA hybrids are required for efficient double‐strand break repair. Cell 167: 1001–1013 [DOI] [PubMed] [Google Scholar]
- Pant S, Maitra A, Yap TA (2019) PARP inhibition – opportunities in pancreatic cancer. Nat Rev Clin Oncol 16: 595–596 [DOI] [PubMed] [Google Scholar]
- Pefanis E, Wang J, Rothschild G, Lim J, Chao J, Rabadan R, Economides AN, Basu U (2014) Noncoding RNA transcription targets AID to divergently transcribed loci in B cells. Nature 514: 389–393 [DOI] [PMC free article] [PubMed] [Google Scholar]
- Petermann E, Lan L, Zou L (2022) Sources, resolution and physiological relevance of R‐loops and RNA‐DNA hybrids. Nat Rev Mol Cell Biol 23: 521–540 [DOI] [PubMed] [Google Scholar]
- Pfister SX, Ahrabi S, Zalmas LP, Sarkar S, Aymard F, Bachrati CZ, Helleday T, Legube G, La Thangue NB, Porter AC et al (2014) SETD2‐dependent histone H3K36 trimethylation is required for homologous recombination repair and genome stability. Cell Rep 7: 2006–2018 [DOI] [PMC free article] [PubMed] [Google Scholar]
- Phillips DD, Garboczi DN, Singh K, Hu Z, Leppla SH, Leysath CE (2013) The sub‐nanomolar binding of DNA‐RNA hybrids by the single‐chain Fv fragment of antibody S9.6. J Mol Recognit 26: 376–381 [DOI] [PMC free article] [PubMed] [Google Scholar]
- Polak P, Kim J, Braunstein LZ, Karlic R, Haradhavala NJ, Tiao G, Rosebrock D, Livitz D, Kübler K, Mouw KW et al (2017) A mutational signature reveals alterations underlying deficient homologous recombination repair in breast cancer. Nat Genet 49: 1476–1486 [DOI] [PMC free article] [PubMed] [Google Scholar]
- Polyak K, Garber J (2011) Targeting the missing links for cancer therapy. Nat Med 17: 283–284 [DOI] [PubMed] [Google Scholar]
- Preker P, Almvig K, Christensen MS, Valen E, Mapendano CK, Sandelin A, Jensen TH (2011) PROMoter uPstream Transcripts share characteristics with mRNAs and are produced upstream of all three major types of mammalian promoters. Nucleic Acids Res 39: 7179–7193 [DOI] [PMC free article] [PubMed] [Google Scholar]
- Preker P, Nielsen J, Kammler S, Lykke‐Andersen S, Christensen MS, Mapendano CK, Schierup MH, Jensen TH (2008) RNA exosome depletion reveals transcription upstream of active human promoters. Science 322: 1851–1854 [DOI] [PubMed] [Google Scholar]
- Pryde F, Khalili S, Robertson K, Selfridge J, Ritchie AM, Melton DW, Jullien D, Adachi Y (2005) 53BP1 exchanges slowly at the sites of DNA damage and appears to require RNA for its association with chromatin. J Cell Sci 118: 2043–2055 [DOI] [PubMed] [Google Scholar]
- Puget N, Miller KM, Legube G (2019) Non‐canonical DNA/RNA structures during Transcription‐Coupled Double‐Strand Break Repair: Roadblocks or Bona fide repair intermediates? DNA Repair (Amst) 81: 102661 [DOI] [PMC free article] [PubMed] [Google Scholar]
- Ratta R, Guida A, Scotté F, Neuzillet Y, Teillet AB, Lebret T, Beuzeboc P (2020) PARP inhibitors as a new therapeutic option in metastatic prostate cancer: a systematic review. Prostate Cancer Prostatic Dis 23: 549–560 [DOI] [PubMed] [Google Scholar]
- Reshef DN, Reshef YA, Finucane HK, Grossman SR, McVean G, Turnbaugh PJ, Lander ES, Mitzenmacher M, Sabeti PC (2011) Detecting novel associations in large data sets. Science 334: 1518–1524 [DOI] [PMC free article] [PubMed] [Google Scholar]
- Reyes‐Turcu FE, Zhang K, Zofall M, Chen E, Grewal SI (2011) Defects in RNA quality control factors reveal RNAi‐independent nucleation of heterochromatin. Nat Struct Mol Biol 18: 1132–1138 [DOI] [PMC free article] [PubMed] [Google Scholar]
- Richard P, Feng S, Manley JL (2013) A SUMO‐dependent interaction between Senataxin and the exosome, disrupted in the neurodegenerative disease AOA2, targets the exosome to sites of transcription‐induced DNA damage. Genes Dev 27: 2227–2232 [DOI] [PMC free article] [PubMed] [Google Scholar]
- Robinson SR, Oliver AW, Chevassut TJ, Newbury SF (2015) The 3′ to 5′ exoribonuclease DIS3: from structure and mechanisms to biological functions and role in human disease. Biomolecules 5: 1515–1539 [DOI] [PMC free article] [PubMed] [Google Scholar]
- Salas‐Armenteros I, Pérez‐Calero C, Bayona‐Feliu A, Tumini E, Luna R, Aguilera A (2017) Human THO‐Sin3A interaction reveals new mechanisms to prevent R‐loops that cause genome instability. EMBO J 36: 3532–3547 [DOI] [PMC free article] [PubMed] [Google Scholar]
- Santos‐Pereira JM, Aguilera A (2015) R loops: new modulators of genome dynamics and function. Nat Rev Genet 16: 583–597 [DOI] [PubMed] [Google Scholar]
- Sanz LA, Hartono SR, Lim YW, Steyaert S, Rajpurkar A, Ginno PA, Xu X, Chédin F (2016) Prevalent, dynamic, and conserved R‐loop structures associate with specific epigenomic signatures in mammals. Mol Cell 63: 167–178 [DOI] [PMC free article] [PubMed] [Google Scholar]
- Segalla S, Pivetti S, Todoerti K, Chudzik MA, Giuliani EC, Lazzaro F, Volta V, Lazarevic D, Musco G, Muzi‐Falconi M et al (2015) The ribonuclease DIS3 promotes let‐7 miRNA maturation by degrading the pluripotency factor LIN28B mRNA. Nucleic Acids Res 43: 5182–5193 [DOI] [PMC free article] [PubMed] [Google Scholar]
- Shen J, Zhao W, Ju Z, Wang L, Peng Y, Labrie M, Yap TA, Mills GB, Peng G (2019) PARPi triggers the STING‐dependent immune response and enhances the therapeutic efficacy of immune checkpoint blockade independent of BRCAness. Cancer Res 79: 311–319 [DOI] [PMC free article] [PubMed] [Google Scholar]
- Shen W, Sun H, De Hoyos CL, Bailey JK, Liang XH, Crooke ST (2017) Dynamic nucleoplasmic and nucleolar localization of mammalian RNase H1 in response to RNAP I transcriptional R‐loops. Nucleic Acids Res 45: 10672–10692 [DOI] [PMC free article] [PubMed] [Google Scholar]
- Shen YJ, Le Bert N, Chitre AA, Koo CX, Nga XH, Ho SS, Khatoo M, Tan NY, Ishii KJ, Gasser S (2015) Genome‐derived cytosolic DNA mediates type I interferon‐dependent rejection of B cell lymphoma cells. Cell Rep 11: 460–473 [DOI] [PubMed] [Google Scholar]
- Skourti‐Stathaki K, Proudfoot NJ (2014) A double‐edged sword: R loops as threats to genome integrity and powerful regulators of gene expression. Genes Dev 28: 1384–1396 [DOI] [PMC free article] [PubMed] [Google Scholar]
- Skourti‐Stathaki K, Proudfoot NJ, Gromak N (2011) Human senataxin resolves RNA/DNA hybrids formed at transcriptional pause sites to promote Xrn2‐dependent termination. Mol Cell 42: 794–805 [DOI] [PMC free article] [PubMed] [Google Scholar]
- Sollier J, Cimprich KA (2015) Breaking bad: R‐loops and genome integrity. Trends Cell Biol 25: 514–522 [DOI] [PMC free article] [PubMed] [Google Scholar]
- Sordet O, Redon CE, Guirouilh‐Barbat J, Smith S, Solier S, Douarre C, Conti C, Nakamura AJ, Das BB, Nicolas E et al (2009) Ataxia telangiectasia mutated activation by transcription‐ and topoisomerase I‐induced DNA double‐strand breaks. EMBO Rep 10: 887–893 [DOI] [PMC free article] [PubMed] [Google Scholar]
- Sun L, Wu J, Du F, Chen X, Chen ZJ (2013) Cyclic GMP‐AMP synthase is a cytosolic DNA sensor that activates the type I interferon pathway. Science 339: 786–791 [DOI] [PMC free article] [PubMed] [Google Scholar]
- Surova O, Zhivotovsky B (2013) Various modes of cell death induced by DNA damage. Oncogene 32: 3789–3797 [DOI] [PubMed] [Google Scholar]
- Szczepińska T, Kalisiak K, Tomecki R, Labno A, Borowski LS, Kulinski TM, Adamska D, Kosinska J, Dziembowski A (2015) DIS3 shapes the RNA polymerase II transcriptome in humans by degrading a variety of unwanted transcripts. Genome Res 25: 1622–1633 [DOI] [PMC free article] [PubMed] [Google Scholar]
- Tirkkonen M, Johannsson O, Agnarsson BA, Olsson H, Ingvarsson S, Karhu R, Tanner M, Isola J, Barkardottir RB, Borg A et al (1997) Distinct somatic genetic changes associated with tumor progression in carriers of BRCA1 and BRCA2 germ‐line mutations. Cancer Res 57: 1222–1227 [PubMed] [Google Scholar]
- Tomecki R, Kristiansen MS, Lykke‐Andersen S, Chlebowski A, Larsen KM, Szczesny RJ, Drazkowska K, Pastula A, Andersen JS, Stepien PP et al (2010) The human core exosome interacts with differentially localized processive RNases: hDIS3 and hDIS3L. EMBO J 29: 2342–2357 [DOI] [PMC free article] [PubMed] [Google Scholar]
- Tuduri S, Crabbé L, Conti C, Tourrière H, Holtgreve‐Grez H, Jauch A, Pantesco V, De Vos J, Thomas A, Theillet C et al (2009) Topoisomerase I suppresses genomic instability by preventing interference between replication and transcription. Nat Cell Biol 11: 1315–1324 [DOI] [PMC free article] [PubMed] [Google Scholar]
- Turner N, Tutt A, Ashworth A (2004) Hallmarks of 'BRCAness' in sporadic cancers. Nat Rev Cancer 4: 814–819 [DOI] [PubMed] [Google Scholar]
- Venkitaraman AR (2004) Tracing the network connecting BRCA and Fanconi anaemia proteins. Nat Rev Cancer 4: 266–276 [DOI] [PubMed] [Google Scholar]
- Wahba L, Amon JD, Koshland D, Vuica‐Ross M (2011) RNase H and multiple RNA biogenesis factors cooperate to prevent RNA:DNA hybrids from generating genome instability. Mol Cell 44: 978–988 [DOI] [PMC free article] [PubMed] [Google Scholar]
- Walker BA, Wardell CP, Melchor L, Hulkki S, Potter NE, Johnson DC, Fenwick K, Kozarewa I, Gonzalez D, Lord CJ et al (2012) Intraclonal heterogeneity and distinct molecular mechanisms characterize the development of t(4;14) and t(11;14) myeloma. Blood 120: 1077–1086 [DOI] [PubMed] [Google Scholar]
- Weißbach S, Langer C, Puppe B, Nedeva T, Bach E, Kull M, Bargou R, Einsele H, Rosenwald A, Knop S et al (2015) The molecular spectrum and clinical impact of DIS3 mutations in multiple myeloma. Br J Haematol 169: 57–70 [DOI] [PubMed] [Google Scholar]
- Xu B, Clayton DA (1996) RNA‐DNA hybrid formation at the human mitochondrial heavy‐strand origin ceases at replication start sites: an implication for RNA‐DNA hybrids serving as primers. EMBO J 15: 3135–3143 [PMC free article] [PubMed] [Google Scholar]