

Abstract

A better understanding of amorphous aluminum oxide’s structure and electronic properties is obtained through combined experimental and computational approaches. Grazing incidence X-ray scattering measurements were carried out on aluminum oxide thin films grown using thermal atomic layer deposition. The corresponding pair distribution functions (PDFs) showed structures similar to previously reported PDFs of solid-state amorphous alumina and molten alumina. Structural models based on crystalline alumina polymorphs (PDFgui) and amorphous alumina (molecular dynamics, MD) were examined for structural comparisons to the experimental PDF data. Smaller MD models were optimized and verified against larger models to allow for quantum chemical electronic structure calculations. The electronic structure of the amorphous alumina models yields additional insight into the band structure and electronic defects present in amorphous alumina that are not present in crystalline samples.
Introduction
Atomic-layer-deposited (ALD) alumina is a ubiquitous material in scientific studies and is present in many applications, for example, as surface passivation layers,1,2 diffusion barriers,3,4 and dielectric layers.5,6 Alumina is arguably the most-deposited ALD material, not only due to its good properties as a dielectric and physical barrier but also because of the robust growth chemistry of the trimethylaluminum (TMA)–water process.7,8 The structure and chemistry of ALD alumina films will dictate the physical properties, such as band gap, defect levels, chemical stability, catalytic behavior, etc.; however, short- and medium-range ordered ALD alumina films are difficult to probe, and the structural evolution near crystallization temperatures is not well understood.
Most ALD alumina films do not show long-range order in X-ray and electron diffraction experiments. However, crystallinity in ALD alumina films is of interest, as the long-range order of crystalline alumina films provides insight into short- and medium-range order in amorphous films. Factors that determine if ALD alumina films will be crystalline include deposition temperature, precursor chemistry, substrate choice, and postdeposition processing.9 Special cases of the direct growth of crystalline alumina phases using ALD include growth on nanowires,10,11 which results in crystalline alumina in the as-deposited state. Additionally, ALD on SrTiO3 can result in the direct growth of crystalline alumina.12 High substrate temperatures can be employed using the AlCl3 and water process due to the high thermal stability of the chloride precursor, in which case crystalline films can be obtained.13 However, the vast majority of ALD alumina films are grown using TMA coupled with an oxygen precursor (water, ozone, or oxygen plasma) under conditions that result in amorphous films, with the upper limit of the deposition temperature dictated by the decomposition temperature of TMA. Postdeposition annealing of amorphous alumina films at or above 900–1050 °C results in crystallization.14−19 In these prior studies, phases observed after the postdeposition annealing of ALD alumina typically begin with one or more “transition” alumina phases and terminate at the highest temperatures in the α-Al2O3 phase.
The composition of ALD alumina is not strictly stoichiometric Al2O3 but is more accurately described as Al2Ox(OH)6–2x, sometimes with small amounts of carbon impurities. When grown using the TMA-water process, ALD alumina films retain decreasing H contents as the growth temperature increases.4,20−23 The hydrogen content is primarily from water rather than the methyl groups, as evidenced by isotopic studies.22 Near the growth temperature used in this work (200 °C), films have been shown to retain 3–4 at. % hydrogen and very little carbon.20,22 Finally, the density of ALD alumina also varies over a considerable range (2.4–3.5 g·cm–3), depending primarily on the growth temperature.4,22,24
Since many ALD alumina films are structurally
amorphous, understanding
the effect of the short- and medium-range order on properties is critical
for applications. A significant body of literature exists on the structures
of amorphous and molten aluminas, although very few studies have examined
ALD alumina. Of most interest to the present work, various studies
of X-ray,25−30 electron,31,32 and neutron26,29,30,33 scattering
of amorphous or molten alumina have been reported. These scattering
data can be transformed into real-space to provide pair distribution
functions (PDF) with information about short- and medium-range order
(i.e., across length scales of 1–20 Å). These data can
then be used to refine molecular dynamics (MD) or reverse Monte Carlo
(RMC) simulations of atomic positions, yielding various structural
quantities such as the average coordination number (e.g.,  for the average coordination number around
Al), the percentage of individual coordination numbers for each element
(e.g., [4]Al, for the percentage of Al coordinated by four
oxygen atoms), bond angle distributions, and the presence of certain
medium-range structures, such as assemblies of polyhedra.26,34−36 Notably, in a study of molten alumina, Skinner et
al., used neutron and X-ray scattering and PDF data on molten alumina
in combination with RMC simulations to quantify a predominance of [4]Al (57.5%) and [5]Al (34.7%) coordination numbers
for Al with minority components of [3]Al (3.5%) and [6]Al (4.3%). These values for molten alumina are similar to
other molten data and solid-state amorphous alumina and are presented
in Table 1 for comparison
to the present work. This similarity between molten and solid-state
amorphous alumina is not surprising, as MD simulations show that the
for the average coordination number around
Al), the percentage of individual coordination numbers for each element
(e.g., [4]Al, for the percentage of Al coordinated by four
oxygen atoms), bond angle distributions, and the presence of certain
medium-range structures, such as assemblies of polyhedra.26,34−36 Notably, in a study of molten alumina, Skinner et
al., used neutron and X-ray scattering and PDF data on molten alumina
in combination with RMC simulations to quantify a predominance of [4]Al (57.5%) and [5]Al (34.7%) coordination numbers
for Al with minority components of [3]Al (3.5%) and [6]Al (4.3%). These values for molten alumina are similar to
other molten data and solid-state amorphous alumina and are presented
in Table 1 for comparison
to the present work. This similarity between molten and solid-state
amorphous alumina is not surprising, as MD simulations show that the  of supercooled liquid alumina approached
values measured for solid-state amorphous alumina samples.30
of supercooled liquid alumina approached
values measured for solid-state amorphous alumina samples.30
Table 1. Summary of Structural Data for Amorphous and Molten Aluminum Oxides.
| techniquea | sampleb | RC (Å) | [3]Al | [4]Al | [5]Al | [6]Al | ref | ||||
|---|---|---|---|---|---|---|---|---|---|---|---|
| N- and X-PDF, RMC | molten | 2.5 | 4.40 | 2.9 | 3.5 | 58 | 35 | 4.3 | (30) | ||
| N-PDF, EPSR | molten | 4.20 | 2.7 | 12 | 62 | 24 | 2 | (33) | |||
| SS-NMR | sputtered film | 4.48 | 55 | 42 | 3 | (42) | |||||
| SS-NMR | PEALD film | 4.51 | 54 | 41 | 5.1 | (43) | |||||
| X-PDF, RMC | ALD film on CNT | 2.2 | 4.67 | 2.88 | (25) | ||||||
| e-PDF, RMC | ALD film on CNT | 4.97 | 3 | (31) | |||||||
| MD, melt quench | 2.2 | 4.24 | 2.83 | 0.1 | 77 | 21 | 1.6 | this work | |||
| MD, melt quench | 2.5 | 4.41 | 2.94 | 0 | 65 | 30 | 5.4 | this work |
N-PDF = neutron PDF; X-PDF = X-ray PDF; SS-NMR = solid-state nuclear magnetic resonance; EPSR = empirical potential structure refinement; CNT = carbon nanotube; and MD = molecular dynamics.
Indicates whether experimental data were used to refine or determine structure. If no feedback from experimental data was used, this field is blank.
The local structure of solid state amorphous alumina
has been primarily
examined by solid-state NMR and scattering studies often coupled with
atomistic simulations. Some variance has been observed in both the
estimated average and distribution of coordination numbers (Table 1). Focusing on ALD
films, NMR studies of plasma-enhanced ALD (PEALD) aluminum oxide revealed [4]Al (54.3%), [5]Al (40.6%), [6]Al (5.1%).
Quantification of coordination numbers in NMR involves the integration
of distinct NMR peaks, as opposed to MD/RMC methods that rely on a
cutoff pair distance to define which pairs are “bonded”.
Thus, agreement between these two methods at determining the coordination
number may not occur. X-ray scattering and PDF analysis coupled with
RMC simulations on ALD alumina–carbon nanotube composites was
recently reported.25 This work showed a
similar PDF profile to molten alumina, and RMC analysis indicated
an average coordination number for Al of  . Similar information,
albeit with a higher
. Similar information,
albeit with a higher  was found for
cryoelectron-based scattering
and PDF analysis.31 Importantly, this prior
work on electron and X-ray PDFs of ALD alumina exploited the high
surface area of carbon nanotubes as a growth substrate, which may
result in a different local or long-range structure compared to most
ALD thin films due to the high degree of curvature.37
was found for
cryoelectron-based scattering
and PDF analysis.31 Importantly, this prior
work on electron and X-ray PDFs of ALD alumina exploited the high
surface area of carbon nanotubes as a growth substrate, which may
result in a different local or long-range structure compared to most
ALD thin films due to the high degree of curvature.37
An understanding of ALD alumina thin films and, in general, how synthetic factors lead to observed changes in measured properties, such as electronic defects, has proven difficult for amorphous materials. Accurate first principle calculations, such as density functional theory (DFT), that have proven useful in understanding the properties of crystalline materials are hindered by N3 scaling (N being a measure of system size, i.e., atoms, bands or basis functions, and unit cell volume), and amorphous materials typically need large unit cells (on the order of thousands to tens of thousands of atoms) to accurately match experimental PDFs. Further, imposing any periodicity on an aperiodic system will inherently create artifacts that may only be due to the model and not the material. Thus, first-principles predictions for amorphous materials have been limited to those for which relatively small unit cells (<500 atoms) are generated directly by MD38 or at the local density approximation39 level of theory.
The cited investigations of ALD alumina have yielded deep insight and understanding of their compositions and how the composition is affected by deposition temperature, chemistry, and postprocessing. However, little is known about the local structure in ALD alumina, and X-ray PDF data on planar ALD alumina has not yet been reported. Further, the structural evolution by post-deposition heating presents some valuable scientific questions. For instance, is there an evolution in the medium-range order prior to crystallization? In addition, without a good experimental understanding of the local atomic structure of ALD alumina, it is difficult to build accurate computational models that might yield a better understanding of the what structural motifs that lead to the measured properties, such as fixed charge,40,41 of these important films.
Here, we combine grazing incidence synchrotron X-ray scattering, MD simulations, and DFT-based calculations to provide a better understanding of the geometric and electronic structures of amorphous ALD films. In particular, grazing incidence synchrotron X-ray scattering data were compared to MD simulations that modeled short- and medium-range order in amorphous ALD alumina planar thin films in the as-deposited state and after annealing at 450 and 700 °C in air. MD-generated unit cells exhibiting similar the short- and medium-range characteristics of the ALD films were analyzed using DFT, providing evidence of possible structural motifs that lead to the trap states in these films.
Experimental
Film Growth
Borosilicate glass substrates (Corning 1737 AMLCD, 25 × 75 mm) were cleaned via sonication for 5 min and subsequently by the Radio Corporation of America-1 (RCA-1) process. ALD was performed at 200 °C using TMA and water, which were both held at room temperature. Approximately 1.7–1.9 μm films were grown using a Veeco-CNT Savannah 200 ALD system. ALD pulse times were 0.015 s for TMA and water, and a purge time of 8 s was used between pulses, resulting in a growth rate of ∼1 Å/cycle. The samples were then coated halfway with a photoresist. To provide a known fluorescent material for footprint calibrations, the samples were then coated with approximately 10 nm of hafnium oxide by ALD using tetrakis(dimethylamido)hafnium(IV) (TDMAH) and water at a substrate temperature of 120 °C. The photoresist was then removed via 5 min of sonication in acetone and subsequent rinsing with acetone, isopropyl alcohol, and water. The samples underwent post-deposition anneals of 450 and 700 °C under a continuous flow of nitrogen, and one sample was left in the as-deposited state. Spectator wafers without the hafnia coating were also processed in parallel as control samples.
Film Measurements
Grazing incidence total X-ray scattering44 measurements were then carried out on the thin films at beamline 10–2 of the Stanford Synchrotron Radiation Lightsource (SSRL) using a 21.5 keV monochromatic focused X-ray beam narrowed using a pair of roller slits to dimensions of ∼30 μm × 50 μm. In order to measure the high-Q total scattering, the beamline consisted of soller slits and a silicon drift detector (Vortex). A full multichannel analyzer (MCA) spectrum was collected at every scattering point and utilized to extract elastic, inelastic or Compton, and fluorescence signals via spectrum analysis. Following careful alignment, X-ray reflectivity (XRR) data and Hf L-edge fluorescence signals (Lα, Lβ, and Lγ) from the hafnium oxide capping layer were collected as a function of incidence angle for each sample. Based on these XRR data and angle curves, the critical angle was determined, and an appropriate incident angle (ca. 0.14 deg.) was selected to maximize scattering from the ALD Al2O3 film. This fluorescence optimization was coupled with scattering scans as a function of the incident angle to ensure the X-ray beam was fully attenuated before reaching the borosilicate glass substrate. Total scattering data were collected from momentum transfer (Q) from 0.1 to 20.1 Å–1, with a Q-weighted counting scheme to ensure the data were of a statistically significant quality up to 20 Å–1. This upper limit in the Q range is due to constraints on the grazing incidence setup for such thin films. Typically, a counting scheme was used to ensure at least 10 000 counts at each Q value to ensure a noise level of 1% or better based on Poisson statistics; typically, at least three scans were averaged for each sample before data analysis. An air scatter scan was also collected as a correction for low-Q data.
To probe the sample composition, RBS data were collected at Rutgers University using a General Ionex Tandetron with a beam of 2.0 MeV He2+ ions. A solid-state detector was placed at a backscatter angle of 163°. The combined beam and detector resolution was 21 keV. Data were fit using SimNRA. X-ray photoelectron spectroscopy (XPS) data were collected using a Thermo K-Alpha system. Electrons were excited using a monochromated Al Kα source with an energy of 1486.7 eV. The total instrumental resolution was 0.5 eV. Films were measured in the as-received state and after Ar sputter etching intended to remove approximately 10 nm of material. Elemental compositions were estimated by subtracting a Shirley background from the Al, O, and C spectra and normalizing each peak area by its Scofield cross section and the inelastic mean free path calculated using the Tanuma–Powell–Penn approximation.
PDFgui simulations
Computer-generated G(r) data from crystal files were created using PDFgui.45 Crystallographic information files were loaded, and G(r) data were generated with the following parameters: ADP = 0.003, Qdamp = 0.001, Qbroad = 0, and Qmax = 18.1. The θ-Al2O3 structure was also fit in PDFgui (denoted θfit) to the experimental G(r) data, in which case the cell parameters (a, b, and c), ADP, the scale factor, and Qdamp were adjusted to attempt to match the experimental data.
Molecular Dynamics
Classical molecular dynamics (MD) techniques were utilized to simulate amorphous alumina. The interatomic pair potentials describing the system energy and the force on each atom as a function of the atomic configuration are a combination of a long-range Coulombic interaction and a short-range Buckingham potential, leading to the following form for the potential energy between a pair of atoms:
where r is the distance between atoms α and β and Z is the effective charge of an atom (in units of electron charge e). In simulations here, the long-range Coulombic contribution was computed using an Ewald summation approach with a real-space calculation cutoff of 12 Å; short-range Buckingham contributions were also cut off at 12 Å. The pair specific parameters A, B, and C and partial charge values Z for the Al2O3 system were originally advanced by Matsui.46 This potential was subsequently shown to predict many properties of the Al2O3 system in agreement with the experiment, including crystalline structures, density, bulk moduli, thermal expansion behavior, and melting point.47,48 This potential was also used to explore both the liquid state and the quenched amorphous structure and demonstrated agreement with experimental results, particularly for pair separation distances.36,49 In all simulations, a time step of Δt = 0.0005 ps was used; this time step ensured numerical stability in high-temperature simulations. The open-source simulation code LAMMPS was used for all MD simulations.50 The simulated amorphous samples were generated using a melt–quench procedure.
Samples with N = 5760 atoms (1152 Al2O3 stoichiometric units) were initially constructed in an α-Al2O3 structure and then melted at T = 5000 K in an isothermal–isobaric ensemble (NPT with P = 1 atm) for a simulation duration of 100 ps. Following this, maintaining an isobaric P = 1 atm condition, the temperature was reduced to T = 2400 K over a simulation duration of 100 ps. During a subsequent NPT ensemble simulation at T = 2400 K, diffusion analysis again ensured the system was in a liquid phase; the density at this state point was ρ = 2.83 g/cc. Next, maintaining P = 1 atm, simulated systems were quenched to T = 300 K over a prescribed time duration corresponding to a specified quench rate. Quench rates (dT/dt) explored here varied from 1 × 10¹¹ to 1 × 10¹⁴ K/s. After the system was quenched to T = 300 K, a 100 ps simulation in an NPT ensemble was run with T = 300 K; the last 50 ps of that simulation was used to compute structural data. Simulations were demonstrated to be free from system size effects by the negligible difference in the thermodynamic behavior during the quench (e.g., density versus T) and the structural characterization at T = 300 K (e.g., radial distribution function analysis) between systems with N = 5760 atoms and N = 57600 atoms.
MD simulations were also used to generate smaller amorphous Al2O3 structures with N = 240 atoms (58 stoichiometric units). Such small systems, while amenable to density functional theory (DFT) calculations, truncate atomic interactions at a distance less than the classical interatomic potential cutoff, resulting in glass transformation temperatures higher than those observed for simulated system sizes that fully saturated the interatomic potential (i.e., N = 5760 atoms). Thus, for the N = 240 atom systems, the quench to T = 300 K was started from the equilibrated melt simulation at T = 5000 K and quenched with dT/dt = 1.5 × 10¹³ K/s. Because N = 240 atom systems exhibit a limited number of structural motifs, five different samples were prepared to account for structural variation. The five samples were obtained by beginning the quench to T = 300 K at different points in time during the preceding melt simulation at T = 5000 K.
DFT
First-principles calculations were carried out using density functional theory (DFT) and the electron projector-augmented wave (PAW) scheme as implemented in the Vienna Ab Initio Simulation Package (VASP).72,73 Each calculation was performed using a 400 eV plane-wave cutoff coupled with the hybrid HSE0674 correlation-exchange functional and the following [core]valence configurations for each element: Al = [Ne]3s3p and O = [He]2s2p. Density of states (DoS) calculations for the crystalline α- and θ- and θFit-Al2O3 polymorphs were accomplished using 30 and 10 atom unit cells, respectively, with k-space integrations over an 8 × 8 × 12 Γ-centered k-point grid. As the amorphous unit cells are not definable by k-vectors, we report only the DoS sampled at the Γ-point (i.e., the 1 × 1 × 1 grid). Because of the large lattice dimensions of the N = 240 unit cells, the Γ-point-sampled electronic structure likely captures a large number of the electronic states of each unit cell.
Results and Discussion
X-ray Scattering Data and Comparison to Crystalline Polymorphs
The alumina samples were all deposited at a sample temperature of 200 °C and split such that some samples were annealed at temperatures of either 450 or 700 °C to investigate potential thermally induced changes in short- and medium-range orders. RBS and XPS performed on these samples indicated that, as expected, the O/Al ratio was 1.5 ± 0.1. Additionally, the carbon content after ∼10 nm of Ar+ sputtering was less than 1%, matching what has generally been observed using these growth conditions.51
Elastic X-ray scattering measurements (21.5 keV) were conducted on ALD alumina thin films in a grazing incidence geometry.44I(Q) data were corrected for air-scattering, absorption, Lorentz effects, polarization effects, Compton scattering, and geometric dependency on momentum transfer and then normalized to determine the X-ray-weighted total structure factor, S(Q), using PDFgetX252 (Figure 1). The S(Q) data show broad features and peak locations similar to the measured S(Q) of molten alumina and ALD alumina on carbon nanotube supports,25,30 providing evidence of the similarity in the short-range structure.
Figure 1.

(top) Smoothed S(Q) data and (bottom) corresponding G(r) data for the as-deposited sample and the samples annealed at 450 and 700 °C. Vertical lines indicate approximate peak positions in experimental G(r).
The S(Q) was smoothly damped to zero at the high Q range using a Lorch function53 to mitigate finite inverse Fourier transform artifacts. These data were then transformed into real space G(r) data (Figure 1, pair distances where clear peaks were observed are marked with vertical dashed lines). Beyond 5 Å, no features were observed in the G(r) data . No significant differences in the G(r) data were observed among the three ALD alumina samples with different thermal histories, providing evidence that no major structural changes occurred after annealing at temperatures up to 700 °C, the highest temperature accessible for this experiment due to the stability of the borosilicate glass substrates. Specifically, no evidence for the emergence of medium- or long-range order was found. While 700 °C is below the temperature where crystallization (emergence of long-range order) has been observed in prior studies,14−19 this result provides evidence that no changes in the medium- or short-range order occur at these intermediate temperatures.
The experimental ALD alumina G(r) data were compared with G(r)
data of several known aluminum oxide and hydroxide phases to search
for similarity in the short-range order (Figure 2). The first peak, which is associated with
Al–O pair separation (1.76 Å, reported from the peak center),
is notably shorter in the experimental data than those for most of
the crystalline phases, including the thermodynamically stable α-alumina
(1.94 Å), with the exception of κ- and θ-alumina
(1.87 and 1.79 Å, respectively); θ-alumina shows the closest
match. A decrease in the nearest-neighbor coordination relative to
crystalline polymorphs was previously measured in molten metal oxides
and may play some role in this short bond length relative to the known
crystalline polymorphs.54 The second and
third peaks of both the κ and θ phases align closely with
those of experimental ALD alumina G(r). The comparison to θ-alumina, which has both four and six-coordinate
Al species, has been invoked in prior ALD alumina X-ray scattering
studies.25 The appropriateness of this
structural analog is evidenced by considering the average  of 5 in the θ phase and the fact
that prior studies of molten and amorphous aluminas have generally
shown
of 5 in the θ phase and the fact
that prior studies of molten and amorphous aluminas have generally
shown  values ranging from approximately 4.2 to
4.9 (Table 1). Thus,
these data provide further confirmation that planar ALD alumina may
exhibit similar average short-range order (SRO) compared
to molten alumina, θ-alumina, and ALD alumina deposited on carbon
nanotubes.25
values ranging from approximately 4.2 to
4.9 (Table 1). Thus,
these data provide further confirmation that planar ALD alumina may
exhibit similar average short-range order (SRO) compared
to molten alumina, θ-alumina, and ALD alumina deposited on carbon
nanotubes.25
Figure 2.
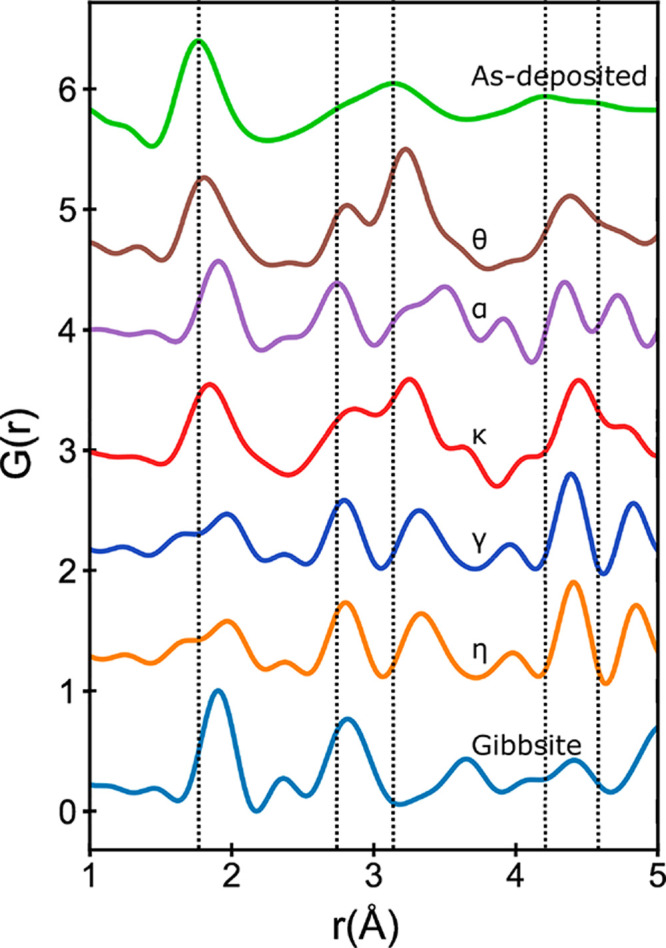
From top to bottom: experimental G(r) data for as-deposited ALD alumina and simulated G(r) data for selected Al2O3 phases and Gibbsite (Al(OH)3). Note that γ- and η-phases show identical G(r) data, as they are the same structure. Vertical lines are drawn at approximate peak positions for the experimental data, as described in Figure 1b.
To further investigate potential SRO matches to θ-alumina, the crystalline polymorph was modified and fit to the experimental data using PDFgui (Figure 3).45 Although PDFgui models the X-ray PDF of a crystal, the unit cell parameters, atomic displacement parameters, and broadening parameters can all be modified to fit the experimental PDF and may provide a simple model for the SRO in amorphous ALD alumina and an assignment of features in G(r) to specific atomic pairs. Parameters that were modified to fit the experimental data are shown in the Supporting Information (Table S1). The θ-Al2O3G(r) data, a fit to the experimental data (θfit), and the partial G(r) data for each pair are shown along with the experimental G(r) data in Figure 3. The experimental G(r) data match well with the PDFgui-simulated G(r) data, with differences primarily in the relative intensities of peaks rather than peak locations. Notably, the first peak corresponding to the Al–O pair is shifted in the θfit from 1.79 to 1.77 Å. Peak positions in the partial G(r) plot for O–O and Al–Al pairs were observed beginning near 2.6 and 3.0 Å, corresponding to the second and third features in the experimental data, respectively. From this simple simulated model, one can provide possible primary structural units (PSUs) for this amorphous structure based on [4]Al and [6]Al consisting of corner-sharing tetrahedra and corner- and edge-sharing octahedra, respectively. Although these PSUs are certainly an oversimplification of the structural diversity within the actual films, they give a representative molecular understanding of the film. One obvious shortfall of this simple model is the lack of fivefold-coordinated Al species, which have been observed in amorphous or molten samples both experimentally and in simulations.26,30,36,42,43
Figure 3.

From top to bottom: experimental G(r) data for as-deposited ALD alumina and θ-Al2O3 fit to experimental data using PDFgui and partial G(r) data for Al–O, O–O, and Al–Al pairs from the θ-Al2O3 fit.
Molecular Dynamics Modeling
In order to move beyond structural modeling based on known alumina polymorphs to a physics-informed “bottom up” approach, classical MD simulations were used to generate amorphous Al2O3 atomic configurations for comparison to the experiment. Experimental systems studied here were prepared via ALD, but the atomic-scale modeling of ALD at experimental growth rates is not yet possible due to time constraints on MD simulations. Thus, simulated amorphous samples were generated using a melt–quench procedure. Because sample preparation methods differ between the simulation and the experiment, it is important to justify comparing results from one to the other. Most notably, prior simulation studies that explored the liquid and amorphous Al2O3 state using the same potential model used here demonstrated agreement with experiment, particularly for pair separation distances. In prior work examining the amorphous state, a melt–quench procedure was used while experimental data came from samples prepared via the anodic oxidation of aluminum foils. Thus, the model used here should predict an amorphous structure with pair separation distances in agreement with the experiment despite the fact that the computational work described here does not model the ALD growth process.
The true nature of the amorphous structure is well represented by the N = 5760 atom systems, which are large enough to accurately capture the thermodynamics and kinetics inherent in the underlying material model (i.e., the interatomic potential functions). Quench rates spanning three orders of magnitude were used to prepare simulated amorphous samples, resulting in negligible differences in simulated densities. For example, the equilibrated T = 300 K density was ρ = 3.23 g/cm3 for the fastest quench rate dT/dt = 1× 10¹¹ K/s, while ρ = 3.23 g/cm3 for the for the slowest quench rate dT/dt = 1× 10¹¹ K/s. Since the error in those values is on the order of 1%, the difference observed is not statistically significant. Note that the density values obtained were in the upper half of the somewhat broad range of density that has been observed experimentally for amorphous Al2O3 samples (2.4–3.5 g/cm3).4,22,24,56
Minimal differences existed between simulated G(r) data (Figure 4) for all quench rates using N = 5760 atom systems quenched to T = 300 K; for discussion here, data from one representative run are shown. G(r) bin atomic separation distances were simulated without accounting for species-dependent scattering and other effects that influence peak intensities in experimental PDF data. Since peak positions are unaltered by such effects, instead of comparing G(r) data from the experiment and the simulation directly, we compare peak positions obtained from simulated partial G(r) data (Figure 4) to peak positions observed in the experimental G(r) plot . The position of the first neighbor peak in simulated Al–O partial G(r) data (1.8 Å) agrees well with the first peak position observed in the experimental G(r) plot. Simulated Al–Al partial G(r) data exhibit a broad first peak whose position (3.1 Å) is also in good agreement with a peak observed in the experimental G(r) plot. Data from the simulated O–O partial G(r) plot exhibit a first peak at 2.8 Å; at the same separation distance, a shoulder feature is present on the broad second peak in the experimental G(r) plot. Lastly, a relatively small peak exists in simulated Al–O partial G(r) data at 4.3 Å, which is in agreement with a peak observed in the experimental G(r) plot. These observations provide evidence that the amorphous Al2O3 structure obtained from MD simulations is comprised of short- to medium-range bonding environments similar to those that exist in the ALD-deposited samples. However, we note that the MD-derived models may not capture all of the bonding motifs in the actual ALD alumina samples. Given this, simulated atomic ensembles were used to characterize the short- and medium-range bonding environments in greater detail.
Figure 4.

From top to bottom: experimental X-ray G(r) data from the as-deposited ALD sample, total G(r) from the MD simulation, and partial G(r) data for the Al–O, O–O, and Al–Al pairs.
Simulated atomic configurations
can be used to characterize bonding
environments with greater detail than can be obtained from experiments.57−60 The average coordination number of O atoms around Al as a function
of the cutoff distance Rc (Figure 5a) and the
average coordination numbers (averaged over time and all Al atoms
in the system, Table 1) match well with previous studies, which used coordination cutoffs
(Rc) between 2.2 ( = 4.24) and 2.5 Å (
 = 4.41). Examining coordination statistics
for both of these cutoff distances shows that the coordination is
dominated by fourfold-coordinated Al and threefold-coordinated O.
In addition, the bond angle distributions (BADs, Figure 5b) for the O–Al–O
and Al–O–Al triplets were computed (Rc = 2.2 Å). The primary peak near
104° in the O–Al–O bond angle distribution results
from tetrahedrally coordinated Al atoms, and the small secondary peak
near 170° results from fivefold-coordinated Al atoms. For the
Al–O–Al bond angle distribution, the peaks near 95°
and 120° correspond generally to edge- and corner-sharing polyhedra,
respectively, as observed in prior work.26,34,36,61
= 4.41). Examining coordination statistics
for both of these cutoff distances shows that the coordination is
dominated by fourfold-coordinated Al and threefold-coordinated O.
In addition, the bond angle distributions (BADs, Figure 5b) for the O–Al–O
and Al–O–Al triplets were computed (Rc = 2.2 Å). The primary peak near
104° in the O–Al–O bond angle distribution results
from tetrahedrally coordinated Al atoms, and the small secondary peak
near 170° results from fivefold-coordinated Al atoms. For the
Al–O–Al bond angle distribution, the peaks near 95°
and 120° correspond generally to edge- and corner-sharing polyhedra,
respectively, as observed in prior work.26,34,36,61
Figure 5.

Results for simulated amorphous Al2O3 using N = 5760 atoms. (a) Average coordination number (CN) of O around Al as a function of the cutoff distance Rc used to find atoms within the first coordination sphere. (b) Bond angle distributions for Al–O–Al (solid, red) and O–Al–O (dashed, blue).
In addition to characterizing atomic bonding environments, classical MD simulations were used to prepare amorphous Al2O3 atomic ensembles for the DFT calculation of the electronic structure; five N = 240 atom systems were generated. Each system started the quench procedure from a different starting state in the preceding T = 5000 K melt simulation. The average approximate edge length for the N = 240 simulation cells is 13.5 Å, which ensure that atomic interactions out to second and third neighbor shells are well represented. Density, G(r), and BADs for these five systems were compared to results for the N = 5760 atom system. Although an identical quench rate was used in each of the N = 240 simulation procedures, variation existed in their T = 300 K quenched density, which spanned from ρ = 3.05 g/cm3 to ρ = 3.30 g/cm3. For comparison to the N = 5760 atom system, after quenching and equilibration at T = 300 K, all N = 240 atom systems were scaled in atomic space to have the same density as the N = 5760 atom system (ρ = 3.244 g/cm3). Scaled systems were then re-equilibrated for a 100 ps duration. Density scaling resulted in the observation of at most a 2% change in peak positions in full and partial G(r) data and did not affect the overall shape of any structural distribution presented here. The largest observed changes in coordination statistics due to scaling were comparable to the approximate error in those calculations (i.e., approximately 1–2%). Thus, all comparison data presented here are for constant-density atomic ensembles.
For each of the partial G(r) plots, significant variation among the five N = 240 atom systems is evident (Figure 6). Since G(r) is a histogram of atom pair distances, smaller system sizes result in selective population of the histogram and lead to variation among samples. Nonetheless, the pair separation distances in the N = 240 atom systems are consistent with those in the N = 5760 atom system, as evidenced by the similarity between the average curve for the N = 240 atom systems and the N = 5760 atom system (Figure 6).
Figure 6.

Partial G(r) for simulated amorphous Al2O3 systems. Three sets of seven curves are shown; from top to bottom, they are for the Al–O, Al–Al, and O–O pairs. For each set of curves, five are presented with lower line weights; those five curves each represent data from each of the five N = 240 atom systems. Two curves in each set are shown in heavier line weights; one is an average over the data from five N = 240 atom systems (dashed), and one is for the N = 5760 atom system (solid).
Table 2 presents Al–O coordination statistics for the MD models. The differences in coordination statistics in the N = 240 atom systems correlate with variations in partial G(r) data in Figure 6. For example, samples III and V exhibit characteristic increases in the concentration of fivefold- and sixfold-coordinated Al along with an increased concentration of fourfold-coordinated O. Those same two systems are the ones whose first Al–O peaks in Figure 6a are shifted to slightly larger separation distances, and Al–O bond lengths for fivefold- and sixfold-coordinated Al atoms are, on average, somewhat larger than those for fourfold-coordinated Al atoms. This is similar to some crystalline polymorphs that exhibit sixfold-coordinated Al; for those species, Al–O bond lengths are longer. For example, this longer Al–O bond length can be observed in Figure 2 for gibbsite (Al(OH)3) and α-Al2O3. Coordination data in Table 2 for N = 240 atom systems, particularly on average, agree with data for the N = 5760 atom system.
Table 2. Coordination Statistics in Amorphous Al2O3 Models Herea.
| system | [2]O | [3]O | [4]O | [5]O | [3]Al | [4]Al | [5]Al | [6]Al |
|---|---|---|---|---|---|---|---|---|
| N = 5760 | 19.3 | 78.5 | 2.2 | 0 | 0.1 | 77.0 | 21.3 | 1.6 |
| N = 240 (avg) | 18.7 | 71.1 | 9.9 | 0.3 | 1.1 | 65.3 | 28.2 | 5.3 |
| N = 240 (I) | 22.1 | 68.7 | 9.2 | 0 | 1.0 | 71.2 | 23.8 | 4.0 |
| N = 240 (II) | 24.5 | 70.9 | 4.5 | 0 | 1.2 | 79.5 | 17.3 | 2.0 |
| N = 240 (III) | 15.2 | 72.7 | 11.8 | 0.3 | 0 | 60.9 | 32.3 | 6.8 |
| N = 240 (IV) | 23.7 | 67.6 | 8.7 | 0 | 3.3 | 69.4 | 24.1 | 3.2 |
| N = 240 (V) | 8.1 | 75.4 | 15.2 | 1.3 | 0.2 | 45.5 | 43.8 | 10.5 |
Values are percentages obtained using Rc = 2.2 Å, where [n]A is n-fold coordinated A (atom).
While it might appear that there are larger differences between the N = 240 and N = 5760 atom systems for BADs than for partial G(r), this is a statistical effect. Specifically, data in G(r) are based on atomic pairs, while data in BADs are based on atomic triplets, making the variation in BADs for small systems more significant. Qualitatively, BADs (Figure 7) from the small systems agree with data from the large system in that the distributions all span effectively the same angle range, and there is some agreement in the overall distribution shape (number of peaks and peak position). The average plot of Al–O–Al bond angles (Figure 7a) for the N = 240 atom systems has two peaks whose positions are in reasonable agreement with the N = 5760 atom system, which generally correspond to corner- and edge-sharing polyhedra with reversed magnitudes. Some of the N = 240 atom systems show a small peak at high angles in both the Al–O–Al and O–Al–O bond angles that is not present in the data of the N = 5760 atom system. For the O–Al–O bond angle (Figure 7b), higher coordination Al atoms in some of the N = 240 atom systems push the first peak to a lower angle and increase the relative magnitude of the peak at the high angle.
Figure 7.

Bond angle distributions for (a) Al–O–Al and (b) O–Al–O in the simulated amorphous Al2O3 systems. There are seven curves in each plot, five of which are presented with lower line weights; those five curves each represent data from one of the five N = 240 atom systems. Two curves are shown in heavier line weights; one is an average of the data over the five N = 240 atom systems (dashed), and one is for the N = 5760 atom system (solid).
Overall, our analysis suggests that these smaller systems are suitable as inputs for the DFT-based analysis of their electronic structure and for understanding how short- and medium-range order affect the electronic structure. Both the partial G(r) data and BAD data for N = 240 atom systems show that the structural motifs present in those systems are properly representative of the N = 5760 atom system.
DFT Analysis of MD-Derived Amorphous Structure
The N = 240 atom cells created using MD were used as inputs in DFT calculations to examine the electronic structure of amorphous alumina. These are directly compared to that of crystalline (α and θ) Al2O3 and the PDFgui-modified θfit phase. The DoS of the crystalline Al2O3 structures confirms that in each crystalline polymorph the valence band (VB) is hybridized oxygen p and aluminum d orbitals while the conduction band (CB) is a mix of p and s character (Figure 8).38,39,62 The largest band gap (EG) is calculated for the α-Al2O3 polymorph at 7.76 eV. This value was reduced to 6.46 and 7.08 eV for the θ and θfit polymorphs, respectively. The DoS values show that the increase in EG from θ to θfit is due to the red-shifting of a small shoulder peak of mainly p character away from the Fermi energy (EF) in θfit. This effect can be attributed shorter Al–O bond lengths and thus better orbital overlap between Al and O atoms, which result in a lower-energy peak in θfit. Similar differences in band edge positions arising from variations in the local Al–O symmetry were documented previously.63
Figure 8.

Projected density of states for (a–c) crystalline and (d) amorphous Al2O3 polymorphs. The amorphous density of states was obtained by averaging data across all five N = 240 samples (all are shown in Figure S2) and shows the characteristic disruption of the defined valence band and conduction band edges.
The high disorder of amorphous Al2O3, the variation in the five N = 240 unit cells, and the symmetry restriction to Γ-point sampling could make the DFT analysis of the electronic structure of these materials difficult.64−68 However, the slight variations seen in the G(r) data and BADs of each N = 240 unit cell does not lead to a large difference in the DoS (Figure 8 and S2) or the orbital-resolved projected DoS (Figure S3). However, the atomic disorder creates a large number of tail states that result in the significant disruption of defined VB and CB edges, in comparison to the crystalline structures, and prevents the conclusive assignment of EG. To gain further insight into the nature of these tail states, we calculated the inverse participation ratio (IPR) for each amorphous sample, which was defined for the ith Kohn–Sham orbital φi in real space as
Such analysis has been used extensively to investigate the electronic properties of amorphous materials.66,69,70 The IPRs for the five amorphous samples indicate that the greatest degree of localization occurs for electrons at the top of the VB (Figure S4), as delocalized bands are not found until ∼2 eV below EF. Inspection of the charge density of these tail states across all five samples shows that electrons localize in 2p orbitals centered on twofold-coordinated bridging oxygens (Figure S4). These states are unique to the amorphous structure, as the crystalline polymorphs contain only threefold- and fourfold-coordinated oxygens.
Above EF, low IPR values indicate the formation of extended Bloch states that allow the qualitative estimation of the mobility edge, giving an approximate EG of 6–7 eV for the amorphous samples. However, in several of the samples studied, localized electron traps occur ∼2 eV or more below the extended CB edge. These states consist of regions of localized charge density within cavities formed by Al–O ring-like structures in the material (Figure S4). Electron trapping in such sites was previously suggested to be the source of a number of observed properties, particularly negative charging in amorphous Al2O3 films.71 Among the five amorphous samples studied here, the degree of localization, energetics, and structural motifs that contribute such electron traps are highly variable; however, all samples indicate that both twofold-coordinated oxygen and Al–O rings are critical structures that exist in the amorphous material that change the electronic properties of the material.
Conclusions
X-ray scattering-derived structural data were acquired for ALD alumina films with different thermal histories. Notably, similar short-range order was found for these samples compared to molten and other amorphous alumina samples. The closest crystalline structural analog was found to be θ-alumina. More realistic structural models were created using MD, and these models matched well with peak positions from the X-ray-based PDF data and prior MD results. Careful downscaling of the MD model size resulted in DFT-tractable models largely consistent with larger models. The calculated electronic structure confirmed that most of the properties of amorphous alumina are similar to those of θ-alumina. However, Al–O alternating ring structures and twofold-coordinated oxygen lead to midgap electron traps and the modification of the valence band edge, respectively.
Acknowledgments
The authors thank Ritwik Bhatia of Veeco CNT for the deposition of the alumium oxide films.
Supporting Information Available
The Supporting Information is available free of charge at https://pubs.acs.org/doi/10.1021/acsomega.2c04402.
Table of parameters for PDFgui simulations and total density of states for N = 240 atom samples (PDF)
The authors acknowledge funding from Lehigh University and from NSF award 1605129.
The authors declare no competing financial interest.
Supplementary Material
References
- Hoex B.; Heil S. B. S.; Langereis E.; van de Sanden M. C. M.; Kessels W. M. M. Ultralow Surface Recombination of C-Si Substrates Passivated by Plasma-Assisted Atomic Layer Deposited Al2O3. Appl. Phys. Lett. 2006, 89 (4), 042112. 10.1063/1.2240736. [DOI] [Google Scholar]
- Hezel R.; Jaeger K. Low-Temperature Surface Passivation of Silicon for Solar Cells. J. Electrochem. Soc. 1989, 136 (2), 518. 10.1149/1.2096673. [DOI] [Google Scholar]
- Carcia P. F.; McLean R. S.; Reilly M. H.; Groner M. D.; George S. M. Ca Test of Al 2O 3 Gas Diffusion Barriers Grown by Atomic Layer Deposition on Polymers. Appl. Phys. Lett. 2006, 89 (3), 031915. 10.1063/1.2221912. [DOI] [Google Scholar]
- Groner M. D.; Fabreguette F. H.; Elam J. W.; George S. M. Low-Temperature Al2O3 Atomic Layer Deposition. Chem. Mater. 2004, 16 (4), 639–645. 10.1021/cm0304546. [DOI] [Google Scholar]
- Johnson R. S.; Lucovsky G.; Baumvol I. Physical and Electrical Properties of Noncrystalline Al2O3 Prepared by Remote Plasma Enhanced Chemical Vapor Deposition. J. Vac. Sci. Technol. A Vacuum, Surfaces, Film. 2001, 19 (4), 1353–1360. 10.1116/1.1379316. [DOI] [Google Scholar]
- Gusev E. P.; Copel M.; Cartier E.; Baumvol I. J. R.; Krug C.; Gribelyuk M. A. High-Resolution Depth Profiling in Ultrathin Al2O3 Films on Si. Appl. Phys. Lett. 2000, 76 (2), 176–178. 10.1063/1.125694. [DOI] [Google Scholar]
- Puurunen R. L. Surface Chemistry of Atomic Layer Deposition: A Case Study for the Trimethylaluminum/Water Process. J. Appl. Phys. 2005, 97 (12), 121301. 10.1063/1.1940727. [DOI] [Google Scholar]
- George S. M. Atomic Layer Deposition: An Overview. Chem. Rev. 2010, 110 (1), 111–131. 10.1021/cr900056b. [DOI] [PubMed] [Google Scholar]
- Miikkulainen V.; Leskelä M.; Ritala M.; Puurunen R. L. Crystallinity of Inorganic Films Grown by Atomic Layer Deposition: Overview and General Trends. J. Appl. Phys. 2013, 113 (2), 021301. 10.1063/1.4757907. [DOI] [Google Scholar]
- Katz M. B.; Twigg M. E.; Prokes S. M. Formation and Stability of Crystalline and Amorphous Al2O3 Layers Deposited on Ga2O3 Nanowires by Atomic Layer Epitaxy. J. Appl. Phys. 2016, 120 (12), 124311. 10.1063/1.4963282. [DOI] [Google Scholar]
- Prokes S. M.; Katz M. B.; Twigg M. E. Growth of Crystalline Al2O3 via Thermal Atomic Layer Deposition: Nanomaterial Phase Stabilization. APL Mater. 2014, 2 (3), 032105. 10.1063/1.4868300. [DOI] [Google Scholar]
- Ngo T. Q.; Goble N. J.; Posadas A.; Kormondy K. J.; Lu S.; McDaniel M. D.; Jordan-Sweet J.; Smith D. J.; Gao X. P. A.; Demkov A. A.; et al. Quasi-Two-Dimensional Electron Gas at the Interface of γ-Al2O3/SrTiO3 Heterostructures Grown by Atomic Layer Deposition. J. Appl. Phys. 2015, 118 (11), 115303. 10.1063/1.4930575. [DOI] [Google Scholar]
- Aarik L.; Mändar H.; Ritslaid P.; Tarre A.; Kozlova J.; Aarik J. Low-Temperature Atomic Layer Deposition of α-Al 2 O 3 Thin Films. Cryst. Growth Des. 2021, 21 (7), 4220–4229. 10.1021/acs.cgd.1c00471. [DOI] [Google Scholar]
- Afanas’Ev V. V.; Stesmans A.; Mrstik B. J.; Zhao C. Impact of Annealing-Induced Compaction on Electronic Properties of Atomic-Layer-Deposited Al2O3. Appl. Phys. Lett. 2002, 81 (9), 1678–1680. 10.1063/1.1501163. [DOI] [Google Scholar]
- Zhao C.; Cosnier V.; Chen P. J.; Richard O.; Roebben G.; Maes J.; Van Elshocht S.; Bender H.; Young E.; Van Der Biest O.; et al. Thermal Stability of High k Layers. Mater. Res. Soc. Symp. - Proc. 2002, 745, 9–14. 10.1557/PROC-745-N1.5. [DOI] [Google Scholar]
- Jakschik S.; Schroeder U.; Hecht T.; Gutsche M.; Seidl H.; Bartha J. W. Crystallization Behavior of Thin ALD-Al2O3 Films. Thin Solid Films 2003, 425 (1–2), 216–220. 10.1016/S0040-6090(02)01262-2. [DOI] [Google Scholar]
- Huntz A.-M.; Andrieux M.; Vahlas C.; Sovar M.-M.; Samelor D.; Gleizes A. N. Phase Transformations of Metallorganic Chemical Vapor Deposition Processed Alumina Coatings Investigated by In Situ Deflection. Journal of The Electrochemical Society. 2007, 154, P63. 10.1149/1.2715314. [DOI] [Google Scholar]
- Zhang L.; Jiang H. C.; Liu C.; Dong J. W.; Chow P. Annealing of Al2O3 Thin Films Prepared by Atomic Layer Deposition. J. Phys. D. Appl. Phys. 2007, 40 (12), 3707–3713. 10.1088/0022-3727/40/12/025. [DOI] [Google Scholar]
- Hsain Z.; Zeng G.; Strandwitz N. C.; Krick B. A. Wear Behavior of Annealed Atomic Layer Deposited Alumina. Wear 2017, 372-373, 139–144. 10.1016/j.wear.2016.12.011. [DOI] [Google Scholar]
- Dingemans G.; van de Sanden M. C. M.; Kessels W. M. M. Influence of the Deposition Temperature on the C-Si Surface Passivation by Al[Sub 2]O[Sub 3] Films Synthesized by ALD and PECVD. Electrochem. Solid-State Lett. 2010, 13 (3), H76. 10.1149/1.3276040. [DOI] [Google Scholar]
- Gosset L. G.; Damlencourt J.-F.; Renault O.; Rouchon D.; Holliger P.; Ermolieff A.; Trimaille I.; Ganem J.-J.; Martin F.; Séméria M.-N. Interface and Material Characterization of Thin Al 2 O 3 Layers Deposited by ALD Using TMA/H 2 O. J. Non. Cryst. Solids 2002, 303 (1), 17–23. 10.1016/S0022-3093(02)00958-4. [DOI] [Google Scholar]
- Guerra-Nuñez C.; Döbeli M.; Michler J.; Utke I. Reaction and Growth Mechanisms in Al2O3 Deposited via Atomic Layer Deposition: Elucidating the Hydrogen Source. Chem. Mater. 2017, 29 (20), 8690–8703. 10.1021/acs.chemmater.7b02759. [DOI] [Google Scholar]
- Ott A. W.; Klaus J. W.; Johnson J. M.; George S. M. Al3O3 Thin Film Growth on Si(100) Using Binary Reaction Sequence Chemistry. Thin Solid Films 1997, 292 (1–2), 135–144. 10.1016/S0040-6090(96)08934-1. [DOI] [Google Scholar]
- Dingemans G.; Einsele F.; Beyer W.; Van De Sanden M. C. M.; Kessels W. M. M. Influence of Annealing and Al 2 O 3 Properties on the Hydrogen-Induced Passivation of the Si/SiO 2 Interface. Cit. J. Appl. Phys. 2012, 111, 093713. 10.1063/1.4709729. [DOI] [Google Scholar]
- Young M. J.; Bedford N. M.; Yanguas-Gil A.; Letourneau S.; Coile M.; Mandia D. J.; Aoun B.; Cavanagh A. S.; George S. M.; Elam J. W. Probing the Atomic-Scale Structure of Amorphous Aluminum Oxide Grown by Atomic Layer Deposition. ACS Appl. Mater. Interfaces 2020, 12 (20), 22804–22814. 10.1021/acsami.0c01905. [DOI] [PubMed] [Google Scholar]
- Shi C.; Alderman O. L. G. G.; Berman D.; Du J.; Neuefeind J.; Tamalonis A.; Weber J. K. R. R.; You J.; Benmore C. J. The Structure of Amorphous and Deeply Supercooled Liquid Alumina. Front. Mater. 2019, 6, 38. 10.3389/fmats.2019.00038. [DOI] [Google Scholar]
- Manaila R.; Devenyi A.; Candet E. Structural Order in Amorphous Aluminas. Thin Solid Films 1984, 116 (1–3), 289–299. 10.1016/0040-6090(84)90451-6. [DOI] [Google Scholar]
- Ansell S.; Krishnan S.; Weber J. K. R.; Felten J. J.; Nordine P. C.; Beno M. A.; Price D. L.; Saboungi M. L. Structure of Liquid Aluminum Oxide. Phys. Rev. Lett. 1997, 78 (3), 464–466. 10.1103/PhysRevLett.78.464. [DOI] [Google Scholar]
- Lamparter P.; Kniep R. Structure of Amorphous Al2O3. Phys. B Condens. Matter 1997, 234–236, 405–406. 10.1016/S0921-4526(96)01044-7. [DOI] [Google Scholar]
- Skinner L. B.; Barnes A. C.; Salmon P. S.; Hennet L.; Fischer H. E.; Benmore C. J.; Kohara S.; Weber J. K. R.; Bytchkov A.; Wilding M. C.; et al. Joint Diffraction and Modeling Approach to the Structure of Liquid Alumina. Phys. Rev. B - Condens. Matter Mater. Phys. 2013, 87 (2), 53–58. 10.1103/PhysRevB.87.024201. [DOI] [Google Scholar]
- Jasim A. M.; He X.; Xing Y.; White T. A.; Young M. J. Cryo-EPDF: Overcoming Electron Beam Damage to Study the Local Atomic Structure of Amorphous ALD Aluminum Oxide Thin Films within a TEM. ACS Omega 2021, 6 (13), 8986–9000. 10.1021/acsomega.0c06124. [DOI] [PMC free article] [PubMed] [Google Scholar]
- Zeng L.; Tran D. T.; Tai C. W.; Svensson G.; Olsson E. Atomic Structure and Oxygen Deficiency of the Ultrathin Aluminium Oxide Barrier in Al/AlOx/Al Josephson Junctions. Sci. Rep. 2016, 6 (March), 1–8. 10.1038/srep29679. [DOI] [PMC free article] [PubMed] [Google Scholar]
- Landron C.; Hennet L.; Jenkins T. E.; Greaves G. N.; Coutures J. P.; Soper A. K. Liquid Alumina: Detailed Atomic Coordination Determined from Neutron Diffraction Data Using Empirical Potential Structure Refinement. Phys. Rev. Lett. 2001, 86 (21), 4839–4842. 10.1103/PhysRevLett.86.4839. [DOI] [PubMed] [Google Scholar]
- Le V. V.; Nguyen V. H.; Nguyen V. H.; Pham K. H. The Structure and Mechanical Properties in Amorphous Alumina under Pressure. Comput. Mater. Sci. 2013, 79, 110–117. 10.1016/j.commatsci.2013.06.019. [DOI] [Google Scholar]
- Van Hoang V. Molecular Dynamics Study on Structure and Properties of Liquid and Amorphous Al2O3. Phys. Rev. B - Condens. Matter Mater. Phys. 2004, 70 (13), 134204. 10.1103/PhysRevB.70.134204. [DOI] [Google Scholar]
- Gutiérrez G.; Johansson B. Molecular Dynamics Study of Structural Properties of Amorphous (Formula Presented). Phys. Rev. B - Condens. Matter Mater. Phys. 2002, 65 (10), 1–9. 10.1103/PhysRevB.65.104202. [DOI] [Google Scholar]
- Prokes S. M.; Katz M. B.; Twigg M. E. Growth of Crystalline Al2O3 via Thermal Atomic Layer Deposition: Nanomaterial Phase Stabilization. APL Mater. 2014, 2 (3), 032105. 10.1063/1.4868300. [DOI] [Google Scholar]
- Dicks O. A.; Shluger A. L. Theoretical Modeling of Charge Trapping in Crystalline and Amorphous Al2O3. J. Phys.: Condens. Matter 2017, 29 (31), 314005. 10.1088/1361-648X/aa7767. [DOI] [PubMed] [Google Scholar]
- Davis S.; Gutiérrez G. Structural, Elastic, Vibrational and Electronic Properties of Amorphous Al2O3 from Ab Initio Calculations. J. Phys.: Condens. Matter 2011, 23 (49), 495401. 10.1088/0953-8984/23/49/495401. [DOI] [PubMed] [Google Scholar]
- Hoex B.; Gielis J. J. H.; van de Sanden M. C. M.; Kessels W. M. M. On the c-Si Surface Passivation Mechanism by the Negative-Charge- Dielectric Al2O3. J. Appl. Phys. 2008, 104 (11), 113703. 10.1063/1.3021091. [DOI] [Google Scholar]
- Aboaf J. a.; Kerr D. R.; Bassous E. Charge in SiO2-Al2O3 Double Layers on Silicon. J. Electrochem. Soc. 1973, 120 (8), 1103. 10.1149/1.2403638. [DOI] [Google Scholar]
- Lee S. K.; Lee S. B.; Park S. Y.; Yi Y. S.; Ahn C. W. Structure of Amorphous Aluminum Oxide. Phys. Rev. Lett. 2009, 103, 095501. 10.1103/PhysRevLett.103.095501. [DOI] [PubMed] [Google Scholar]
- Lee S. K.; Park S. Y.; Yi Y. S.; Moon J. Structure and Disorder in Amorphous Alumina Thin Films: Insights from High-Resolution Solid-State NMR. J. Phys. Chem. C 2010, 114 (32), 13890–13894. 10.1021/jp105306r. [DOI] [Google Scholar]
- Shyam B.; Stone K. H.; Bassiri R.; Fejer M. M.; Toney M. F.; Mehta A. Measurement and Modeling of Short and Medium Range Order in Amorphous Ta2O5 Thin Films. Sci. Rep. 2016, 6, 32170. 10.1038/srep32170. [DOI] [PMC free article] [PubMed] [Google Scholar]
- Farrow C. L.; Juhas P.; Liu J. W.; Bryndin D.; Božin E. S.; Bloch J.; Proffen T.; Billinge S. J. L. PDFfit2 and PDFgui: Computer Programs for Studying Nanostructure in Crystals. J. Phys.: Condens. Matter 2007, 19 (33), 335219. 10.1088/0953-8984/19/33/335219. [DOI] [PubMed] [Google Scholar]
- Matsui M. A Transferable Interatomic Potential Model for Crystals and Melts in the System CaO-MgO-Al2O3-SiO2. Mineral. Mag. 1994, 58A (2), 571–572. 10.1180/minmag.1994.58A.2.34. [DOI] [Google Scholar]
- Ahuja R.; Belonoshko A. B.; Johansson B. Melting and Liquid Structure of Aluminum Oxide Using a Molecular-Dynamics Simulation. Phys. Rev. E 1998, 57 (2), 1673. 10.1103/PhysRevE.57.1673. [DOI] [Google Scholar]
- Belonoshko A. B. Melting of Corundum Using Conventional and Two-Phase Molecular Dynamic Simulation Method. Phys. Chem. Miner. 1998 252 1998, 25 (2), 138–141. 10.1007/s002690050096. [DOI] [Google Scholar]
- Gutiérrez G.; Belonoshko A. B.; Ahuja R.; Johansson B. Structural Properties of LiquidAl2O3: A Molecular Dynamics Study. Phys. Rev. E 2000, 61 (3), 2723. 10.1103/PhysRevE.61.2723. [DOI] [Google Scholar]
- Plimpton S. Fast Parallel Algorithms for Short-Range Molecular Dynamics. J. Comput. Phys. 1995, 117 (1), 1–19. 10.1006/jcph.1995.1039. [DOI] [Google Scholar]
- Blöchl P. E. Projector Augmented-Wave Method. Phys. Rev. B 1994, 50 (24), 17953–17979. 10.1103/PhysRevB.50.17953. [DOI] [PubMed] [Google Scholar]
- Kresse G.; Furthmuller J. Efficient Iterative Schemes for Ab Initio Total-Energy Calculations Using a Plane-Wave Basis Set. Phys. Lett. B 1996, 54 (16), 11169–11186. 10.1103/PhysRevB.54.11169. [DOI] [PubMed] [Google Scholar]
- Heyd J.; Scuseria G. E.; Ernzerhof M. Hybrid Functionals Based on a Screened Coulomb Potential. J. Chem. Phys. 2003, 118 (18), 8207–8215. 10.1063/1.1564060. [DOI] [Google Scholar]
- Groner M. D.; Elam J. W.; Fabreguette F. H.; George S. M. Electrical Characterization of Thin Al2O3 Films Grown by Atomic Layer Deposition on Silicon and Various Metal Substrates. Thin Solid Films 2002, 413 (1–2), 186–197. 10.1016/S0040-6090(02)00438-8. [DOI] [Google Scholar]
- Qiu X.; Thompson J. W.; Billinge S. J. L. PDFgetX2: A GUI-Driven Program to Obtain the Pair Distribution Function from X-Ray Powder Diffraction Data. J. Appl. Crystallogr. 2004, 37 (4), 678–678. 10.1107/S0021889804011744. [DOI] [Google Scholar]
- Lorch E. Neutron Diffraction by Germania, Silica and Radiation-Damaged Silica Glasses. J. Phys. C Solid State Phys. 1969, 2 (2), 229. 10.1088/0022-3719/2/2/305. [DOI] [Google Scholar]
- Skinner L. B.; Benmore C. J.; Weber J. K. R.; Du J.; Neuefeind J.; Tumber S. K.; Parise J. B. Low Cation Coordination in Oxide Melts. Phys. Rev. Lett. 2014, 112 (15), 157801. 10.1103/PhysRevLett.112.157801. [DOI] [PubMed] [Google Scholar]
- Gorham C. S.; Gaskins J. T.; Parsons G. N.; Losego M. D.; Hopkins P. E. Density Dependence of the Room Temperature Thermal Conductivity of Atomic Layer Deposition-Grown Amorphous Alumina (Al2O3). Appl. Phys. Lett. 2014, 104 (25), 253107. 10.1063/1.4885415. [DOI] [Google Scholar]
- Sørensen S. S.; Biscio C. A. N.; Bauchy M.; Fajstrup L.; Smedskjaer M. M. Revealing Hidden Medium-Range Order in Amorphous Materials Using Topological Data Analysis. Sci. Adv. 2020, 6 (37), eabc2320. 10.1126/sciadv.abc2320. [DOI] [PMC free article] [PubMed] [Google Scholar]
- Tavanti F.; Calzolari A. Multi-Technique Approach to Unravel the (Dis)Order in Amorphous Materials. ACS Omega 2022, 7, 23255. 10.1021/acsomega.2c01359. [DOI] [PMC free article] [PubMed] [Google Scholar]
- Rieser J. M.; Goodrich C. P.; Liu A. J.; Durian D. J. Divergence of Voronoi Cell Anisotropy Vector: A Threshold-Free Characterization of Local Structure in Amorphous Materials. Phys. Rev. Lett. 2016, 116 (8), 1–5. 10.1103/PhysRevLett.116.088001. [DOI] [PubMed] [Google Scholar]
- Konstantinou K.; Mocanu F. C.; Lee T. H.; Elliott S. R. Revealing the Intrinsic Nature of the Mid-Gap Defects in Amorphous Ge2Sb2Te5. Nat. Commun. 2019, 10 (1), 3065. 10.1038/s41467-019-10980-w. [DOI] [PMC free article] [PubMed] [Google Scholar]
- Riffet V.; Vidal J. Statistics-Based Analysis of the Evolution of Structural and Electronic Properties of Realistic Amorphous Alumina During the Densification Process: Insights from First-Principles Approach. J. Phys. Chem. C 2017, 121 (44), 24745–24758. 10.1021/acs.jpcc.7b06887. [DOI] [Google Scholar]
- Sabino F. P.; Besse R.; Oliveira L. N.; Wei S. H.; Da Silva J. L. F. Origin of and Tuning the Optical and Fundamental Band Gaps in Transparent Conducting Oxides: The Case of M2 O3(M = Al,Ga,In). Phys. Rev. B - Condens. Matter Mater. Phys. 2015, 92 (20), 1–7. 10.1103/PhysRevB.92.205308. [DOI] [Google Scholar]
- Filatova E. O.; Konashuk A. S. Interpretation of the Changing the Band Gap of Al2O3 Depending on Its Crystalline Form: Connection with Different Local Symmetries. J. Phys. Chem. C 2015, 119 (35), 20755–20761. 10.1021/acs.jpcc.5b06843. [DOI] [Google Scholar]
- Ghuman K. K. Mechanistic Insights into Water Adsorption and Dissociation on Amorphous -Based Catalysts. Sci. Technol. Adv. Mater. 2018, 19 (1), 44–52. 10.1080/14686996.2017.1410055. [DOI] [PMC free article] [PubMed] [Google Scholar]
- Duarte V. S. S.; Rodrigues A. M.; de Andrade-Filho T. S.; Souza D. do N.; de Novais E. R. P.; Novais A. de L. F.; de Oliveira G. C. A. Structural and Electronic Properties of Amorphous Bismuth Calcium Borate from First-Principle Calculations. Struct. Chem. 2021, 32 (4), 1589–1595. 10.1007/s11224-020-01718-2. [DOI] [Google Scholar]
- Triana C. A.; Araujo C. M.; Ahuja R.; Niklasson G. A.; Edvinsson T. Disentangling the Intricate Atomic Short-Range Order and Electronic Properties in Amorphous Transition Metal Oxides. Sci. Rep. 2017, 7 (1), 2044. 10.1038/s41598-017-01151-2. [DOI] [PMC free article] [PubMed] [Google Scholar]
- Mora-fonz D.; Kaviani M.; Shluger A. L. PHYSICAL REVIEW B 102, 054205 (2020) Disorder-Induced Electron and Hole Trapping in Amorphous TiO 2. Phys. Rev. B 2020, 102 (5), 54205. 10.1103/PhysRevB.102.054205. [DOI] [Google Scholar]
- Pham H. H.; Wang L. W. Oxygen Vacancy and Hole Conduction in Amorphous TiO2. Phys. Chem. Chem. Phys. 2015, 17 (1), 541–550. 10.1039/C4CP04209C. [DOI] [PubMed] [Google Scholar]
- Mora-fonz D.; Kaviani M.; Shluger A. L. Disorder-Induced Electron and Hole Trapping in Amorphous TiO 2. Phys. Rev. B 2020, 102 (5), 54205. 10.1103/PhysRevB.102.054205. [DOI] [Google Scholar]
- Subedi K. N.; Prasai K.; Kozicki M. N.; Drabold D. A. Structural Origins of Electronic Conduction in Amorphous Copper-Doped Alumina. Phys. Rev. Mater. 2019, 3 (6), 1–9. 10.1103/PhysRevMaterials.3.065605. [DOI] [Google Scholar]
- Dicks O. A.; Cottom J.; Shluger A. L.; Afanas’Ev V. V. The Origin of Negative Charging in Amorphous Al 2 O 3 Films: The Role of Native Defects. Nanotechnology 2019, 30 (20), 205201. 10.1088/1361-6528/ab0450. [DOI] [PubMed] [Google Scholar]
Associated Data
This section collects any data citations, data availability statements, or supplementary materials included in this article.