

Abstract

Bacterial colonization on solid surfaces creates enormous problems across various industries causing billions of dollars’ worth of economic damages and costing human lives. Biomimicking nanostructured surfaces have demonstrated a promising future in mitigating bacterial colonization and related issues. The importance of this non-chemical method has been elevated due to bacterial evolvement into antibiotic and antiseptic-resistant strains. However, bacterial attachment and viability on nanostructured surfaces under fluid flow conditions has not been investigated thoroughly. In this study, attachment and viability of Pseudomonas aeruginosa (P. aeruginosa) and Staphylococcus aureus (S. aureus) on a model nanostructured surface were studied under fluid flow conditions. A wide range of flow rates resulting in a broad spectrum of fluid wall shear stress on a nanostructured surface representing various application conditions were experimentally investigated. The bacterial suspension was pumped through a custom-designed microfluidic device (MFD) that contains a sterile Ti-6Al-4V substrate. The surface of the titanium substrate was modified using a hydrothermal synthesis process to fabricate the nanowire structure on the surface. The results of the current study show that the fluid flow significantly reduces bacterial adhesion onto nanostructured surfaces and significantly reduces the viability of adherent cells. Interestingly, the bactericidal efficacy of the nanostructured surface was increased under the flow by ∼1.5-fold against P. aeruginosa and ∼3-fold against S. aureus under static conditions. The bactericidal efficacy had no dependency on the fluid wall shear stress level. However, trends in the dead-cell count with the fluid wall shear were slightly different between the two species. These findings will be highly useful in developing and optimizing nanostructures in the laboratory as well as translating them into successful industrial applications. These findings may be used to develop antibacterial surfaces on biomedical equipment such as catheters and vascular stents or industrial applications such as ship hulls and pipelines where bacterial colonization is a great challenge.
Introduction
Bacterial cells are ubiquitous, and they adhere and colonize solid surfaces. Bacterial adhesion occurs on diverse types of surfaces such as human tissues and metallic or polymeric surfaces. Once attached to a surface, bacteria secrete an extracellular polymeric substance (EPS) and then form biofilms.1 The secreted EPS provides a structural support to the biofilm, which is highly resistant to antiseptics, antibiotics, and immune killing.2,3 Biofilms can grow in various interfaces such as solid–liquid, solid–air, or liquid–air.2 These biofilms are problematic in various sectors ranging from healthcare to engineering. In engineering sectors, biofilms can cause blockage in filtration mechanisms4 and aviation fuel systems,5 reduction in heat exchanger efficiency,6 increased drag resistance of marine vessels,7 and increased heat load of buildings.8 Biofouling causes reduction in heat transfer efficiency and results in microbial induced corrosion (MIL), which accounts for approximately 7.5% of the maintenance cost of processing plants.9 MIL affects many other industries as well. Twenty to thirty percent of corrosion-related costs of the oil and gas industry is due to MIL.10 Biofouling on marine vessel hulls results in losses in the fuel economy as well as increased costs of hull cleaning. It has been estimated that biofouling causes a 35–50% increase in fuel consumption.11 Another sector that suffers greatly due to bacterial colonization is the food and agriculture industry. Annually, around 420,000 deaths are reported in the world due to contaminated food.12 Food-borne infections in Australia alone costs about AUD 147 million per year.13 In healthcare sectors, the formation of biofilms can lead to nosocomial infections and implant failure that often results in requiring revision surgery and the associated need for prolonged hospitalization or even mortality.14−16 Adding into this is bacteria developing antibiotic drug resistance, which may render current antibiotics used in treating bacterial infections to be ineffective.14 This is a major challenge faced by the health sector and one of the great impediments for world economic prosperity. The Centers for Disease Control and Prevention (CDC) in the United States of America had estimated that around 61,000 deaths per annum in the U.S. are due to antimicrobial resistant bacterial infections.17 Antimicrobial resistance of S. aureus, Escherichia coli, Klebsiella pneumoniae, Acinetobacter baumanii, and P. aeruginosa species has cost an economic loss of US $0.5 billion in Thailand and $2.9 billion in the U.S.18 Issues made by antimicrobial resistance induce higher economic burdens on nations around the world.19 The World Bank has predicted that if immediate solutions for antimicrobial resistance were not found, a loss of 3.8% of the global annual gross domestic product may occur by 2050.20 The impact of bacterial colonization goes beyond the health sector. Losses in the food industry due to bacterial colonization and related issues amount to millions of dollars per year.21,22 The marine industry also suffers losses amounting to billions of dollars due to bacterial colonization and biofilm formation.23 Microbial induced corrosion also causes industries multibillion dollar annual losses.24 All these give great challenges to the traditional methods used for alleviating bacterial adhesion and related issues. Therefore, alternatives for preventing bacterial colonizations and infections are in high demand.
Since the discovery of bactericidal properties of nanostructured surfaces on some plants, animal skin, and insect wings, researchers have developed various biomimicking nanostructures on metallic and polymeric surfaces.25−28 These nanostructured surfaces have proven to be bactericidal and demonstrated compatibility with mammalian cells.29 However, these nanostructured surfaces are mostly tested for bactericidal properties under static conditions,30−32 making us explore the wide possibility of these bactericidal nanostructured surfaces in various applications that involve fluid flow, such as medical catheters, vascular stents, ship hulls, liquid pipes, etc. This lack of knowledge hinders the development of nanostructured surfaces in industrial applications.
In this study, the attachment and viability of P. aeruginosa and S. aureus species on a nanostructured surface under fluid wall shear stress were experimentally investigated. Five fluid wall shear stress levels of up to 10.00 Pa (100 dyn/cm2), which covers service conditions of many potential applications, were tested using a custom-designed microfluidic device (MFD).
Materials and Methodology
Experimental Procedure
Cell adhesion and viability under a flow were investigated with flow rates varying from 0 to 12 mL/min, which correspond to wall shear stress ranging from 0 to 10 Pa. Four flow rates of 0.12, 4.00, 8.00, and 12.00 mL/min were studied along with a no-flow trial. This no-flow trial was taken as a control along with a flat substrate for each flow condition. Since the cell adhesion and viability on the top and bottom surfaces were not significantly different on varying flow rates, cell adhesions to the side walls of the channel were considered. The substrates and the device were sterilized before each trial. In each trial, one nanostructured surface and one flat (control) surface were placed in either side of the channel and the bacterial suspension was flown through. This was done by placing the MFD standing on one side of the device. The cell concentration and exposure time were fixed. The fluid wall shear at the centroid of the surface was calculated using the method detailed in a later section. Trials were conducted with both P. aeruginosa and S. aureus species, and each trial was repeated three times. After the flow, substrates were retrieved, stained, imaged, and cell count-enumerated as detailed in the next section. Table 1 presents the parameters used in the fluid shear experiment. ANOVA was used to compare the differences between the following mean cell counts:
-
(i)
Live and dead cell counts on the same surface.
-
(ii)
Live, dead, and total cell counts on the nanostructured surface and flat (control) surface.
-
(iii)
Live, dead, and total cell counts between different flow rates.
Table 1. Controlled and Independent Variables Used in the Experiment.
| surfaces | bacterial species | fluid wall shear stress levels (Pa) |
|---|---|---|
| (1) nanostructured | (1) P. aeruginosa | (A) 0 |
| (2) flat | (2) S. aureus | (B) 0.10 |
| (C) 3.34 | ||
| (D) 6.68 | ||
| (E) 10.00 |
Calculation of the Fluid Wall Shear Stress
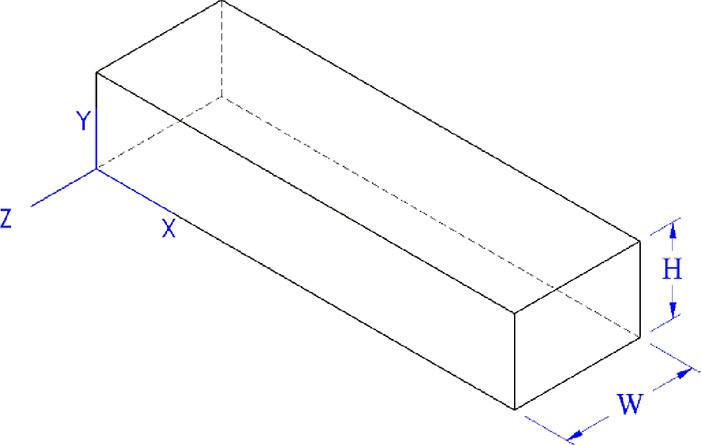
The MFD is designed following the principles of a parallel-plate flow chamber. Hence, the wall shear stress on a parallel-plate flow chamber was calculated as follows with a simplified fluid volume as shown in Figure 1.
Figure 1.
Simplified fluid domain in the microfluidic device based on the parallel-plate flow cell (PPFC) principle.
For a steady-state incompressible laminar flow with no slip boundary,
from the Navier–Stokes equation
By integration
Applying boundary conditions
Substituting for c1 and c2
From the continuity equation
Substituting for the pressure gradient
∴wall shear stress
where τ is the wall shear stress, μ is the kinematic viscosity, Q is the fluid flow rate, W is the width of fluid volume, and H is the height of the fluid volume. The properties of water at a 25 °C temperature were assumed for the fluid.
Microfluidic System
The microfluidic cell system components of the MFD and experimental setup are shown in Figure 2. A peristaltic pump (Isamtec ISM915A with CA-8 cassette, Germany) was used to dispense fluid with a controlled flow rate. The pump was calibrated with manual measurements by pumping water with an Ø0.89 isoprene tube (Ismatec, Germany) with flow rates of 1–10 mL/min for 10 min and 0.1 mL/min for 60 min, and the dispensed volume of water was measured using a measuring cylinder. The MFD has two metal plates, a 0.2 mm metallic sheet with a flow channel machined on it, two rubber O-rings, and stainless-steel screws to assemble the device. Each substrate gets contacted with the flowing suspension in an area of 30 mm2 (3 mm × 10 mm). All the metallic parts are made of medical grade AISI315L stainless steel. Before each trial using the MFD, it was assembled without substrates and autoclaved at 121 °C for 20 min and allowed to cool down to room temperature. The MFD was kept in a sealed bag during autoclave and only opened inside a biosafety cabinet. All substrates were washed with 70% v/v ethanol and exposed to UV light for 20 min before using for bacterial incubation. These sterilized substrates were inserted into the MFD inside a running biosafety cabinet.
Figure 2.

(A) 3D model of the assembled microfluidic device (MFD) with the front plate made transparent. (B) Cross-sectional plan view (horizontal plane through mid-height of the MFD). (C) Isolated fluid volume with the two substrates (nanostructured on one side and the flat substrate on the other side). (D) Photograph of the actual MFD with outer dimensions. (E) Schematic illustration of the experimental setup. Components: [1] Nanostructured surface, [2] flat (control) surface, [3] front plate of the MFD, [4] back plate of the MFD, [5] bacterial suspension reservoir, [6] MFD connected using isoprene tubing, [7] peristaltic pump, [8] waste reservoir, and [9] rubber O-rings.
Substrate Fabrication
Titanium (Ti-6Al-4V Grade 5) was chosen as the material for substrates based on the findings of literature review. Nanowire structures fabricated on substrates of this material had shown good bactericidal effects when tested under static conditions, and therefore, this material and nanowire structure were chosen as the model nanostructured surface for this study. A titanium sheet of 1 mm thickness was cut into pieces of 7 × 10 mm with one corner chamfered to a 45° angle to help properly orient the substrate. One side of the substrate was polished to a 0.04 μm Ra surface roughness. One half of the substrates were polished on the front side, while the other half was polished on the opposite side. The substrates polished on the front side were fit on the top side of the MFD and hence named “top surface”, and those of the other side were named “bottom surface”. One half of the top-surface substrates and one half of the bottom-surface substrates were reserved to be the control, while the rest were treated with the hydrothermal process to fabricate nanowire structures on them.
Nanostructure Fabrication
Polished samples were immersed in acetone and sonicated for 10 min. The sonicated samples were rinsed three times in ethanol and deionized water. After washing, the samples were dried with N2(g). The samples were laid in an angle on a custom-made polytetrafluoroethylene (PTFE) holder with the polished face upside and put in a 125 mL Parr acid digestion vessel. The vessel is filled with 60 mL of 1 M NaOH(aq). The sealed vessel was placed in an oven at a 180 °C temperature. The start time was recorded as the time when the oven had reached the temperature where it was stable without fluctuation. After the 2 h reaction time, the vessel was removed from the oven and let to cool within a fume hood. After reaching room temperature, the samples were removed from the vessel, rinsed three times in 18.2 MΩ H2O, and dried with N2(g). Samples were then placed in a furnace and annealed for 1 h at 300 ° C with a 10 °C/min heating rate and then removed from the furnace when the temperature reached below 80 °C. After reaching room temperature, the samples were submerged in 20 mL of 0.6 M HCl solution for 30 min for ion exchange. Next, the samples were rinsed three times in 18.2 MΩ H2O and dried with N2(g). The last step of the fabrication process is calcination of the samples in a furnace for 2 h at 600 ° C with a 10 °C/min heating rate. The samples were left to cool within the furnace and were removed when the temperature reached below 80 °C. Samples from each production batch were taken for SEM imaging, and a proper nanostructure was assured.
Preparation of Culture and Buffer Media
Twenty-six grams of nutrient broth powder (Oxoid, USA) was dissolved in 1 L of distilled water to make 1 L of nutrient broth for cell culturing followed by sterilization by autoclaving at 121 °C for 20 min. Phosphate-buffered saline (PBS) was prepared by dissolving one tablet of 1× PBS (Oxoid, USA) in 500 mL of distilled water and sterilized by autoclav 121 °C for 20 min.
Bacterial Suspension Preparation
Gram-positive S. aureus (ATCC 25923) and Gram-negative P. aeruginosa (ATCC 27853) were used for testing the adhesion and viability of bacterial cells on the nanostructured surface. Bacterial suspension preparation was done by first incubating a colony of bacteria in 5 mL of nutrient broth in a shaking incubator at 37 ° C and 200 rpm for 16 h. Then, the bacterial suspension was centrifuged at 5250 RCF for 5 min, and the separated pellet was resuspended in PBS. The required volume of suspension was made by adding centrifuged pellets to the measured volume of PBS until the target turbidity level was achieved. The turbidity of the suspension was measured using a BioPhotometer (Eppendorf, Germany) with an OD600 scale.
Preparation of Fluorescence Dye and Staining Cells
A Live/Dead BacLight kit (Invitrogen detection technologies, L7012) mixed 1:1 with SYTO 9 and propidium iodide (PI) was used to stain bacterial cells. Five microliters of each component of the dye was mixed in 1 mL of phosphate-buffered saline (PBS). Preparation and storage of the dye stock and mixtures was done in a dark room. The dye stock and mixture were stored in a −4 °C freezer. Three microliters of the dye mixture was pipetted into a glass-bottomed microwell plate (Ibidi, Germany), and the substrate was placed on top of the dye droplet with the cell-adhered side facing down. A 15 min incubation period after staining was allowed before imaging the surfaces. Two controls with 100% dead cells and 100% live cells as described previously were used to verify dye functionality. SYTO 9 gets excited with a 480 nm wavelength and emits a 500 nm wavelength, while PI gets excited with 490 nm and emits 635 nm wavelengths.
Fluorescence Imaging
Stained substrates placed face down in the glass-bottomed microwell plate were imaged using an inverted fluorescence microscope (Nikon Eclipse TiS, Japan) using an FITC filter for live cells and Cy3 filter for dead cells. FITC wavelength ranges of 440–510 nm for excitation and 487–573 nm for emission were used. Cy3 has 513–556 nm excitation and 570–614 nm emission wavelength ranges. An objective lens with 40× magnification and 0.6 numerical aperture was used for imaging surfaces with 100 ms exposure time. An area of 206.40 × 165.12 μm in the substrate was captured in each image with a resolution of 1280 × 1024. Therefore, 1 μm2 is equivalent to 38.5 pixels. Each substrate was imaged in at least 15 separate locations on the exposed surface with the imaged points scattered over the surface to minimize bleaching of the dye by prolonged exposure. Each point was imaged using both filters. The minimum number of measurements was determined for a 90% confidence interval with a 0.25 margin of error.
Cell Surface Coverage Enumeration Using Fluorescence Images
Fluorescence images were enhanced for contrast and binarized using ImageJ (version 1.53f51). The number of illuminated pixels of the binarized image was counted using a BioFilm Analyzer,33 and the number of pixels was taken as the unit of cell surface coverage. An area of 34,080.1 μm2 on the substrate was captured in each image, and therefore this was taken as the unit area and is equivalent to 1,310,720 pixels in the image. All cell counts were presented as the number of pixels in an area of 1,310,720 pixels. The threshold level for binarizing images was established by a trial-and-error method by comparing the final processed image with the original for discrepancies in the cell map. This process was done for each batch of images taken together.
SEM Imaging
Additional samples from each trial were prepared for SEM imaging. Immediately following the trial, cells on the substrate were fixed using 2.5% glutaraldehyde in PBS. Subsequent washing or rinsing was avoided to prevent any addition of uncertainty due to washing or rinsing steps. Samples were dehydrated using ethanol in increasing concentrations. Finally, the dried samples were coated with a 5 nm layer of gold. Images were taken using a TESCAN Mira 3 scanning electron microscope.
Statistical Analysis
ANOVA was used to assess the significance of differences in group mean values between the groups using GraphPad Prism software. A confidence interval of 95% was used with p ≤ 0.05 was taken as statistically significant. Statistical significance with ANOVA is shown by ns: P > 0.05, *: P ≤ 0.05, **: P ≤ 0.01, ***: P ≤ 0.001, and ****: P ≤ 0.0001.
Results
Effect of Fluid Wall Shear on the Adherent Cell Morphology
SEM images of P. aeruginosa and S. aureus cells attached onto nanostructured and flat surfaces under static and flow conditions are shown in Figure 3. The morphology of cells on flat surfaces (Figure 3A,D) was similar to that of healthy cells of respective bacterial species.34,35P. aeruginosa cells on the nanostructured surface under static conditions are shown in Figure 3B, which appear to be lysed. Most of the P. aeruginosa cells appeared in this morphology on the nanostructured surface. However, most of S. aureus cells on the nanostructured surface under static conditions had a morphology similar to that of cells shown in Figure 3E. One of the cells has a flattened morphology, which suggests a dead bacterium, while the rest of the cells appear viable. Under a 10 Pa fluid wall shear, more P. aeruginosa cells were observed to be lysed as seen in Figure 3C. Interestingly, those bacterial cells can be clearly seen to be pierced deeply by nanowires as opposed to those under static conditions, which showed shallow piercings. Some of the cells with a flattened morphology observed with impressions on them suggest that they were pierced by nanowires from below. Moreover, clear deep cell piercings were rare under static conditions. However, under a fluid wall shear, cells pierced deeply by nanowires were observed at large. In addition, the number of cells with deep piercings was increased with increasing fluid wall shear. Notably, compared to P. aeruginosa, deep cell piercings with S. aureus cells on the nanostructured surface were rare even under fluid wall shear.
Figure 3.

Scanning electron microscope (SEM) images of (A) P. aeruginosa cells on the flat Ti-6Al-4V titanium alloy surface under no-flow conditions, (B) P. aeruginosa cells on the nanostructured Ti-6Al-4 V titanium alloy surface under no-flow conditions, (C) P. aeruginosa cells on the nanostructured titanium surface after flowing the bacterial suspension under 10.00 Pa fluid wall shear stress, (D) S. aureus cells on the smooth titanium surface under no-flow conditions, (E) S. aureus cells on the nanostructured titanium surface under no-flow conditions, and (F) S. aureus cells on the nanostructured titanium surface after flowing the bacterial suspension under 10.00 Pa fluid wall shear stress [scale bar: 1 μm].
Effect of the Fluid Wall Shear Stress on the Cell Adhesion and Viability on Nanostructured Surfaces
Figure 4 shows fluorescence images of P. aeruginosa and S. aureus cells incubated on nanostructured and control (flat) surfaces under different fluid wall shear stress levels. A noteworthy decrease in the cell surface coverage on the control surface with increasing wall shear stress was observed with both species of bacteria. A similar trend with S. aureus was observed on the nanostructured surface, but the P. aeruginosa cell surface coverage at 10 Pa fluid shear (12 mL/min flowrate) level was greater than its surface coverage under other wall shear levels as well as S. aureus under all wall shear stress levels. Moreover, compared to the control surface, the dead cell surface coverage (shown in red color) is extraordinarily high on the nanostructured surface for both species.
Figure 4.

Fluorescence images of P. aeruginosa and S. aureus cells on nanostructured and control surfaces by staining with SYTO9 and propidium iodide under different fluid wall shear stress levels. Dead cells are shown in red color and live cells are shown in green color. The fluid wall shear stress is computed for the centroid of substrate [scale bar: 100 μm].
Fluid Flow Causes a Decrease in Bacterial Adhesion onto the Nanostructured Surface
Adhesion of P. aeruginosa on the nanostructured surface was reduced by the flow as shown in Figure 5A. However, the cell count was significantly increased (P ≤ 0.001) when the fluid wall shear stress was increased from 3.34 to 6.68 Pa. Nevertheless, there were no statistically significant changes to the cell count between other fluid shear levels. Peculiarly, S. aureus on the nanostructured surface also demonstrated a similar trend with increasing fluid wall shear stress levels (Figure 5C). The S. aureus cell count on the nanostructured surface was also reduced under flow conditions, and there was a significant increase (P ≤ 0.05) from 3.34 to 6.68 Pa without any significant changes between other fluid wall shear stress levels. The control surface (flat) also saw a reduction in the adherent cell count of both species with the flow without dependency on the wall shear stress level as shown in Figure 5B,D. Compared to S. aureus, P. aeruginosa had significantly higher cell adhesion on the nanostructured surface as well as the flat surface.
Figure 5.

Total cell adhesions of (A) P. aeruginosa on the nanostructured surface, (B) P. aeruginosa on the flat surface, (C) S. aureus on the nanostructured surface, and (D) S. aureus on the flat surface under varying flow rates. Number of live and dead cells on treated and untreated surfaces under different flow conditions were quantified to compute the total cell adhesion on the surface. The cells were stained with a mixture of SYTO9 and PI then imaged using a fluorescence microscope with FITC and CY3 filters. Cells were quantified by counting pixels of each image above the threshold level. Data are the mean of 45 images of three independent experiments ± the standard error of means. * shows statistical significance with Student’s t test. ns: P > 0.05, *: P ≤ 0.05, **: P ≤ 0.01, ***: P ≤ 0.001, and ****: P ≤ 0.0001.
More Bacterial Cells Get Lysed under the Flow
Dead and live cell counts of P. aeruginosa and S. aureus on the two types of surfaces against the fluid wall shear stress level exerted on surface are shown in Figure 6. The dead cell count on the nanostructured surface had notably similar trends between the two species (Figure 6A,C). Both species saw a significant decrease in the dead cell count on the nanostructured surface from 0 (no flow) to 0.12 and 3.34 Pa wall shear stress levels and had a significant increase from 3.34 to 6.68 Pa wall shear stress levels. Notably, for both species, the dead cell count under 6.68 and 10 Pa wall shear was similar to that under no-flow conditions. However, the dead cell count of P. aeruginosa was significantly increased from 6.68 to 10 Pa wall shear stress (Figure 6A), while the S. aureus dead cell count remained the same (Figure 6C). The P. aeruginosa dead cells on the nanostructured surface were approximately 10 times more than the dead S. aureus cells on the same surface, but on the flat surface, both species had a similar order of the dead cell count. The P. aeruginosa dead cell count on the flat surface under flow was significantly increased (P > 0.05) from static conditions and without dependency on the applied fluid shear level (Figure 6B). The dead cell count of S. aureus on the flat surface had no effect from the fluid flow as shown in Figure 6D. All dead cell counts were significantly higher on the nanostructured surface compared to the flat surface under same conditions for both species. Live cell counts of P. aeruginosa on nanostructured and flat surfaces are shown in Figure 6E,F, respectively, and those of S. aureus are shown in Figure 6G,H, respectively. Regardless of the attached surface, both P. aeruginosa and S. aureus live cell counts had a similar trend against the fluid wall shear level. The live cell count on either type of surfaces was significantly reduced (P > 0.001) from static to flow conditions with no dependency on the fluid wall shear stress level. Notably, the live cell count of either species on the flat surface was significantly higher than on the nanostructured surface under the same wall shear stress level. These results clearly demonstrate that the fluid wall shear causes more cells get lysed on the nanostructured surface. Reduction in cell adhesion and an increase in cell lysing by the flow are highly desirable antibacterial applications.
Figure 6.

Dead counts of (A) P. aeruginosa on the nanostructured surface, (B) P. aeruginosa on the flat surface, (C) S. aureus on the nanostructured surface, and (D) S. aureus on the flat surface under varying flow rates. The number of dead cells on treated and untreated surfaces under different flow conditions was quantified. Live counts of (E) P. aeruginosa on the nanostructured surface, (F) P. aeruginosa on the flat surface, (G) S. aureus on the nanostructured surface, and (H) S. aureus on the flat surface under varying flow rates. The cells were stained with a mixture of SYTO9 and PI then imaged using a fluorescence microscope with FITC and CY3 filters. Cells were quantified by counting pixels of each image above the threshold level. Data are means of 45 images of three independent experiments ± standard error of means. * shows statistical significance with Student’s t test. ns: P > 0.05, *: P ≤ 0.05, **: P ≤ 0.01, ***: P ≤ 0.001, and ****: P ≤ 0.0001.
Bactericidal Efficacy of Nanostructured Surfaces Increases under Fluid Wall Shear
Figure 7 shows the bactericidal efficacy of the nanostructured surface against P. aeruginosa and S. aureus species under varying fluid wall shear stress levels. The bactericidal efficacy against P. aeruginosa under static conditions was 68%, and against S. aureus, it was 30%. Under the lowest wall shear stress level of 0.10 Pa, the bactericidal efficacy was increased to 92 and 95% for the two species. Beyond 0.1 Pa, none of the species had any significant difference in the bactericidal efficacy against them. Under no-flow conditions, the bactericidal efficacy against the two species was significantly different, but under none of the flow conditions was the difference statistically significant.
Figure 7.

Bactericidal efficacy of the nanostructured surface against P. aeruginosa and S. aureus species at varying fluid wall shear stress levels. The number of live and dead cells on treated and untreated surfaces under different flow conditions was quantified to compute the bactericidal efficacy of the surface. The cells were stained with a mixture of SYTO9 and PI then imaged using a fluorescence microscope with FITC and CY3 filters. Cells were quantified by counting pixels of each image above the threshold level. Data are means of 45 images of three independent experiments ± standard error of means.
Discussion
The bactericidal efficacy of the nanostructured surface was increased under fluid shear independent of the bacterial species. The two species had differences in the Gram-stain type, cell form, and motility. Regardless of the differences, the fluid wall shear impacted similarly on the bactericidal efficacy against them. Despite subtle differences in trends, both species saw an increase in dead cells and decrease in live cells on the nanostructured surface under fluid shear. This indicates that the overlaying fluid flow enhances the capabilities of nanostructured surfaces. The two bacterial species were different in terms of Gram-stain types, cell motility, and the cell form. While P. aeruginosa is a Gram-negative, motile, and rod-shaped bacterium, S. aureus is a Gram-positive, non-motile, and cocci bacterium. The flow affected the adhesion and viability of cells regardless of the species. Therefore, this suggests that the effect of the flow does not depend on the Gram-stain type, cell motility, or shape alone.
The differences in the shape and size impact the fluid dynamic forces acting on the cells. The larger rod-shape P. aeruginosa was subjected to higher drag forces by the flow, while the more aerodynamic-shaped, small S. aureus experienced a less fluid drag. Therefore, the effect of the flow is negligible on the S. aureus. SEM images showed a higher occurrence of P. aeruginosa cells with pass-through penetrations by nanowires. Such observations with S. aureus were exceedingly rare. This can be attributed to the cell wall thickness and strength difference between the two species. Unlike Gram-negative P. aeruginosa, Gram-positive S. aureus species has a thick peptidoglycan, which is less susceptible to nanowire penetration. Deep cell penetrations occurred less frequently under static conditions. However, the duration of trials conducted were limited to 1 h, and there is a possibility of a chronological effect on cell penetrations by nanowires. Prolonged exertion of stresses on the cell membrane by nanowires may cause creep failure in the cell membrane, and hence the nanowires could pass through the cells at higher time periods. Moreover, lysed-cell decomposition may reduce the strength of the cell membrane and eventually cause the nanowires to further penetrate the cell membrane, causing a deep or pass-through piercing. Either way, this would help the nanowire structure longevity in practical applications.
The nanowire structure demonstrated 68% efficacy against P. aeruginosa and 30% against S. aureus under static conditions. Various titanium nanostructures have demonstrated 25–87% efficacy against P. aeruginosa species under static conditions.27,36−40 Similarly, 4–60% efficacy against S. aureus is also reported.36,38,41,42 Hence, cell adhesions of P. aeruginosa and S. aureus under static conditions are comparable with those of the literature. Significant increases in bactericidal efficacy from static to flow conditions were observed with both bacterial species. The bactericidal efficacy on P. aeruginosa was increased from 68% to 92%, and on S. aureus, from 30% to 95%. However, the variation of bactericidal efficacy against the fluid shear was not significant on both species. This shows that the bactericidal efficacy of the nanostructured surface was independent of the flow. Analysis of the cell viability discussed in the previous section revealed that the dead cell count was increased while the live cell count was decreased when the surface was subjected to the flow. The bactericidal efficacy increase was graced by both a reduction in live cells as well as increased dead cells. This proves the serviceability of the nanostructured surface under any flow condition.
The flow caused a reduction in cell adhesion of both species at lower fluid shear levels. Adhesion of cells at the 0.10 Pa level was lower than static conditions for both species, and adhesion was similar between 0.10 and 3.34 Pa shear levels. However, adhesion was increased from 3.34 to 6.68 Pa shear levels with similar adhesion on the two highest shear levels. The initial drop in cell counts may be caused by the fluid drag on cells. However, under flow conditions, bacterial cells actively form clusters due to its mechanosensitivity as well as passively due to the fluid dynamic forces.43,44 This may have caused the increase in cell adhesion onto the surface, and a further increase in fluid shear can result in detachment of cells.45
SEM images of nanostructured surfaces after a flow at 12 mL/min over 3 h did not reveal any structural damages to the nanowires on the surface. This observation partly resolved the skepticism of the durability of the nanostructured surface under flow conditions. Though this observation is not conclusive on long-term endurance of nanostructures fabricated on surfaces, it hints that these nanostructures withstand fluid shear.
Conclusions
The bactericidal efficacy of nanostructured surfaces increased under fluid flow conditions. Adhesion of cells decreased under the flow, and the proportion of lysed cells out of adherent cells increased under the flow. This finding opens a wide range of opportunities for bactericidal nanostructures. There are many industrial, agricultural, and medical applications of bactericidal nanostructured surfaces that are associated with a fluid flow. Ship hulls, water or petroleum fuel pipes, liquid storage tanks, and food and beverage packing are some examples for industrial and agricultural applications. Bone implants, vascular stents, and catheters are some of the medical sector applications for bactericidal nanostructured surfaces. The findings of this work enable the translation of such nanostructured surfaces into ideal solutions to mitigate bacteria-related losses to humankind. Successful application of this technology in those sectors will benefit in uplifting the quality of life by reducing threats to health and economy.
Acknowledgments
The authors wish to acknowledge support from the following individuals and institutions: Centre for Biomedical Technologies (CBT), Queensland University of Technology (QUT), Australia; Dr. K.A.S.N. Gunarathne for support in designing experiments with microbes; and Dr. Christina Theodoropoulos for support in fluorescence microscopy. Funding was received for this work from the AHEAD project (grant no. AHEAD/PhD/R2/ENG/TECH/161), University Grants Commission of Sri Lanka, and Queensland University of Technology.
The authors declare no competing financial interest.
References
- Costerton J. W. Introdution to Biofilm. Int. J. Antimicrob. Agents 1999, 11, 217–221. 10.1016/S0924-8579(99)00018-7. [DOI] [PubMed] [Google Scholar]
- Flemming H.-C. Biofouling in Water Systems – Cases, Causes and Countermeasures. Appl. Microbiol. Biotechnol. 2002, 59, 629–640. 10.1007/s00253-002-1066-9. [DOI] [PubMed] [Google Scholar]
- Davies D. Understanding Biofilm Resistance to Antibacterial Agents. Nat. Rev. Drug Discovery 2003, 2, 114–122. 10.1038/nrd1008. [DOI] [PubMed] [Google Scholar]
- Vrouwenvelder J. S.; Graf von der Schulenburg D. A.; Kruithof J. C.; Johns M. L.; van Loosdrecht M. C. M. Biofouling of Spiral-Wound Nanofiltration and Reverse Osmosis Membranes: A Feed Spacer Problem. Water Res. 2009, 43, 583–594. 10.1016/j.watres.2008.11.019. [DOI] [PubMed] [Google Scholar]
- Brown L. M.; McComb J. P.; Vangsness M. D.; Bowen L. L.; Mueller S. S.; Balster L. M.; Bleckmann C. A. Community Dynamics and Phylogenetics of Bacteria Fouling Jet A and JP-8 Aviation Fuel. Int. Biodeterior. Biodegrad. 2010, 64, 253–261. 10.1016/j.ibiod.2010.01.008. [DOI] [Google Scholar]
- Melo L. F.; Bott T. R. Biofouling in Water Systems. Exp. Therm. Fluid Sci. 1997, 14, 375–381. 10.1016/S0894-1777(96)00139-2. [DOI] [Google Scholar]
- Salta M.; Capretto L.; Carugo D.; Wharton J. A.; Stokes K. R. Life under Flow: A Novel Microfluidic Device for the Assessment of Anti-Biofilm Technologies. Biomicrofluidics 2013, 7, 064118 10.1063/1.4850796. [DOI] [PMC free article] [PubMed] [Google Scholar]
- Garty J. Influence of Epilithic Microorganisms on the Surface Temperature of Building Walls. Can. J. Bot. 1990, 68, 1349–1353. 10.1139/b90-171. [DOI] [Google Scholar]
- Ibrahim H. A.-H.Fouling in Heat Exchangers. In MATLAB - A Fundamental Tool for Scientific Computing and Engineering Applications; Volume 3; InTech, 2012. 10.5772/46462. [DOI] [Google Scholar]
- Microbiologically Influenced Corrosion in the Upstream Oil and Gas Industry; Skovhus T. L.; Enning D.; Lee J. S., Eds.; CRC Press: Boca Raton : Taylor & Francis, CRC Press, 2017, 2017. 10.1201/9781315157818. [DOI] [Google Scholar]
- Schultz M. P.; Bendick J. A.; Holm E. R.; Hertel W. M. Economic Impact of Biofouling on a Naval Surface Ship. Biofouling 2011, 27, 87–98. 10.1080/08927014.2010.542809. [DOI] [PubMed] [Google Scholar]
- https://www.who.int/news-room/fact-sheets/detail/food-safety
- Ford L.; Haywood P.; Kirk M. D.; Lancsar E.; Williamson D. A.; Glass K. Cost of Salmonella Infections in Australia, 2015. J. Food Prot. 2019, 82, 1607–1614. 10.4315/0362-028X.JFP-19-105. [DOI] [PubMed] [Google Scholar]
- Taylor E.; Webster T. J. Reducing Infections through Nanotechnology and Nanoparticles. Int. J. Nanomed. 2011, 6, 1463. 10.2147/IJN.S22021. [DOI] [PMC free article] [PubMed] [Google Scholar]
- Katsikogianni M.; Missirlis Y. F. Concise Review of Mechanisms of Bacterial Adhesion to Biomaterials and of Techniques Used in Estimating Bacteria-Material Interactions. Eur. Cells Mater. 2004, 8, 37–57. 10.22203/eCM.v008a05. [DOI] [PubMed] [Google Scholar]
- Ferraris S.; Spriano S. Antibacterial Titanium Surfaces for Medical Implants. Mater. Sci. Eng. C 2016, 61, 965–978. 10.1016/j.msec.2015.12.062. [DOI] [PubMed] [Google Scholar]
- Centers for Disease Control and Prevention . Antibiotic Resistance Threats; 2013.
- Shrestha P.; Cooper B. S.; Coast J.; Oppong R.; Do Thi Thuy N.; Phodha T.; Celhay O.; Guerin P. J.; Wertheim H.; Lubell Y. Enumerating the Economic Cost of Antimicrobial Resistance per Antibiotic Consumed to Inform the Evaluation of Interventions Affecting Their Use. Antimicrob. Resist. Infect. Control 2018, 7, 98. 10.1186/s13756-018-0384-3. [DOI] [PMC free article] [PubMed] [Google Scholar]
- Zhen X.; Lundborg C. S.; Sun X.; Hu X.; Dong H. Economic Burden of Antibiotic Resistance in ESKAPE Organisms: A Systematic Review. Antimicrob. Resist. Infect. Control 2019, 8, 137. 10.1186/s13756-019-0590-7. [DOI] [PMC free article] [PubMed] [Google Scholar]
- World Bank . Drug-Resistant Infections : A Threat to Our Economic Future; World Bank: Washington DC, 2017. [Google Scholar]
- Brooks J. D.; Flint S. H. Biofilms in the Food Industry: Problems and Potential Solutions. Int. J. Food Sci. Technol. 2008, 43, 2163–2176. 10.1111/j.1365-2621.2008.01839.x. [DOI] [Google Scholar]
- Cobo-Díaz J. F.; Alvarez-Molina A.; Alexa E. A.; Walsh C. J.; Mencía-Ares O.; Puente-Gómez P.; Likotrafiti E.; Fernández-Gómez P.; Prieto B.; Crispie F.; Ruiz L.; González-Raurich M.; López M.; Prieto M.; Cotter P.; Alvarez-Ordóñez A. Microbial Colonization and Resistome Dynamics in Food Processing Environments of a Newly Opened Pork Cutting Industry during 1.5 Years of Activity. Microbiome 2021, 9, 204. 10.1186/s40168-021-01131-9. [DOI] [PMC free article] [PubMed] [Google Scholar]
- Tuck B.; Watkin E.; Somers A.; Machuca L. L. A Critical Review of Marine Biofilms on Metallic Materials. npj Mater. Degrad. 2022, 6, 25. 10.1038/s41529-022-00234-4. [DOI] [Google Scholar]
- Little B. J.; Blackwood D. J.; Hinks J.; Lauro F. M.; Marsili E.; Okamoto A.; Rice S. A.; Wade S. A.; Flemming H.-C. Microbially Influenced Corrosion—Any Progress?. Corros. Sci. 2020, 170, 108641. 10.1016/j.corsci.2020.108641. [DOI] [Google Scholar]
- Hazell G.; Fisher L. E.; Murray W. A.; Nobbs A. H.; Su B. Bioinspired Bactericidal Surfaces with Polymer Nanocone Arrays. J. Colloid Interface Sci. 2018, 528, 389–399. 10.1016/j.jcis.2018.05.096. [DOI] [PubMed] [Google Scholar]
- Shahali H.; Hasan J.; Mathews A.; Wang H.; Yan C.; Tesfamichael T.; Yarlagadda P. K. D. V. Multi-Biofunctional Properties of Three Species of Cicada Wings and Biomimetic Fabrication of Nanopatterned Titanium Pillars. J. Mater. Chem. B 2019, 7, 1300–1310. 10.1039/C8TB03295E. [DOI] [PubMed] [Google Scholar]
- Bhadra C. M.; Khanh Truong V.; Pham V. T. H.; Al Kobaisi M.; Seniutinas G.; Wang J. Y.; Juodkazis S.; Crawford R. J.; Ivanova E. P. Antibacterial Titanium Nano-Patterned Arrays Inspired by Dragonfly Wings. Sci. Rep. 2015, 5, 16817. 10.1038/srep16817. [DOI] [PMC free article] [PubMed] [Google Scholar]
- Jaggessar A.; Shahali H.; Mathew A.; Yarlagadda P. K. D. V. Bio-Mimicking Nano and Micro-Structured Surface Fabrication for Antibacterial Properties in Medical Implants. J. Nanobiotechnol. 2017, 15, 64. 10.1186/s12951-017-0306-1. [DOI] [PMC free article] [PubMed] [Google Scholar]
- Jones C. F.; Quarrington R. D.; Tsangari H.; Starczak Y.; Mulaibrahimovic A.; Burzava A. L. S.; Christou C.; Barker A. J.; Morel J.; Bright R.; Barker D.; Brown T.; Vasilev K.; Anderson P. H. A Novel Nanostructured Surface on Titanium Implants Increases Osseointegration in a Sheep Model. Clin. Orthop. Relat. Res. 2022, 480, 2232. 10.1097/CORR.0000000000002327. [DOI] [PMC free article] [PubMed] [Google Scholar]
- Senevirathne S. W. M. A. I.; Hasan J.; Mathew A.; Woodruff M.; Yarlagadda P. K. D. V. Bactericidal Efficiency of Micro- and Nanostructured Surfaces: A Critical Perspective. RSC Adv. 2021, 11, 1883–1900. 10.1039/D0RA08878A. [DOI] [PMC free article] [PubMed] [Google Scholar]
- Senevirathne S. W. M. A. I.; Hasan J.; Mathew A.; Jaggessar A.; Yarlagadda P. K. D. V. Trends in Bactericidal Nanostructured Surfaces: An Analytical Perspective. ACS Appl. Bio Mater. 2021, 7626. 10.1021/acsabm.1c00839. [DOI] [PubMed] [Google Scholar]
- Michalska M.; Divan R.; Noirot P.; Laible P. D. Antimicrobial Properties of Nanostructured Surfaces-Demonstrating the Need for a Standard Testing Methodology. Nanoscale 2021, 13, 17603–17614. 10.1039/d1nr02953c. [DOI] [PubMed] [Google Scholar]
- Bogachev M. I.; Volkov V. Y.; Markelov O. A.; Trizna E. Y.; Baydamshina D. R.; Melnikov V.; Murtazina R. R.; Zelenikhin P. V.; Sharafutdinov I. S.; Kayumov A. R. Fast and Simple Tool for the Quantification of Biofilm-Embedded Cells Sub-Populations from Fluorescent Microscopic Images. PLoS One 2018, 13, e0193267 10.1371/journal.pone.0193267. [DOI] [PMC free article] [PubMed] [Google Scholar]
- Feng Y.; Ming T.; Zhou J.; Lu C.; Wang R.; Su X. The Response and Survival Mechanisms of Staphylococcus Aureus under High Salinity Stress in Salted Foods. Foods 2022, 11, 1503. 10.3390/foods11101503. [DOI] [PMC free article] [PubMed] [Google Scholar]
- Zhang L.; Zhao S.; Zhang J.; Sun Y.; Xie Y.; Liu Y.; Ma C.; Jiang B.; Liao X.; Li W.; Cheng X.; Wang Z. Proteomic Analysis of Vesicle-Producing Pseudomonas Aeruginosa PAO1 Exposed to X-Ray Irradiation. Front. Microbiol. 2020, 11, 558233. 10.3389/fmicb.2020.558233. [DOI] [PMC free article] [PubMed] [Google Scholar]
- Linklater D. P.; Juodkazis S.; Crawford R. J.; Ivanova E. P. Mechanical Inactivation of Staphylococcus Aureus and Pseudomonas Aeruginosa by Titanium Substrata with Hierarchical Surface Structures. Materialia 2019, 5, 100197. 10.1016/j.mtla.2018.100197. [DOI] [Google Scholar]
- Diu T.; Faruqui N.; Sjöström T.; Lamarre B.; Jenkinson H. F.; Su B.; Ryadnov M. G. Cicada-Inspired Cell-Instructive Nanopatterned Arrays. Sci. Rep. 2015, 4, 7122. 10.1038/srep07122. [DOI] [PMC free article] [PubMed] [Google Scholar]
- Jaggessar A.; Mathew A.; Tesfamichael T.; Wang H.; Yan C.; Yarlagadda P. K. D. V. Bacteria Death and Osteoblast Metabolic Activity Correlated to Hydrothermally Synthesised TiO2 Surface Properties. Molecules 2019, 24, 1201. 10.3390/molecules24071201. [DOI] [PMC free article] [PubMed] [Google Scholar]
- Tsimbouri P. M.; Fisher L.; Holloway N.; Sjostrom T.; Nobbs A. H.; Meek R. M. D.; Su B.; Dalby M. J. Osteogenic and Bactericidal Surfaces from Hydrothermal Titania Nanowires on Titanium Substrates. Sci. Rep. 2016, 6, 36857. 10.1038/srep36857. [DOI] [PMC free article] [PubMed] [Google Scholar]
- Le Clainche T.; Linklater D.; Wong S.; Le P.; Juodkazis S.; Le Guével X.; Coll J.-L.; Martel-Frachet V.; Ivanova E. P. Mechano-Bactericidal Titanium Surfaces for Bone Tissue Engineering. ACS Appl. Mater. Interfaces 2020, 12, 48272–48283. 10.1021/acsami.0c11502. [DOI] [PubMed] [Google Scholar]
- Hizal F.; Zhuk I.; Sukhishvili S.; Busscher H. J.; Van Der Mei H. C.; Choi C.-H. Impact of 3D Hierarchical Nanostructures on the Antibacterial Efficacy of a Bacteria-Triggered Self-Defensive Antibiotic Coating. ACS Appl. Mater. Interfaces 2015, 7, 20304–20313. 10.1021/acsami.5b05947. [DOI] [PubMed] [Google Scholar]
- Ercan B.; Taylor E.; Alpaslan E.; Webster T. J. Diameter of Titanium Nanotubes Influences Anti-Bacterial Efficacy. Nanotechnology 2011, 22, 295102. 10.1088/0957-4484/22/29/295102. [DOI] [PubMed] [Google Scholar]
- Be’er A.; Ariel G. A Statistical Physics View of Swarming Bacteria. Mov. Ecol. 2019, 7, 9. 10.1186/s40462-019-0153-9. [DOI] [PMC free article] [PubMed] [Google Scholar]
- Chen X.; Yang X.; Yang M.; Zhang H. P. Dynamic Clustering in Suspension of Motile Bacteria. Europhys. Lett. 2015, 111, 54002. 10.1209/0295-5075/111/54002. [DOI] [Google Scholar]
- Senevirathne S. W. M. A. I.; Toh Y.-C.; Yarlagadda P. K. D. V. Fluid Flow Induces Differential Detachment of Live and Dead Bacterial Cells from Nanostructured Surfaces. ACS Omega 2022, 23201. 10.1021/acsomega.2c01208. [DOI] [PMC free article] [PubMed] [Google Scholar]