


Abstract
The RepA protein from bacteriophage P1 binds DNA to initiate replication. RepA covers one face of the DNA and the binding site has a completely conserved T that directly faces RepA from the minor groove at position +7. Although all four bases can be distinguished through contacts in the major groove of B-form DNA, contacts in the minor groove cannot easily distinguish between A and T bases. Therefore the 100% conservation at this position cannot be accounted for by direct contacts approaching into the minor groove of B-form DNA. RepA binding sites with modified base pairs at position +7 were used to investigate contacts with RepA. The data show that RepA contacts the N3 proton of T at position +7 and that the T=A hydrogen bonds are already broken in the DNA before RepA binds. To accommodate the N3 proton contact the T+7 /A+7′ base pair must be distorted. One possibility is that T+7 is flipped out of the helix. The energetics of the contact allows RepA to distinguish between all four bases, accounting for the observed high sequence conservation. After protein binding, base pair distortion or base flipping could initiate DNA melting as the second step in DNA replication.
INTRODUCTION
By examining the structure of base pairs, Seeman et al. showed that all four bases can be distinguished by contacts in the major groove of B-form DNA, while contacts in the minor groove cannot distinguish the orientation of the base pair (1). Information analysis of transcription factor binding site sequences subsequently confirmed this prediction, but also showed unusual sequence conservation in the binding sites for bacteriophage P1 RepA sites (2,3).
RepA is responsible for replication of the P1 plasmid (4,5). DMS protection, DMS interference, ethylation interference and hydroxyl radical footprinting experiments, along with sequence conservation helix matching, have shown that this protein binds exclusively to one face of the DNA (2,6,7), yet the binding sites show nearly full (2 bit) sequence conservation at position +7, where the protein squarely faces the minor groove (Fig. 1). B-form DNA cannot support more than 1 bit of conservation from the minor groove, suggesting that the DNA is distorted at that base.
Figure 1.

RepA sequence logo and hairpin. The sequence logo of all 14 RepA sites, created as described previously (2), shows that position +7 (arrow) has more sequence conservation than expected from B-form DNA, as shown by the sine wave (3,7). The synthetic hairpin DNA contains a wild-type RepA binding site. Only the base at position +7 and its complement at +7′ were altered in the experiments described in this paper.
Further information analysis has revealed that, like the RepA binding site, the DNA binding sites of other proteins responsible for replication and transcriptional initiation often display high sequence conservation at positions where the protein faces a minor groove (3). While some of these cases might be driven by DNA helix distortion and ‘indirect readout’ (8), an intriguing possibility is that, after binding to the DNA, these proteins use base flipping to initiate DNA melting (9,10). We investigated contacts by RepA to position +7 to determine if they could account for the unusually strong base conservation at this position.
MATERIALS AND METHODS
Strains
The strain of Escherichia coli used for λPL RepA expression was OR1265 (11). The RepA expression plasmid was pALA131 (4).
RepA protein purification
RepA dimerizes in solution, but only the monomeric form binds DNA. The DnaJ–DnaK chaperone complex, ClpA chaperone, or urea can monomerize and activate RepA (12–14). We found that we could overexpress RepA and isolate active protein from inclusion bodies by using purification in a high urea concentration, as described below. Compared with native purification methods, this method takes less time, requires only one chromatography step and results in active protein without chaperones, thereby affording a pure system. We wanted to avoid additional proteins in the experiments because interaction of T+7 with an additional protein might explain the excess information (15).
An OR1265/pALA131 overnight culture was centrifuged and the cell pellet was resuspended in 250 ml of fresh LB-media containing 75 µg/ml ampicillin, shaken at 30°C for 1 h and at 42°C for 3 h. The induced culture was centrifuged and the cell pellet was resuspended in 10 ml of buffer containing 2 M urea, 100 mM Tris–HCl (pH 8.0), 5 mM DTT, 5 mM EDTA, 0.2% Triton X-100, sonicated with a Cole-Parmer Ultrasonic Processor model CP 70T at 10 W for 10 min on ice and centrifuged at 2000 g for 15 min [based on (16)]. The inclusion body pellets were washed by sonicating at 10 W for 1 min in ice with the same buffer twice and dissolved in 8 ml of RD buffer (8 M urea, 10 mM Tris pH 8.0) containing 300 mM NaCl. The solution was mixed with a 2 ml suspension of QAE-Sephadex A-50 resin (Pharmacia) equilibrated with 300 mM NaCl RD buffer, incubated for 1 h at room temperature and the resin was removed by filtration with a 0.2 µm NALGENE® filter unit. The solution was diluted with 2 vol of RD buffer to bring the final NaCl concentration to 100 mM and loaded on a 10 ml CM-Sephadex C-50-120 (Sigma) column equilibrated with the same buffer, washed with 50 ml of RD buffer containing 100 mM NaCl and eluted with a 16-ml gradient of 0.1–1 M NaCl-RD buffer. Fractions were analyzed by SDS-electrophoresis. The final preparation was ∼90% pure and contained 20% active protein as determined by gel electrophoresis mobility shift assays. To determine the concentration of active isolated RepA we used the published KD = 0.1 ± 0.09 nM (13) and measured both the total RepA concentration and the concentration of labeled DNA hairpin containing wild-type binding site.
Labeling and purification of DNA
DNA oligos were synthesized and gel purified (Synthegen, LLC; Oligos Etc.). A 5′-overhang hairpin oligo containing a wild-type RepA binding site (Fig. 1) was labeled by a fill-in reaction with Taq DNA polymerase. The 10 µl reaction mix containing 1 µM oligo, 1× PCR buffer (Perkin Elmer), 10 µM LISSAMINE®-5-dUTP (NEN) and 1 U of Taq polymerase (Gibco BRL®) was incubated at 72°C for 2 h followed by phenol/chloroform extraction, ultrafiltration by Microcon-10 microconcentrators (Amicon) and affinity purification by DYNABEADS® M-280 Streptavidin (DYNAL Inc.).
RepA–DNA binding assay
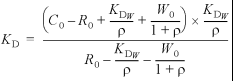
Looped-back DNA containing the sequence d(GCGAAGC) as a central portion forms a unique structure that is stabilized by base pairing between G3 and A5 (17). Because of its stability and exactly equimolar concentration of the complementary strands, it is convenient to use this sequence for DNA mobility shift assays (18). In addition, if the hairpin is not used, short wild-type and mutated RepA oligos (28 bp) tend to dissociate (data not shown). Competitor assays with a fluorescently labeled hairpin oligo containing the wild-type RepA binding site (Fig. 1) and unlabeled hairpin oligos that have mutated, missing or modified bases at position +7 and/or +7′ (Fig. 2) were used to determine dissociation constants (KD). Binding reactions were carried out in 10 µl of binding buffer containing 50 mM Tris–HCl (pH 7.5), 50 mM NaCl, 50 mM KCl, 10 mM MgCl2, 100 µM EDTA, 1 mM DTT, 50 µg/ml BSA, 50 µg/ml poly(dI–dC), 800 mM urea, 5% glycerol and 1 nM labeled wild-type hairpin oligo. The total unlabeled competitor DNA concentrations were C0 = 108.6, 212.4 and 472.0 nM. The total RepA concentration was R0 = 32.2 nM. The binding reactions were allowed to proceed for 30 min at room temperature followed by submerged horizontal 8% polyacrylamide gel electrophoresis. The 5 mm thick horizontal gel prevented bubble artifacts during scanning. Band positions were visualized with an FMBIO II fluorescent scanner (Hitachi) with an excitation wavelength of 532 nm and detection at 605 nm. The formula
Figure 2.

Modified base pair structures. Each structure was substituted into positions +7 and +7′ of the RepA hairpin shown in Figure 1. Green represents proposed critical hydrogens. Gold means the change from T/A made no significant difference to KD. Dark and light pink are +7 and +7′ amino groups in the minor groove. The base structures are ordered by increasing KD according to Figure 3. The line corresponds to the step in KD between hairpins 9 and 10 (Fig. 3). Boxes mark natural base pairs. Atom numbering is given for 1.T/A and 26.C/G. Canonical base pairs that form hydrogen bonds in B-form DNA are indicated by dashed lines, although these bonds may not exist in RepA binding site DNA (see text).
 1
1
was used to calculate the KD values at each of the three competitor DNA concentrations (see the Appendix for derivation of the equation). (Total labeled wild-type hairpin concentration, W0 = 1 nM; dissociation constant for the wild-type RepA binding site, KDW = 0.1 ± 0.09 nM (13); top band, T, and bottom band, B, intensity were measured and the ratio is ρ = B/T.)
The RepA wild-type site koff is 1.5 × 10⁻² s–1, and the association rate constant is 1.5 × 10⁸ M–1 s–1 (13). Simulation of the saturation time for wild-type sites showed that several seconds are enough for >99% saturation. The 30 min incubations to determine KD therefore gave equilibrium conditions.
The significance of differences between calculated KD values was estimated by Student’s t-tests (Fig. 4).
Figure 4.

t-test probabilities of KD equality. Student’s t-tests were performed on all pairs of KD values and standard deviations given in Figure 3. Colors show the two-tailed probability that two KD values are equal. Open black squares indicate that the two hairpins have distinguishable KD values (p < 0.05). A probability-color scale is shown on the bottom.
RESULTS
Different combinations of mutations and base modifications at positions +7 and +7′ were used to determine the chemical groups that interact with RepA (Fig. 2). We numbered the variants according to increasing KD, as shown in Figure 3.
Figure 3.

Gel mobility shift assay with different modified hairpins. Three different concentrations (108.6, 212.4 and 472.0 nM) of unlabeled DNA hairpins were used in gel mobility shift assays for specific competition with fluorescently labeled wild-type hairpin, 1.T/A. DNA hairpins synthesized according to Figure 1 and containing the compounds shown in Figure 2 were sorted by KD, as determined by competition with labeled wild type, 1.T/A. Bottom bands are DNA alone, top bands are DNA/RepA complexes.
The order of preference of natural bases at position +7 was T»C>A>G. This is similar but not identical to the order observed for the base preferences by RepA in a selection experiment with randomly synthesized RepA sites where T»A>C>G (2); the difference may be due to the small number of sequences in the selection experiment or to variation in the KD (26.C/G versus 28.A/T, p = 0.5).
The importance of bases or chemical groups on the bases can be determined by choosing appropriate modifications and determining the ΔΔGs. A low ΔΔG implies that no bonds with RepA are disrupted, and from this we infer that the removed groups do not form bonds.
There are no interactions between RepA and base +7′ because the ΔΔG between the 1.T/A (wild-type) hairpin and 2.T/abasic was low (ΔΔG is 0.04 ± 0.26 kcal/mol). In contrast, the 23.abasic/A hairpin had significantly lower binding affinity than the 1.T/A hairpin (ΔΔG is 1.03 ± 0.26 kcal/mol) (Fig. 3). This observation is consistent with the observed preference for T versus A in partially randomized RepA sites (2). It also confirms previous missing base experiments (6) and suggests that important contact(s) reside only on T+7.
We determined which T+7 groups are not important for RepA binding. The C5 methyl group does not interact with RepA because removing or changing it only had a slight effect on the binding affinity: the ΔΔGs between 1.T/A and each of the three compounds 3.P/A, 6.dU/A and 8.Acrylamido-dU/A were 0.05 ± 0.22, 0.24 ± 0.29 and 0.33 ± 0.28 kcal/mol, respectively. The O2 group is not important for RepA binding since the ΔΔG between 13.C/A (which has one) and 23.abasic/A (which does not) was 0.25 ± 0.21 kcal/mol. The O4 group of 1.T/A is not important either, because 9.N4-Me-C/A does not have an O4 group but the ΔΔG is only 0.33 ± 0.26 kcal/mol.
We propose that an important group that interacts with RepA is the N3 proton of thymine or, in modified bases, a proton near the N3 atom. Many modified bases that have a proton donor in this place have a low KD that is below a distinct ‘step’ between hairpins 9 and 10 (Fig. 3). As can be seen clearly in Figure 4, this step significantly separates all hairpins into two major classes. The type of proton donor is not important for the RepA interaction because RepA can also use a methyl group proton instead of the N3 imino proton of T+7 (5.O4-Me-T/A, 7.N3-Me-T/A and 9.N4-Me-C/A). C-H···O and C-H···π interactions have been observed in many natural protein–DNA complexes and other compounds (19–22). We tested the N3 proton binding hypothesis by substituting the cytidine N4 amino proton in 13.C/A by a methyl group in 9.N4-Me-C/A, to place a proton closer to the N3 atom. This substitution caused the binding site affinity to be enhanced, crossing the KD step, so that the KD becomes closer to that of the wild-type binding site 1.T/A (Fig. 5A).
Figure 5.

Rescuing C binding affinity. Structures of bases and potential hydrogen bonds at position +7 are shown. Lower numbers correspond to stronger binding. (A) 13.C/A binds RepA more weakly than 1.T/A. This low binding can be rescued by substituting an N4 proton in C (13.C/A) with the methyl group in N4-Me-C (9.N4-Me-C/A). (B) Two more structures that have a C-H proton near the N3 atom also bind RepA well (5.O4-Me-T/A and 7.N3-Me-T/A). (C) Outlines of the structures in A and B were aligned. Arrows point in the direction from which RepA would have to approach to form hydrogen bonds with the protons (green circles). The hydrogen on N4 of 13.C is apparently pointing in the wrong direction or is too far from RepA to make a contact (arrow with red circle) since RepA approaches from the minor groove (bottom of the figure). To generate the figure, deoxyribose moieties were replaced by methyl groups and the structures were energy minimized for 1000 steps with the CV force field (Insight II, Molecular Simulations Inc., San Diego, CA). Connolly surfaces are shown (33).
C-H···O bonds are weak, having a reported energy range from 1 to 2 kcal/mol (20) or from 0.5 to 5 kcal/mol (19). The normal N-H···RepA bond has roughly the same strength as the C-H···RepA bond in our modified DNAs. The apparent binding energy difference between 23.abasic/A and 1.T/A was 1.03 ± 0.26 kcal/mol, representing the loss of a bond with a strength in the order of one CH···O interaction. These results suggest that RepA forms no more than one hydrogen bond to the base at position +7.
As a positive control to determine that chaperone- and urea-activated RepA have similar dissociation constants, we repeated the gel mobility shift experiments with 1.T/A, 2.T/abasic, 13.C/A and 23.abasic/A using chaperone-activated native RepA. 1.T/A was almost indistinguishable from 2.T/abasic and 10.C/A was almost the same as 23.abasic/A, but, as with inclusion body isolated RepA, the first two are distinct from the latter two modifications (data not shown). This demonstrates that inclusion body RepA has the same properties as native RepA.
All of the base modifications that we created can be placed into four classes. The first class, discussed above, contains modified bases that allow an interaction between RepA and a proton near the N3 atom. Bases of the second class do not have such an interaction; their binding energy is ∼1.03 ± 0.26 kcal/mol less than that of the first class (e.g. 1.T/A versus 23.abasic/A). Binding energies of the third and fourth classes of modifications are comparable to or less than that of 23.abasic/A. Almost all of them have a minor groove amino group that inhibits RepA binding. There are two classes since a +7 amino group (29.5-Me-isodC/A, 30.G/G, 31.G/C, 32.G/A, 33.2AP/T and 34.G/T) has a stronger effect than a +7′ amino group (21.T/2,6-diaminopurine, 22.T/2AP, 24.C/2AP, 25.A/G, 26.C/G and 27.T/G). This difference can also be seen clearly by comparing the following reversed pairs: 22.T/2AP versus 33.2AP/T, 25.A/G versus 32.G/A, 26.C/G versus 31.G/C and 27.T/G versus 34.G/T. Deleting the minor groove amino group relieves this inhibition [21.T/2,6-diaminopurine to 1.T/A, 22.T/2AP to 4.T/Nebularine, 24.C/2AP to 13.C/A (the C6 amino group of adenine at +7′ is irrelevant as can be seen by comparing 1.T/A with 4.T/Nebularine), 26.C/G to 14.C/dI, 27.T/G to 19.T/dI].
Some of the molecules had a higher KD than might have been anticipated. High KD for the 16.T/T, 19.T/dI and 20.T/C modifications may represent some DNA structure distortion by steric collision or non-canonical base pairing. It is hard to explain the high KD of the 11.T/7-deaza-A although a syn/anti conformation change could bring the C7 proton of the 7-deaza-A, which is absent in 1.T/A, into contact with RepA in the minor groove, with unpredictable effects. Although one might suppose that the high KD of 28.A/T can be explained by canonical H-bonds between A+7 and T+7′ that would prevent RepA from opening the DNA, the following argument suggests that this is not true. By definition, 23.abasic/A cannot form canonical H-bonds because there is no +7 base. Since 23.abasic/A and 28.A/T have the same binding energy (ΔΔG = 0.25 ± 0.29 kcal/mol), no additional bonds exist in 28.A/T for RepA to break. We infer that 28.A/T does not have hydrogen bonds, and this base pair must be distorted.
A hydrogen bond normally forms between the T N3 proton and A N1 in duplex B-form DNA but, as shown above, in a RepA complex the N3 proton at position +7 is bound to RepA so it is likely that the normal bond must have been broken. This is confirmed by comparing 1.T/A, 4.T/Nebularine and 2.T/abasic. The 1.T/A should form two H-bonds between positions +7 and +7′, the 4.T/Nebularine forms only one H-bond, and the 2.T/abasic forms no H-bonds. Yet the binding energy of all three hairpins is almost the same, suggesting that there are no hydrogen bonds between +7 and +7′ even before RepA binds. This hypothesis is consistent with the observation that when the hairpin turn is not present, double-stranded RepA oligos dissociate during gel electrophoresis (data not shown). Open base pair(s) may have destabilized the DNA.
We conclude that RepA DNA has an intrinsically open structure and that RepA probably makes an unusual single hydrogen bond to the N3 proton of the thymidine at position +7 in the RepA binding site.
DISCUSSION
The replication initiator protein RepA of bacteriophage P1 binds to one face of the DNA (2,6). In the middle of the binding site is a T/A base pair whose minor groove part faces directly towards RepA. The orientation of this pair is conserved in all 14 sites (Fig. 1), although theoretically a protein cannot easily distinguish T/A from A/T by contacts in the minor groove of B-form DNA (1). To understand the source of this unusual sequence conservation we created many variant RepA binding sites by altering chemical moieties of the T/A pair at +7 (Fig. 2) and assessed the effect on KD (Fig. 3). We found four major classes of variants.
Variants with an amino group in the minor groove on the T side were consistently the worst at binding RepA (hairpins 29–34, dark pink in Fig. 2). If the amino group was on the A side, binding was better (hairpins 21–27, light pink in Fig. 2). These two classes can explain the exclusion of C and G from wild-type RepA sites. Since the ‘natural’ variant 26.C/G is better at binding than 31.G/C, RepA may be forming an asymmetric repulsive contact in the minor groove in this region. Furthermore, the asymmetry suggests that there is non-B-form DNA at this position. Our data do not address the issue of the mechanism by which RepA excludes 28.A/T, which falls between the minor groove NH3 group classes (light and dark pink in Fig. 2). As mentioned earlier, several lines of evidence point toward an unusual structure at this base pair; perhaps 28.A/T disrupts the DNA structure preferred by RepA and so reduces RepA binding. The third class (hairpins 10–20 in Fig. 2) appears to have either no contacts, purine–purine collisions or non-canonical base pairing at +7, and is bounded by a step in the binding energy on one side and the second class on the other side.
The fourth class of variants is defined by a significant (Fig. 4) binding energy step between structures 9 and 10. Variations on the major groove side of the bases in this class (gold in Fig. 2) and at O2 and O4 have little effect on the binding energy. Members of this class could all form a hydrogen bond to RepA in a place at or close to N3 of T (green in Fig. 2). Thus, we suggest that the high conservation at +7 results from RepA binding to the N3 proton.
DNA helix distortion is an alternative model that could explain the high conservation of T+7. Chemical modifications can lead to two possible results: the gain or loss of specific contacts to RepA or distortion of the DNA helix which could indirectly affect RepA binding, for example by altering DNA bending. When a modification does not change the KD there are two possible explanations: either there is no gain or loss of specific contacts and no distortion, or DNA distortion exactly compensates for the change in contacts. The latter possibility is unlikely, so the ΔΔG ≈ 0 cases are probably not explained by DNA distortion caused by our modifications. From the ΔΔG ≈ 0 cases, we conclude that the adenine at +7, the thymine C5 methyl group, O4 and O2 are not involved in the RepA interaction. Likewise, because compounds 1, 5, 7 and 9 have the same KD, we conclude that RepA cannot distinguish between the N3 proton or a proton near the N3 atom. The non-zero cases are consistent with these conclusions.
Nevertheless, the available data allow for some structural effects. An analysis of 86 DNAs bound by sequence-specific proteins showed that two base pair steps, TG/CA and TA/TA, frequently have positive roll that produces DNA bending (23). For example, in CRP sites two such kinks separate straight B-form DNA segments. TG/CA steps occur from three to five times in RepA sites (5), and some of these could account for why RepA bends the DNA (24). Our mutations and modifications of the thymine in the TG/CA step in RepA sites at +7 and +8 (Fig. 1) could alter the DNA flexibility and bending thereby changing protein binding. If so, this might help to explain why the N3 proton containing hairpins 11.T/7-deaza-A, 16.T/T, 19.T/dI and 20.T/C has low binding affinity.
The sequence logos of Fis (18) and CRP (2) binding sites have TG/CA steps, but in both cases they are located where the major groove faces the protein and they are not fully conserved. Thus, TG/CA steps do not invariably lead to strong conservation, and so the TG/CA step alone cannot explain the high conservation at +7 in RepA sites. Furthermore, sequence conservation does not correlate with DNA distortion: in IHF binding sites a strong kink with a proline intercalation exists where there is little sequence conservation, a strong minor groove TG/CA conservation corresponds to a second proline intercalation at a bend, and a strong minor groove TG/CA and TA/TA conservation corresponds to an unbent DNA (3,8,25). It is possible that the high conservation of T+7 in RepA sites results because RepA uses both a structural motif and a specific interaction with the N3 proton of this base. As at CRP and IHF, positive base roll at the TG/CA or TA/TA at positions +7 and +8 could make this region flexible, allowing RepA to widen the minor groove and enhancing access to the N3 proton. Thus a structural (indirect-contact) model and a direct contact model are not necessarily incompatible. Indeed, examples of proteins that use both are T4 endonuclease V, where a DNA kink and base flipping are involved in thymine-dimer recognition (26), and EcoRI DNA methyltransferase, where DNA bending accelerates base flipping (27).
The idea of a direct base contact between RepA and the T+7 N3 proton was supported by a rescue experiment. Substituting the C4 amino group of 13.C/A with a methoxy group in 5.O4-Me-T/A improved the KD, which passed across the step in Figure 3. To explain this result, we hypothesized that RepA was hydrogen bonding to one of the methoxy protons. This suggested that the poorly binding 13.C/A might be ‘rescued’ by replacing one hydrogen on the cytidine amino group with a methyl to maintain and perhaps improve RepA binding. When we synthesized this hairpin, we found that 9.N4-Me-C/A does indeed bind better than 13.C/A (Fig. 5). This result suggests that RepA, approaching from the minor groove, is apparently unable to contact the N4 proton on 13.C but that this situation is remedied in 9.N4-Me-C/A by moving the N4 proton closer to the minor groove and (presumably) by altering its bond angle so that it points into the minor groove (Fig. 5C).
This hydrogen bond model cannot entirely account for the data because the distance that the hydrogen bond contact changes by substituting the methyl group in 7.N3-Me-T with the methyl group in 9.N4-Me-C is more than a hydrogen bond could withstand in a rigid structure. However, if there is flexibility in the position of either the protein contact or T+7, then a bond could be accommodated. For example, rotation of the thymine into the minor groove could shorten the distance, and this would be a form of base flipping.
It is not obvious how all the data in Figure 1 can be rationalized or how the rescue experiment data could be explained by helix distortion and indirect readout. In contrast, the experimental data do support the proposal that RepA normally contacts the N3 hydrogen on the T base at position +7. For this contact to be made, the normal hydrogen bond between thymine N3 and adenine N1 must be broken or modified. The DNA strands could be separated and an element of RepA inserted into the bulged helix, or the T could be flipped out of the helix. Although we have not demonstrated the latter possibility directly, we favor it because it should require less energy and would allow further opening of the DNA helix prior to replication, which is the primary function of RepA. However, either mechanism could account for the excess information found at RepA binding sites.
DNA structure changes might be detected biochemically. However, the work of Mukhopadhyay and Chattoraj (24) shows that DNA in RepA binding sites does not become more sensitive to KMnO4 when RepA binds. Since this reagent is specific for pyrimidine bases in unstacked DNA, the unpaired T at +7 is not exposed to solution and must be sequestered in the RepA complex. This is consistent with the proposed specific N3 contact.
In addition, these workers observed that individual RepA sites are bent when bound by RepA and that the five RepA binding sites in the phage P1 origin absorb one positive superhelical turn of DNA. This could either twist the DNA or writhe it. Because of the absence of KMnO4-sensitive DNA opening, they interpreted the data as indicating that the DNA is smoothly wrapped around a RepA complex, consistent with the observations of Brendler et al. (28). A continuous B-form-like structure would make the +7 thymine N3 proton inaccessible to RepA, since it is in the center of the DNA helix, yet our data show that it is contacted. One possibility is that RepA acts differently in the complex than when bound to an unsupercoiled DNA. Alternatively, the discovery of base flipping by DNA methylases and other DNA modifying enzymes (9,10) suggests that this conflict could be resolved if RepA protects the thymine from KMnO4 by flipping this base out of the helix and by sequestering the base into a pocket of the protein.
Our data imply that five opened bases are present when RepA binds the five iterons in the origin nucleoprotein complex. The binding of at least one DnaA molecule is also required for P1 origin function (29), and inspection of its sequence logo implies that it also has unusual sequence conservation but that the distorted or flipped region consists of half of the entire site (3). Furthermore, pre-opened bases have been observed at 5′-ATC-3′ sequences in the P1 origin overlapping the RepA sites and two of the five DnaA sites (24,30). Thus three kinds of elements distort DNA structure in the P1 origin. In addition, we have repeatedly observed that 28 bp double-stranded RepA binding site oligos easily dissociate in polyacrylamide gels (data not shown), suggesting a natural tendency of the iteron sequences to be opened. These observations suggest that the ATC sequences and bound RepA set up a hair-trigger, with many bases opened but the majority of the helix still closed. DnaA binding could then trigger a massive strand opening and unwinding (30). Intriguingly, only one DNA strand is exposed by this process (30). The other strand contains the T at +7, so the flipped bases could remain bound to and sequestered by RepA molecules during strand opening. Because of the need for many small components in the hair-trigger, this model can explain the prevalence of repeated binding sites that contain anomalous bases in other iteron-dependent DNA origins (31).
Are the observations made here sufficient to explain the conservation of RepA T+7? In RepA–DNA complexes a T/A pair at +7 is 6.5 ± 2.6-fold more stable than the next strongest variant with natural bases, a C/G pair (Fig. 3). The constant kBT ln2 (joules/bit, where kB is Boltzmann’s constant and T is the temperature in Kelvin) is a conversion factor between energy and information that was derived from the Second Law of Thermodynamics (32). This conversion gives 2.7 ± 0.6 bits as the maximum number of binary choices that could be made for the observed energy dissipation. Since this is larger than 2 bits, the unique N3 proton contact fully accounts for the strong conservation of T+7 by RepA.
Acknowledgments
ACKNOWLEDGEMENTS
We thank Rich Roberts for suggesting an experimental approach, Lakshmanan Iyer for generating Figure 5, Richard Lowry for code to convert t to probability (http://faculty.vassar.edu/∼lowry/VassarStats.html), Greg Alvord for statistical advice, Becky Chasan for extensive editorial comments on the manuscript, Karen Lewis and Brandon Cunningham for comments on the manuscript, and Igor Sidorov for helping with a computer simulation of complex formation. The OR1265/pALA131 strain was a gift from Dhruba Chattoraj. The content of this publication does not necessarily reflect the views or policies of the Department of Health and Human Services, nor does mention of trade names, commercial products or organization imply endorsement by the US Government. This project has been funded in whole or in part with Federal funds from the National Cancer Institute, National Institutes of Health, under Contract No. N01-C0-56000.
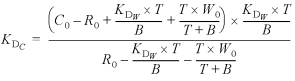
APPENDIX: KD calculation
KD was calculated from measurements given in Figure 3 using the following definitions and equations.
W0: the total labeled wild-type hairpin concentration;
W: the free labeled wild-type hairpin concentration;
WR: the complex between labeled wild-type hairpin and RepA concentration;
C0: the total unlabeled competitor concentration;
C: the free unlabeled competitor concentration;
CR: the complex between unlabeled competitor and RepA concentration;
R0: the total RepA concentration;
R: the free RepA concentration;
KDW: the disassociation constant for the wild-type RepA binding site (13);
KDC: the disassociation constant for the competitor hairpin;
T: top band intensity;
B: bottom band intensity;
ρ is the ratio between B and T.
The elementary binding reactions are:
![]() 2
2
![]() 3
3
Equation 2 gives
![]() 4
4
Equation 3 gives
![]() 5
5
Rearranging equation 4 gives
![]() 6
6
By definition,
C0 = C + CR 7
Rearranging equation 7 gives
C = C0 – CR 8
Inserting equation 8 into 5 gives
![]() 9
9
By definition,
R0 = R + WR + CR 10
Rearranging equation 10 gives
CR = R0 – R – WR 11
Substituting 11 into 9 gives
![]() 12
12
By definition,
![]() 13
13
By definition,
![]() 14
14
Substituting equations 13 and 14 into 6 gives
![]() 15
15
Substituting equations 14 and 15 into 12 gives
 16
16
By definition,
ρ = B/T 17
Substituting equation 17 into 16 generates equation 1 in the main text.
REFERENCES
- 1.Seeman N.C., Rosenberg,J.M. and Rich,A. (1976) Sequence-specific recognition of double helical nucleic acids by proteins. Proc. Natl Acad. Sci. USA, 73, 804–808. [DOI] [PMC free article] [PubMed] [Google Scholar]
- 2.Papp P.P., Chattoraj,D.K. and Schneider,T.D. (1993) Information analysis of sequences that bind the replication initiator RepA. J. Mol. Biol., 233, 219–230. [DOI] [PubMed] [Google Scholar]
- 3.Schneider T.D. (2001) Strong minor groove base conservation in sequence logos implies DNA distortion or base flipping during replication and transcription initiation. Nucleic Acids Res., 29, 4881–4891. [DOI] [PMC free article] [PubMed] [Google Scholar]
- 4.Abeles A.L. (1986) P1 plasmid replication. Purification and DNA-binding activity of the replication protein RepA. J. Biol. Chem., 261, 3548–3555. [PubMed] [Google Scholar]
- 5.Abeles A.L., Reaves,L.D. and Austin,S.J. (1989) Protein–DNA interactions in regulation of P1 plasmid replication. J. Bacteriol., 171, 43–52. [DOI] [PMC free article] [PubMed] [Google Scholar]
- 6.Papp P.P. and Chattoraj,D.K. (1994) Missing-base and ethylation interference footprinting of P1 plasmid replication initiator. Nucleic Acids Res., 22, 152–157. [DOI] [PMC free article] [PubMed] [Google Scholar]
- 7.Schneider T.D. (1996) Reading of DNA sequence logos: Prediction of major groove binding by information theory. Methods Enzymol., 274, 445–455. [DOI] [PubMed] [Google Scholar]
- 8.Rice P.A., Yang,S., Mizuuchi,K. and Nash,H.A. (1996) Crystal structure of an IHF–DNA complex: a protein-induced DNA U-turn. Cell, 87, 1295–1306. [DOI] [PubMed] [Google Scholar]
- 9.Roberts R.J. (1995) On base flipping. Cell, 82, 9–12. [DOI] [PubMed] [Google Scholar]
- 10.Roberts R.J. and Cheng,X. (1998) Base flipping. Annu. Rev. Biochem., 67, 181–198. [DOI] [PubMed] [Google Scholar]
- 11.Reyes O., Gottesman,M. and Adhya,S. (1979) Formation of lambda lysogens by IS2 recombination: gal operon-lambda pR promoter fusions. Virology, 94, 400–408. [DOI] [PubMed] [Google Scholar]
- 12.Wickner S., Hoskins,J. and McKenney,K. (1991) Monomerization of RepA dimers by heat shock proteins activates binding to DNA replication origin. Proc. Natl Acad. Sci. USA, 88, 7903–7907. [DOI] [PMC free article] [PubMed] [Google Scholar]
- 13.DasGupta S., Mukhopadhyay,G., Papp,P.P., Lewis,M.S. and Chattoraj,D.K. (1993) Activation of DNA binding by the monomeric form of the P1 replication initiator RepA by heat shock proteins DnaJ and DnaK. J. Mol. Biol., 232, 23–34. [DOI] [PubMed] [Google Scholar]
- 14.Wickner S., Gottesman,S., Skowyra,D., Hoskins,J., McKenney,K. and Maurizi,M.R. (1994) A molecular chaperone, ClpA, functions like DnaK and DnaJ. Proc. Natl Acad. Sci. USA, 91, 12218–12222. [DOI] [PMC free article] [PubMed] [Google Scholar]
- 15.Schneider T.D., Stormo,G.D., Gold,L. and Ehrenfeucht,A. (1986) Information content of binding sites on nucleotide sequences. J. Mol. Biol., 188, 415–431. [DOI] [PubMed] [Google Scholar]
- 16.Palmer I. and Wingfield,P.T. (1995) Preparation and extraction of insoluble (inclusion-body) proteins from Escherichia coli. In Coligan,J.E., Dunn,B.M., Ploegh,H.L., Speicher,D.W. and Wingfield,P.T. (eds), Current Protocols in Protein Science. John Wiley & Sons, Inc., Vol. 1, pp. 6.3.1–6.3.15. [Google Scholar]
- 17.Hirao I., Kawai,G., Yoshizawa,S., Nishimura,Y., Ishido,Y., Watanabe,K. and Miura,K. (1994) Most compact hairpin-turn structure exerted by a short DNA fragment, d(GCGAAGC) in solution: an extraordinarily stable structure resistant to nucleases and heat. Nucleic Acids Res., 22, 576–582. [DOI] [PMC free article] [PubMed] [Google Scholar]
- 18.Hengen P.N., Bartram,S.L., Stewart,L.E. and Schneider,T.D. (1997) Information analysis of Fis binding sites. Nucleic Acids Res., 25, 4994–5002. [DOI] [PMC free article] [PubMed] [Google Scholar]
- 19.Derewenda Z.S., Lee,L. and Derewenda,U. (1995) The occurrence of C-H···O hydrogen bonds in proteins. J. Mol. Biol., 252, 248–262. [DOI] [PubMed] [Google Scholar]
- 20.Wahl M.C. and Sundaralingam,M. (1997) C-H···O hydrogen bonding in biology. Trends Biochem. Sci., 22, 97–102. [DOI] [PubMed] [Google Scholar]
- 21.Mandel-Gutfreund Y., Margalit,H., Jernigan,R.L. and Zhurkin,V.B. (1998) A role for C-H···O interactions in protein–DNA recognition. J. Mol. Biol., 277, 1129–1140. [DOI] [PubMed] [Google Scholar]
- 22.Brandl M., Weiss,M.S., Jabs,A., Suhnel,J. and Hilgenfeld,R. (2001) C-H···π-interactions in proteins. J. Mol. Biol., 307, 357–377. [DOI] [PubMed] [Google Scholar]
- 23.Dickerson R.E. (1998) DNA bending: the prevalence of kinkiness and the virtues of normality. Nucleic Acids Res., 26, 1906–1926. [DOI] [PMC free article] [PubMed] [Google Scholar]
- 24.Mukhopadhyay G. and Chattoraj,D.K. (1993) Conformation of the origin of P1 plasmid replication. Initiator protein induced wrapping and intrinsic unstacking. J. Mol. Biol., 231, 19–28. [DOI] [PubMed] [Google Scholar]
- 25.Goodrich J.A., Schwartz,M.L. and McClure,W.R. (1990) Searching for and predicting the activity of sites for DNA binding proteins: compilation and analysis of the binding sites for Escherichia coli integration host factor (IHF). Nucleic Acids Res., 18, 4993–5000. [DOI] [PMC free article] [PubMed] [Google Scholar]
- 26.Morikawa K. and Shirakawa,M. (2000) Three-dimensional structural views of damaged-DNA recognition: T4 endonuclease V, E. coli Vsr protein and human nucleotide excision repair factor XPA. Mutat. Res., 460, 257–275. [DOI] [PubMed] [Google Scholar]
- 27.Allan B.W., Garcia,R., Maegley,K., Mort,J., Wong,D., Lindstrom,W., Beechem,J.M. and Reich,N.O. (1999) DNA bending by EcoRI DNA methyltransferase accelerates base flipping but compromises specificity. J. Biol. Chem., 274, 19269–19275. [DOI] [PubMed] [Google Scholar]
- 28.Brendler T.G., Abeles,A.L., Reaves,L.D. and Austin,S.J. (1997) The iteron bases and spacers of the P1 replication origin contain information that specifies the formation of a complex structure involved in initiation. Mol. Microbiol., 23, 559–567. [DOI] [PubMed] [Google Scholar]
- 29.Abeles A.L., Reaves,L.D. and Austin,S.J. (1990) A single DnaA box is sufficient for initiation from the P1 plasmid origin. J. Bacteriol., 172, 4386–4391. [DOI] [PMC free article] [PubMed] [Google Scholar]
- 30.Mukhopadhyay G., Carr,K.M., Kaguni,J.M. and Chattoraj,D.K. (1993) Open-complex formation by the host initiator, DnaA at the origin of P1 plasmid replication. EMBO J., 12, 4547–4554. [DOI] [PMC free article] [PubMed] [Google Scholar]
- 31.Chattoraj D.K. and Schneider,T.D. (1997) Replication control of plasmid P1 and its host chromosome: the common ground. Prog. Nucleic Acid Res. Mol. Biol., 57, 145–186. [DOI] [PubMed] [Google Scholar]
- 32.Schneider T.D. (1991) Theory of molecular machines. II. Energy dissipation from molecular machines. J. Theor. Biol., 148, 125–137. [DOI] [PubMed] [Google Scholar]
- 33.Connolly M.L. (1983) Solvent-accessible surfaces of proteins and nucleic acids. Science, 221, 709–713. [DOI] [PubMed] [Google Scholar]