

Abstract

Ionic liquid desulfurization is an effective method for achieving green and circulating desulfurization. To overcome the negative impact of the high viscosity of ionic liquids on the desulfurization process, an economical and efficient supported ionic liquid—triethanolamine acetate ionic liquid/silica (TAIL/SiO2) was prepared in this study. TAIL is synthesized using triethanolamine and acetic acid and subsequently loaded onto silica gel particles. The effects of the reaction temperature, humidity, silica particle size, and loading ratio on SO2 adsorption are investigated using a fixed-bed reactor. The results indicate that the surface of the silica gel loaded with ionic liquid formed uneven spherical clusters, and the aggregate volume increased with an increase in the loading ratio. The TAIL/SiO2 sulfur capacity could be effectively increased by increasing the loading ratio (exceeding 0.74 is unfavorable), decreasing the silica particle size, and reducing the reaction temperature and moisture content. The maximum sulfur capacity can reach 124.98 mg SO2/(g TAIL/SiO2) under experimental conditions, which is higher than that of activated carbon. The Bangham rate model effectively predicts the kinetics of the adsorption process of SO2.
1. Introduction
As a major air pollutant, SO2 has a severe impact on human health, productivity, and life, as well as on the ecosystem.1,2 Specifically, burning of fossil fuels, such as coal, remains the main source of global SO2 emissions.3,4
Flue gas desulfurization (FGD) is one of the most effective methods for reducing SO2 emission.5,6 Currently, limestone–gypsum wet desulfurization is the most widely used and mature desulfurization technology for FGD.7,8 However, this technology uses a large amount of limestone as an adsorbent, which is nonrenewable. In addition, treatment and utilization of byproducts have been challenging.9,10 Hence, their large-scale development and application are gradually being restricted by limited resources and environmental considerations. In particular, activated carbon has received considerable attention for application in flue-gas desulfurization.11,12 Although activated carbon desulfurization technology is simple and the product can be regenerated, activated carbon has inherent disadvantages (e.g., low sulfur capacity and large regeneration loss).13,14 Therefore, a high-efficiency and high-sulfur-capacity desulfurization technology that can be recycled after use should be developed.
The commonly used circulation desulfurization technologies include activated carbon desulfurization, organic amine flue gas desulfurization,15,16 and ionic liquid desulfurization.17,18 Ionic liquids (ILs) are salts comprising ions with a low melting point and are in a molten state at room temperature (21–25 °C). They are characterized by low vapor pressure, good solubility, and strong thermal stability. Further, they are widely used for gas adsorption, extraction, and biosynthesis.19−22 Based on the cation type, ionic liquids can be classified into imidazoles, pyridines, guanidines, quaternary ammonium salts, and hydroxylamine ionic liquids.23 Yang et al.17 synthesized 1-ethyl-3-methylimidazolium chloride ([Emim][Cl]) and 1-ethyl-3-methylimidazolium thiocyanate ([Emim][SCN]) and then mixed them together. Two IL mixtures were used to adsorb SO2 at different temperatures and SO2 partial pressures. The study showed that ILs can effectively adsorb SO2 and the sulfur capacity can reach 0.11 g g–1 solvent at 20 °C and 1960 ppm. Jiang et al.24 developed a Langmuir model for predicting SO2 adsorption performance. Then, they synthesized five types of imidazolium ionic liquids to validate the model. They found that this model can successfully predict SO2 adsorption by imidazolium ionic liquids, with a maximum adsorption capacity of IL [Emim][Tetz] of 0.24 g g–1 IL. Unlike traditional solvents, the capacity of ionic liquids for adsorbing polluting gases, such as SO2, is significantly improved, but high viscosity and desorption energy remain as limitations.25 Due to their high resistance to gas diffusion, high-viscosity ionic liquids are not conducive to SO2 adsorption. To address this problem, some scholars have proposed loading an ionic liquid onto a porous medium for optimization. Severa et al.26 synthesized a 1-ethyl-3-methylimidazole acetate ionic liquid and loaded it onto activated carbon. They found that the loaded [C2mim][Ac] had better selectivity for SO2. Compared with pure ionic liquids, gas diffusion through the supported [C2mim][Ac] ionic liquid film increased, and low concentrations of SO2 can be easily captured. Karousos et al.27 prepared different supported ionic liquid phase adsorbents (SILPs) by loading 1-ethyl-3-methylimidazole-bis(trifluoromethyl sulfonyl)imide and 1-ethyl-3-methylimidazole acetate on activated carbon using a physical impregnation method. These were used to examine the adsorption and separation of SO2 in simulated flue gas. The results indicate that the SILPs prepared using the physical adsorption method had significant stability and SO2 trapping efficiency. However, the conditions for the synthesis of imidazoles and guanidines must be strictly controlled, and the cost of raw materials is high, making them difficult to promote and apply on a large scale. Unlike imidazoles and guanidines, hydroxylamine ionic liquids have attracted attention because of their low cost, easy availability, high desulfurization efficiency, and easy desorption.28 Yuan et al.29 synthesized a series of hydroxylamine ionic liquids using alcohol amines, lactic acid, and acetic acid. They investigated the influence of hydroxylamine ionic liquids, prepared with different cations and anions on the adsorption capacity of SO2. Qi et al.30 synthesized hydroxylamine ionic liquids with different anions using the neutralization method to examine the adsorption of SO2 under low pressure. The results showed that the adsorption capacity of [TEOA][AC], [TEOA][LA], and [TEOA][CA] reached 1.02, 1.19, and 3.34 mol mol–1, respectively, under a SO2 partial pressure of 4 MPa. Zhai et al.31 used a water bath microwave method to directly neutralize alcohol amines (e.g., ethanolamine, diethanolamine, and triethanolamine) and acids (e.g., lactic acid and formic acid) to prepare hydroxylamine ionic liquids. The results showed that the adsorption rate of SO2 by most hydroxylamine ionic liquids was above 90%.
In these studies, although the combination of ethanolamine and lactic acid showed a higher desulfurization efficiency, the combination of triethanolamine and acetic acid was less expensive. In addition, the latter has relatively high SO2 removal efficiency, making it more suitable for large-scale applications. However, current research on the use of triethanolamine and acetic acid to synthesize ionic liquids for desulfurization still focuses on gas–liquid reactions. The limitations caused by the high viscosity of the ionic liquid in a gas–liquid reaction are difficult to overcome.
To address these limitations, this study used triethanolamine and acetic acid as the main raw materials to synthesize a triethanolamine acetic acid ionic liquid (TAIL) and support the ionic liquid TAIL on silica gel particles to obtain TAIL/SiO2. The reasons for using silica gel particles as a support of ionic liquids are that silica gel has a uniform microporous structure, stable physicochemical properties, good thermal stability, and high mechanical strength, which is used by many researchers to support ionic liquids.32,33 The adsorption performance of TAIL/SiO2 for SO2 in simulated flue gas under different factors (temperature, silica particle size, loading ratio, and moisture) is systematically studied using an experimental system. In addition, the adsorption kinetics is the basis for studying the adsorption rate and adsorption process. The adsorption mechanism can be further explored by fitting the experimental data to a kinetic model. Therefore, this study calculates and analyzes adsorption kinetics.
2. Materials and Methods
2.1. Preparation and Characterization of TAIL/SiO2
The main chemical raw materials used in this experiment, triethanolamine (C6H5NO3) and acetic acid (C2H4O2), were provided by Sinopharm Chemical Reagent Co., Ltd. and were analytically pure (AR). TAIL was synthesized using the microwave reaction method34 and supported on silica gel particles. The commonly used methods for preparing supported ionic liquid adsorbents include chemical bonding and the physical immobilization method.35,36 In this study, TAIL/SiO2, which is a physical immobilization method, was prepared using immersion evaporation. Using TAIL/SiO2 with a loading ratio of 1:1 as an example, 10 g of TAIL and 75 mL of anhydrous ethanol were weighed and stirred well in a beaker to obtain mixture A. Further, 10 g of silica gel particles was placed in a beaker containing mixture A to obtain mixture B. Mixture B was placed in a water bath pot heated to 80 °C. The mixture was stirred continuously until most of the solvent had evaporated. Finally, the mixture was placed in an oven and dried at 55 °C to obtain TAIL/SiO2.
A viscometer and pH detector were used to obtain the physical properties of TAIL, including its viscosity, pH value, and density. The surface functional groups of TAIL and TAIL/SiO2 were analyzed by Fourier transform infrared spectroscopy (FTIR) via attenuated total reflection (ATR) using a Thermo Scientific Nicolet Is5. The weight loss of TAIL/SiO2 was tested using a synchronous thermal analyzer to obtain the actual load ratio of TAIL/SiO2 under different loading conditions. The surface morphologies of the samples were characterized using a SUPRA 55 scanning electron microscope (SEM).
2.2. SO2 Adsorption Experiments
To explore the adsorption characteristics of TAIL/SiO2 for SO2 under different conditions, the following variables were considered: silica particle size, adsorption temperature, humidity, and loading ratio. The experimental parameters are listed in Table 1.
Table 1. Main Experimental Parameters.
| parameter | value | ||||
|---|---|---|---|---|---|
| silica particle size [μm] | 125.4 | 178.7 | 218.3 | 428.7 | 636.4 |
| temperature inside the reactor [°C] | 30 | 35 | 40 | 45 | 50 |
| loading ratio | 0.2:1 | 0.39:1 | 0.58:1 | 0.74:1 | 0.89:1 |
| humidity inside the reactor [%] | 0 | 6 | 8 | 10 | 12 |
As shown in Figure 1, the experimental system was mainly composed of a simulated flue gas generation system, a fixed-bed reaction system, and a flue gas analysis system. The fixed-bed reactor was made of glass tubes with a height of 400 mm and inner diameter of 20 mm. A quartz sand core was arranged 150 mm from the reactor outlet to support TAIL/SiO2.
Figure 1.

Schematic diagram of the experimental system.
The total flow rate of the simulated flue gas was 1 L min–1, consisting of 1000 ppm SO2, 6% O2, 6% CO2, and 0–12% H2O, with N2 used as the balance gas. Experiments were conducted using the control single-variable method to investigate the effects of different silica particle sizes, temperatures, loading ratios, and humidity on the TAIL/SiO2 adsorption of SO2.
When the concentration of SO2 in the flue gas analyzer reached 1000 ppm, it was considered that TAIL/SiO2 had completely broken through. In this case, the quantity of SO2 adsorbed by TAIL/SiO2 is called the sulfur capacity, and its value can be calculated from the penetration curve of the TAIL/SiO2 adsorption of SO2. The sulfur capacity (represented by the capital letter Q) was evaluated using the amount of SO2 (mg) adsorbed by TAIL/SiO2 (per gram), as expressed in eq 1
| 1 |
where Q is the sulfur capacity, mg SO2/g(TAIL/SiO2); Cin and Cout are the concentrations (ppm) of SO2 at the inlet and outlet of the reactor, respectively; V is the total gas flow rate (L min–1); and M is the TAIL/SiO2 mass (g).
2.3. Kinetic Model Development
To investigate the adsorption mechanism of SO2 on TAIL/SiO2, several kinetic models were used to fit the experimental data. Commonly used kinetic models include the pseudo-first-order kinetic, pseudo-second-order kinetic, Elovich kinetic, and Bangham rate models.37−41
Pseudo-first-order kinetic model, eq 2
| 2 |
Upon integrating eq 2, eq 3 is obtained
| 3 |
where k1 is the first-order adsorption rate constant (min–1). The pseudo-first-order kinetic model can determine whether the adsorption process is controlled by internal mass transfer.38
Pseudo-second-order kinetic model, eq 4
| 4 |
where k2 is the second-order adsorption rate constant (min–1) and t is the adsorption time (min). The pseudo-second-order kinetic model can be used to determine whether the adsorption rate is limited by the chemical reactions.38
| 5 |
| 6 |
where a is the initial adsorption rate (mg g–1 min–1), b is a constant (g mg–1), and t is the adsorption time (min). If the data are consistent with that of the Elovich kinetic model, the reaction rate decreases exponentially with increasing surface adsorption.37
| 7 |
where k and n are constants and t is the adsorption time (min). The Bangham rate model determines whether the adsorption process is controlled by pore diffusion.42
In eqs 3, 4, 6, and 7, qt is the adsorption capacity at time t (mg g–1) and qe is the adsorption capacity at saturation (mg g–1).
3. Results and Discussion
3.1. Characteristic Analysis of TAIL and TAIL/SiO2
TAIL was yellow and viscous with a density of approximately 1.207 g mL–1 and a pH of approximately 8.37. When the temperature was low, TAIL solidified and began to melt at approximately 35 °C. Figure 2 shows the change in the TAIL viscosity with temperature. Viscosity reflects the resistance to gas diffusion when the flue gas passes through it. Supporting it with silica gel particles can effectively overcome the resistance caused by the viscosity, which can also maintain the nature of the TAIL and improve its SO2 adsorption capacity.
Figure 2.

TAIL viscosity changes with temperature.
The surface functional groups of TAIL were analyzed using a Fourier transform infrared spectrometer, and infrared spectra were obtained (Figure 3). The amine structure is indicated by a strong and broad adsorption band at 3500–3000 cm–1, which is a combination of stretching vibrations of N–H and −OH.43,44 The stretching vibration of C=O is at 1710 cm–1;43 the antisymmetric stretching vibration of −COO– combines with the N–H bending vibration to form a peak at 1560 cm–1, the symmetric stretching vibration of −COO– forms a peak at 1400 cm–1, and the stretching vibration of C–N forms a peak at 1060 cm–1.44
Figure 3.

FTIR analysis of TAIL.
Therefore, the chemical equation that represents the reaction between triethanolamine and acetic acid is as given in Scheme 1. The principle is that the nitrogen atom in triethanolamine and the hydrogen ion in acetic acid form an N–H bond.
Scheme 1. Reaction between Triethanolamine and Acetic Acid.

TAIL/SiO2 with different load ratios were obtained using the immersion evaporation method. The weight loss of TAIL/SiO2 was measured using a synchronous thermal analyzer to obtain the actual loading ratio. In an argon atmosphere, it was heated to 300 °C at a heating rate of 10 °C min–1 (held at 300 °C for 20 min). The actual loading rate was calculated using eq 8, and the thermogravimetric analysis results are listed in Table 2. The difference was within 2%, and the average loading rate was 84.82%.
| 8 |
where Q1 is the quality of the loaded ionic liquids (mg) and Q2 is the quality of the theoretically loaded ionic liquids (mg).
Table 2. TGA Analysis of the Actual Loading Ratio.
| theoretical loading ratio | actual loading ratio | average loading rate (%) |
|---|---|---|
| 1.25:1 | 0.89:1 | 84.6 |
| 1:1 | 0.74:1 | 85.1 |
| 0.75:1 | 0.58:1 | 85.0 |
| 0.5:1 | 0.39:1 | 84.9 |
| 0.25:1 | 0.2:1 | 84.5 |
SEM images of silica gel and TAIL/SiO2 are shown in Figure 4. After ionic liquids are supported on silica gel, TAIL penetrates between the silica gel surface microspheres and multilayer microspheres, changing the spacing between microspheres and causing multiple or multilayer microspheres to stick together to form uneven spherical clusters. Therefore, the TAIL/SiO2 surface was rougher than that of silica gel. With an increase in the loading ratio, more TAIL is supported, the pore size between the microspheres on the silica gel surface decreases, and more of the multilayer microspheres stick together to form larger aggregates.
Figure 4.

SEM images of silica gel and TAIL/SiO2. (a) Macrostructure of silica gel. (b) Apparent morphology of silica gel. (c) TAIL/SiO2 apparent morphology with a loading ratio of 0.4:1. (d) TAIL/SiO2 apparent morphology of loading ratio 0.74:1.
Figure 5 shows the FTIR characterization of silica gel and TAIL/SiO2, that is, the surface functional group structures of silica gel and TAIL/SiO2. The band centered at 3440.39 cm–1 corresponds to the stretching vibration of the Si–OH group in silica.45 At 1105.98 cm–1, the asymmetric stretching vibration of the Si–O–Si bond was observed. Furthermore, 803.21 and 471.5 cm–1 are the stretching vibration and in-plane bending vibration of the Si–O bond, respectively.46
Figure 5.

FTIR characterization of silica gel and TAIL/SiO2. The particle size of TAIL/SiO2 in this figure is 178.7 μm, and the loading ratio is 0.74:1.
When TAIL was immobilized onto silica gel, the functional groups on the silica gel surface changed significantly. The peaks at 3356.02, 3154.01, and 2931.75 cm–1 appear at the wide adsorption band of 3440.39 cm–1. According to the ATR analysis of TAIL, there is a stretching vibration combining the N–H of the amine structure and −OH at 3500–3000 cm–1; therefore, it is speculated that the peak at 3356.02 cm–1 is formed by the combination of silanol groups and amine structures.47,48 The peaks at 2931.75 and 3154.01 cm–1 are attributed to the vibration of −CH2 and −CH3 groups, respectively, in TAIL.49,50 There was a symmetrical stretching vibration of −COO– at 1405.37 cm–1 and a stretching vibration of C–N and Si–O bond at 1107.9 cm–1. The TAIL/SiO2 peaks are slightly shifted, which may be due to the binding of TAIL to the silica surface.
3.2. SO2 Adsorption Characteristics
3.2.1. Effect of Silica Gel Particle Size
TAIL/SiO2 samples with silica particles of the same quality but different particle sizes were selected to conduct adsorption experiments under a loading ratio of 0.74:1, adsorption temperature of 30 °C, and SO2 concentration of 1000 ppm. Figure 6a shows the adsorption characteristic curves of TAIL/SiO2 for SO2 for different particle sizes. Figure 6b presents the sulfur-adsorption capacity of TAIL/SiO2 under the complete range of adsorption conditions.
Figure 6.

(a) SO2 breakthrough curves with different particle sizes of silica. (b) Silica gel carrier sulfur capacity and TAIL/SiO2 sulfur capacity.
As shown in Figure 6, the smaller the particle size of the silica gel used for immobilization, the longer the breakthrough time and the larger the sulfur capacity. For example, TAIL/SiO2 with silica particle size of 125 μm was completely broken through by SO2 at 115.5 min, and the sulfur capacity of TAIL/SiO2 was 124.98 mg/(g TAIL/SiO2). However, TAIL/SiO2 with the silica particle size of 634.6 μm was completely broken through by SO2 at 80.67 min, and the sulfur capacity of TAIL/SiO2 was 62.77 mg/(g TAIL/SiO2). Upon analysis, the ionic liquid was found to be attached to the surface of the microspheres of silica gel and in the pores between the microspheres. For silica gels of the same quality, silica particles with a smaller size have a larger total surface area than those with a larger size. Hence, the same mass of ionic liquid supported on silica gel with a small particle size has a larger area of attachment;45 That is, TAIL/SiO2 with a smaller particle size has a larger adsorption contact area. Therefore, under the condition of the same quality, the smaller the particle size of TAIL/SiO2, the better the adsorption performance for sulfur dioxide and the larger the sulfur capacity. Santiago’s study also showed that the CO2 breakthrough time increased with the decrease of SILP particle size.51
However, adsorption experiments using pure silica gel with different particle sizes showed a complete breakthrough within 9 min, and the sulfur capacity was approximately 10.5 mg g–1 silica gel. The adsorption capacity of pure silica gel did not vary with the particle size. Therefore, the adsorption capacity of TAIL/SiO2 for SO2 mainly depends on TAIL.
The functional groups in the TAIL/SiO2 structure after SO2 adsorption were analyzed using a Fourier transform infrared spectrometer. Figure 7 presents the results. In comparison, results indicate that, after adsorption of SO2, the functional groups of TAIL/SiO2 were almost the same as those of TAIL/SiO2 before adsorption; however, a new peak appeared at 1488.3 cm–1 due to the formation of N–S bonds.29,52
Figure 7.

FTIR characterization of TAIL/SiO2 before and after SO2 adsorption. The particle size of TAIL/SiO2 in this figure is 178.7 μm, and the loading ratio is 0.74:1.
The chemical reaction between hydroxylamine ionic liquid and SO2 is given in Scheme 2 based on the analysis. SO2 reacts with N atoms in TAIL to form N–S bonds. The H atoms of the N–H bonds in TAIL combined with acetate ions to form acetic acid, leading to SO2 adsorption. This is the main reaction governing the chemical adsorption process.
Scheme 2. Main Reaction of the SO2 Adsorption Process by TAIL.

3.2.2. Effect of Temperature on Adsorption Characteristics
The TAIL/SiO2 particles, with a loading ratio of 0.74:1 and a particle size of 178.7 μm, were selected. The reaction temperatures were set to 30, 35, 40, 45, and 50 °C for the TAIL/SiO2 adsorption experiments. Figure 8a shows the breakthrough curve obtained, and Figure 8b presents the calculated complete sulfur-adsorption capacity. As shown in Figure 8, the adsorption capacity of TAIL/SiO2 for SO2 decreases with increasing temperature. At 30 and 50 °C, the complete breakthrough time of SO2 was 99.5 and 69.17 min, respectively, and the sulfur capacity was 113.98 mg/(g TAIL/SiO2) and 70.18 mg/(g TAIL/SiO2), respectively. This is because the adsorption of SO2 by TAIL/SiO2 mainly depends on the chemical reaction between TAIL and SO2. The increase in reaction temperature leads to the breaking of the N–S bond and promotes the reverse reaction. This is consistent with the conclusions of Wan53 and Wang54 studies. Hence, high temperatures negatively affect the bonding between TAIL and SO2.
Figure 8.

(a) SO2 breakthrough curves at different temperatures. (b) TAIL/SiO2 sulfur capacity at different temperatures.
3.2.3. Effect of Loading Ratio on Adsorption Characteristics
TAIL/SiO2 with loading ratios of 0.89:1, 0.74:1, 0.58:1, 0.39:1, and 0.2:1 were selected for the adsorption experiments, with a particle size of 178.7 μm. The concentration of SO2 in the flue gas was 1000 ppm, and the temperature was set to 30 °C. Figure 9 presents the SO2 breakthrough curves and sulfur-adsorption capacities. As shown in the figure, the breakthrough time and sulfur capacity increased with increasing amounts of TAIL supported on SiO2. When the loading ratio is 0.74:1, the time required for SO2 to completely break through TAIL/SiO2 is the longest and the sulfur capacity is 102.77 mg/(g TAIL/SiO2). However, when the loading ratio increased to 0.89:1, the time required for SO2 to break through TAIL/SiO2 and the sulfur capacity were less than those when the loading ratio was 0.74:1. That is, a peak was observed in the sulfur capacity at the optimum loading ratio.
Figure 9.

(a) SO2 breakthrough curves with different loading ratios. (b) TAIL/SiO2 sulfur capacity with different loading ratios.
When the loading ratio was low, the TAIL supported on the silica gel surface did not reach saturation. Under this premise, the more the ionic liquid is supported, the greater the contact area for the reaction with SO2 and the greater the SO2 adsorption capacity. As the loading ratio gradually increased, based on the SEM characterization of TAIL/SiO2, excess ionic liquid blocked the pores between the microspheres on the silica surface. This results in multiple microspheres or even multiple layers of microspheres sticking together to form clusters, leading to a reduction in the adsorption contact area.55,56 In addition, excessive TAIL sticks to the microspheres to form a thick liquid film, thereby increasing the resistance to SO2 diffusion into the silica gel. Thus, the breakthrough time is affected, and the sulfur capacity is reduced.
3.2.4. Effect of Moisture Content on Adsorption Characteristics
TAIL/SiO2 with a particle size of 218.3 μm and a loading ratio of 0.74:1 was used. The SO2 concentration in the flue gas was 1000 ppm, with the temperature set to 30 °C. The adsorption capacity of TAIL/SiO2 for SO2 in flue gas containing 6, 8, 10, and 12% water vapor by volume was determined and was compared without water vapor. Figure 10a shows the influence of water vapor content in the simulated flue gas on the TAIL/SiO2 adsorption of SO2. The sulfur-adsorption capacity of TAIL/SiO2 was calculated based on the breakthrough curves, as shown in Figure 10b.
Figure 10.

(a) SO2 breakthrough curves with different moisture contents. (b) TAIL/SiO2 sulfur capacity with different humidities. (c) Sulfur capacity comparison of TAIL/SiO2 and activated carbons.
As shown in Figure 10, the presence of water vapor had a negative effect on the TAIL/SiO2 adsorption of SO2, and the negative effect increased with an increase in water vapor content. When no water vapor exists in the flue gas, the sulfur capacity reaches the maximum and its value is 100.04 mg/(g TAIL/SiO2). The adsorption sulfur capacity reaches a minimum of 61.24 mg/(g TAIL/SiO2) when the flue gas contained 12% water vapor. The results show that the adsorption capacity of TAIL/SiO2 decreased with increasing water vapor content.
A possible reason for this is that the TAIL in TAIL/SiO2 is hydrophilic, and silica gel, by itself, can easily adsorb moisture. Qi30 and Li55 suggested that the presence of water vapor leads to the degradation of the SO2 adsorption capacity because of the competition between H2O and SO2 in the pore channel. When TAIL/SiO2 contacts flue gas containing water vapor, water molecules are adsorbed and occupy some of the pores in TAIL/SiO2 and the active sites in TAIL, thus reducing the reaction sites of SO2. Therefore, the presence of water vapor in the flue gas can inhibit the removal of SO2 by TAIL/SiO2.
Activated carbon and TAIL/SiO2 with the same particle size and mass were selected for the experiments under the same experimental conditions (i.e., water vapor volume fraction of 6%, SO2 concentration of 1000 ppm, adsorption temperature of 30 °C) for comparison of the SO2 adsorption capacity. The experimental results are shown in Figure 10c. The sulfur capacity of TAIL/SiO2 is 89.36 mg/(g TAIL/SiO2), while that of “Zhuxi” and “Sinopharm” activated carbons is only 30.94 mg/(g AC) and 16.63 mg/(g AC) respectively. Notably, many researchers have tested the adsorption and regeneration performances of activated carbon for SO2.13,57,58
Table 3 shows the SO2 adsorption capacities of the different activated carbons and supported ionic liquids. The results of this study show that the sulfur capacity of TAIL/SiO2 prepared is better than that of activated carbon and some supported ILs.
Table 3. Comparison of Sulfur Capacity of Different Types of SO2 Adsorbents.
| types | SO2 adsorbents | adsorption temperature (°C) | concentration of SO2 (ppm) | gas flow (mL min–1) | sulfur capacity (mg g–1) | refs |
|---|---|---|---|---|---|---|
| activated carbon | PAC | 75 | 1700 | 500 | 82.58 | (57) |
| AC-400/AC-900 | 150 | 2000 | 300 | 30 | (13) | |
| MWY30T | 25 | 700 | 130 | 27.66 | (58) | |
| supported ionic liquid | [EMIM][OAc]-39.7% | 25 | 1395 | 30 | 65.92 | (27) |
| [C2min][Ac] | 25 | 15 | 54.8 | (59) | ||
| C3O1Mim-SiO2-0.1/1 | 25 | 110 | (60) | |||
| TMGL-SiO2-1/1 | 30 | 2160 | 150 | (56) | ||
| TAIL/SiO2 | 30 | 1000 | 1000 | 124 | this work |
3.3. Analysis of Adsorption Kinetics
Three sets of data (i.e., 30, 40, and 50 °C) in Figure 8 were fitted with kinetic models to obtain the fitting curve shown in Figure 11. The parameters obtained by fitting are listed in Tables 4 and 5.
Figure 11.
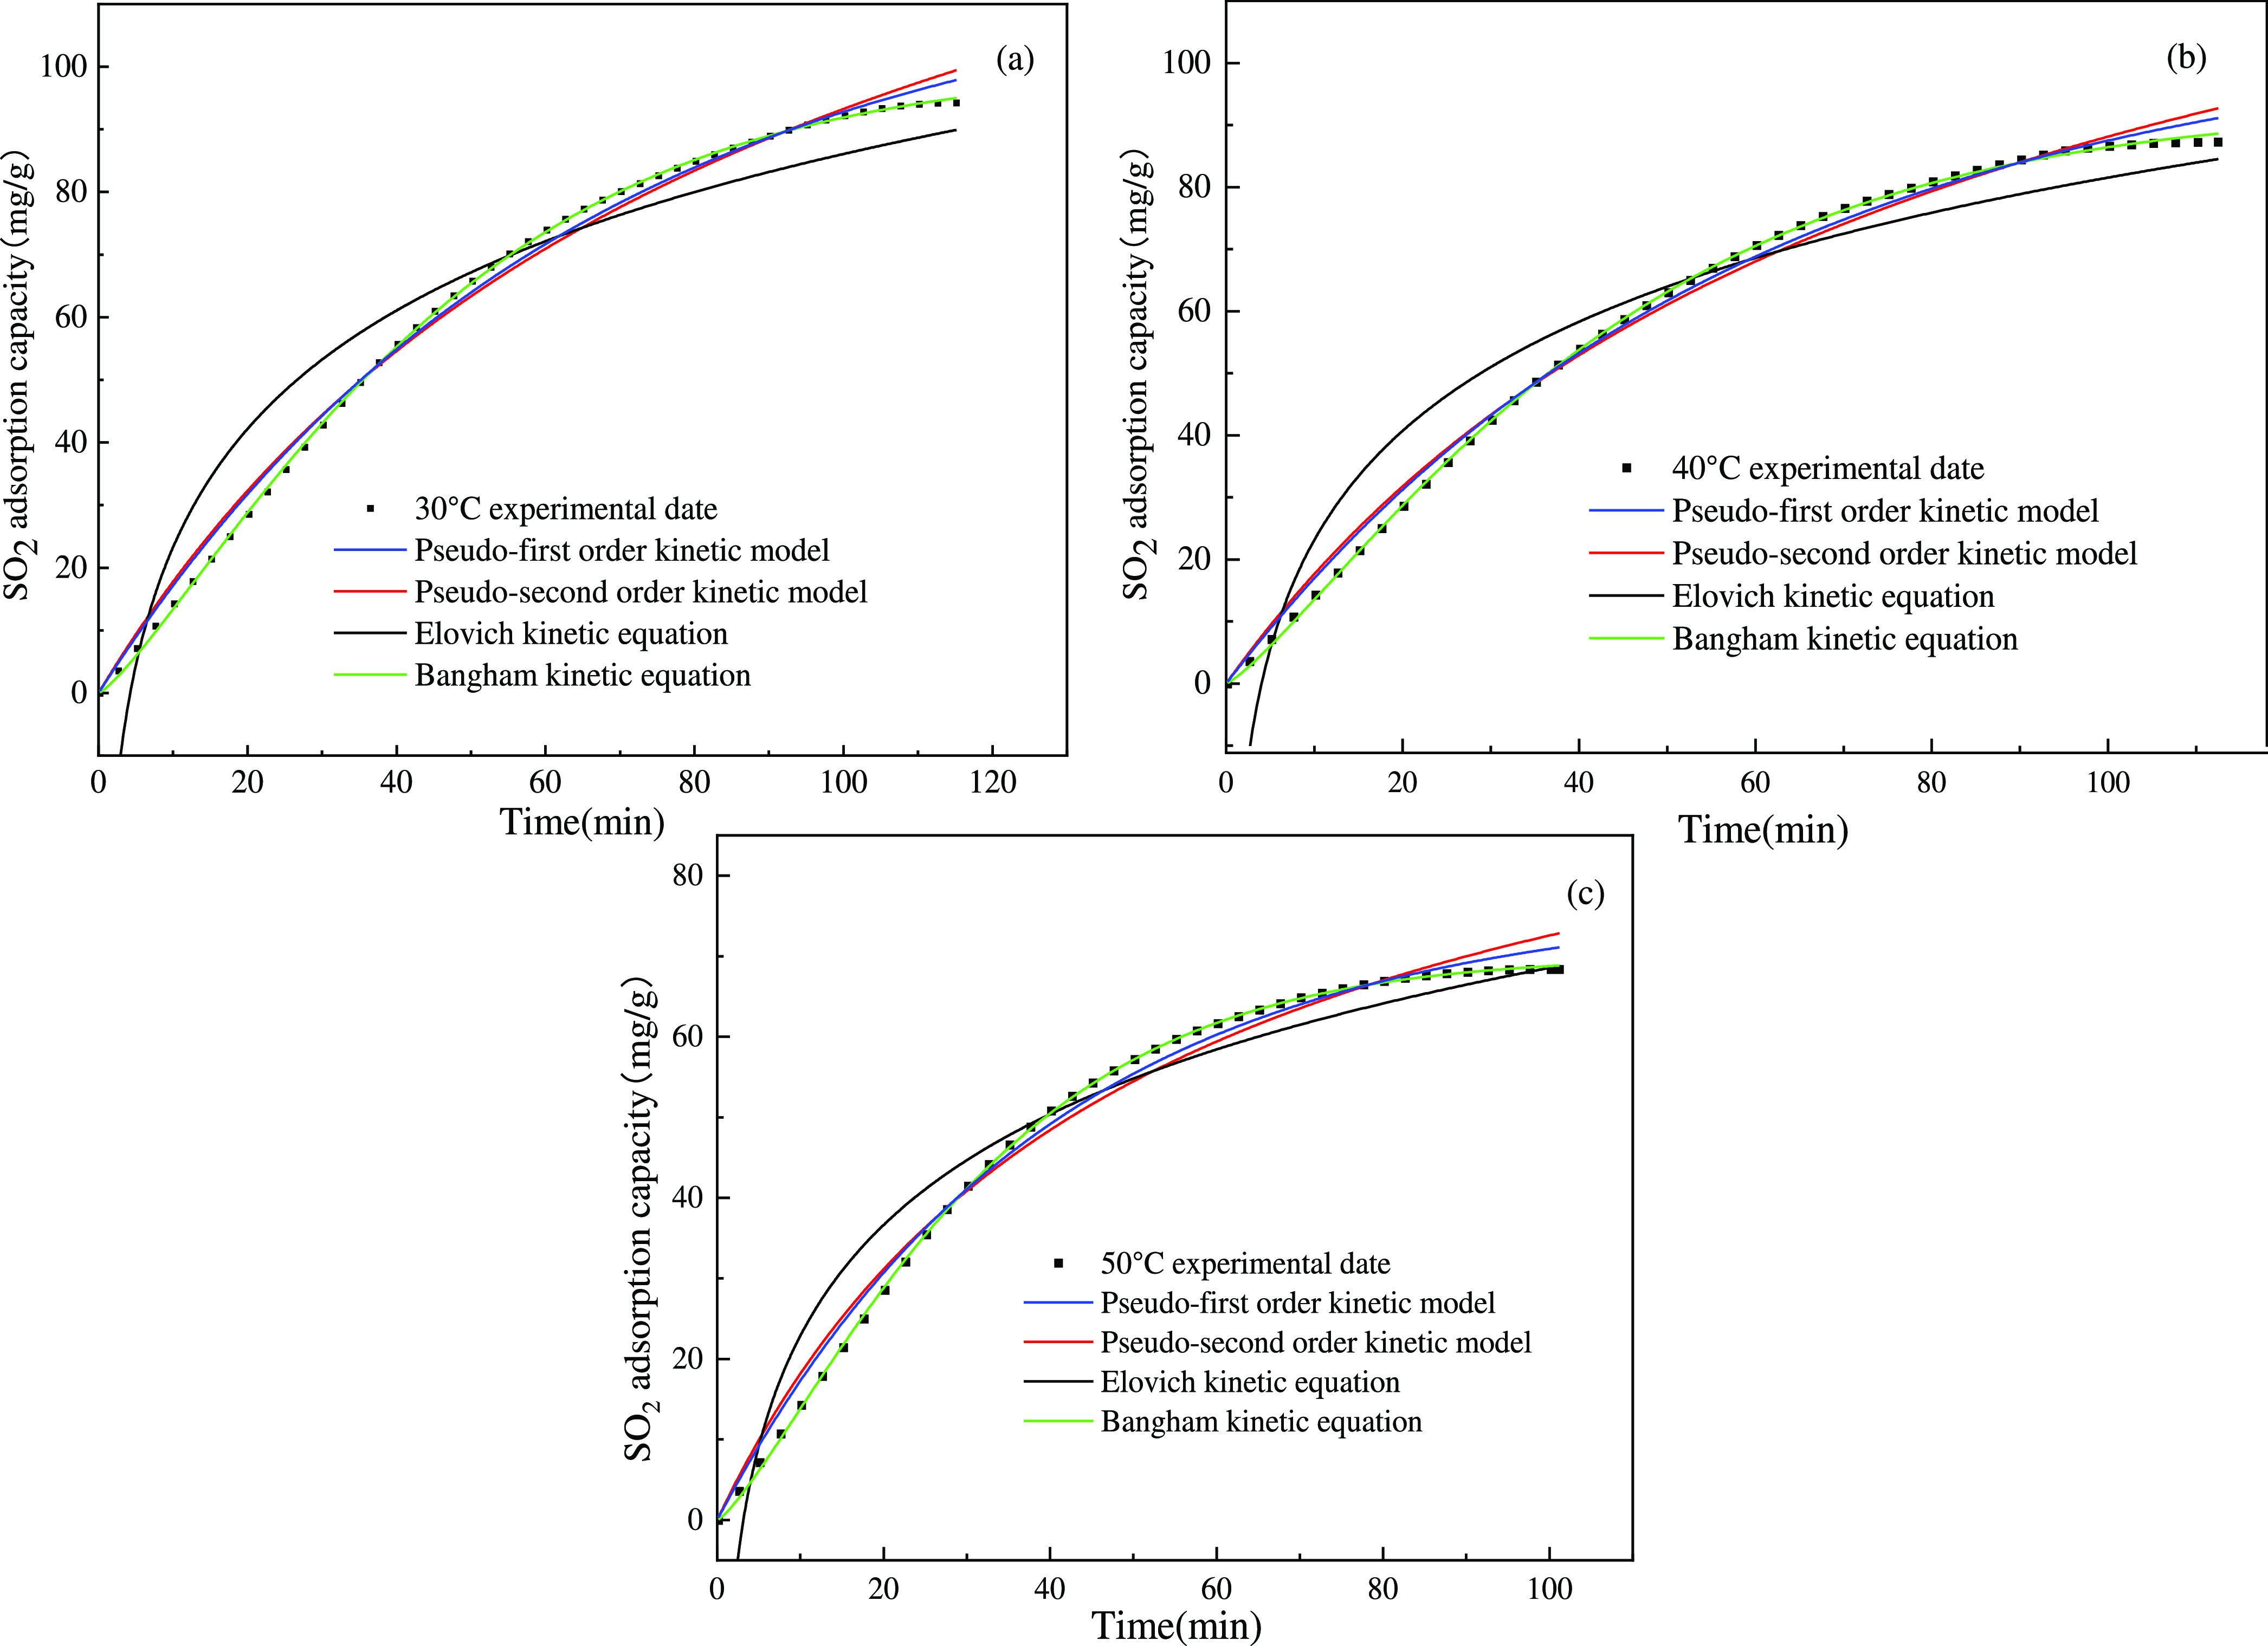
Fitting curves of four kinetic models for SO2 adsorption on TAIL/SiO2 at different temperatures. (a) Fit of four kinetic models with experimental data of 30 °C. (b) Fit of four kinetic models with experimental data of 40 °C. (c) Fit of four kinetic models with experimental data of 50 °C.
Table 4. Fitting Parameters of Kinetic Models for SO2 Adsorption on TAIL/SiO2 at Different Temperatures.
| pseudo-first-order
kinetic model |
pseudo-second-order
kinetic model |
|||||
|---|---|---|---|---|---|---|
| temperature | qe | k1 | R2 | qe | k2 | R2 |
| 30 °C | 266.3 | 0.006 | 0.995 | 4.816 | 0.0007 | 0.994 |
| 40 °C | 106.07 | 0.017 | 0.995 | 3.17 | 0.0039 | 0.992 |
| 50 °C | 76.949 | 0.025 | 0.993 | 2.175 | 0.0092 | 0.986 |
Table 5. Fitting Parameters of Kinetic Models for SO2 Adsorption on TAIL/SiO2 at Different Temperatures.
| Elovich
kinetic model |
Bangham
rate model |
||||||
|---|---|---|---|---|---|---|---|
| temperature | a | b | R2 | qe | k | n | R2 |
| 30 °C | 6.781 | 0.0303 | 0.812 | 147.72 | 0.004 | 1.28 | 0.998 |
| 40 °C | 6.311 | 0.0394 | 0.892 | 92.88 | 0.009 | 1.228 | 0.999 |
| 50 °C | 6.289 | 0.0504 | 0.911 | 69.93 | 0.012 | 0.073 | 0.999 |
As shown in Figure 11, fitting using the Bangham rate model overlapped with the experimental data and the fitting correlation coefficient was as high as 0.999. The pseudo-first and pseudo-second-order kinetic models were not as accurate as the Bangham rate model for fitting the data in the early stages of adsorption. Here, the fitting using Elovich’s dynamic model was the worst. Therefore, the Bangham rate model was chosen as the best model for predicting the dynamics of SO2 adsorption on TAIL/SiO2. The experimental data fitted well with the Bangham model, indicating that the adsorption process was limited by pore diffusion. Wu42 and Ahmed61 arrived at a similar conclusion.
The Bangham rate model was used to fit the dynamics of the adsorption processes obtained from the experiments using other variables. Figure 12a shows the fit of the Bangham rate model to the experimental data using a particle size of 125.4 μm (Figure 6). Figure 12b shows the fit of the Bangham rate model with the experimental data using a loading ratio of 0.74:1 (Figure 9). Figure 12c shows the fit of the Bangham rate model on the experimental data using flue gas without H2O (Figure 10). After fitting, the R2 values of the fitting statistics using the Bangham rate model were 0.998, 0.997, and 0.998, respectively, indicating excellent fitting.
Figure 12.

Fit of the Bangham rate model with data from experiments at different particle sizes, loading ratios, and moisture data. (a) Bangham rate model fit with experimental data of particle size 125.4 μm. (b) Bangham rate model fit with experimental data at loading ratio of 0.74:1. (c) Bangham rate model fit with experimental data using flue gas without H2O.
4. Conclusions
To overcome the negative impact of the high viscosity of ionic liquids on the desulfurization process and to prepare a more economical and efficient ionic liquid, this study used triethanolamine and acetic acid to synthesize TAIL, which is supported on silica gel particles. By changing the reaction temperature, humidity, silica particle size, and loading ratio, the adsorption capacity of the loaded particles for SO2 in flue gas under different experimental conditions is examined in a fixed-bed reactor. The results lead to the following inferences.
When the ionic liquid was supported on silica gel, uneven spherical clusters formed on the surface of the carrier and the aggregate volume increased with an increase in the loading ratio. With an increase in the loading ratio and a decrease in the silica particle size, the breakthrough time of SO2 and sulfur capacity increased. However, the sulfur capacity decreased when the load ratio exceeded 0.74. An increase in flue gas temperature and water vapor content was not conducive to the adsorption of SO2.
The experimental data were fitted by the pseudo-first-order, pseudo-second-order, Elovich, and Bangham rate models. The fitting coefficient R2 of the Bangham adsorption rate model was greater than 0.997 under different working conditions. This indicates an accurate prediction of the adsorption process of SO2.
The maximum sulfur capacity in this study was up to 124.98 mg/(g TAIL/SiO2) under experimental conditions. This proved that the synthesized ionic liquid supported on silica gel could efficiently adsorb SO2. However, further research on desulfurization capacity after regeneration is required to provide better guidance for industrial applications.
Acknowledgments
This project was supported by the National Key R&D Program of China (No. 2017YFB0602902), the Key R&D Program of Shandong Province, China (No. 2020CXGC011402), and Science and technology project of Shandong Electric Power Research Institute, China (No. ZY2020-06).
The authors declare no competing financial interest.
References
- Ren Ya.; Shen G.; Shen H.; Zhong Q.; Xu H.; Meng W.; Zhang W.; Yu X.; Yun X.; Luo Z.; et al. Contributions of biomass burning to global and regional SO2 emissions. Atmos. Res. 2021, 260, 105709 10.1016/j.atmosres.2021.105709. [DOI] [Google Scholar]
- Liu Y.; Shi P.; Jiang M. Hydrothermal recovery and reuse of oxidated by-products in magnesium flue gas desulfurization: Experimental studies and molecular dynamics simulation. J. Environ. Chem. Eng. 2022, 10, 108099 10.1016/j.jece.2022.108099. [DOI] [Google Scholar]
- Zhong Q.; Shen H.; Yun X.; Chen Y.; Ren Ya.; Xu H.; Shen G.; Du W.; Meng J.; Li W.; et al. Global Sulfur Dioxide Emissions and the Driving Forces. Environ. Sci. Technol. 2020, 54, 6508–6517. 10.1021/acs.est.9b07696. [DOI] [PubMed] [Google Scholar]
- Gu S. W.; Yang Z. Z.; Chen Z.; Wang H. M.; Liu H. Z.; Zhang W.; You C. F. Insights into the desulfurization mechanism of low-grade limestone as absorbent induced by particle size. Fuel 2021, 305, 121444 10.1016/j.fuel.2021.121444. [DOI] [Google Scholar]
- Li X. K.; Han J. R.; Liu Y.; Dou Z. H.; Zhang T. A. Summary of research progress on industrial flue gas desulfurization technology. Sep. Purif. Technol. 2022, 281, 119849 10.1016/j.seppur.2021.119849. [DOI] [Google Scholar]
- Chen Z.; Wang H. M.; Zhuo J. K.; You C. F. Experimental and numerical study on effects of deflectors on flow field distribution and desulfurization efficiency in spray towers. Fuel Process. Technol. 2017, 162, 1–12. 10.1016/j.fuproc.2017.03.024. [DOI] [Google Scholar]
- Yang Y. L.; Zheng C. H.; Su Q. F.; Wang Y. F.; Lu Y.; Zhang Y.; Zhu Y. SOx removal and emission characteristics of WFGD system applied in ultra-low emission coal-fired power plants. Case Stud. Therm. Eng. 2021, 28, 101562 10.1016/j.csite.2021.101562. [DOI] [Google Scholar]
- Zhao Z.; Zhang Y.; Gao W.; Baleta J.; Liu C.; Li W.; Weng W.; Dai H.; Zheng C.; Gao X. Simulation of SO2 absorption and performance enhancement of wet flue gas desulfurization system. Process Saf. Environ. Prot. 2021, 150, 453–463. 10.1016/j.psep.2021.04.032. [DOI] [Google Scholar]
- Chang L.; Zhao Y. C.; Zhang Y.; Yu X. H.; Li Z. H.; Gong B. G.; Liu H.; Wei S. Z.; Wu H.; Zhang J. Y. Mercury species and potential leaching in sludge from coal-fired power plants. J. Hazard. Mater. 2021, 403, 123927 10.1016/j.jhazmat.2020.123927. [DOI] [PubMed] [Google Scholar]
- Chen H.; Liu F. J.; Cai C. J.; Zhan L. X.; Gu L. Y.; Feng Q. Y.; Wu H.; Yang L. J. Release and migration characteristics of chlorine during the desulfurization wastewater evaporation process. Fuel Process. Technol. 2021, 218, 106863 10.1016/j.fuproc.2021.106863. [DOI] [Google Scholar]
- Martyniuk H.; Wieckowska J. The effect of coal rank and carbonization temperature on SO2 adsorption properties of coal chars. Fuel 1997, 76, 563–565. 10.1016/s0016-2361(97)00076-8. [DOI] [Google Scholar]
- Li Q.; Hou Y.; Han X.; Wang J.; Liu Y.; Xiang N.; Huang Z. Promotional effect of cyclic desulfurization and regeneration for selective catalytic reduction of NO by NH3 over activated carbon. J. Cleaner Prod. 2020, 249, 119392 10.1016/j.jclepro.2019.119392. [DOI] [Google Scholar]
- Li Y.; Lin Y.; Guo J.; Xu Z.; Wang B.; Zhu T. Carbon consumption and regeneration of oxygen-containing functional groups on activated carbon for flue gas purification. Environ. Sci. Pollut. Res. Int. 2021, 29, 26599–26612. 10.1007/s11356-021-17724-8. [DOI] [PubMed] [Google Scholar]
- Li Y.; Lin Y.; Wang B.; Ding S.; Qi F.; Zhu T. Carbon consumption of activated coke in the thermal regeneration process for flue gas desulfurization and denitrification. J. Cleaner Prod. 2019, 228, 1391–1400. 10.1016/j.jclepro.2019.04.225. [DOI] [Google Scholar]
- Zhu J.; Zhao P.; Yang S.; Chen L.; Zhang Q.; Yan Q. Continuous SO2 absorption and desorption in regenerable flue gas desulfurization with ethylenediamine-phosphoric acid solution: A rate-based dynamic modeling. Fuel 2021, 292, 120263 10.1016/j.fuel.2021.120263. [DOI] [Google Scholar]
- Xiang J.; Zhang Z.; Tian L.; Zhao Q.; Yang H.; Zhang X.; Shao J.; Zhang S.; Chen H. Enhanced Wet Flue Gas Desulfurization Properties by Additives of Organic Acids, Organic Salts, Inorganic Salts, and Organic Amines. Energy Fuels 2020, 34, 14429–14438. 10.1021/acs.energyfuels.0c02658. [DOI] [Google Scholar]
- Yang D. Z.; Cui G.; Lv M. Efficient Absorption of SO2 by [Emim][Cl]-[Emim][SCN] Ionic Liquid Mixtures. Energy Fuels 2018, 32, 10796–10800. 10.1021/acs.energyfuels.8b02488. [DOI] [Google Scholar]
- Aghaei A.; Sobati M. A. Extraction of sulfur compounds from middle distillate fuels using ionic liquids and deep eutectic solvents: A critical review. Fuel 2022, 310, 122279 10.1016/j.fuel.2021.122279. [DOI] [Google Scholar]
- Deyko G. S.; Glukhov L. M.; Kustov L. M. Hydrogen storage in organosilicon ionic liquids. Int. J. Hydrogen Energy 2020, 45, 33807–33817. 10.1016/j.ijhydene.2020.09.107. [DOI] [Google Scholar]
- Sadjadi S. Magnetic (poly) ionic liquids: A promising platform for green chemistry. J. Mol. Liq. 2021, 323, 114994 10.1016/j.molliq.2020.114994. [DOI] [Google Scholar]
- Gong W.-Q.; Wu X.-L.; Li Z.-M.; Zhou Y.; Zhu W.; Tao D.-J. Sulfate ionic liquids impregnated 2D boron nitride nanosheets for trace SO2 capture with high capacity and selectivity. Sep. Purif. Technol. 2021, 270, 118824 10.1016/j.seppur.2021.118824. [DOI] [Google Scholar]
- Li J.; Lei X.-J.; Tang X.-D.; Zhang X.-P.; Wang Z.-Y.; Jiao S. Acid Dicationic Ionic Liquids as Extractants for Extractive Desulfurization. Energy Fuels 2019, 33, 4079–4088. 10.1021/acs.energyfuels.9b00307. [DOI] [Google Scholar]
- Xu Y.; Liu Y.; Bu Y.; Chen M.; Wang L. Review on the ionic liquids affecting the desulfurization of coal by chemical agents. J. Cleaner Prod. 2021, 284, 124788 10.1016/j.jclepro.2020.124788. [DOI] [Google Scholar]
- Jiang L. L.; Mei K.; Chen K. H.; Dao R.; Li H. R.; Wang C. M. Design and prediction for highly efficient SO2 capture from flue gas by imidazolium ionic liquids. Green Energy Environ. 2022, 7, 130–136. 10.1016/j.gee.2020.08.008. [DOI] [Google Scholar]
- Wang L.; Zhang Y.; Liu Y.; Xie H.; Xu Y.; Wei J. SO2 absorption in pure ionic liquids: Solubility and functionalization. J. Hazard. Mater. 2020, 392, 122504 10.1016/j.jhazmat.2020.122504. [DOI] [PubMed] [Google Scholar]
- Severa G.; Head J.; Bethune K.; Higgins S.; Fujise A. Comparative studies of low concentration SO2 and NO2 sorption by activated carbon supported C(2)mim Ac and KOH sorbents. J. Environ. Chem. Eng. 2018, 6, 718–727. 10.1016/j.jece.2017.12.020. [DOI] [Google Scholar]
- Karousos D. S.; Vangeli O. C.; Athanasekou C. P.; Sapalidis A. A.; Kouvelos E. P.; Romanos G. E.; Kanellopoulos N. K. Physically bound and chemically grafted activated carbon supported 1-hexyl-3-methylimidazolium bis(trifluoromethylsulfonyl)imide and 1-ethyl-3-methylimidazolium acetate ionic liquid absorbents for SO2/CO2 gas separation. Chem. Eng. J. 2016, 306, 146–154. 10.1016/j.cej.2016.07.040. [DOI] [Google Scholar]
- Cheng C.; Li J. J.; Cao J. Y.; Guo J. X.; Cen W. L. The absorption of SO2 by morpholine cyclic amines with sulfolane as the solvent for flue gas. J. Hazard. Mater. 2021, 408, 124462 10.1016/j.jhazmat.2020.124462. [DOI] [PubMed] [Google Scholar]
- Yuan X. L.; Zhang S. J.; Lu X. M. Hydroxyl ammonium ionic liquids: Synthesis, properties, and solubility of SO2. J. Chem. Eng. Data 2007, 52, 596–599. 10.1021/je060479w. [DOI] [Google Scholar]
- Qi Y.; Hu X.; Liu Y.; Sun D.; Li R.; Zhu H. Highly efficient and reversible absorption of SO2 by hydroxyl ammonium ionic liquids at low partial pressure. J. Chem. Technol. Biotechnol. 2019, 94, 3325–3332. 10.1002/jctb.6143. [DOI] [Google Scholar]
- Zhai L.; Zhong Q.; He C.; Wang J. Hydroxyl ammonium ionic liquids synthesized by water-bath microwave: Synthesis and desulfurization. J. Hazard. Mater. 2010, 177, 807–813. 10.1016/j.jhazmat.2009.12.105. [DOI] [PubMed] [Google Scholar]
- Qiao K.; Hagiwara H.; Yokoyama C. Acidic ionic liquid modified silica gel as novel solid catalysts for esterification and nitration reactions. J. Mol. Catal. A: Chem. 2006, 246, 65–69. 10.1016/j.molcata.2005.07.031. [DOI] [Google Scholar]
- Shi F.; Zhang Q. H.; Li D. M.; Deng Y. Q. Silica-gel-confined ionic liquids: A new attempt for the development of supported nanoliquid catalysis. Chem. - Eur. J. 2005, 11, 5279–5288. 10.1002/chem.200500107. [DOI] [PubMed] [Google Scholar]
- Ding X.; Li L.; Wang Y.; Chen J.; Huang Y.; Xu K. Design of guanidinium ionic liquid based microwave-assisted extraction for the efficient extraction of Praeruptorin A from Radix peucedani. J. Sep. Sci. 2014, 37, 3539–3547. 10.1002/jssc.201400828. [DOI] [PubMed] [Google Scholar]
- Mehnert C. P.; Cook R. A.; Dispenziere N. C.; Afeworki M. Supported ionic liquid catalysis - A new concept for homogeneous hydroformylation catalysis. J. Am. Chem. Soc. 2002, 124, 12932–12933. 10.1021/ja0279242. [DOI] [PubMed] [Google Scholar]
- Lai W. H.; Wang D. K.; Wey M. Y.; Tseng H. H. Recycling waste plastics as hollow fiber substrates to improve the anti-wettability of supported ionic liquid membranes for CO2 separation. J. Cleaner Prod. 2020, 276, 124194 10.1016/j.jclepro.2020.124194. [DOI] [Google Scholar]
- Jannah Sulaiman N.; Mansor A. F.; Rahman R. A.; Illias R. M.; Shaarani S. M. Adsorption Kinetics of Cellulase and Xylanase Immobilized on Magnetic Mesoporous Silica. Chem. Eng. Technol. 2019, 42, 1825–1833. 10.1002/ceat.201800657. [DOI] [Google Scholar]
- Sun X.; Ma L.; Ye G.; Wu L.; Li J.; Xu H.; Huang G. Phenol adsorption kinetics and isotherms on coal: effect of particle size. Energy Sources, Part A 2021, 43, 461–474. 10.1080/15567036.2019.1628130. [DOI] [Google Scholar]
- Liu X.; Deng X.; Wang G.; Zhu G. Kinetics of n-butane adsorption by activated carbon. J. Funct. Mater. 2012, 43, 476–479. [Google Scholar]
- Wu F.-C.; Tseng R.-L.; Juang R.-S. Characteristics of Elovich equation used for the analysis of adsorption kinetics in dye-chitosan systems. Chem. Eng. J. 2009, 150, 366–373. 10.1016/j.cej.2009.01.014. [DOI] [Google Scholar]
- Jannah Sulaiman N.; Mansor A. F.; Rahman R. A.; Illias R. M.; Shaarani S. M. Adsorption Kinetics of Cellulase and Xylanase Immobilized on Magnetic Mesoporous Silica. Chem. Eng. Technol. 2019, 42, 1825–1833. 10.1002/ceat.201800657. [DOI] [Google Scholar]
- Wu X.; Wang X.; Hu Y.; Chen H.; Liu X.; Dang X. Adsorption mechanism study of multinuclear metal coordination cluster Zn5 for anionic dyes congo red and methyl orange: Experiment and molecular simulation. Appl. Surf. Sci. 2022, 586, 152745 10.1016/j.apsusc.2022.152745. [DOI] [Google Scholar]
- Sun D. S.; Zhang X. D.; Du H.; Fang L.; Jiang P. Application of liquid organic salt to cotton dyeing process with reactive dyes. Fibers Polym. 2017, 18, 1969–1974. 10.1007/s12221-017-1241-3. [DOI] [Google Scholar]
- Wu W. Z.; Han B. X.; Gao H. X.; Liu Z. M.; Jiang T.; Huang J. Desulfurization of flue gas: SO2 absorption by an ionic liquid. Angew. Chem., Int. Ed. 2004, 43, 2415–2417. 10.1002/anie.200353437. [DOI] [PubMed] [Google Scholar]
- Dong L.; Miao G.; Ren X. L.; Liao N.; Anjum A. W.; Li Z.; Xiao J. Desulfurization Kinetics and Regeneration of Silica Gel-Supported TiO2 Extrudates for Reactive Adsorptive Desulfurization of Real Diesel. Ind. Eng. Chem. Res. 2020, 59, 10130–10141. 10.1021/acs.iecr.0c00942. [DOI] [Google Scholar]
- Rodrigues Mota T. L. R.; de Oliveira A. P. M.; Martins Nunes E. H.; Houmard M. Simple process for preparing mesoporous sol-gel silica adsorbents with high water adsorption capacities. Microporous Mesoporous Mater. 2017, 253, 177–182. 10.1016/j.micromeso.2017.07.010. [DOI] [Google Scholar]
- Yu X.; Wu S.; Wang C.; Li Z.; Guan J.; Kan Q. Non-crystalline surface-modified hollow nanospheres of silica (HNS): Synthesis, characterization and catalytic application. J. Non-Cryst. Solids 2012, 358, 47–53. 10.1016/j.jnoncrysol.2011.08.021. [DOI] [Google Scholar]
- Kamisetty N. K.; Pack S. P.; Nonogawa M.; Devarayapalli K. C.; Kodaki T.; Makino K. Additional Alkylsilanization of Aminosilane-modified Glass Slide: Effect of Alkylsilane Structure for Enhancing Surface Amine Functionality. Chem. Lett. 2007, 36, 322–323. 10.1246/cl.2007.322. [DOI] [Google Scholar]
- Chen H.; Dong S.; Zhang Y.; He P. Robust structure regulation of geopolymer as novel efficient amine support to prepare high-efficiency CO2 capture solid sorbent. Chem. Eng. J. 2022, 427, 131577 10.1016/j.cej.2021.131577. [DOI] [Google Scholar]
- Ma M.; Zhang Y.; Yu W.; Shen H.-y.; Zhang H.-q.; Gu N. Preparation and characterization of magnetite nanoparticles coated by amino silane. Colloids Surf., A 2003, 212, 219–226. 10.1016/S0927-7757(02)00305-9. [DOI] [Google Scholar]
- Santiago R.; Lemus J.; Hospital-Benito D.; Moya C.; Bedia J.; Alonso-Morales N.; Rodriguez J. J.; Palomar J. CO2 Capture by Supported Ionic Liquid Phase: Highlighting the Role of the Particle Size. ACS Sustainable Chem. Eng. 2019, 7, 13089–13097. 10.1021/acssuschemeng.9b02277. [DOI] [Google Scholar]
- Liu P.; Cai K.; Zhang X.; Zhao T. Effective absorption of SO2 by imidazole-based protic ionic liquids with multiple active sites: Thermodynamic and mechanical studies. AIChE J. 2022, 68, e17596 10.1002/aic.17596. [DOI] [Google Scholar]
- Wan Z.; Zhang T.; Liu Y.; Liu P.; Zhang J.; Fang L.; Sun D. Enhancement of desulfurization by hydroxyl ammonium ionic liquid supported on active carbon. Environ. Res. 2022, 213, 113637 10.1016/j.envres.2022.113637. [DOI] [PubMed] [Google Scholar]
- Wang C. M.; Zheng J. J.; Cui G. K.; Luo X. Y.; Guo Y.; Li H. R. Highly efficient SO2 capture through tuning the interaction between anion-functionalized ionic liquids and SO2. Chem. Commun. 2013, 49, 1166–1168. 10.1039/c2cc37092a. [DOI] [PubMed] [Google Scholar]
- Li X. S.; Zhang L. Q.; Zheng Y.; Zheng C. G. SO2 Absorption Performance Enhancement by Ionic Liquid Supported on Mesoporous Molecular Sieve. Energy Fuels 2015, 29, 942–953. 10.1021/ef5022285. [DOI] [Google Scholar]
- Zhang Z.; Wu L.; Dong J.; Li B.-G.; Zhu S. Preparation and SO2 Sorption/Desorption Behavior of an Ionic Liquid Supported on Porous Silica Particles. Ind. Eng. Chem. Res. 2009, 48, 2142–2148. 10.1021/ie801165u. [DOI] [Google Scholar]
- Li J.; Zhang L.; Zhao X.; Zhang M.; Feng T.; Zhou B.; Wang T.; Song Z.; Ma C. Insights into the effect of regeneration temperature on physicochemical properties and SO2 removal over powdered activated coke. Fuel 2021, 288, 119715 10.1016/j.fuel.2020.119715. [DOI] [Google Scholar]
- Ma S. C.; Yao J. J.; Gao L.; Ma X. Y.; Zhao Y. Experimental study on removals of SO2 and NOX using adsorption of activated carbon/microwave desorption. J. Air Waste Manage. Assoc. 2012, 62, 1012–1021. 10.1080/10962247.2012.695320. [DOI] [PubMed] [Google Scholar]
- Severa G.; Bethune K.; Rocheleau R.; Higgins S. SO2 sorption by activated carbon supported ionic liquids under simulated atmospheric conditions. Chem. Eng. J. 2015, 265, 249–258. 10.1016/j.cej.2014.12.051. [DOI] [Google Scholar]
- Zhao Y.; Wang J.; Jiang H.; Hu Y. Desulfurization Performance of Ether-Functionalized Imidazolium-Based Ionic Liquids Supported on Porous Silica Gel. Energy Fuels 2015, 29, 1941–1945. 10.1021/ef502682v. [DOI] [Google Scholar]
- Ahmed S. M.; Taha M. R.; Taha O. M. E. Kinetics and isotherms of dichlorodiphenyltrichloroethane (DDT) adsorption using soil–zeolite mixture. Nanotechnol. Environ. Eng. 2017, 3, 4 10.1007/s41204-017-0033-8. [DOI] [Google Scholar]