

Abstract

OH* and CH* chemiluminescence in hydrocarbon flames are often applied to characterize flame structure, equivalence ratio, strain rate, heat release rate, etc. In this study, chemiluminescence images of OH*, CH*, and CO2* in the CH4/O2 diffusion flame were obtained using a CCD camera imaging system. The effect of CO2 dilution on the flame structure, strain rate, and other flame characteristics of CH4/O2 diffusion flame was discussed. The results show that CO2 dilution greatly affects flame morphology and chemiluminescence intensity. There are quantitative functions between the chemiluminescence peak intensity of OH* and CH* and the CO2 dilution level. The CO2* average intensity in the flame zone is better suited to characterize the dilution level than the CO2* peak intensity. Moreover, the strain rate of CO2-diluted laminar flame is defined. It is found that there is a linear relationship between the thickness of the OH* reaction zone and the square root of the strain rate.
1. Introduction
Environment-friendly alternative energy sources such as biogas are gaining widespread attention due to the strict requirements of carbon peaking and carbon neutrality on CO2 emissions and utilization. Biogas, as a clean energy source, is renewable and easily accessible. Moreover, biogas burns well and produces almost no solid particulate matter, which does not pollute the atmosphere. Nowadays, biogas is used for vehicle operation and electricity production in co-generation. Typical raw biogas is composed by CH4 (40–95%) and CO2 (5–55%).1 The contribution of biogas to renewable energy in the EU increased to 25% after 2020.2 Compared to 2012, biogas generation will double in 2022.3 The increase of a large amount of CO2 in the methane can significantly change the flame temperature,4−6 burn intensity,7 soot concentration,6 height,4−6 lift-off height,5 ignition time,6 and laminar flame speeds.8 It is necessary to study the CO2 dilution effect of methane flames to ensure the efficient and safe combustion of alternative fuels such as biogas and biomass synthesis gas.
Traditional flame detection methods such as high-speed camera shooting and thermocouple temperature measurement can only detect the apparent shape and characteristics of the flame. Hydrocarbon combustion diagnostic techniques include planar laser-induced fluorescence (PLIF), tunable laser absorption spectroscopy (TLAS), Fourier transform infrared spectroscopy (FTIR), coherent anti-Stokes Raman spectroscopy (CARS), etc. However, combustion conditions such as those of gasifiers are very severe.9 Due to the high requirements on the environment and the complex equipment of the laser diagnostic technology, the above-mentioned diagnostic technology cannot adapt to the severe combustion conditions. The flame emission spectroscopy contains a lot of flame information. The combustion chamber gas flow temperature was obtained by Mekhrengin et al.10 using C2* emission spectroscopy. The internal structure and composition of the flame can be obtained by the excited radical spontaneous emission diagnosis through the characteristic chemiluminescence distribution of the flame excited radicals, and it performs well under severe combustion conditions, which can avoid interference to the flame to the greatest extent. In addition, this technology does not require an expensive laser generating device, so it is of great concern. The related species of excited radical spontaneous emission diagnosis in hydrocarbon flames mainly involve OH*, CH*, C2*, and CO2*. Ballester et al.11 suggested that the most commonly used excited radical diagnosis method is to establish the relationship between the oxygen/fuel equivalence ratio and the excited radical chemiluminescence intensity at different characteristic wavelengths. The study by Hardalupas and Orain12 on natural gas/air premixed counterflow flames showed that the OH* and CH* chemiluminescence intensities are good indicators of the heat release rate. The study of methane/air counterflow flames by Panoutsos et al.13 showed that the OH* peak intensity is a function of the strain rate, and the location of the maximum heat release rate is indicated by the OH* peak location. Lauer et al.14 reported that in the study of methane/air premixed flame that the OH* intensity distribution is in good agreement with the heat release distribution. Nori and Seitzman15 pointed out that the CH*/OH* chemiluminescence intensity ratio can be used to predict the oxygen/fuel equivalence ratio of methane fuel-lean flames under certain pressure and temperature conditions. The study of laminar CH4/air premixed flames by Guiberti et al.16 showed that OH*/CO2* is well suited for inferring CO2 dilution concentrations.
The flame structure can be characterized by OH* chemiluminescence independently. Marchese et al.17 used the inverse Abel transformation to deconvolve the OH* chemiluminescence distribution. The study demonstrated that the OH* chemiluminescence peak position is close to the position of the highest flame temperature, indicating that the position of the flame front can be characterized by the OH* chemiluminescence distribution. Turner et al.18 utilized OH* chemiluminescence imaging in spherical laminar methane/air flames to characterize flame thickness. Shim et al.19 used OH* chemiluminescence to study the effect of shearing on the structure of the methane/oxygen coaxial jet flame and located the stoichiometric combustion zone in the flame through the peak position of OH* chemiluminescence. Zhu et al.20 found that OH* can characterize the chemical reaction region well. Wang et al.21 observed the double blue reaction zone in the research on methane/oxygen normal and inverse diffusion flames. They explained the cause of the double blue reaction zone and judged the stoichiometric and rich zone by using OH* and CH* chemiluminescence. It confirmed that OH* and CH* can be coupled to characterize different reaction layer structures of flames.
Many of the current studies on excited radical spontaneous emission diagnosis paid particular attention to premixed flames. However, there has been little detailed investigation on the CO2 dilution effect on diffusion flames based on chemiluminescence diagnostic. The complete relation between excited radical spontaneous emission and CO2 dilution effects, especially for fuel dilution, has not been fully established. This study focuses on the characterization of the CH4/O2 diffusion flame structure by OH* based on the co-flow jet diffusion flame experimental platform. Two-dimensional OH* chemiluminescence distribution of the axial profile was obtained by deconvolution of the image using the inverse Abel transformation. The effect of CO2 dilution on the two-dimensional distribution characteristics and peak intensity of OH* and CH* chemiluminescence was explored. The functional equation related to the OH* peak intensity, dilution level, and equivalence ratio was obtained, which can be used for the characterization and prediction of the dilution level. The flame front radius is proposed, and the characterization factor of the flame structure is improved. The quantitative relationship between the radius of the flame front and the CO2 dilution level were established. The differences between CO2* peak intensity and average intensity were compared, and the effects of different CO2* intensities on the CH*/CO2* and OH*/CO2* intensity ratios were further discussed. The laminar flame strain rate was defined, and the quantitative relationship between the strain rate and the thickness of the flame reaction zone was obtained.
2. Experimental Method
The flame chemiluminescence diagnostic platform for co-flow diffusion flame used in the study is shown in Figure 1. The burner was composed of three channels. The inner diameter of the central channel was 3 mm, which was fed into CH4 and CO2. CH4 was premixed with different concentrations of CO2 before ignition. The inner diameter of the inner annular channel was 4 mm, with O2 passing through. Inert gas Ar was passed through the outer annular channel to prevent the air from interfering with the flame. The flow of the four gases was controlled by four mass flow meters (Bronkhorst Company, F-201CB). The experimental system was located in a dark room to reduce the influence of natural light on flame chemiluminescence detection.
Figure 1.

Schematic diagram of the chemiluminescence diagnosis for co-flow diffusion flame.
The OH* and CH* chemiluminescence imaging system consisted of a high-resolution CCD camera (e2v CCD47-10), an ultraviolet lens, and three filters. The camera imaging had a response range of 200–1100 nm. The central wavelengths of the filters were 310 (OH*), 430 (CH*), and 455 nm (background). The transmissivity of filters was 0 outside the band of interest. The full width at half-maximum (FWHM) was 10 nm. After calibration, the pixel size was 0.0584 mm/pixel. The measurement uncertainty of the excited radicals involved in this paper is all within 4.0%.22
The contribution at wavelengths neighboring the main narrow band of CH* emission is the result of CO2* emission without the contribution of other species in hydrocarbon flames.23 An earlier study has used the background emission intensity near the main narrow band of CH* as the reference CO2* intensity.1 Therefore, the background emission intensity at a wavelength of 455 nm was used as the reference CO2* intensity to obtain the results in Section 3.2.
The CO2* emission has a strong influence on the intensity and distribution of the CH* reaction zone.16 The CO2* spontaneous emission intensity is almost constant in the CH* emission wavelength range.14,16 The background emission with a wavelength of 455 nm was subtracted for CH* chemiluminescence in this study.22
The two-dimensional intensity image obtained by the camera is an integral of the emission intensity along the line of sight direction. In order to obtain the actual spatial distribution of flame radical chemiluminescence, numerical inversion of the experimentally obtained images using imaging techniques is required. The Abel deconvolution algorithm is suitable for axisymmetric flames with a circular cross section and light-thin properties. Many researchers have proposed some methods to simplify the calculation. In this paper, the flame was deconvolved using the Abel transformation method proposed by Cho and Na.24 A more detailed description can be found in the study by Cho and Na.24
The O2 flow rate was kept constant. Three groups of flames with different oxygen/fuel equivalence ratios of 1.25, 1.00, and 0.83 were set by changing the CH4 flow rate, corresponding to the fuel-lean, stoichiometric, and fuel-rich conditions, respectively. In each group of conditions, the CH4 flow rate was kept constant, and the CH4/O2 diffusion flames with different dilution levels were obtained by changing the CO2 flow rate. The global range of the mass flow meter is 0–10 L/min. Also, the measurement error is about 1% of the global range. The CO2 flow rate corresponding to dilution level of 0–23.1% is out of the allowable error range. The definition of the oxygen/fuel equivalence ratio λ is shown in eq 1:
| 1 |
Where m is the gas mass, n is the amount of the substance, and the subscript st represents the stoichiometric conditions.
The CO2 dilution level XCO2 is defined as eq 2:
| 2 |
where VCO2 is the volume flow rate of CO2 and VCH4 is the volume flow rate of CH4.
The detailed conditions are shown in Table 1.
Table 1. Experimental Conditions.
| λ | CH4 flow rate (L/min) | O2 flow rate (L/min) | CO2 flow rate (L/min) | XCO2 (%) |
|---|---|---|---|---|
| 0.83 | 0.60 | 1.00 | 0.18–0.84 in 0.06 steps | 23.1–58.3 |
| 1.00 | 0.50 | 1.00 | 0.15–0.70 in 0.05 steps | 23.1–58.3 |
| 1.25 | 0.40 | 1.00 | 0.12–0.56 in 0.04 steps | 23.1–58.3 |
3. Results and Discussion
3.1. Two-Dimensional Distribution of OH* Reaction Zone
3.1.1. Axial Disconnection
Figure 2 shows the changes in the two-dimensional images of the OH* reaction zone as the CO2 dilution level increases. The images were acquired with a CCD camera equipped with a filter with a central wavelength of 310 nm. The images have been Abel transformed, and the white numbers in the upper left corner indicate the dilution level. Following the addition of CO2, the flame reaction zone becomes longer and the position of the flame core reaction zone changes. The study of Oh and Noh25 on a methane/oxygen non-premixed jet flame indicated that for free flames, the flame length increased with fuel flow rate, which was caused by an increase in the residence time for complete combustion of the fuel. It is worth noting that the discussion of flame length and flow rate applies only to free flames, not confined flames. The flame length of CO2-diluted flame is mainly affected by two factors. The first influencing factor is the reaction rate. Most of the CO2-diluted fuel studies attributed the increase in flame length to the decrease in the reaction rate.5,6,26 The addition of diluent reduces the fuel concentration and the flame temperature, resulting in the reduction in the reaction rate. Compared with inert gases such as N2, CO2 will not only dilute the fuel but also further participate in and hinder the decomposition reaction of CH4 and O2,26,27 so that the flame length of CO2-diluted flame is longer than that of N2-diluted flame. The second influencing factor may be the oxygen to fuel momentum ratio.28 The study found a quantitative relationship between flame length and the momentum ratio. The increase in the CO2 flow rate causes the overall flow velocity of the fuel to increase, and the fuel residence time is shortened. Part of the fuel is carried downstream of the flame before the complete reaction. The flame reaction position changes. Second, Liu et al.29 compared the CO2 and N2 dilution flames and believed that the increase in flame length was caused by the increase in momentum. Furthermore, CO2-diluted CH4/air diffusion flames were simulated based on the detailed chemical reaction mechanism of GRI-Mech 3.0.27 The study showed that CO2 was not inert, and CO2 participated in the following reactions:
| R1 |
| R2 |
| R3 |
Figure 2.
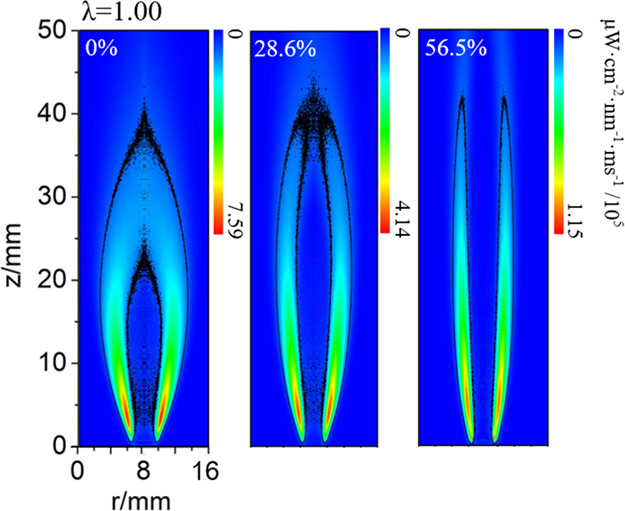
Chemiluminescence distribution of OH* reaction zone at different dilution levels.
Reaction R2 has been identified as the main reaction of the CO2 chemical effect. It has shown that CO2 effectively reduces the mole fraction of H, O, and OH radicals through reactions R1–R3. The reduction in the mole fraction of H, O, and OH radicals inhibited the chain initiation and chain propagation reactions of CH4 decomposition by participating in the following reactions:
| R4 |
| R5 |
| R6 |
The reaction rate of CH4 decomposition slowed down, causing more CH4 to be carried by the gas stream to the downstream of the flame and elongated the flame reaction zone.
OH* can be used to characterize flame boundaries. Siebers and Higgins30 suggested that the flame boundary be located at 8% of the OH* peak intensity. After inspection, when the intensity is lower than 10% of the OH* peak intensity, the change of the OH* distribution zone is not obvious; the top boundary is gradually broken, and the obvious closed boundary is not formed. Therefore, 10% of the OH* peak intensity is used as the flame boundary in this study.
OH* distribution is disconnected from the axis when the dilution level reaches a certain threshold, as shown in Figure 2. Bouvet et al.31 observed the OH* tip opening of laminar H2/CO premixed flames, and the tip opening was accompanied by a significant reduction in the flame height. For fuel-lean flames, the corresponding threshold level is 52.4%. When the flames are stoichiometric, OH* is disconnected after the dilution level is 28.6%, and the corresponding dilution level decreases. For fuel-rich flames, the OH* distribution under the undiluted condition is the disconnected state. The OH* distribution remains in this state after the addition of the diluent. The higher the oxygen/fuel equivalence ratio, the higher the corresponding threshold dilution level. The axial distribution of OH* can characterize the flame combustion conditions.32
3.1.2. OH* Reaction Zone Partition
Zheng and Bai33 used different intensities as boundaries to distinguish the central and diffusion zones of the OH* reaction zone. They compared the simulation and experimental results based on this. It was shown that the excited reactions are the main causes of the central zone and the de-excited reactions are the main causes of the diffusion zone. In this study, OH* reaction zones with different OH* chemiluminescence intensities are shown in Figure 3. The boundaries of the five reaction zones were determined by setting different threshold intensities. The threshold intensities were chosen to be 80, 60, 40, 20, and 10% of the OH* peak chemiluminescence intensity, respectively. The same division was carried out when the oxygen/fuel equivalence ratio is 0.83 and 1.00. In this study, the zone where the chemiluminescence intensity is above 80% of the OH* peak intensity is defined as the core reaction region of OH*. As the dilution level increases, the core reaction zone is elongated. An increase in the dilution level has less effect on the curvature of the inner reaction zone, including the core reaction zone, and a greater effect on the curvature of the outer reaction zone.
Figure 3.

Division of different OH* chemiluminescence intensities as boundaries (λ = 1.25, the dilution levels are 0, 28.6, and 54.5%, respectively).
The OH* reaction zone was divided into five zones. The total area of OH * reaction zone was defined as the OH * chemiluminescence intensity above 10% of the OH * peak intensity. The area of the above five zones and their percentage of the total area were obtained, as shown in Figure 4. The number of pixels in each zone was counted, and the area of each zone was obtained by multiplying the number of pixels by the area of a single pixel. The area of the reaction zone with the OH* chemiluminescence intensity between 10 and 20% is the largest. The closer to the inside of the flame, the smaller the area of the reaction zone. The core reaction zone is the smallest. The total area of the OH* reaction zone decreased with increasing dilution levels. When the oxygen/fuel equivalence ratio is 0.83 and 1.00, the area percentage of the other four zones slightly increases with the dilution level, except for the area percentage of the 10–20% zone. It is revealed that for fuel-rich and stoichiometric flames, CO2 has a greater effect on the low OH* chemiluminescence intensity zone. The reduction in the area downstream of the flame decreases the overall reaction zone area, which indicates that under these two conditions, OH* is more generated upstream. This is related to the appearance of a second core reaction zone near the burner.22 Different from when the oxygen/fuel equivalence ratio is 0.83 and 1.00, when the oxygen/fuel equivalence ratio is 1.25, the area percentage of the 20–40% zone decreases with the dilution level, while the area percentage of the 10–20% zone first increases and then decreases. It is shown that for fuel-lean flames, the core reaction zone near the burner is more reactive and the area downstream of the flame is smaller.
Figure 4.

Changes of area and proportion of OH* reaction zone at different dilution levels (a) λ = 1.25, (b) λ = 1.00, (c) λ = 0.83.
3.1.3. Flame Front Radius
Through further research on the two-dimensional distribution of OH*, it is found that the flame front can be well fitted as a circular arc, as shown in Figure 5. The radius of the fitting circle of the flame front can quantitatively characterize the degree of flame bending. The smaller the flame front radius, the more curved the flame. The relationship between the flame front radius and the dilution level can be obtained by functional fitting of the flame front radius and the dilution level.
Figure 5.
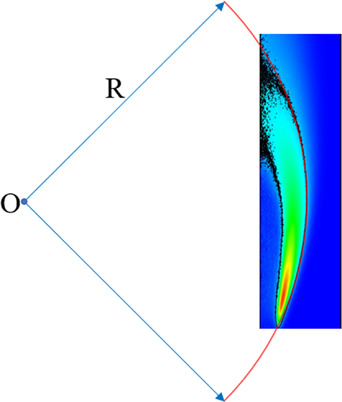
Schematic diagram of the fitting circle of the flame front.
The relationship between the flame front radius and the dilution level with different oxygen/fuel equivalence ratios was obtained by the method mentioned above, as shown in Figure 6.
Figure 6.

Flame front radius as a function of the dilution level for different oxygen/fuel equivalence ratios.
R is the flame front radius; XCO2 is the CO2 dilution level. The minimum correlation coefficient R2 of the fitting results is 0.956.
The flame front radius can be quantitatively characterized by an equation related to the oxygen/fuel equivalence ratio and dilution level, as shown in eq 3:
| 3 |
where R is the flame front radius, XCO2 is the CO2 dilution level, and λ is the oxygen/fuel equivalence ratio. The flame front radius predicted using the above equation is within 10% error. The above equation can be used to predict the flame front radius when the oxygen/fuel equivalence ratio and dilution level are known.
The flame front radius and gradient increase with the dilution level. The fitted curve for an oxygen/fuel equivalence ratio of 0.83 shows an almost horizontal straight line corresponding to a dilution level range of 42.7 to 53.7%. Within these dilution levels, the flame front radius remains almost unchanged. The curve then accelerates upward. It reveals that the OH* reaction zone is disconnected on the axis. The flame front radius decreases as the oxygen/fuel equivalence ratio increases. At the same dilution level, a lower oxygen/fuel equivalence ratio means an increase in CH4 flow. The overall gas flow rate of the fuel increases, and the radius increases. Similarly, for the same oxygen/fuel equivalence ratio, an increase in the overall gas flow rate of the fuel results in an increase in the flame front radius. These results suggest that the flame front radius is positively correlated with the fuel flow rate.
3.2. Chemiluminescence Intensity
3.2.1. OH* and CH* Peak Intensity
Figure 7 shows the variation of the OH* and CH* peak intensity with the dilution levels. The results were normalized by the values of undiluted flames. The OH* peak intensity is inversely proportional to the dilution level. The rate of decline slows down at the dilution level up to 55.0%. The OH* peak intensity at a dilution level of 58.3% is approximately 85.5% lower than that of the undiluted flame. The reason for the slower decline of the OH* peak intensity with the dilution level is the appearance of the second core reaction zone.22 A possible explanation for the second core reaction zone is that the fluid will generate a radial flow field near the burner, spreading from the annular channel to the central channel. The increase in gas velocity of the CH4/CO2 mixture in the central channel will increase its entrainment capacity. Thereby, the radial diffusion of the oxidant in the annular channel is accelerated. The mixing of the reactants is enhanced, which promotes the formation of OH* near the burner.
Figure 7.

OH* and CH* peak intensity as a function of the dilution level. Results are normalized with the respective result for the flame without CO2 dilution.
In hydrocarbon flames, OH* is produced by two main reactions:34,35
| R7 |
| R8 |
As mentioned earlier, the decomposition of CH4 is slowed down by the addition of CO2. Therefore, the precursors CH and H of OH* are reduced, causing a decrease in the intensity of OH*. Furthermore, the increase of diluent content may inhibit the decomposition of oxygen molecules into atomic oxygen, and the reduction of R8 reactants results in the transition of OH* generation reaction from R7 to R8.
The oxygen/fuel equivalence ratio has little effect on the OH* peak intensity of the flame. The normalized OH* peak intensity can be quantitatively characterized by the equation shown in the left panel of Figure 7.
The error in the OH* peak intensity predicted using the above equation is within 5% for the dilution level (less than 52.4%). The above equation can be used to predict the normalized OH* peak intensity with a dilution level.
CH* chemiluminescence was acquired by a CCD camera equipped with filters of 430 and 455 nm. The chemiluminescence signal obtained by the 455 nm filter was used as background to obtain the CH* chemiluminescence with background luminescence subtracted. The normalized CH* peak intensity was fitted, as shown in the right panel of Figure 7. The minimum correlation coefficient R2 is 0.988. The CH* peak intensity at a dilution level of 58.3% is decreased by about 66.0% compared to the undiluted flame. The CH* peak intensity with an oxygen/fuel equivalence ratio of 0.83 decreases the fastest with the dilution level, indicating that CO2 has the greatest effect on CH* production for fuel-rich flames. The results show that the CH* chemiluminescence intensity is the lowest for stoichiometric flames. Both the addition of oxygen and fuel enhances the CH* chemiluminescence.
CH* is formed through two main reactions34 for hydrocarbon flames:
| R9 |
| R10 |
The CO2 concentration increases with the dilution level, and therefore, the CH* produced by reaction R10 decreases. CH* is mainly distributed near the burner outlet, and the CH* precursor C2H first reacts with O2. The CH* peak intensity of the fuel-lean flame is greater than that of the fuel-rich flame for most dilution levels. Because of the relatively high content of O2, the effect of CO2 dilution on R10 is weakened. In addition, the relatively rich O2 in the core reaction zone that is not fully reacted will become atomic O for fuel-lean flames. It can further be brought downstream of the flame and contribute to reaction R9. This is the reason for the long tail in the CH* reaction zone. Therefore, CH* near the CH* peak is mainly generated by reaction R10, and downstream CH* is mainly generated by reaction R9.
This study was carried out at atmospheric pressure, and the effect of pressure was not considered. However, the effect of pressure on the radical chemiluminescence intensity has been deeply explored.36,37 Higgins et al.37 investigated the effect of pressure on the intensity of OH* and CH* and showed that increasing pressure decreased the intensity of OH* and CH*, but the pressure did not change the relationship between OH* and CH* and the equivalence ratio. To obtain a quantitative relationship between the radical chemiluminescence intensity and dilution level at different pressures, a pressure-dependent correction factor needs to be added. However, this is not the focus of this study.
3.2.2. CO2* Peak Intensity and Average Intensity
Since CO2* is widely distributed in the flame area and there is no prominent peak region, it is possible that the CO2* peak intensity does not accurately reflect the characteristics of CO2* in the flame. The CO2* intensity was averaged over the entire flame zone, and the results are shown in Figure 8.
Figure 8.

CO2* peak and average intensity as a function of the dilution level. Results are normalized with the respective result for the flame with XCO2 = 0%.
The peak intensity of CO2* is greatly reduced after the addition of CO2. A sudden drop in the CO2* peak occurs, which affects the peak ratios such as CH*/CO2* and OH*/CO2*. Continuing to increase the CO2 dilution level, the CO2* peak intensity decreases slowly. Compared to the CO2* peak intensity, the CO2* average intensity does not drop sharply. The CO2* average intensity decreases regularly with the dilution level. The CO2* average intensity is more sensitive to the oxygen/fuel equivalence ratio and dilution level. CO2* is mainly produced by the reaction:23
| R11 |
As can be expected by the analysis of reactions R2, R7, and R9, the reaction R11 reactant CO decreases, leading to a decrease in CO2* production. In addition, as mentioned earlier, CO2 inhibits the decomposition reaction of O2, and reactant atomic O decreases, resulting in a decrease in CO2*.
The results of Guiberti et al.16 on premixed flame chemiluminescence showed that OH*, CH*, and CO2* decreased linearly with the increasing CO2 dilution level, which is consistent with the conclusions of the diffusion flame in this study. The premixed flame can be considered as the basis and premise of the diffusion flame. Due to the simple structure of the premixed flame, there is no need to consider the diffusion and transfer between the fuel and the oxidant. Many flame image processing techniques, such as Able transformation and background emission subtraction, are first applied to premixed flames and then applied to diffusion flames after achieving good results. In addition, experimental results of the premixed flame can be used as a comparison or reference for the diffusion flame.
3.2.3. CH*/OH*, CH*/CO2*, and OH*/CO2* Intensity Ratios
The relationship between the CH*/OH* peak intensity ratio and dilution level with different equivalence ratios is shown in Figure 9. The CH*/OH* peak intensity ratio increases, and the gradient increases with dilution levels for flames with dilution levels below 56%. The CH*/OH* peak intensity ratios all reached a maximum at a dilution level of about 56%. At the same dilution level, the CH*/OH* peak intensity ratio is the lowest for stoichiometric flames.
Figure 9.
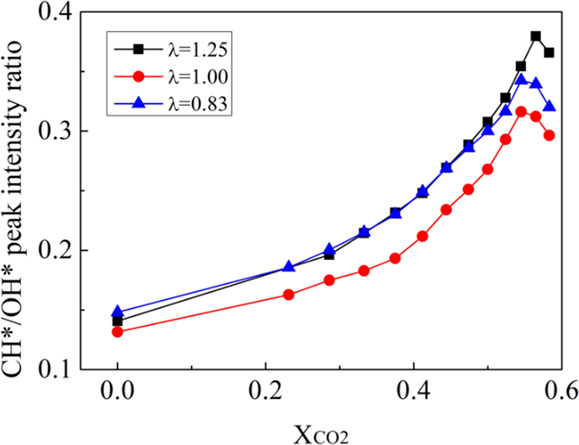
CH*/OH* peak intensity ratio as a function of the dilution level.
The experimental results show that the peak intensity of OH* decreases with the increasing dilution level at a higher rate than that of CH*. The simulation results of methane/air premixed flames by Nori and Seitzman15 revealed that OH* precursors (such as CH) are more sensitive to temperature than CH* precursors (such as C2H). Due to the high heat capacity of CO2 and the dilution effect, increasing the CO2 dilution level reduces the flame temperature.5 The decrease in temperature more significantly affected the OH* formation reaction.
Different CO2* characteristic intensities affect CH*/CO2* and OH*/CO2*. Figure 10 shows the difference in the CH*/CO2* intensity ratio when CO2* intensity is taken as peak intensity and average intensity. CH*/CO2,p*, which represents the ratio of CH* peak intensity to CO2* peak intensity, is not a monotonic function of the dilution level. Therefore, CH*/CO2,p*does not predict the dilution level. However, CH*/CO2,a*, which represents the ratio of CH* peak intensity to CO2* average intensity, shows good monotonicity with the dilution level. The intensity ratio is almost linear with the dilution level. The CH*/CO2,a* intensity ratio is more sensitive to the dilution level at an oxygen/fuel equivalence ratio of 0.83. CH*/CO2,a* can be used to characterize the dilution level.
Figure 10.

CH*/CO2* intensity ratio as a function of the dilution level. CO2* intensity was taken as the peak intensity (left) and the average intensity within the flame zone (right).
Figure 11 shows the difference in the OH*/CO2* intensity ratio when CO2* intensity is taken as peak intensity and average intensity. Averaging CO2* intensity does not change the nonmonotonic relationship of OH*/CO2* to the dilution level. The OH*/CO2* are not suitable for characterizing dilution levels. However, the sensitivity of CH*/CO2,a* to the oxygen/fuel equivalence ratio is significantly greater than that of CH*/CO2,p*. This shows that CH*/CO2,a* has the potential to characterize the oxygen/fuel equivalence ratio.
Figure 11.

OH*/CO2* intensity ratio as a function of the dilution level. CO2* intensity was taken as the peak intensity (left) and the average intensity within the flame zone (right).
3.3. Effect of Strain Rate
The characteristic value of strain rate in the flame can characterize the overall mixing rate,38 expressed as the reciprocal of the overall residence time 1/τG. Qamar et al.39 pointed out that the overall mixing rate is the reciprocal of the total residence time τG, which is calculated as the fuel volume flow rate Vf divided by the flame volume. Newbold et al.40 studied the residence time τG of fuel gas in an unconfined diffusion flame and found that it is proportional to the ratio of fuel volume flow to flame volume, as shown in eq 4:
| 4 |
where LFlame is the flame height, WFlame is the flame width, uf is the fuel flow rate, and df is the burner diameter.
The reciprocal of the total residence time (1/τG) was calculated to obtain the strain rate. In this study, the total volume flow divided by the flame volume was used to calculate the characteristic strain rate of the flame, as shown in eq 5:
| 5 |
where V is the volume flow corresponding to different gases. L is the flame height, and W is the half-width of the flame, which can be determined according the location of the boundary pixel. τG is the total residence time of the gas. a is the flame strain rate. A schematic diagram of flame height and half-width is shown in Figure 12.
Figure 12.

Schematic diagram of flame length L, half-width W, and OH* reaction zone thickness δ.
The relationship between the chemiluminescence intensity and strain rate is shown in Figure 13. Different from the relationship between the intensity of OH* and CH* and the dilution level, the OH* and CH* intensity first decrease with the increase of the strain rate, and the decreasing speed becomes slower. The CH*/OH* peak intensity ratios increase with the strain rate and then decrease with a low rate.
Figure 13.

Chemiluminescence intensity of λ = 1.25 as a function of strain rate. The strain rate was calculated from eq 5.
Increasing CO2 flow has little effect on flame volume at lower dilution levels. The main reason for the increase in the strain rate is the increase in CO2 flow. When the dilution level is high, the strain rate difference between adjacent operating points becomes high. At this time, the increase of CO2 flow causes the flame volume to decrease rapidly, and the combined action of the decrease of flame volume and the increase of CO2 flow causes the strain rate to increase rapidly.
In this study, the thickness of the OH* reaction zone at 20 mm in the axial direction is used as the research object because the thickness of the reaction zone at 20 mm is the thickest and the most representative among all the flame conditions. A schematic diagram of the flame thickness is shown in Figure 12. The quantitative relationship between the thickness of the OH* reaction zone and the square root of the strain rate is shown in Figure 14.
Figure 14.

Thickness of the OH* reaction zone as a function of the square root of the strain rate. The flame thickness was obtained by measuring the radial thickness of the OH* reaction zone at 20 mm in the axial direction.
The thickness of the OH* reaction zone varies linearly with the square root of the strain rate. This is consistent with previous studies.41 The quantitative relationship can be obtained. For instance, when λ = 0.83, the linear relationship can be fitted by eq 6:
| 6 |
where δ is the thickness of the OH* reaction zone and a is the strain rate.
The thickness of the OH* reaction zone with an oxygen/fuel equivalence ratio of 1.25 is not completely linear with the square root of the strain rate. The front section of the curve is almost straight, and it turns when the square root of the strain rate reaches 3.57 s–1/2, which quickly approaches the level. A linear fit was performed on the curve before the square root of the strain rate was 3.57 s–1/2.
The minimum correlation coefficient R2 for the linear fit is 0.972. It can be seen from the fitting results that the thickness of the OH* reaction zone is inversely proportional to the square root of the strain rate. The increase in the strain rate means that the overall residence time of the gas is shortened and the OH* formation reaction occurs further downstream of the flame. The OH* reaction zone is elongated in the axial direction, so the radial thickness of the OH* reaction zone is reduced. In addition, the radial diffusion between CH4 and O2 is weakened by the increase in fuel flow rate, which also reduces the thickness of the OH* reaction zone.
A study by Kojima et al.42 on methane/air premixed flames showed that the OH* reaction zone is wider for fuel-rich flames and thinner for fuel-lean flames. However, it indicates that at low strain rates (low dilution levels), the OH* reaction zone is thinner for fuel-rich flames and wider for fuel-lean flames for this study. The thickness of the OH* reaction zone of fuel-lean flames decreases faster with the increase of the strain rate. After the strain rate increases to a certain value, the OH* reaction zone is the widest for fuel-rich flames and the thinnest for fuel-lean flames. The results show that CO2 dilution more significantly affects the strain rate and flame structure of fuel-lean flames.
4. Conclusions
The effect of CO2 dilution on CH4/O2 laminar diffusion flame was studied based on OH*, CH*, and CO2* chemiluminescence. The strain rate of CO2-diluted laminar flame is further defined, and the effect of strain rate on flame characteristics is discussed. The results are as follows:
-
(1)
The OH* reaction zone is disconnected from the axis when a certain threshold dilution level is reached, and the combustion conditions can be judged according to it. The radius of the flame front characterized by OH* is positively correlated with the overall fuel flow.
-
(2)
There are quantitative functions between the CH* and OH* peak intensity and the dilution level of CO2. OH* is more sensitive to temperature than CH*. The CO2* average intensity in the flame zone is better suited to characterize the dilution level than the CO2* peak intensity. CH*/CO2* can characterize the dilution level.
-
(3)
The increase of the CO2 dilution has a greater effect on the flame volume and strain rate when the dilution level is higher. The thickness of the OH* reaction zone is inversely proportional to the square root of the strain rate. The CO2 dilution more significantly affects the strain rate and flame structure for fuel-lean flames.
Acknowledgments
This work has been supported by the Project of Key Research Plan of Ningxia (2019BCH01001) and National Natural Science Foundation of China (U21A20318, 22178112).
The authors declare no competing financial interest.
References
- Quintino F. M.; Trindade T. P.; Fernandes E. C. Biogas combustion: Chemiluminescence fingerprint. Fuel 2018, 231, 328–340. 10.1016/j.fuel.2018.05.086. [DOI] [Google Scholar]
- Miltner M.; Makaruk A.; Harasek M. Review on available biogas upgrading technologies and innovations towards advanced solutions. J. Cleaner Prod. 2017, 161, 1329–1337. 10.1016/j.jclepro.2017.06.045. [DOI] [Google Scholar]
- Sun Q.; Li H.; Yan J.; Liu L.; Yu Z.; Yu X. Selection of appropriate biogas upgrading technology-a review of biogas cleaning, upgrading and utilisation. Renewable Sustainable Energy Rev. 2015, 51, 521–532. 10.1016/j.rser.2015.06.029. [DOI] [Google Scholar]
- Biswas D.; Mukhopadhyay A. Effect of CO2 and O2 enhancement and gravity variations on normal and inverse laminar diffusion flames. Mater. Today: Proc. 2016, 3, 3318–3327. 10.1016/j.matpr.2016.10.013. [DOI] [Google Scholar]
- Erete J. I.; Hughes K. J.; Ma L.; Fairweather M.; Pourkashanian M.; Williams A. Effect of CO2 dilution on the structure and emissions from turbulent, non-premixed methane–air jet flames. J. Energy Inst. 2017, 90, 191–200. 10.1016/j.joei.2016.02.004. [DOI] [Google Scholar]
- Mortazavi H.; Wang Y.; Ma Z.; Zhang Y. The investigation of CO2 effect on the characteristics of a methane diffusion flame. Exp. Therm. Fluid Sci. 2018, 92, 97–102. 10.1016/j.expthermflusci.2017.11.005. [DOI] [Google Scholar]
- Han D.; Satija A.; Gore J. P.; Lucht R. P. Experimental study of CO2 diluted, piloted, turbulent CH4/air premixed flames using high-repetition-rate OH PLIF. Combust. Flame 2018, 193, 145–156. 10.1016/j.combustflame.2018.03.012. [DOI] [Google Scholar]
- Hu X.; Bai F.; Yu C.; Yan F. Experimental Study of the Laminar Flame Speeds of the CH4/H2/CO/CO2/N2 Mixture and Kinetic Simulation in Oxygen-Enriched Air Condition. ACS Omega 2020, 5, 33372–33379. 10.1021/acsomega.0c05212. [DOI] [PMC free article] [PubMed] [Google Scholar]
- Wu X.; Guo Q.; Gong Y.; Liu J.; Luo X.; Wu T.; Yu G. Influence of burner geometry on atomization of coal water slurry in an entrained-flow gasifier. Chem. Eng. Sci. 2022, 247, 117088 10.1016/j.ces.2021.117088. [DOI] [Google Scholar]
- Mekhrengin M.; Miroshnichenko G.; Chistiakov A.; Bolotov D.; Ashirov A.; Zubko A.; Meshkovskiy I. Combination of soot pyrometry and C2* emission spectroscopy for temperature measurement during combustion of hydrocarbons. Measurement 2020, 166, 108242 10.1016/j.measurement.2020.108242. [DOI] [Google Scholar]
- Ballester J.; Hernández R.; Sanz A.; Smolarz A.; Barroso J.; Pina A. Chemiluminescence monitoring in premixed flames of natural gas and its blends with hydrogen. Proc. Combust. Inst. 2009, 32, 2983–2991. 10.1016/j.proci.2008.07.029. [DOI] [Google Scholar]
- Hardalupas Y.; Orain M. Local measurements of the time-dependent heat release rate and equivalence ratio using chemiluminescent emission from a flame. Combust. Flame 2004, 139, 188–207. 10.1016/j.combustflame.2004.08.003. [DOI] [Google Scholar]
- Panoutsos C.; Hardalupas Y.; Taylor A. Numerical evaluation of equivalence ratio measurement using OH* and CH* chemiluminescence in premixed and non-premixed methane–air flames. Combust. Flame 2009, 156, 273–291. 10.1016/j.combustflame.2008.11.008. [DOI] [Google Scholar]
- Lauer M.; Zellhuber M.; Sattelmayer T.; Aul C. J. Determination of the Heat Release Distribution in Turbulent Flames by a Model Based Correction of OH* Chemiluminescence. J. Eng. Gas Turbines Power 2011, 133, 85748. 10.1115/1.4004124. [DOI] [Google Scholar]
- Nori V. N.; Seitzman J. M. CH* chemiluminescence modeling for combustion diagnostics. Proc. Combust. Inst. 2009, 32, 895–903. 10.1016/j.proci.2008.05.050. [DOI] [Google Scholar]
- Guiberti T. F.; Durox D.; Schuller T. Flame chemiluminescence from CO2- and N2-diluted laminar CH4/air premixed flames. Combust. Flame 2017, 181, 110–122. 10.1016/j.combustflame.2017.01.032. [DOI] [Google Scholar]
- MARCHESE A. J.; DRYER F. L.; NAYAGAM V.; COLANTONIO R. O. Hydroxyl radical chemiluminescence imaging and the structure of microgravity droplet flames. Symp. (Int.) Combust., [Proc.] 1996, 26, 1219–1226. 10.1016/S0082-0784(96)80338-9. [DOI] [Google Scholar]
- Turner M. A.; Paschal T. T.; Parajuli P.; Kulatilaka W. D.; Petersen E. L. Resolving flame thickness using high-speed chemiluminescence imaging of OH* and CH* in spherically expanding methane-air flames. Proc. Combust. Inst. 2021, 38, 2101–2108. 10.1016/j.proci.2020.07.112. [DOI] [Google Scholar]
- Shim M.; Noh K.; Yoon W. Flame structure of methane/oxygen shear coaxial jet with velocity ratio using high-speed imaging and OH*, CH* chemiluminescence. Acta Astronaut. 2018, 147, 127–132. 10.1016/j.actaastro.2018.03.053. [DOI] [Google Scholar]
- Zhu H.; Hu C.; Guo Q.; Gong Y.; Yu G. Investigation on chemiluminescence and structure characteristics in CH4/O2 diffusion flames. Exp. Therm. Fluid Sci. 2019, 102, 595–602. 10.1016/j.expthermflusci.2018.10.017. [DOI] [Google Scholar]
- Wang Z.; Sunderland P. B.; Axelbaum R. L. Double blue zones in inverse and normal laminar jet diffusion flames. Combust. Flame 2020, 211, 253–259. 10.1016/j.combustflame.2019.09.014. [DOI] [Google Scholar]
- Yang J.; Gong Y.; Guo Q.; Zhu H.; Wang F.; Yu G. Experimental studies of the effects of global equivalence ratio and CO2 dilution level on the OH* and CH* chemiluminescence in CH4/O2 diffusion flames. Fuel 2020, 278, 118307 10.1016/j.fuel.2020.118307. [DOI] [Google Scholar]
- Kopp M.; Brower M.; Mathieu O.; Petersen E.; Guthe F. CO2* chemiluminescence study at low and elevated pressures. Appl. Phys. B: Lasers Opt. 2012, 107, 529–538. 10.1007/s00340-012-5051-4. [DOI] [Google Scholar]
- Cho Y. T.; Na S. J. Application of Abel inversion in real-time calculations for circularly and elliptically symmetric radiation sources. Meas. Sci. Technol. 2005, 16, 878–884. 10.1088/0957-0233/16/3/032. [DOI] [Google Scholar]
- Oh J.; Noh D. Lifted flame behavior of a non-premixed oxy-methane jet in a lab-scale slot burner. Fuel 2013, 103, 862–868. 10.1016/j.fuel.2012.09.055. [DOI] [Google Scholar]
- Liu Y.; Xue Q.; Zuo H.; She X.; Wang J. Effects of CO2 and N2 dilution on the characteristics and NOX emission of H2/CH4/CO/air partially premixed flame. Int. J. Hydrogen Energy 2022, 47, 15909–15921. 10.1016/j.ijhydene.2022.03.060. [DOI] [Google Scholar]
- Cao Z.; Zhu T. Effects of CO2 Dilution on Methane Ignition in Moderate or Intense Low-oxygen Dilution (MILD) Combustion: A Numerical Study. Chin. J. Chem. Eng. 2012, 20, 701–709. 10.1016/S1004-9541(11)60238-3. [DOI] [Google Scholar]
- Degeeǹve A.; Vicquelin R.; Mirat C.; Labegorre B.; Jourdaine P.; Caudal J.; Schuller T. Scaling relations for the length of coaxial oxy-flames with and without swirl. Proc. Combust. Inst. 2019, 37, 4563–4570. 10.1016/j.proci.2018.06.032. [DOI] [Google Scholar]
- Liu Y.; Xue Q.; Zuo H.; Yang F.; Peng X.; Wang J. Effects of CO2 and N2 Dilution on the Combustion Characteristics of H2/CO Mixture in a Turbulent, Partially Premixed Burner. ACS Omega 2021, 6, 15651–15662. 10.1021/acsomega.1c00534. [DOI] [PMC free article] [PubMed] [Google Scholar]
- Siebers D. L.; Higgins B. S.. Effects of injector conditions on the flame lift-off length of Dl diesel sprays, in: Proceedings of the THIESEL 2002, Conference on Thermo-and Fluid-dynamic Processes in Diesel Engines. In. Thermo- and Fluid Dynamic Processes in Diesel Engines 2; Springer; 2002 [Google Scholar]
- Bouvet N.; Chauveau C.; Gökalp I.; Lee S. Y.; Santoro R. J. Characterization of syngas laminar flames using the Bunsen burner configuration. Int. J. Hydrogen Energy 2011, 36, 992–1005. 10.1016/j.ijhydene.2010.08.147. [DOI] [Google Scholar]
- He L.; Guo Q.; Gong Y.; Wang F.; Yu G. Investigation of OH* chemiluminescence and heat release in laminar methane–oxygen co-flow diffusion flames. Combust. Flame 2019, 201, 12–22. 10.1016/j.combustflame.2018.12.009. [DOI] [Google Scholar]
- Zheng H.; Bai T. Analyzing the ultraviolet radiation of hydroxyl radical chemiluminescence in a motor plume using improved local equilibrium method coupled with Monte Carlo method. Optik 2018, 165, 159–167. 10.1016/j.ijleo.2018.03.130. [DOI] [Google Scholar]
- Luque J.; Jeffries J. B.; Smith G. P.; Crosley D. R.; Walsh K. T.; Long M. B.; Smooke M. D. CH(A-X) and OH(A-X) optical emission in an axisymmetric laminar diffusion flame. Combust. Flame 2000, 122, 172–175. 10.1016/S0010-2180(00)00112-7. [DOI] [Google Scholar]
- HIDAKA Y.; TAKAHASHI S.; Kawano H.; Suga M.; GARDINER W. C. Jr. Shock-tube measurement of the rate constant for excited hydroxyl(A2.SIGMA.+) formation in the hydrogen-oxygen reaction. J. Phys. Chem. 1982, 86, 1429–1433. 10.1021/j100397a043. [DOI] [Google Scholar]
- Higgins B.; McQuay M. Q.; Lacas F.; Candel S. An experimental study on the effect of pressure and strain rate on CH chemiluminescence of premixed fuel-lean methane/air flames. Fuel 2001, 80, 1583–1591. 10.1016/S0016-2361(01)00040-0. [DOI] [Google Scholar]
- Higgins B.; McQuay M. Q.; Lacas F.; Rolon J. C.; Darabiha N.; Candel S. Systematic measurements of OH chemiluminescence for fuel-lean, high-pressure, premixed, laminar flames. Fuel 2001, 80, 67–74. 10.1016/S0016-2361(00)00069-7. [DOI] [Google Scholar]
- Mahmoud S. M.; Nathan G. J.; Alwahabi Z. T.; Sun Z. W.; Medwell P. R.; Dally B. B. The effect of exit strain rate on soot volume fraction in turbulent non-premixed jet flames. Proc. Combust. Inst. 2017, 36, 889–897. 10.1016/j.proci.2016.08.055. [DOI] [Google Scholar]
- Qamar N. H.; Nathan G. J.; Alwahabi Z. T.; King K. D. The effect of global mixing on soot volume fraction: measurements in simple jet, precessing jet, and bluff body flames. Proc. Combust. Inst. 2005, 30, 1493–1500. 10.1016/j.proci.2004.08.102. [DOI] [Google Scholar]
- Newbold G. J. R.; NATHAN G. J.; NOBES D. S.; TURNS S. R. Measurement and prediction of NOx emissions from unconfined propane flames from turbulent-jet, bluff-body, swirl, and precessing jet burners. Proc. Combust. Inst. 2000, 28, 481–487. 10.1016/S0082-0784(00)80246-5. [DOI] [Google Scholar]
- Matsuyama S. Correlation of optical emission and turbulent length scale in a coaxial jet diffusion flame. Combust. Flame 2014, 161, 937–949. 10.1016/j.combustflame.2013.10.009. [DOI] [Google Scholar]
- Kojima J.; Ikeda Y.; Nakajima T. Basic aspects of OH(A), CH(A), and C2(d) chemiluminescence in the reaction zone of laminar methane–air premixed flames. Combust. Flame 2005, 140, 34–45. 10.1016/j.combustflame.2004.10.002. [DOI] [Google Scholar]