

Abstract
PM2.5 chemical components play significant roles in the climate, air quality, and public health, and the roles vary due to their different physicochemical properties. Obtaining accurate and timely updated information on China’s PM2.5 chemical composition is the basis for research and environmental management. Here, we developed a full-coverage near-real-time PM2.5 chemical composition data set at 10 km spatial resolution since 2000, combining the Weather Research and Forecasting–Community Multiscale Air Quality modeling system, ground observations, a machine learning algorithm, and multisource-fusion PM2.5 data. PM2.5 chemical components in our data set are in good agreement with the available observations (correlation coefficients range from 0.64 to 0.75 at a monthly scale from 2000 to 2020 and from 0.67 to 0.80 at a daily scale from 2013 to 2020; most normalized mean biases within ±20%). Our data set reveals the long-term trends in PM2.5 chemical composition in China, especially the rapid decreases after 2013 for sulfate, nitrate, ammonium, organic matter, and black carbon, at the rate of −9.0, −7.2, −8.1, −8.4, and −9.2% per year, respectively. The day-to-day variability is also well captured, including evolutions in spatial distribution and shares of PM2.5 components. As part of Tracking Air Pollution in China (http://tapdata.org.cn), this daily-updated data set provides large opportunities for health and climate research as well as policy-making in China.
Keywords: PM2.5 chemical composition, air pollution, near-real-time, data fusion
Short abstract
We developed an open-access, full-coverage, near-real-time PM2.5 chemical composition product on a daily scale based on multisource data fusion across China since 2000, providing opportunities for related research and environmental management.
1. Introduction
Sulfate (SO42–), nitrate (NO3), ammonium (NH4+), organic matter (OM), black carbon (BC), and crustal elements are major chemical components of fine particulate matter (PM2.5) and play important roles in modulating the Earth’s climate,1−3 degrading air quality,4,5 and inducing adverse health outcomes.6−9 The roles of total PM2.5 are hybrid, but those of different species are significantly distinct due to their different physicochemical properties. For example, BC mostly absorbs solar radiation, whereas SO4 primarily scatters it, resulting in opposite climate effects; carbonaceous materials are probably more toxic than SO42– and thus have different health impacts.6−9 In addition, the PM2.5 chemical composition could provide more targeted instructions for policy-making than total PM2.5 due to its straightforward association with emission changes.10−13 Therefore, it is valuable and necessary to understand the spatiotemporal variations in PM2.5 chemical composition for research on climate change, air pollution, public health, and environmental management. Consequently, a complete-coverage, high-resolution, timely updated PM2.5 chemical composition data set with long historical records is needed. Our previous work14 described the advantages and necessity of data sets with such characteristics.
Several sources provide data on PM2.5 chemical composition, including ground observations, chemical transport models (CTMs), satellite-based products, and reanalysis data. Among them, ground observations provide relatively more accurate PM2.5 chemical composition information, but they are still very limited in China. The National Ambient Air Quality Monitoring Network, developed and maintained by the China National Environmental Monitoring Centre (CNEMC), only measures total PM2.5, not PM2.5 chemical composition. Despite some institutions having established PM2.5 chemical composition monitoring networks, such as the Campaign on Atmospheric Aerosol Research network of China15 (CARE-China), China’s National Aerosol Composition Monitoring Network (NACMON),16 the China Atmosphere Watch Network17 (CAWNET), and the Surface PARTiculate mAtter Network18,19 (SPARTAN), the site density and spatial representativeness are far inferior to those related to total PM2.5. In addition, the inconsistency brought by different sampling methods would introduce uncertainties to the ground observations.20 CTMs with emission inventories provide spatiotemporally continuous PM2.5 chemical component concentrations. Nevertheless, the defects of numerical algorithms, imperfect parameterization schemes, greatly simplified chemical mechanisms, and uncertainties in emission inventories can introduce biases to the data. In addition, the heavy computational burden of CTMs constrains the production of high-resolution data. Satellite-derived products also provide information related to PM2.5 chemical composition.21−23 However, those parameters are usually optical signals, which need additional modeling to obtain surface mass concentrations.24−27 The nonrandom missing data in satellite products due to clouds and high surface albedo make it difficult to get timely updated PM2.5 chemical composition concentrations with complete spatial coverage. Reanalysis data28,29 provide the optimal estimates of PM2.5 chemical component concentrations taking advantage of satellite remote sensing and CTMs. However, they were reported to be biased compared to ground observations30 in China, which either significantly overestimate31 or underestimate32 PM2.5 and show unreasonable trend33 in PM2.5 components.
Previous studies sought to estimate PM2.5 chemical component concentrations by combining data from the above sources with ancillary data to overcome the constraints of a single data source; such methods include observation-based algorithms and CTM-based algorithms. Observation-based algorithms train statistical24,25 or machine learning26,27 models to capture the relation between ground observations of PM2.5 chemical composition (as the dependent variable) and predictors (as independent variables). The commonly used predictors include fractional aerosol optical depth (AOD),24−27 CTM simulations,26,27 and additional data such as meteorological fields, land use data, population, elevation,25−27 and temporal indicators.24−26 Based on the obtained relations, PM2.5 chemical component concentrations can be estimated.26,27 However, such studies are mainly conducted in the US because observation-based algorithms rely heavily on ground-observed PM2.5 chemical component concentrations, making it difficult to apply these algorithms to areas with less available observational data, such as China. To estimate global PM2.5 chemical component concentrations, Philip et al.34 developed a CTM-based algorithm that applied simulated composition conversion factors to satellite AOD data, significantly reducing the reliance on observational data. Geng et al.35 improved such method and obtained long-term series of PM2.5 chemical component concentrations in China during 2005–2012. However, CTM-based algorithms show a lower estimate accuracy (e.g., correlation coefficient less than 0.7535) due to the limitations of CTM data, and daily-scale estimates are challenging to generate due to the data gaps in daily AOD products. Recently, Van Donkelaar et al.36 appended a concentration revision model trained against ground observations to a CTM-based algorithm to improve the accuracy of estimated PM2.5 chemical component concentrations in the United States, which took advantage of both observation-based and CTM-based algorithms. In addition, multisource-fusion PM2.5 data as an alternative to satellite AOD were combined with simulated conversion factors to derive PM2.5 chemical component concentrations,37 which seems to be a promising approach to overcome the temporal resolution limitation of AOD. Overall, there are no adequate ground observations to support observation-based algorithms in China, and existing studies using CTM-based algorithms have not achieved near-real-time daily PM2.5 chemical component concentration estimates with 100% spatiotemporal coverage.
This work is part of Tracking Air Pollution in China14,38,39 (TAP; http://tapdata.org.cn), which aims to develop China’s PM2.5 chemical composition data set with complete-coverage, high spatial resolution (i.e., 10 km), long-term historical records since 2000, and near-real-time updates. We first conducted a long-term simulation starting in 2000 based on the Weather Research and Forecasting–Community Multiscale Air Quality (WRF–CMAQ) model with a improved windblown dust module40−43 to obtain component-specific conversion factors. Then, the conversion factors were fed to a machine learning model to mitigate biases against ground observations after which they were combined with multisource-fusion PM2.5 data from TAP to derive chemical component concentrations. This data set is released and dynamically updated on the TAP website.
2. Data and Methods
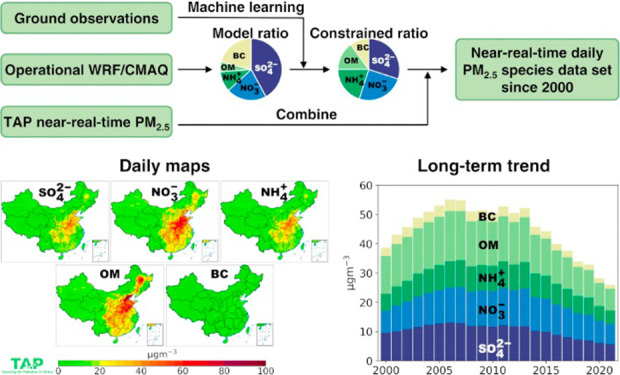
Figure 1 shows a diagram of the entire construction process of the PM2.5 chemical composition data set. The PM2.5 chemical composition information (i.e., PM2.5 component proportions as conversion factors (CFs); see Section 2.6) is provided by the operational WRF–CMAQ modeling system in which the windblown dust module has been improved40−42 to better represent the dust concentrations in the desert area of Northwest China (Section 3.1.1). The simulated CFs, which significantly underestimate SO42– and NH4 and overestimate BC in this study (Section 3.1.1), are revised by extreme gradient boosting (XGBoost) models trained on collected ground observations (Section 2.1) and then combined with TAP near-real-time PM2.5 data (Section 2.4) to derive TAP near-real-time PM2.5 chemical composition data.
Figure 1.

Methodological framework of near-real-time (NRT) PM2.5 composition data generation.
2.1. Collection of Ground Observations
As the available national-scale PM2.5 and chemical composition measurements have been limited since 2000, we collected ground observations from the following sources. The national-scale PM2.5 observations since 2013 were taken from the CNEMC website (https://air.cnemc.cn:18007). The PM2.5 chemical composition observations obtained from operational monitoring networks (e.g., NACMON,16 CAWNET,17 and SPARTAN18,19) and from literature studies,44−52 which have relatively long data records, accurate geocoordinates, clear start and end times of sampling, and relatively complete components in each observation record, covering 2013–2020, were used for model training to develop the conversion factor revision model (Section 2.6). Such a data set has been used for the evaluation of PM2.5 chemical composition simulations in previous studies.37,53 More details about these data, including the temporal resolution, sampling period, measuring methods, etc., could be found in Table S1. For simplicity, we ignored the differences between different measuring methods, such as the difference between BC and elemental carbon (EC). As the concentrations of OM cannot be directly measured, they were considered to be 1.654,55 times the concentrations of organic carbon (OC) in this study if no exact OM:OC value was given from the corresponding data sources. In addition, this data set is a mix of daily and monthly data in which the daily data cover limited cities and years in China (Table S1). To achieve better spatial and temporal representation and use those data as much as possible, we unified the data set to a monthly scale (approximately 650 data entries in total, covering January 2013–September 2020).
Other PM2.5 chemical composition data collected from literature studies, which provide fragmentary data records with unclear location and period of sampling and incomplete components in each record, were used as an additional data set for evaluation. The sources, locations, periods of observations, and other information on the collected data are also summarized in Table S1. In total, we have 1640 and 571 stations for PM2.5 and PM2.5 chemical composition, respectively, covering almost all provinces, and they are most representative of the “2 + 26” cities, the Yangtze River Delta (YRD) region, and the Pearl River Delta (PRD) region (Figure S1). See Table S2 for the definition of regions.
2.2. Global Reanalysis of Atmospheric Composition
Modern-Era Retrospective analysis for Research and Applications Version 2 (MERRA-2) M2T1NXAER,56 and Copernicus Atmospheric Monitoring Service (CAMS) global reanalysis (EAC4)29 provide global reanalysis of atmospheric composition, which we used to compare with our data set (Section 3.3). MERRA-2 M2T1NXAER provides two-dimensional hourly assimilated aerosol products, including surface mass concentrations of BC, OC (times 1.6 to be OM), and SO42–, with a spatial resolution of 0.5° × 0.625° covering 1980–2022. CAMS EAC4 provides three hourly three-dimensional NH4 and NO3– with a spatial resolution of 0.75° × 0.75° covering 2003–2021. The data in the surface of China are extracted and are averaged to daily mean in China standard time to match our data set.
2.3. PM2.5 Component Concentration Estimates
In this study, we estimated daily PM2.5 component concentrations by using the revised CMAQ-simulated CFs (see Section 2.6) at daily scale to partition the total PM2.5 concentrations from TAP:14,38,39
| 1 |
where C represents the concentration; superscript k designates the five PM2.5 components, including SO42–, NO3, NH4+, OM, and BC; subscript TAP indicates the data source; CFrevised means the revised CMAQ-simulated CF for component k. The methodology of CF revision is explained in Section 2.6.
2.4. Multisource-Fusion PM2.5 Mass Data
The 2000 to present 10 km × 10 km gridded PM2.5 data were taken from TAP14,38,39 (i.e., CTAPPM2.5 in Section 2.3eq 1). It was developed from multisource data fusion, including ground observations, satellite-retrieved AOD, CTM simulations, and ancillary data such as meteorological, land use, population, and elevation data (Figure 1). The PM2.5 estimation relies on a two-stage machine learning model, which has an out-of-bag cross validation R2 of 0.80–0.88 and root-mean-square error (RMSE) of 13.9–22.1 μg m–3, with improved performance at high pollution levels. More details about the TAP PM2.5 data set could be found in Geng et al.14
2.5. WRF–CMAQ Configuration and Its Improvement
The operational WRFv3.9.1-CMAQv5.2 modeling system was configured in line with our previous study,14 including the simulated domain, grid framework, boundary conditions, parameterization schemes, chemical mechanism, and use of emission data (Table S3). Year-by-year emissions since 2000 were taken from the Multi-resolution Emission Inventory in China (MEIC; http://meicmodel.org), which quantified China’s anthropogenic emission by considering clean air policies in the past two decades57,58 and updated in a timely manner using a bottom-up approach based on near-real-time activity indicators.59 Since the windblown dust treatment implemented in CMAQv5.243 failed to capture the onset of dust emissions in the desert area of Northwest China, leading to a substantial underestimation of dust concentrations and thus unreasonable PM2.5 component proportions, we revised it to obtain better CFs.
In the CMAQv5.2 windblown dust module, the scheme developed by Shao et al.60 (Shao scheme) dominated the dust emission process; this scheme was also reported by previous studies41,42 to have significantly underestimated dust concentrations in the desert area of Northwest China due to incorrect soil texture data and the absence of the dust emission mechanism. In contrast, the Goddard Chemistry Aerosol Radiation and Transport (GOCART) scheme61,62 can better reproduce the dust concentrations in this desert area. Accordingly, we substituted the Shao scheme with the GOCART scheme in the desert areas (i.e., the areas with a soil type of sand and loamy sand;43 see Figure S2; the idea derived from Dong et al.40 and Zeng et al.41). Most parameters in the GOCART scheme were already provided in the windblown dust module, while some were determined by referring to Zeng et al.,41 Ginoux et al.,61 and Marticorena and Bergametti,62 such as the size fraction bins of emitted dust.
2.6. Conversion Factor Modeling
The CMAQ-simulated CFs are key parameters in estimating PM2.5 component concentrations, which are defined as the proportions of PM2.5 components to the total PM2.5. However, simulated CFs are usually biased against observations, due to the uncertainties of CMAQ,63−66 emission inventories,67 and meteorological fields. Therefore, we collected ground observations of PM2.5 and PM2.5 components (see Section 2.1) to constrain the CMAQ-simulated CFs through machine learning models. As the performance of the windblown dust module has been improved (see Section 2.5) and the lack of dust observation data, we only revised dust-free CFs that is defined as follows:
| 2 |
where dust-free PM2.5 is the sum of SO42–, NO3, NH4+, OM, and BC; superscript k designates the five components making up dust-free PM2.5; subscript CMAQ indicates the data source.
For each component, we built a specific revision model based on the XGBoost algorithm. It was trained with the collected ground observations at a monthly scale (see Section 2.1) and took all five dust-free CFs as inputs to estimate the revised CF of the corresponding component:
| 3 |
where CFdust – free, revisedk represents the observation-constrained CF for species k; CFObs indicates the CF for species k calculated based on ground observations; XGB represents the XGBoost model. To ensure the conservation of total PM2.5 concentrations, we limited the sum of revised dust-free CFs to be 1 through normalization. Then they were combined with the dust-free PM2.5 and total PM2.5 to derive revised CFs to be applied to Section 2.3eq 1:
| 4 |
3. Results and Discussion
3.1. Evaluation of WRF–CMAQ and TAP PM2.5 Composition
3.1.1. Evaluation of CMAQ-Simulated PM2.5 Composition Data
Figure 2a,b shows the evaluation of the CMAQ-simulated PM2.5 chemical component concentrations, with statistical metrics of correlation coefficient (R), normalized mean bias (NMB), and RMSE. Additional evaluations of the WRF–CMAQ modeling system are documented in Figure S3–5, S7 and Tables S4, 5. For PM2.5 total mass, the R of daily mean concentrations over China reaches 0.94 with a relatively small error (2.37 μg m–3), indicating a good representation of PM2.5 daily variations. Although the simulation slightly underestimates (∼5%) the PM2.5 concentrations, it is in the acceptable range considering the uncertainty of the CMAQ data set. In terms of monthly mean concentrations, the PM2.5 samples show similar characteristics of high correlation (R = 0.73), reasonable error (RMSE = 48.24 μg m–3),68 and mild underestimation (∼6%). However, a desirable total PM2.5 simulation does not guarantee a good chemical composition simulation because small PM2.5 simulation errors can result from the offset of positive and negative chemical component simulation errors. As shown in Figure 2b, although PM2.5 chemical component concentrations correlate well with ground observations (R = 0.57–0.71) and are in the acceptable error range (RMSE = 3.06–14.39 μg m–3),68 CMAQ underestimates SO42– (NMB = −39.55%) and NH4 (NMB = −26.99%), while it overestimates BC (NMB = 21.14%). The simulation performance of daily mean PM2.5 chemical component concentrations is similar but has a larger NMB for most components (Figure S7).
Figure 2.

Comparison of national-average observed (black) and CMAQ-simulated (blue) daily mean PM2.5 concentrations over China in 2013–2021 (a left). Evaluation of simulated monthly mean PM2.5 (a right) and chemical component (b) concentrations. Ten-fold cross validation of dust-free PM2.5 proportions (c). Evaluation of estimated PM2.5 chemical component concentrations against the training data set (d), additional data set (e), and total data set (f). Solid gray lines correspond to the 1:1 line, and the dashed gray lines represent the 1:2 (2:1) lines. Color of the points indicates the normalized distribution density.
3.1.2. Evaluation of Revised Conversion Factors and TAP PM2.5 Composition Data
Figure 2c shows the 10-fold cross validation performance of the CF revision model, which shows that the R values of the revised simulated dust-free CFs range from 0.52 to 0.72 with slight bias and error (NMB within ±3.23%; RMSE ≤ 0.07), indicating the good performance of the models. Combining the revised CFs and TAP multisource-fusion PM2.5 data since 2000, we obtained the PM2.5 chemical component concentration data set, whose performance is shown in Figures 2d–f and S5–7.
In the training data set (Figure 2d), TAP PM2.5 chemical component concentrations show good consistency with the observations, with an R over 0.73, NMB within ±17.07%, and RMSE less than 7.58 μg m–3, and most of the samples lie between the 1:2 and 2:1 lines. In the additional data set (Figure 2e), a mild decrease in performance is shown in which, on average, R drops by 0.11, and RMSE increases by 2.61 μg m–3, while the changes in NMB are relatively larger. Picking out the prior-2013 evaluation results (Figure S5), we found TAP still outperforms the CMAQ, demonstrating the effectiveness of applying the revision model before 2013, despite the training data set only providing information after 2013. The decrease of performance in the additional data set, especially data before 2013, may attribute to (1) some of the data collected from the literature do not have exact sampling time and geocoordinates, resulting in imprecise matches to TAP data; and (2) the training data set cannot sufficiently represent the systematic bias throughout the study period, but this limitation is challenging to overcome. From the view of the total data set (Figure 2f), our estimated PM2.5 chemical component concentrations outperform the CMAQ simulations, with R (RMSE) ranging from 0.64 (2.35 μg m–3) to 0.75 (12.67 μg m–3) and increasing (decreasing) by 0.10 (1.35 μg m–3) on average. Moreover, the underestimates of SO42– and NH4 are mitigated, and the overestimation of BC no longer exists.
For daily concentrations (Figure S7), the improvements in our PM2.5 chemical component concentrations are also significant, supporting the effectiveness of applying the CF revision model trained on the monthly scale to data on a daily scale. For example, SO42– and NH4 (BC) exhibit more serious underestimates (overestimates) in CMAQ simulations, with an NMB of more than ±45%, while NMB is reduced to less than ±15% in our data set. The correlation coefficients for all species are over 0.67, with those for NO3– and NH4 even reaching 0.8. Overall, our PM2.5 chemical component concentration data set has satisfactory performance on both the monthly and daily scales.
We also evaluated the spatial representation of the PM2.5 chemical component concentrations (Figure S8). We used data from CAWNET, SPARTAN, and two sites (Beijing and Xi’an) mentioned in Section 3.1.3 to calculate the annual mean concentrations in 2013 and data from NACMON and SPARTAN to calculate those in 2019. As is shown in Figure S8, the observation sites used here roughly covers the entire of China. Our data set shows good performance in spatial representation, with an R over 0.67, NMB within ±25%, and RMSE within 10 μg m–3.
3.1.3. Evaluation of the TAP PM2.5 Composition Trend
We selected monitoring sites with multiyear records available (Figure S1), including Beijing (39.99°N, 116.32°E), Nanjing (32.10°N, 118.97°E), and Xi’an (34.23°N, 108.89°E), to evaluate the temporal trends of our PM2.5 chemical component concentrations from 2013–2017, with each data point representing the average concentration for a specific month. In addition, we combined the information for 28 sites in the “2 + 26” cities provided by NACMON to explore the overall performance in that region. The results are shown in Figure 3. For Beijing, Nanjing, and Xi’an, TAP data well depict the monthly variations and the multiyear trends of PM2.5 composition, with most R exceeding 0.73, more than half NMBs within or approximately ±20%, and most RMSEs less than 10 μg m–3. Some sharply high values, such as NH4+ in December 2015 in Beijing, NO3 in December 2013 in Nanjing, and NO3– in December 2016 in Xi’an are reached as well. For the “2 + 26” cities region, TAP values are also in good agreement with the observed values, with R above 0.9, NMBs within ±20%, and RMSEs less than 5 μg m–3. Therefore, the capability of our data set to capture the temporal variations in PM2.5 chemical component concentrations is demonstrated.
Figure 3.

TAP estimated (blue) and observed (black) monthly mean PM2.5 chemical component concentrations at three selected monitoring sites (Beijing: 39.99°N, 116.32°E; Nanjing: 32.10°N, 118.97°E; Xi’an: 34.23°N, 108.89°E) with multiyear observations (rows 1–3) and the “2 + 26” cities region (row 4).
3.2. Spatiotemporal Variations in PM2.5 Chemical Component Concentrations
3.2.1. Long-Term Trend since 2000
Figures 4 and 5 show the long-term spatiotemporal changes of PM2.5 chemical composition since 2000. With economic and social development and the lack of effective control of air pollutant emissions, PM2.5 pollution increased rapidly in 2000–2006. As shown in Figure 4, the areas with severe PM2.5 pollution were mainly located in the North China Plain, the YRD region, the PRD region, and other provincial capitals in Central and East China. The OM concentrations were the highest, exceeding 15 μg m–3, while the SO42–, NO3, and NH4+ concentrations were approximately 10 μg m–3, and the BC concentrations were the lowest, below 5 μg m–3. The population-weighted (the population data are taken from GPW v4.11; https://beta.sedac.ciesin.columbia.edu) concentrations of PM2.5 chemical components were in a naturally increasing status in the same period, with average annual increases of 5.0% (p ≤ 0.001), 5.7% (p ≤ 0.001), 6.4% (p ≤ 0.001), 3.0% (p ≤ 0.001), and 3.9% (p ≤ 0.001)% per year for SO4, NO3–, NH4, OM, and BC, respectively (Figures 5 and S9).
Figure 4.

Spatial distribution of estimated annual mean PM2.5 and chemical component concentrations over China in 2000, 2003, 2006, 2010, 2013, 2017, and 2020.
Figure 5.

Deseasonalized monthly mean (teal lines) population-weighted PM2.5 (a) and chemical component (b–f) concentrations and fitted temporal trends (black lines) over China from March 2000 to February 2022.
To mitigate the air pollution problem, China has implemented active clean air policies. The population-weighted concentrations of PM2.5 chemical components experienced a slight reduction in 2007–2012 and a significant decrease since 2013 driven by pollution control measures. From 2007 to 2012, PM2.5 precursor emissions have declined slowly due to the policy implementation, such as the upgraded emission standard for SO2 and particulate matter of coal power plants in the 11th Five-Year Plan.69,70 The recent decade has witnessed a dramatic decline in the population-weighted concentrations of PM2.5 chemical components, driven by more stringent policy actions resulting in striking PM2.5 precursor emission reductions after the year 2013.58 Particularly, the population-weighted concentration of BC exhibits the fastest decline at an annual rate of 9.2% (p ≤ 0.001) followed by SO42– (9.0% per year, p ≤ 0.001). BC mainly comes from residential coal use,58 whose emissions have declined rapidly since 2013, because residential coal use was replaced by electricity and natural gas in China. The concentration responses of BC to emission changes are more linear than other secondary PM2.5 components,37 which may contribute to a faster reduction rate in BC than other species. In terms of the changes in the spatial distribution, a remarkable decline in the North China Plain, the YRD region, and the PRD region is observed in the same period.
For the three key regions (“2 + 26” cities, YRD, and PRD; Figure S1), due to the difference in the start time of emission control and the measures taken, the temporal trends of PM2.5 and chemical components are distinctive. The PM2.5 and chemical component concentrations in the “2 + 26” cities and the YRD increased before 2007, remained relatively stable from 2007 to 2012, and decreased rapidly after 2013 (Figures S10 and S11). The situation is different in the PRD, where clean air policies were implemented earlier and PM2.5 and chemical component concentrations have been declining at a high rate since 2007 (Figure S12).
3.2.2. Day-to-Day Variability
Our data set can well capture the daily variations in PM2.5 and chemical component concentrations, which is valuable for environmental management and for avoiding the health impacts of acute exposure. Taking a long-lasting severe haze episode (December 30, 2016, to January 7, 2017; Figure 6) in Beijing as an example, according to our data set, the PM2.5 concentration started to grow on December 29, 2016, increased rapidly to reach the maximum (379 μg m–3) on January 1, 2017, and remained at high levels until January 7, 2017, which shows good consistency with the observations (Figure 6a). Figure 6b shows that the average contribution of secondary inorganic aerosols (SO42–, NO3, and NH4+; SNA) increased significantly from 31.1% (the clean episode) to 44.8% (the pollution episode). SNA was suggested to be the major contributor to severe haze,71 and the its increases are most likely from heterogeneous reactions.54,63,72 Meanwhile, the regional transport of pollutants was found to have considerably contributed to the concentrations of PM2.5 in Beijing.73,74 As shown in Figure 6c–f, the regional transport of high-level PM2.5 from the South and East of Beijing may be another reason for this haze episode. Moreover, the spatial differences in PM2.5 chemical component concentrations provide comprehensive information for a better understanding on the haze formation mechanisms and formulating targeted emission control measures.
Figure 6.

Population-weighted daily mean TAP PM2.5 and chemical component concentrations (a) and proportions (b) in Beijing and the corresponding concentration spatial distributions (c–f) during a haze episode (December 30, 2016–January 7, 2017).
3.3. Comparison with Global Reanalysis Data Sets
Figure S6 shows the evaluation of MERRA-2 and CAMS monthly PM2.5 chemical component concentrations against the total data set. The data from MERRA-2 and CAMS are less consistent with observations (R = 0.30–0.58) than our data set (R = 0.64–0.75; Figure 2f) with a more severe overestimate of BC (NMB = 41.83%) and underestimate of OM (NMB = −27.58%), NO3– (NMB = −49.95%), and NH4 (NMB = −66.35%). The influence of the absent CAMS data during 2000–2002 is negligible, which account for less than 0.5% of the total data set. For daily PM2.5 chemical composition concentrations, the biases of MERRA-2 and CAMS against ground observations are much larger than that in our data set (Figure S7). From the view of spatial distribution (Figure S13), the MERRA-2 and CAMS show a smoother pattern than our data set (Figure 4) due to the lower horizontal resolution. During the entire period, the variations of MERRA-2 and CAMS data were slight, including 2013–2017 when many stringent clean air policies were implemented. In addition, neither MERRA-2 nor CAMS can provide near-real-time PM2.5 chemical component concentrations, the latency of which is ∼3 weeks and 4–6 months, respectively.
3.4. Uncertainty and Limitations
Our near-real-time PM2.5 chemical composition data rely on operational WRF–CMAQ simulations, TAP near-real-time multisource-fusion PM2.5 data, and a CF revision model trained on collected ground observations, which was the source of uncertainty and limitations.
Emission inventories would introduce uncertainties as well. The compilation of bottom-up emission inventories requires detailed emission factors, activity data, and removal efficiencies; moreover, these data are usually incomplete to varying degrees. Quantitative estimates of such uncertainty were previously discussed by Zhang et al.75 in detail. It should be noted that the operational WRF–CMAQ simulations rely on near-real-time emission inventories. We adapted the methodology reported by Zheng et al.59 to estimate near-real-time emissions, but additional assumptions in the absence of traditional data increase the uncertainty of emission inventories.
The lack of observational data is a major limitation of this study: (1) it is hard to find long-record observations from the same site. Using observations with missing data may introduce uncertainties in trend evaluation (Figure 3); (2) most of the data in the additional data set were collected from the literature with imprecise sampling locations and start and end times and thus larger uncertainties; (3) for data sources not giving an exact OM:OC value (more than 99.7% in the total collected ground observations), the value is set to 1.654,55 uniformly, which may introduce uncertainties; (4) more than 99% BC data in the training data set are measured by thermal/optical methods, while the rest (<1%) is measured by optical methods. For simplicity and to use the data as much as possible, we ignored the differences between them, which would introduce some uncertainties to the study as well; (5) we used the original measured values of PM2.5 chemical composition, which were usually analyzed under relative humidity ≤50%, without converting them to consistent relative humidity.
In the future, with the development of atmospheric composition monitoring networks, more PM2.5 chemical composition data will be available. We continue to innovate methods to provide more accurate PM2.5 chemical composition data at a finer resolution and share with the community.
Acknowledgments
We thank the State Key Laboratory of Severe Weather & Key Laboratory of Atmospheric Chemistry of CMA, Chinese Academy of Meteorological Sciences (maintaining the CAWNET); Institute of Atmospheric Physics, Chinese Academy of Sciences (maintaining the CARE-China); Key Laboratory of Aerosol Chemistry and Physics, Institute of Earth Environment, Chinese Academy of Sciences; School of Atmospheric Sciences, Nanjing University (maintaining the SORPES); Chinese Research Academy of Environmental Sciences; Shanghai Environmental Monitoring Center; China National Environmental Monitoring Centre (maintaining the NACMON); Beijing Key Laboratory of Airborne Particulate Matter Monitoring Technology, Beijing Municipal Environmental Monitoring Center; Department of Environmental Science and Engineering, College of Architecture and Environment, Sichuan University; and SPARTAN Project for providing observation data to support our work.
Supporting Information Available
The Supporting Information is available free of charge at https://pubs.acs.org/doi/10.1021/acs.est.2c06510.
Spatial distribution of monitoring sites of PM2.5 and PM2.5 chemical composition, definition of key regions, soil texture information in the CMAQ model, comparisons of PM2.5 chemical composition between TAP, CMAQ, and reanalysis data, comprehensive evaluation of the WRF–CMAQ modeling system, and temporal trends of PM2.5 chemical composition in key regions (PDF)
Summary of PM2.5 chemical composition observations (XLS)
Author Contributions
G.G., Q.Z., and S.L. designed the research, and S.L. carried it out. Q.X. contributed to the TAP PM2.5 data processing. Y.Z. provided technical support for the WRF–CMAQ modeling system. X.L. and J.C. contributed to emission inventory preparation. S.L. and G.G. interpreted the results and prepared the paper with contributions from all co-authors.
This work was supported by the National Natural Science Foundation of China (42005135, 42007189, and 41921005).
The authors declare no competing financial interest.
Supplementary Material
References
- Ding K.; Huang X.; Ding A.; Wang M.; Su H.; Kerminen V. M.; Petäjä T.; Tan Z.; Wang Z.; Zhou D.; Sun J.; Liao H.; Wang H.; Carslaw K.; Wood R.; Zuidema P.; Rosenfeld D.; Kulmala M.; Fu C.; Pöschl U.; Cheng Y.; Andreae M. O. Aerosol-Boundary-Layer-Monsoon Interactions Amplify Semi-Direct Effect of Biomass Smoke on Low Cloud Formation in Southeast Asia. Nat. Commun. 2021, 12, 6416. 10.1038/s41467-021-26728-4. [DOI] [PMC free article] [PubMed] [Google Scholar]
- Jiang Y.; Yang X. Q.; Liu X.; Yang D.; Sun X.; Wang M.; Ding A.; Wang T.; Fu C. Anthropogenic Aerosol Effects on East Asian Winter Monsoon: The Role of Black Carbon-Induced Tibetan Plateau Warming. J. Geophys. Res. 2017, 122, 5883–5902. 10.1002/2016JD026237. [DOI] [Google Scholar]
- Daniel R.; Rosenfeld D.; Andreae M. O.; Asmi A.; Chin M.; Leeuw G.; Donovan D. P.; Kahn R.; Kinne S.; Kivekäs N.; Kulmala M.; Lau W.; Schmidt K. S.; Suni T.; Wagner T.; Wild M.; Quaas J. Global Observations of Aerosol-Cloud-Precipitation-Climate Interactions. Rev. Geophys. 2014, 52, 750–808. 10.1002/2013RG000441.Received. [DOI] [Google Scholar]
- An Z.; Huang R. J.; Zhang R.; Tie X.; Li G.; Cao J.; Zhou W.; Shi Z.; Han Y.; Gu Z.; Ji Y. Severe Haze in Northern China: A Synergy of Anthropogenic Emissions and Atmospheric Processes. Proc. Natl. Acad. Sci. U. S. A. 2019, 116, 8657–8666. 10.1073/pnas.1900125116. [DOI] [PMC free article] [PubMed] [Google Scholar]
- Zhang R.; Wang G.; Guo S.; Zamora M. L.; Ying Q.; Lin Y.; Wang W.; Hu M.; Wang Y. Formation of Urban Fine Particulate Matter. Chem. Rev. 2015, 115, 3803–3855. 10.1021/acs.chemrev.5b00067. [DOI] [PubMed] [Google Scholar]
- Kelly F. J.; Fussell J. C. Size, Source and Chemical Composition as Determinants of Toxicity Attributable to Ambient Particulate Matter. Atmos. Environ. 2012, 60, 504–526. 10.1016/j.atmosenv.2012.06.039. [DOI] [Google Scholar]
- Robinson D. L. Composition and Oxidative Potential of PM2.5 Pollution and Health. J. Thorac. Dis. 2017, 9, 444–447. 10.21037/jtd.2017.03.92. [DOI] [PMC free article] [PubMed] [Google Scholar]
- Krall J. R.; Mulholland J. A.; Russell A. G.; Balachandran S.; Winquist A.; Tolbert P. E.; Waller L. A.; Sarnat S. E. Associations between Source-Specific Fine Particulate Matter and Emergency Department Visits for Respiratory Disease in Four U.S Cities. Environ. Health Perspect. 2017, 125, 97–103. 10.1289/EHP271. [DOI] [PMC free article] [PubMed] [Google Scholar]
- Shi W.; Liu C.; Annesi-Maesano I.; Norback D.; Deng Q.; Huang C.; Qian H.; Zhang X.; Sun Y.; Wang T.; van Donkelaar A.; Martin R. V.; Zhang Y.; Li B.; Kan H.; Zhao Z. Ambient PM2.5 and Its Chemical Constituents on Lifetime-Ever Pneumonia in Chinese Children: A Multi-Center Study. Environ. Int. 2021, 146, 106176 10.1016/j.envint.2020.106176. [DOI] [PubMed] [Google Scholar]
- Ding A.; Huang X.; Nie W.; Chi X.; Xu Z.; Zheng L.; Xu Z.; Xie Y.; Qi X.; Shen Y.; Sun P.; Wang J.; Wang L.; Sun J.; Yang X. Q.; Qin W.; Zhang X.; Cheng W.; Liu W.; Pan L.; Fu C. Significant Reduction of PM2.5 in Eastern China Due to Regional-Scale Emission Control: Evidence from SORPES in 2011-2018. Atmos. Chem. Phys. 2019, 19, 11791–11801. 10.5194/acp-19-11791-2019. [DOI] [Google Scholar]
- Zhai S.; Jacob D. J.; Wang X.; Liu Z.; Wen T.; Shah V.; Li K.; Moch J. M.; Bates K. H.; Song S.; Shen L.; Zhang Y.; Luo G.; Yu F.; Sun Y.; Wang L.; Qi M.; Tao J.; Gui K.; Xu H.; Zhang Q.; Zhao T.; Wang Y.; Lee H. C.; Choi H.; Liao H. Control of Particulate Nitrate Air Pollution in China. Nat. Geosci. 2021, 14, 389–395. 10.1038/s41561-021-00726-z. [DOI] [Google Scholar]
- Lang J.; Zhang Y.; Zhou Y.; Cheng S.; Chen D.; Guo X.; Chen S.; Li X.; Xing X.; Wang H. Trends of PM2.5 and Chemical Composition in Beijing, 2000-2015. Aerosol Air Qual. Res. 2017, 17, 412–425. 10.4209/aaqr.2016.07.0307. [DOI] [Google Scholar]
- Gao M.; Yang Y.; Liao H.; Zhu B.; Zhang Y.; Liu Z.; Lu X.; Wang C.; Zhou Q.; Wang Y.; Zhang Q.; Carmichael G. R.; Hu J. Reduced Light Absorption of Black Carbon (BC) and Its Influence on BC-Boundary-Layer Interactions during APEC Blue. Atmos. Chem. Phys. 2021, 21, 11405–11421. 10.5194/acp-21-11405-2021. [DOI] [Google Scholar]
- Geng G.; Xiao Q.; Liu S.; Liu X.; Cheng J.; Zheng Y.; Xue T.; Tong D.; Zheng B.; Peng Y.; Huang X.; He K.; Zhang Q. Tracking Air Pollution in China: Near Real-Time PM2.5 Retrievals from Multisource Data Fusion. Environ. Sci. Technol. 2021, 55, 12106–12115. 10.1021/acs.est.1c01863. [DOI] [PubMed] [Google Scholar]
- Xin J.; Wang Y.; Pan Y.; Ji D.; Liu Z.; Wen T.; Wang Y.; Li X.; Sun Y.; Sun J.; Wang P.; Wang G.; Wang X.; Cong Z.; Song T.; Hu B.; Wang L.; Tang G.; Gao W.; Guo Y.; Miao H.; Tian S.; Wang L. The Campaign on Atmospheric Aerosol Research Network of China: CARE-China. Bull. Am. Meteorol. Soc. 2015, 96, 1137–1155. 10.1175/BAMS-D-14-00039.1. [DOI] [Google Scholar]
- Dao X.; Lin Y. C.; Cao F.; Di S. Y.; Hong Y.; Xing G.; Li J. J.; Fu P.; Zhang Y. L. Introduction to the National Aerosol Chemical Composition Monitoring Network of China Objectives, Current Status, and Outlook. Bull. Am. Meteorol. Soc. 2019, 100, ES337–ES351. 10.1175/BAMS-D-18-0325.1. [DOI] [Google Scholar]
- Zhang X. Y.; Wang Y. Q.; Niu T.; Zhang X. C.; Gong S. L.; Zhang Y. M.; Sun J. Y. Atmospheric Aerosol Compositions in China: Spatial/Temporal Variability, Chemical Signature, Regional Haze Distribution and Comparisons with Global Aerosols. Atmos. Chem. Phys. 2012, 12, 779–799. 10.5194/acp-12-779-2012. [DOI] [Google Scholar]
- Snider G.; Weagle C. L.; Murdymootoo K. K.; Ring A.; Ritchie Y.; Stone E.; Walsh A.; Akoshile C.; Anh N. X.; Balasubramanian R.; Brook J.; Qonitan F. D.; Dong J.; Griffith D.; He K.; Holben B. N.; Kahn R.; Lagrosas N.; Lestari P.; Ma Z.; Misra A.; Norford L. K.; Quel E. J.; Salam A.; Schichtel B.; Segev L.; Tripathi S.; Wang C.; Yu C.; Zhang Q.; Zhang Y.; Brauer M.; Cohen A.; Gibson M. D.; Liu Y.; Martins J. V.; Rudich Y.; Martin R. V. Variation in Global Chemical Composition of PM2.5: Emerging Results from SPARTAN. Atmos. Chem. Phys. 2016, 16, 9629–9653. 10.5194/acp-16-9629-2016. [DOI] [Google Scholar]
- Snider G.; Weagle C. L.; Martin R. V.; Van Donkelaar A.; Conrad K.; Cunningham D.; Gordon C.; Zwicker M.; Akoshile C.; Artaxo P.; Anh N. X.; Brook J.; Dong J.; Garland R. M.; Greenwald R.; Griffith D.; He K.; Holben B. N.; Kahn R.; Koren I.; Lagrosas N.; Lestari P.; Ma Z.; Vanderlei Martins J.; Quel E. J.; Rudich Y.; Salam A.; Tripathi S. N.; Yu C.; Zhang Q.; Zhang Y.; Brauer M.; Cohen A.; Gibson M. D.; Liu Y. SPARTAN: A Global Network to Evaluate and Enhance Satellite-Based Estimates of Ground-Level Particulate Matter for Global Health Applications. Atmos. Meas. Tech. 2015, 8, 505–521. 10.5194/amt-8-505-2015. [DOI] [Google Scholar]
- Yao X.; Shairsingh K.; Lam P. H.; Evans G. J. Underestimation of Sulfate Concentration in PM2.5 Using a Semi-Continuous Particle Instrument Based on Ion Chromatography. J. Environ. Monit. 2009, 11, 1292–1297. 10.1039/b819630c. [DOI] [PubMed] [Google Scholar]
- Kokhanovsky A. A.; de Leeuw G.. Satellite Aerosol Remote Sensing over Land; Springer, 2009. [Google Scholar]
- Liu C.; Chung C. E.; Yin Y.; Schnaiter M. The Absorption Ångström Exponent of Black Carbon: From Numerical Aspects. Atmos. Chem. Phys. 2018, 18, 6259–6273. 10.5194/acp-18-6259-2018. [DOI] [Google Scholar]
- Wamsley P. R.; Weimer C. S.; Applegate J. T.; Hunt B. CALIPSO: Polarization Performance of a Space-Based, Backscatter LIDAR. Opt. Info Base Conf. Pap. 2007, 4893, 61001. 10.1364/ls.2007.ltuk4. [DOI] [Google Scholar]
- Liu Y.; Koutrakis P.; Kahn R.; Turquety S.; Yantosca R. M. Estimating Fine Particulate Matter Component Concentrations and Size Distributions Using Satellite-Retrieved Fractional Aerosol Optical Depth: Part 2- A Case Study. J. Air Waste Manag. Assoc. 2007, 57, 1360–1369. 10.3155/1047-3289.57.11.1360. [DOI] [PubMed] [Google Scholar]
- Meng X.; Garay M. J.; Diner D. J.; Kalashnikova O. V.; Xu J.; Liu Y. Estimating PM2.5 Speciation Concentrations Using Prototype 4.4 km-Resolution MISR Aerosol Properties over Southern California. Atmos. Environ. 2018, 181, 70–81. 10.1016/j.atmosenv.2018.03.019. [DOI] [PMC free article] [PubMed] [Google Scholar]
- Meng X.; Hand J. L.; Schichtel B. A.; Liu Y. Space-Time Trends of PM2.5 Constituents in the Conterminous United States Estimated by a Machine Learning Approach, 2005–2015. Environ. Int. 2018, 121, 1137–1147. 10.1016/j.envint.2018.10.029. [DOI] [PubMed] [Google Scholar]
- Geng G.; Meng X.; He K.; Liu Y. Random Forest Models for PM2.5 Speciation Concentrations Using MISR Fractional AODs. Environ. Res. Lett. 2020, 15, 034056 10.1088/1748-9326/ab76df. [DOI] [Google Scholar]
- Randles C. A.; da Silva A. M.; Buchard V.; Colarco P. R.; Darmenov A.; Govindaraju R.; Smirnov A.; Holben B.; Ferrare R.; Hair J.; Shinozuka Y.; Flynn C. J. The MERRA-2 Aerosol Reanalysis, 1980 Onward. Part I: System Description and Data Assimilation Evaluation. J. Clim. 2017, 30, 6823–6850. 10.1175/JCLI-D-16-0609.1. [DOI] [PMC free article] [PubMed] [Google Scholar]
- Inness A.; Ades M.; Agustí-Panareda A.; Barr J.; Benedictow A.; Blechschmidt A. M.; Jose Dominguez J.; Engelen R.; Eskes H.; Flemming J.; Huijnen V.; Jones L.; Kipling Z.; Massart S.; Parrington M.; Peuch V. H.; Razinger M.; Remy S.; Schulz M.; Suttie M. The CAMS Reanalysis of Atmospheric Composition. Atmos. Chem. Phys. 2019, 19, 3515–3556. 10.5194/acp-19-3515-2019. [DOI] [Google Scholar]
- Jin C.; Wang Y.; Li T.; Yuan Q. Global Validation and Hybrid Calibration of CAMS and MERRA-2 PM2.5 Reanalysis Products Based on Open AQ Platform. Atmos. Environ. 2022, 274, 118972 10.1016/j.atmosenv.2022.118972. [DOI] [Google Scholar]
- Ali A.; Bilal M.; Wang Y.; Nichol J. E.; Mhawish A.; Qiu Z.; de Leeuw G.; Zhang Y.; Zhan Y.; Liao K.; Almazroui M.; Dambul R.; Shahid S.; Islam M. N. Accuracy Assessment of CAMS and MERRA-2 Reanalysis PM 2.5 and PM 10 Concentrations over China. Atmos. Environ. 2022, 288, 119297 10.1016/j.atmosenv.2022.119297. [DOI] [Google Scholar]
- Ma J.; Xu J.; Qu Y. Evaluation on the Surface PM2.5 Concentration over China Mainland from NASA’s MERRA-2. Atmos. Environ. 2020, 237, 117666 10.1016/j.atmosenv.2020.117666. [DOI] [Google Scholar]
- He L.; Lin A.; Chen X.; Zhou H.; Zhou Z.; He P. Assessment of MERRA-2 Surface PM2.5 over the Yangtze River Basin: Ground-Based Verification, Spatiotemporal Distribution and Meteorological Dependence. Remote Sens. 2019, 11, 460. 10.3390/rs11040460. [DOI] [Google Scholar]
- Philip S.; Martin R. V.; Van Donkelaar A.; Lo J. W. H.; Wang Y.; Chen D.; Zhang L.; Kasibhatla P. S.; Wang S.; Zhang Q.; Lu Z.; Streets D. G.; Bittman S.; Macdonald D. J. Global Chemical Composition of Ambient Fine Particulate Matter for Exposure Assessment. Environ. Sci. Technol. 2014, 48, 13060–13068. 10.1021/es502965b. [DOI] [PMC free article] [PubMed] [Google Scholar]
- Geng G.; Zhang Q.; Tong D.; Li M.; Zheng Y.; Wang S.; He K. Chemical Composition of Ambient PM2. 5 over China and Relationship to Precursor Emissions during 2005-2012. Atmos. Chem. Phys. 2017, 17, 9187–9203. 10.5194/acp-17-9187-2017. [DOI] [Google Scholar]
- Van Donkelaar A.; Martin R. V.; Li C.; Burnett R. T. Regional Estimates of Chemical Composition of Fine Particulate Matter Using a Combined Geoscience-Statistical Method with Information from Satellites, Models, and Monitors. Environ. Sci. Technol. 2019, 53, 2595–2611. 10.1021/acs.est.8b06392. [DOI] [PubMed] [Google Scholar]
- Geng G.; Xiao Q.; Zheng Y.; Tong D.; Zhang Y.; Zhang X.; Zhang Q.; He K.; Liu Y. Impact of China’s Air Pollution Prevention and Control Action Plan on PM2.5 Chemical Composition over Eastern China. Sci. China Earth Sci. 2019, 62, 1872–1884. 10.1007/s11430-018-9353-x. [DOI] [Google Scholar]
- Xiao Q.; Zheng Y.; Geng G.; Chen C.; Huang X.; Che H.; Zhang X.; He K.; Zhang Q. Separating Emission and Meteorological Contributions to Long-Term PM2.5trends over Eastern China during 2000-2018. Atmos. Chem. Phys. 2021, 21, 9475–9496. 10.5194/acp-21-9475-2021. [DOI] [Google Scholar]
- Xiao Q.; Geng G.; Cheng J.; Liang F.; Li R.; Meng X.; Xue T.; Huang X.; Kan H.; Zhang Q.; He K. Evaluation of Gap-Filling Approaches in Satellite-Based Daily PM2.5 Prediction Models. Atmos. Environ. 2021, 244, 117921 10.1016/j.atmosenv.2020.117921. [DOI] [Google Scholar]
- Dong X.; Fu J. S.; Huang K.; Tong D.; Zhuang G. Model Development of Dust Emission and Heterogeneous Chemistry within the Community Multiscale Air Quality Modeling System and Its Application over East Asia. Atmos. Chem. Phys. 2016, 16, 8157–8180. 10.5194/acp-16-8157-2016. [DOI] [Google Scholar]
- Zeng Y.; Wang M.; Zhao C.; Chen S.; Liu Z.; Huang X.; Gao Y. WRF-Chem v3.9 Simulations of the East Asian Dust Storm in May 2017: Modeling Sensitivities to Dust Emission and Dry Deposition Schemes. Geosci. Model Dev. 2020, 13, 2125–2147. 10.5194/gmd-13-2125-2020. [DOI] [Google Scholar]
- Wu C.; Lin Z. Impact of Two Different Dust Emission Schemes on the Simulation of a Severe Dust Storm in East Asia Using the WRF/Chem Model. Clim. Environ. Res. 2014, 19, 419–436. 10.3878/j.issn.1006-9585.2013.13041. [DOI] [Google Scholar]
- Foroutan H.; Young J.; Napelenok S.; Ran L.; Appel K. W.; Gilliam R. C.; Pleim J. E. Development and Evaluation of a Physics-based Windblown Dust Emission Scheme Implemented in the CMAQ Modeling System. J. Adv. Model. Earth Syst. 2017, 9, 585–608. 10.1002/2016MS000823. [DOI] [PMC free article] [PubMed] [Google Scholar]
- Cao J. J.; Shen Z. X.; Chow J. C.; Watson J. G.; Lee S. C.; Tie X. X.; Ho K. F.; Wang G. H.; Han Y. M. Winter and Summer PM2.5 Chemical Compositions in Fourteen Chinese Cities. J. Air Waste Manag. Assoc. 2012, 62, 1214–1226. 10.1080/10962247.2012.701193. [DOI] [PubMed] [Google Scholar]
- Elser M.; Huang R. J.; Wolf R.; Slowik J. G.; Wang Q.; Canonaco F.; Li G.; Bozzetti C.; Daellenbach K. R.; Huang Y.; Zhang R.; Li Z.; Cao J.; Baltensperger U.; El-Haddad I.; André P. New Insights into PM2.5 Chemical Composition and Sources in Two Major Cities in China during Extreme Haze Events Using Aerosol Mass Spectrometry. Atmos. Chem. Phys. 2016, 16, 3207–3225. 10.5194/acp-16-3207-2016. [DOI] [Google Scholar]
- Qiao B.; Chen Y.; Tian M.; Wang H.; Yang F.; Shi G.; Zhang L.; Peng C.; Luo Q.; Ding S. Characterization of Water Soluble Inorganic Ions and Their Evolution Processes during PM2.5 Pollution Episodes in a Small City in Southwest China. Sci. Total Environ. 2019, 650, 2605–2613. 10.1016/j.scitotenv.2018.09.376. [DOI] [PubMed] [Google Scholar]
- Wang H.; Tian M.; Chen Y.; Shi G.; Liu Y.; Yang F.; Zhang L.; Deng L.; Yu J.; Peng C.; Cao X. Seasonal Characteristics, Formation Mechanisms and Source Origins of PM2.5 in Two Megacities in Sichuan Basin, China. Atmos. Chem. Phys. 2018, 18, 865–881. 10.5194/acp-18-865-2018. [DOI] [Google Scholar]
- Wang Y.; Li W.; Gao W.; Liu Z.; Tian S.; Shen R.; Ji D.; Wang S.; Wang L.; Tang G.; Song T.; Cheng M.; Wang G.; Gong Z.; Hao J.; Zhang Y. Trends in Particulate Matter and Its Chemical Compositions in China from 2013–2017. Sci. China Earth Sci. 2019, 62, 1857–1871. 10.1007/s11430-018-9373-1. [DOI] [Google Scholar]
- Wang Z.; Zhang D.; Li X.; Li Y.; Chen T.; Liu B.; Li L.; Nie T.; Pan L. Multi-Method Observation and Numerical Simulation of a Pm2.5 Pollution Episode in Beijing in October, 2014. Aerosol Air Qual. Res. 2016, 16, 1403–1415. 10.4209/aaqr.2015.09.0532. [DOI] [Google Scholar]
- Wang Z.; Zhang D.; Liu B.; Li Y.; Chen T.; Sun F.; Yang D.; Liang Y.; Chang M.; Yang L.; Lin A. Analysis of Chemical Characteristics of PM2.5 in Beijing over a 1-Year Period. J. Atmos. Chem. 2016, 73, 407–425. 10.1007/s10874-016-9334-8. [DOI] [Google Scholar]
- Yao L.; Huo J.; Wang D.; Fu Q.; Sun W.; Li Q.; Chen J. Online Measurement of Carbonaceous Aerosols in Suburban Shanghai during Winter over a Three-Year Period: Temporal Variations, Meteorological Effects, and Sources. Atmos. Environ. 2020, 226, 117408 10.1016/j.atmosenv.2020.117408. [DOI] [Google Scholar]
- Zhong Y.; Chen J.; Zhao Q.; Zhang N.; Feng J.; Fu Q. Temporal Trends of the Concentration and Sources of Secondary Organic Aerosols in PM2. 5 in Shanghai during 2012 and 2018. Atmos. Environ. 2021, 261, 118596 10.1016/j.atmosenv.2021.118596. [DOI] [Google Scholar]
- Zhang Q.; Zheng Y.; Tong D.; Shao M.; Wang S.; Zhang Y.; Xu X.; Wang J.; He H.; Liu W.; Ding Y.; Lei Y.; Li J.; Wang Z.; Zhang X.; Wang Y.; Cheng J.; Liu Y.; Shi Q.; Yan L.; Geng G.; Hong C.; Li M.; Liu F.; Zheng B.; Cao J.; Ding A.; Gao J.; Fu Q.; Huo J.; Liu B.; Liu Z.; Yang F.; He K.; Hao J. Drivers of Improved PM2.5 Air Quality in China from 2013 to 2017. Proc. Natl. Acad. Sci. U. S. A. 2019, 116, 24463–24469. 10.1073/pnas.1907956116. [DOI] [PMC free article] [PubMed] [Google Scholar]
- Zheng G. J.; Duan F. K.; Su H.; Ma Y. L.; Cheng Y.; Zheng B.; Zhang Q.; Huang T.; Kimoto T.; Chang D.; Pöschl U.; Cheng Y. F.; He K. B. Exploring the Severe Winter Haze in Beijing: The Impact of Synoptic Weather, Regional Transport and Heterogeneous Reactions. Atmos. Chem. Phys. 2015, 15, 2969–2983. 10.5194/acp-15-2969-2015. [DOI] [Google Scholar]
- Turpin B. J.; Lim H. J. Species Contributions to Pm2.5 Mass Concentrations: Revisiting Common Assumptions for Estimating Organic Mass. Aerosol Sci. Technol. 2001, 35, 602–610. 10.1080/02786820119445. [DOI] [Google Scholar]
- Global Modeling and Assimilation Office (GMAO). MERRA-2 tavg1_2d_aer_Nx: 2d,1-Hourly, Time-averaged, Single-Level, Assimilation, Aerosol Diagnostics V5.12.4.
- Li M.; Liu H.; Geng G.; Hong C.; Liu F.; Song Y.; Tong D.; Zheng B.; Cui H.; Man H.; Zhang Q.; He K. Anthropogenic Emission Inventories in China: A Review. Natl. Sci. Rev. 2017, 4, 834–866. 10.1093/nsr/nwx150. [DOI] [Google Scholar]
- Zheng B.; Tong D.; Li M.; Liu F.; Hong C.; Geng G.; Li H.; Li X.; Peng L.; Qi J.; Yan L.; Zhang Y.; Zhao H.; Zheng Y.; He K.; Zhang Q. Trends in China’s Anthropogenic Emissions since 2010 as the Consequence of Clean Air Actions. Atmos. Chem. Phys. 2018, 18, 14095–14111. 10.5194/acp-18-14095-2018. [DOI] [Google Scholar]
- Zheng B.; Zhang Q.; Geng G.; Chen C.; Shi Q.; Cui M.; Lei Y.; He K. Changes in China’s Anthropogenic Emissions and Air Quality during the COVID-19 Pandemic in 2020. Earth Syst. Sci. Data 2021, 13, 2895–2907. 10.5194/essd-13-2895-2021. [DOI] [Google Scholar]
- Shao Y.; Ishizuka M.; Mikami M.; Leys J. F. Parameterization of Size-Resolved Dust Emission and Validation with Measurements. J. Geophys. Res. Atmos. 2011, 116, 1–19. 10.1029/2010JD014527. [DOI] [Google Scholar]
- Ginoux P.; Chin M.; Tegen I.; Prospero J. M.; Holben B.; Dubovik O.; Lin S.-J. Sources and Distributions of Dust Aerosols Simulated with the GOCART Model. J. Geophys Res. 2001, 106, 20255–20273. 10.1029/2000JD000053. [DOI] [Google Scholar]
- Marticorena B.; Bergametti G. Modeling the Atmospheric Dust Cycle: 1. Design of a Soil-Derived Dust Emission Scheme. J. Geophys. Res. 1995, 100, 16415. 10.1029/95jd00690. [DOI] [Google Scholar]
- Zheng B.; Zhang Q.; Zhang Y.; He K. B.; Wang K.; Zheng G. J.; Duan F. K.; Ma Y. L.; Kimoto T. Heterogeneous Chemistry: A Mechanism Missing in Current Models to Explain Secondary Inorganic Aerosol Formation during the January 2013 Haze Episode in North China. Atmos. Chem. Phys. 2015, 15, 2031–2049. 10.5194/acp-15-2031-2015. [DOI] [Google Scholar]
- Qiu X.; Ying Q.; Wang S.; Duan L.; Zhao J.; Xing J.; Ding D.; Sun Y.; Liu B.; Shi A.; Yan X.; Xu Q.; Hao J. Modeling the Impact of Heterogeneous Reactions of Chlorine on Summertime Nitrate Formation in Beijing, China. Atmos. Chem. Phys. 2019, 19, 6737–6747. 10.5194/acp-19-6737-2019. [DOI] [Google Scholar]
- Murphy B. N.; Woody M. C.; Jimenez J. L.; Carlton A. M. G.; Hayes P. L.; Liu S.; Ng N. L.; Russell L. M.; Setyan A.; Xu L.; Young J.; Zaveri R. A.; Zhang Q.; Pye H. O. T. Semivolatile POA and Parameterized Total Combustion SOA in CMAQv5.2: Impacts on Source Strength and Partitioning. Atmos. Chem. Phys. 2017, 17, 11107–11133. 10.5194/acp-17-11107-2017. [DOI] [PMC free article] [PubMed] [Google Scholar]
- Chen Q.; Fu T.-M.; Hu J.; Ying Q.; Zhang L. Modelling Secondary Organic Aerosols in China. Natl. Sci. Rev. 2017, 4, 806–809. 10.1093/nsr/nwx143. [DOI] [Google Scholar]
- Chang X.; Zhao B.; Zheng H.; Wang S.; Cai S.; Guo F.; Gui P.; Huang G.; Wu D.; Han L.; Xing J.; Man H.; Hu R.; Liang C.; Xu Q.; Qiu X.; Ding D.; Liu K.; Han R.; Robinson A. L.; Donahue N. M. Full-Volatility Emission Framework Corrects Missing and Underestimated Secondary Organic Aerosol Sources. One Earth 2022, 5, 403–412. 10.1016/j.oneear.2022.03.015. [DOI] [Google Scholar]
- Huang L.; Zhu Y.; Zhai H.; Xue S.; Zhu T.; Shao Y.; Liu Z.; Emery C.; Yarwood G.; Wang Y.; Fu J.; Zhang K.; Li L. Recommendations on Benchmarks for Numerical Air Quality Model Applications in China - Part 1: PM2.5 and Chemical Species. Atmos. Chem. Phys. 2021, 21, 2725–2743. 10.5194/acp-21-2725-2021. [DOI] [Google Scholar]
- Liu F.; Zhang Q.; Tong D.; Zheng B.; Li M.; Huo H.; He K. B. High-Resolution Inventory of Technologies, Activities, and Emissions of Coal-Fired Power Plants in China from 1990 to 2010. Atmos. Chem. Phys. 2015, 15, 13299–13317. 10.5194/acp-15-13299-2015. [DOI] [Google Scholar]
- Liu J.; Zheng Y.; Geng G.; Hong C.; Li M.; Li X.; Liu F.; Tong D.; Wu R.; Zheng B.; He K.; Zhang Q. Decadal Changes in Anthropogenic Source Contribution of PM2.5 Pollution and Related Health Impacts in China, 1990-2015. Atmos. Chem. Phys. 2020, 20, 7783–7799. 10.5194/acp-20-7783-2020. [DOI] [Google Scholar]
- Liu Q.; Liu D.; Gao Q.; Tian P.; Wang F.; Zhao D.; Bi K.; Wu Y.; Ding S.; Hu K.; Zhang J.; Ding D.; Zhao C. Vertical Characteristics of Aerosol Hygroscopicity and Impacts on Optical Properties over the North China Plain during Winter. Atmos. Chem. Phys. 2020, 20, 3931–3944. 10.5194/acp-20-3931-2020. [DOI] [Google Scholar]
- Ma Q.; Wu Y.; Zhang D.; Wang X.; Xia Y.; Liu X.; Tian P.; Han Z.; Xia X.; Wang Y.; Zhang R. Roles of Regional Transport and Heterogeneous Reactions in the PM2.5 Increase during Winter Haze Episodes in Beijing. Sci. Total Environ. 2017, 599-600, 246–253. 10.1016/j.scitotenv.2017.04.193. [DOI] [PubMed] [Google Scholar]
- Wang Z. F.; Li J.; Wang Z.; Yang W. Y.; Tang X.; Ge B. Z.; Yan P. Z.; Zhu L. L.; Chen X. S.; Chen H. S.; Wand W.; Li J. J.; Liu B.; Wang X. Y.; Wand W.; Zhao Y. L.; Lu N.; Su D. B. Modeling Study of Regional Severe Hazes over Mid-Eastern China in January 2013 and Its Implications on Pollution Prevention and Control. Sci. China Earth Sci. 2014, 57, 3–13. 10.1007/s11430-013-4793-0. [DOI] [Google Scholar]
- Yang K.; Dickerson R. R.; Carn S. A.; Ge C.; Wang J. First Observations of SO2 from the Satellite Suomi NPP OMPS: Widespread Air Pollution Events over China. Geophys. Res. Lett. 2013, 40, 4957–4962. 10.1002/grl.50952. [DOI] [Google Scholar]
- Zhang Q.; Streets D. G.; Carmichael G. R.; He K. B.; Huo H.; Kannari A.; Klimont Z.; Park I. S.; Reddy S.; Fu J. S.; Chen D.; Duan L.; Lei Y.; Wang L. T.; Yao Z. L. Asian Emissions in 2006 for the NASA INTEX-B Mission. Atmos. Chem. Phys. 2009, 9, 5131–5153. 10.5194/acp-9-5131-2009. [DOI] [Google Scholar]
Associated Data
This section collects any data citations, data availability statements, or supplementary materials included in this article.