

SUMMARY
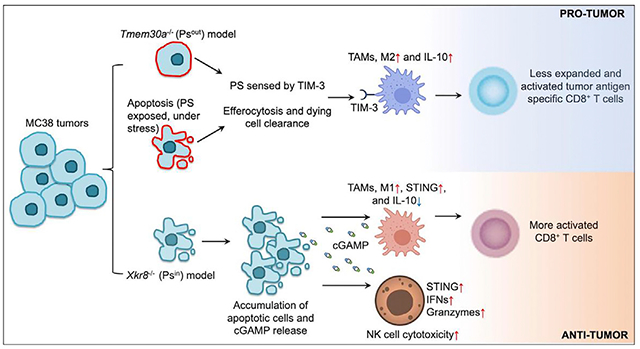
In “healthy” tumor cells, phosphatidylserine (PS) is predominately localized in the inner plasma membrane leaflet. During apoptosis, PS relocates to the outer leaflet. Herein, we established PSout tumor models with tumor cells lacking PS flippase component CDC50A, constantly exposing PS but alive. PSout tumors developed bigger than wild-type (WT) tumors, featuring M2 polarized tumor-associated macrophages (TAMs) and fewer tumor-antigen-specific T cells. The PS receptor TIM-3 is responsible for PS recognition. Employing an opposite tumor model, PSin, with tumor cells lacking the PS scramblase Xkr8 and unable to expose PS during otherwise normal apoptosis, we find that the accumulated apoptotic tumor cells produce and release cyclic GAMP (cGAMP) to immune cells to activate the STING pathway, leading to TAM M1 polarization, suppressed interleukin (IL)-10 secretion, and natural killer (NK) cell cytotoxicity. Silencing Xkr8 in vivo by either short hairpin RNA (shRNA) or small interfering RNA (siRNA) to achieve a PS externalization blockade provides robust therapeutic anti-tumor efficiency.
Graphical Abstract
In brief
Wang et al. show that externalized phosphatidylserine (PS) on cancer cells induces an immune-suppressive microenvironment to promote tumor growth, which is dependent on the PS receptor TIM-3. Blocking PS externalization by silencing the PS scramblase Xkr8 enhances anti-tumor immunity, suggesting Xkr8 as a potential therapeutic target.
INTRODUCTION
For most cancer patients, combination therapy is the norm. Some treatments, such as chemotherapy, radiotherapy, and the emerging immunotherapy, aim to kill cancer cells by engaging programmed cell death, mostly apoptosis. Even without any treatments, cancer cells may still die by apoptosis due to environmental stress, such as nutrition deprivations or immune surveillance. Cell death induction, of course, can remove cancer cells and shrink the tumors. Meanwhile, a dying/dead tumor cell can also display unwanted pro-tumor activities by interacting with its tumor microenvironments (TMEs). One such mechanism is via exhibiting the phospholipid phosphatidylserine (PS) to the outer leaflet of the plasma membrane (PM).
In a “healthy” cell, PS is predominately localized in the inner membrane leaflet. This asymmetry is actively maintained by flippases that translocate PS and other aminophospholipids from the extracellular to the cytoplasmic leaflet. Mammalian ATP11C, a type IV P-type ATPase, is one such flippase (Segawa et al., 2014). Other than that, human ATP8A2 and ATP11A can also function as PM flippases (Segawa et al., 2016). All these flippases require CDC50A (encoded by gene Tmem30a) for PM localization, proper expression, and folding. Biochemical analysis and cryoelectron microscopy structures revealed that CDC50A is also an essential structural component for P4-ATPase-based flippase (Hiraizumi et al., 2019; Segawa et al., 2018). During apoptosis, PS can be redistributed to the outer leaflet, via the action of the scramblase Xkr8, which is activated by caspases (Suzuki et al., 2013). Meanwhile, ATP11C and ATP11A are also inactivated by caspases’ cleavage (Segawa et al., 2014, 2016).
One reason that all apoptotic cells expose PS to outside is that PS can serve as an “eat-me” signal for phagocytosis by professional phagocytes (e.g., dendritic cells and macrophages), a process also called efferocytosis (Nagata, 2018). When PS is flipped out, the interaction between PS-exhibiting tumor cells and phagocytes elicits profound immunological suppression. This is a critical step for homeostasis maintenance (Boada-Romero et al., 2020). To facilitate an effective efferocytosis, professional phagocytes use numerous receptors that recognize PS, including TIM family members (TIM-1, −3, and −4), tyrosine kinase family members (Tyro3, Axl, and MerTK), Stablin-2, BAI1, SCARF1, and integrins (Nagata, 2018). Some of the PS receptors require extracellular bridge molecules to bind to PS, such as C1Q, MFG-E8, Gas6, Protein S, and glycoprotein-1. These receptors function together in two steps to facilitate macrophage efferocytosis, termed tethering and tickling (Somersan and Bhardwaj, 2001). TIM-4 is involved in tethering, and the PROS/GAS6-Tyro3, Axl, and MerTK tyrosine kinase receptor system is involved in tickling.
On the other hand, in the context of solid tumors, PS detection can contribute to shape a pro-tumor immune microenvironment. PS receptor deficiency often creates a more inflammatory TME. For example, efficient engulfment of dying cells by macrophages requires TIM-4 and TIM-4 deletion reduced the growth of metastatic B16F10 melanoma and engrafted Lewis lung carcinoma (LLC) (Cunha et al., 2018). Similarly, TIM-3 on dendritic cells, which could also bind to PS, restrains anti-tumor immunity by regulating inflammasome activation. Loss of TIM-3 on DCs—but not on CD4+ or CD8+ T cells—promotes strong anti-tumor immunity by allowing inflammasome action and interleukin (IL)-1β and −18 production (Dixon et al., 2021). Antibody blockade of the PS receptor MerTk on tumor-associated macrophages (TAMs) also enhances anti-tumor immunity (Zhou et al., 2020). However, due to PS receptor redundancy, this anti-cancer effect could be challenging.
Herein, we explored approaches to counteract the dark side of PS externalization. Note that all other previous studies regarding this topic is largely based on PS receptor conditional knockout (KO) or antibody blockade approaches. This may not be the ideal approach as many PS sensors have multiple ligands. For example, PS binding protein TIM-3 can also sense galectin 9, CEACAM1, and HMGB1 (Wolf et al., 2020). Integrins can sense lactadherin/MFGE8-bonded PS, but they can also bind to cytoskeleton, collagens, and laminins (Humphries et al., 2006). Different from the previous study, our tumor models in this study directly mobilize PS on the tumor cell PM surface. The results showed that direct PS externalization inhibition can stimulate a robust anti-tumor immunity and potentially serve as an anticancer immunotherapy. The immune stimulation provided by PS externalization blockade features natural killer (NK) cell cytotoxicity, tumor-derived cyclic GAMP (cGAMP)-host STING (stimulator of interferon genes) signaling, and TAM M1 polarization. We used lentiviral short hairpin RNA (shRNA) transduction or a nanoparticle small interfering RNA (siRNA) delivery technology to silence Xkr8 and achieve the PS externalization blockade, both of which exhibited promising therapeutic efficiency, as a single therapy or in combination with others. We believe our work is a solid demonstration of PS externalization blockade and Xkr8 targeting as a cancer immunotherapy.
RESULTS
The immune-suppressive role of PS in TMEs
We now recognize that PS asymmetry in healthy cells requires constant maintenance by the ATP-dependent flippase: the type IV P-type ATPase (e.g., ATP11c)/CDC50A complex (Hiraizumi et al., 2019; Segawa et al., 2014, 2018). The CDC50A-containing flippase complex constantly flips PS from the outer leaflet of PM back to inside and can be inactivated by apoptotic caspases via direct cleavage (Segawa et al., 2014). Hence, cells lacking ATP11c or CDC50A (encoded by gene Tmem30a) can continuously expose PS to the outer leaflet (similar to apoptosis), but without additional cell death or stress (Nagata, 2018).
We successfully ablated (via CRISPR/cas9) Tmem30a in MC38 colon adenocarcinoma cells (Figures 1A and 1B). As Tmem30a−/− cells always scramble PS on the outer leaflet, we refer to these cells as PSout cells. We noticed that, in immune-competent animals (C57BL/6J, two independent PSout clones), flank implanted tumors with Tmem30a−/− PSout cells developed more quickly than parental WT cells (Figures 1C–1F and S1A). Since the two clones behaved similarly in tumor growth, we used clone #1 for the further investigations. Note that in immune-deficient animals (Rag1−/−, Batf3−/−, and NSG), all cells developed tumors in the same way (Figures 1G–1I and S1B–S1D). When we implanted the WT and PSout tumor cells on both sides of the same animal, we found that PSout tumor from one side would not affect the WT tumor growth on the other side, indicating that the impacts of PS in TMEs were most likely to be local, rather than whole body (Figure S1E). We also found that, like WT MC38 tumors, PSout tumors also responded to anti-programmed cell death protein 1 (PD-1) checkpoint blockade (Figures S1F and S1G). We found these models ideal to decipher the role of PS in the TMEs.
Figure 1. KO of Tmem30a in MC38 cells (PSout) led to PS externalization and enhanced tumor growth.
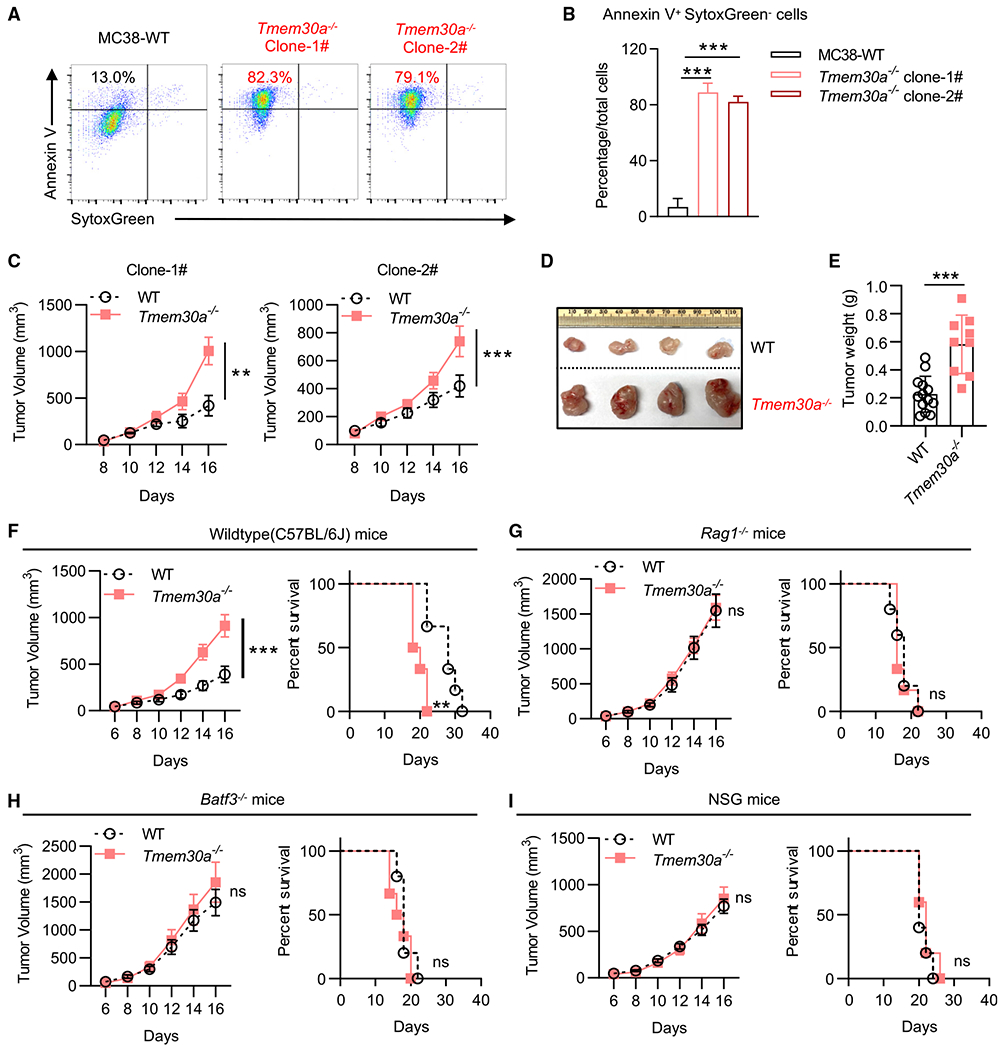
(A and B) PS externalization on viable WT and Tmem30a−/− MC38 cells. Cells were stained with SytoxGreen and Annexin V.
(C) Tumor growth of two independent Tmem30a−/− MC38 clones compared with WT MC38 cells in C57BL/6J mice (n = 5 for mice in each group).
(D) Representative images of tumors at the endpoint (day 16) of (C).
(E) Tumor weights at the endpoint (day 16) of (C).
(F–I) Tumor growth and animal survival of Tmem30a−/− and WT MC38 in C57BL/6J (F), Rag1−/− mice (G), Batf3−/− mice (H), and NSG mice (I). Mice were sacrificed when the tumors reached greater than 2,000 mm3 (n = 10 for WT cells in C57BL/6J mice, n = 9 for Tmem30a−/− cells in C57BL/6J mice; n = 11 for WT cells in Rag1−/− mice, n = 12 for Tmem30a−/− cells in Rag1−/− mice; n = 5 for WT cells in Batf3−/− mice, n = 6 for Tmem30a−/− cells in Batf3−/− mice; n = 5 for WT cells in NSG mice, n = 5 for Tmem30a−/− cells in NSG mice). Tmem30a−/− clone #1 cells were used for these figures. Tumor volumes were analyzed with two-way ANOVA, and survival was analyzed with log rank (Mantel-Cox) test. Annexin V+ data were analyzed with unpaired t test. Data were representative of at least two independent experiments. Data represent mean ± SEM. ns, no significant difference; *p < 0.05; **p < 0.01; ***p < 0.001.
We first characterized the immune cell subsets in the Tmem30a−/− PSout TMEs, including TAMs, myeloid-derived suppressor cells (MDSCs), CD4+ and CD8+ T cells, and other subsets (Figures 2A–2G and S2A). Our data suggested that TMEs with Tmem30a−/− PSout cells showed increased TAMs that lacked major histocompatibility complex (MHC) II expression (Figures 2H–2K). RNA sequencing (RNA-seq) analysis of these TAMs revealed that almost all class I and II MHC subunits were downregulated in PSout TAMs (Figure 2L). TAMs in PSout TMEs also showed higher M2 (CD206, CD163, Arg1, and Chil3) and lower M1 marker (GPBs), by fluorescence-activated cell sorting (FACS) staining, qPCR, and RNA-seq (Figures 2L–2Q). We also found more PMN-MDSCs in PSout TMEs but not Mo-MDSCs (Figures 2F and 2G). However, only the latter subset showed lower CD86 expression levels (Figures S2B–S2F).
Figure 2. Immuno-profiling revealed an overall immune-suppressive TME in Tmem30−/− (PSout) tumors.
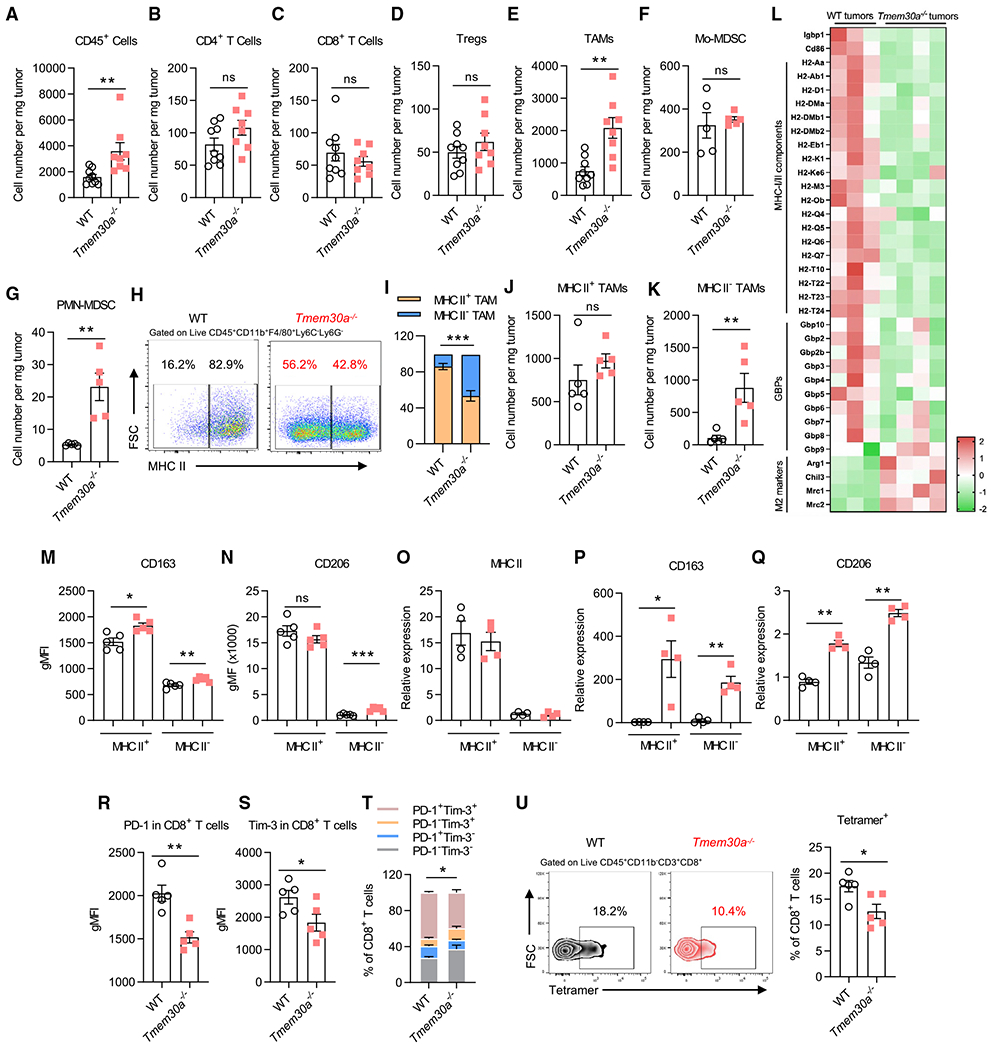
(A–G) Flow cytometry quantitative analysis of TILs at the endpoint (day 16). Shown are no infiltrating differences in CD45+CD11b−CD3+CD4+ T cells (B), CD45+CD11b−CD3+CD8+ T cells (C), CD45+CD11b−CD3+CD4+CD25+ Foxp3+ Tregs (D), and CD45+CD11b+ Ly6G−Ly6C+ Mo-MDSC (F); but more infiltrating cells in CD45+CD11b+Ly6G−Ly6C−F4/80 TAMs (E) and CD45+CD11b+Ly6C−Ly6G+ PMN-MDSC (G).
(H) Representative flow plots of MHC II expression in TAMs.
(I) Flow cytometry analysis of MHC II+ and MHC II− TAM distribution (n = 5).
(J and K) Flow cytometry quantitative analysis of MHC II+ and MHC II− TAMs (n = 5).
(L) RNA-seq analysis of sorted TAMs in WT or PSout (Tmem30−/−) TMEs. Shown is the Z score of gene expression (n = 4 for PSout and n = 3 for WT).
(M and N) Geometric mean fluorescence intensity (gMFI) of CD163 (M) and CD206 (N) shows higher expression on TAMs (n = 5).
(O–Q) qPCR analysis of MHC II, CD163, and CD206 in MHC II+ and MHC II− TAMs from both MC38-WT and Tmem30a−/− TMEs (n = 4).
(R and S) gMFI of PD-1 (R) and Tim-3 (S) shows lower expression on CD8+T cells (n = 5).
(T) Flow cytometry analysis of PD-1 and TIM-3 CD8+ T cell distribution (n = 5).
(U) Representative flow plots and analysis of tetramer+ in CD8+ T cells (n = 5). Data were representative of at least two independent experiments (except RNAseq). Data represent mean ± SEM and were analyzed with unpaired t test. Ns, no significant difference; *p < 0.05; **p < 0.01; ***p < 0.001. Tmem30a−/− clone #1 cells were used for these figures.
Besides the myeloid cells, we also observed a significant difference of tumor-infiltrating T cells in WT and PSout TMEs. Although we did not observe CD4+, CD8+, and regulatory T cell (Treg) infiltration difference in both TMEs (Figures 2B–2D), we found PD-1 and TIM-3 to be lower in CD8+ but not in CD4+ T cells (Figures 2R–2T, S2G, and S2H). A larger fraction (gray bar in Figure 2T) of PD-1− and TIM-3− CD8+ T cells (but not of CD4+; Figures S2G–S2I) were present in PSout TMEs. A closer look revealed that PD-1 and TIM-3 (but not CD69) was lower specifically in CD44hiCD62LLoCD8+ T cells but not in CD44hi CD62LHi CD8+ T cells in Tmem30a−/− PSout TMEs (Figures S2J and S2K). Using p15e tetramer staining, we found tumor-antigen-specific CD8+ T cells were less expanded in PSout TMEs (Figure 2U). In those tetramer-positive CD8+ T cells, we found no difference in tumor necrosis factor (TNF) α, granzyme B, and TCF1 (Figures S2L–S2N). We also analyzed other T cell-related markers by FACS (Figures S2O–S2Q). We did not see a robust difference between WT and PSout TMEs.
Altogether, we found that Tmem30a−/− PSout tumors could create an overall immune-suppressive microenvironment, especially featuring M2-like macrophages, and a less expanded/activated tumor-antigen-specific CD8+ T cell subset.
TIM-3 is the receptor primarily functioning in PS sensing
PS has many immune receptors, including TIM family members TIM-1, −3, and −4; tyrosine kinase family members Tyro3, Axl, and MerTK; Stablin-2; BAI1; SCARF1; and integrins (Nagata, 2018). Some of them require bridge molecules to bind to PS, such as C1Q, MFG-E8, Gas6, protein S, and glycoprotein-1. Employing Havcr2−/− (the gene that encodes TIM-3) and Timd4−/− (the gene that encodes TIM-4) animals, we found Havcr2−/− could largely reverse the immune suppression of PSout tumors, shown by constraining PSout tumor growth to WT tumor level, while Timd4−/− showed barely any effects (Figures 3A–3D, S3A, and S3B). Via analyzing the PSout TMEs in both WT or Havcr2−/− animals, we found that, although similar numbers of TAMs were infiltrated into tumors in both genotypes, the MHC II expression deficiency on TAMs and the intratumoral frequency of the tumor-antigen-specific CD8+ T cell were rescued when implanting PSout tumors on Havcr2−/− animals (Figures 3E–3G).
Figure 3. TIM-3 rather than TIM-4 sensing PS to mediate immune suppression.
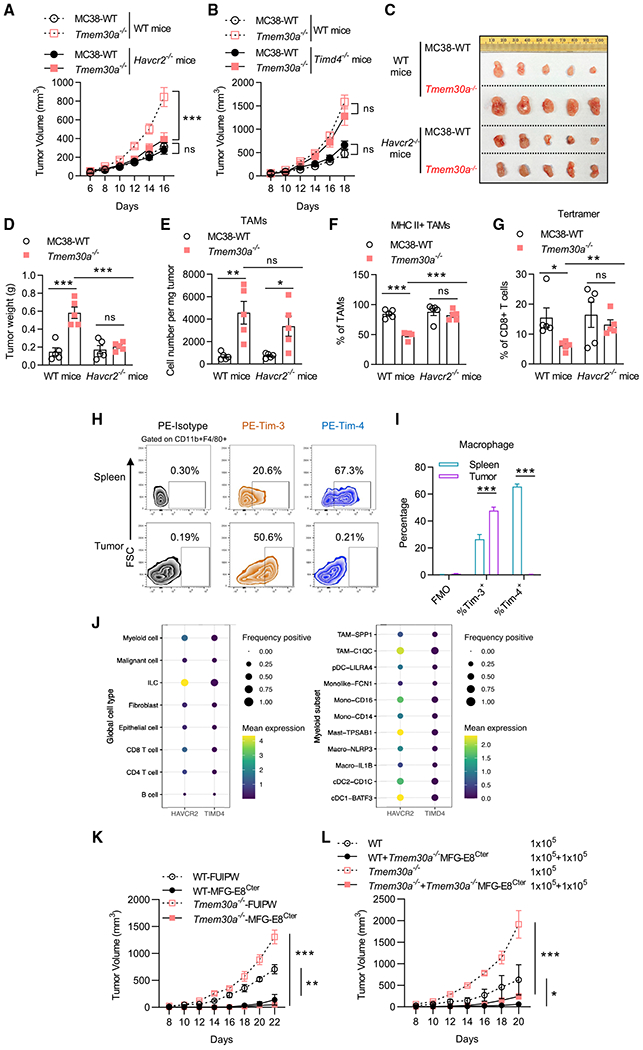
(A) Tumor growth of Tmem30a−/− and WT MC38 tumors in C57BL/6J and Havcr2−/− mice. n = 10 for WT MC38 tumors in C57BL/6J, n = 10 for Tmem30a−/− tumors in C57BL/6J; n = 9 for WT MC38 tumors in Havcr2−/− mice, n = 12 for Tmem30a−/− tumors in Havcr2−/− mice.
(B) Tumor growth of Tmem30a−/− and WT MC38 tumors in C57BL/6J and Timd4−/− mice. n = 5 for WT MC38 tumors, n = 8 for Tmem30a−/− tumors, for both genotypes.
(C) Representative images of tumors at the endpoint (day 16) of (A).
(D) Weight of tumors at the endpoint (day 16) of (A), n = 5.
(E) Flow cytometry analysis of TAMs of (A).
(F) Flow cytometry analysis of MHC II+ TAM infiltration of (A).
(G) Flow cytometry analysis of p15e tetramer+ in CD8+ T cells of (A).
(H and I) Representative flow plots and flow analysis of TIM-3 and TIM-4 staining in macrophages isolated from either spleen or tumor from MC38 tumor-bearing mice (n = 3).
(J) Analysis of public human colon cancer patients’ tumor sample scRNA-seq data (GSE146771) revealed that TIM-3, but not TIM-4, dominantly expressed on the myeloid TILs. The mean expression value for each gene in various TIL subsets is represented by color, and the percentage of cells with TIM-3 or TIM-4 positivity is represented by the size. The positivity was defined as at least one mRNA read detected in each single cell.
(K) Tumor growth of WT or Tmem30a−/− cells ± secreted C-terminal MFG-E8 (MFG-E8Cter, stable expression of a secreted form of C1C2 domain, control is with FUIPW empty vector) implanted on C57BL/6 mice. n = 5 for mice in each group.
(L) 1 × 10⁵ WT cells or Tmem30a−/− cells ± (mixed with) 1 × 10⁵ MFG-E8Cter expressing Tmem30a−/− MC38 cells were subcutaneously (s.c.) implanted on C57BL/6 mice and tumor growth was monitored. n = 4 for mice in each group. Tumor volumes were analyzed with two-way ANOVA. Column data were analyzed with unpaired t test. Data are representative of at least two independent experiments. Data represent mean ± SEM. ns, no significant difference; *p < 0.05; **p < 0.01; ***p < 0.001. Tmem30a−/− clone #1 cells were used for these figures.
The data suggested that TIM-3 rather than TIM-4 was responsible for PS sensing in PSout TMEs. This is unexpected as it is the TIM-4-deficient macrophages that lost the capability to engulf dying cells (Martinez et al., 2011). Additionally, TIM-3 has ~50% lower PS-binding affinity than TIM-4 (DeKruyff et al., 2010). However, by analyzing TIM-3 and TIM-4 expressions on either TAMs or spleen macrophages from the MC38 tumor-bearing mice, we found that TAMs did not express TIM-4 (Figures 3H and 3I). Our conclusion was further supported by the analysis of public single-cell RNA-seq data from colon cancer (Zhang et al., 2020) and head and neck cancer patients (Cillo et al., 2020). In colon cancer, we found that, among all tumor-infiltrating lymphocytes (TILs), TIM-3 was mainly expressed in innate lymphoid cells (ILCs), myeloid cells, and T cell subsets, while TIM-4 expression level was low in all subsets (Figure 3J). A closer look showed that, in almost all tumor-associated myeloid subsets, including macrophages, dendritic cells (DCs), and monocytes (mono), TIM-3 expression levels were higher than TIM-4 levels. Data from head and neck cancer patients also revealed that TIM-3 was highly upregulated in TILs, while TIM-4 was barely expressed there (Figures S3C and S3D). Further, given that the cytoplasmic region of TIM-4 is very short, only 42 amino acids, and the cytoplasmic domain is dispensable for efferocytosis (Park et al., 2009), it is less likely that TIM-4 itself could transduce the immune regulatory signal, other than functioning in efferocytosis (Nagata, 2018). Taken together, TIM-3, rather than TIM-4, is the primary receptor for PS sensing in TMEs.
Verifying the role of TIM-3 as the PS receptor for Tmem30a−/− PSout tumors also strengthens the conclusion that the immune suppression in Tmem30a−/− PSout TMEs came from the PS molecule exhibited on those KO cells, rather than other unknown alterations that happened with Tmem30a depletion. To further solidify this conclusion, we took advantage of another PS-binding molecule, MFG-E8. MFG-E8 is a bridge molecule between PS and immune receptors, such as integrins. The 319-aa MFG-E8 C-terminal (MFG-E8Cter) C1C2 domain (or just the 158-aa C2 domain) is sufficient to bind PS with a Kd < 10 nM (Andersen et al., 2000). Unlike annexins and TIMs, MFG-E8Cter-PS binding is Ca2+ independent. The MFG-E8Cter truncation also prevents MFG-E8 from binding to other possible immune receptors (which bind to its MFG-E8 N-ter EGF1/2 domains). Thus, the MFG-E8Cter can capture and saturate the PS molecules from all sources, without sending PS signals to immune suppression pathways. Based on these properties of MFG-E8, we forced tumor cells to express and secrete the MFG-E8Cter (C1C2 domain) to TMEs by adding a secretory signal peptide to MFG-E8Cter (domain structure, see Figure S3E; the secretion capacity of the MFG-E8Cter truncation was verified by Western blot, Figure S3F). We found that MFG-E8Cter secretions could restrict growth of both WT and Tmem30a−/− PSout tumors (Figures 3K and S3G). Further, only 50% of cells in the TME expressing the secreted form of MFG-E8Cter was sufficient to restrict tumor growth (Figures 3L and S3H). Altogether, these results suggested that the secreted MFG-E8Cter could neutralize PS and function as a dominant negative for Tmem30a−/− PSout tumors and even the WT tumors, as apoptosis-associated PS externalization also occurred there. Thus, PS externalization should somehow be blocked to improve tumor development restriction. We further established another tumor model to test the feasibility of the PS externalization blockade as a cancer immunotherapy.
The TMEs with tumors lacking PS externalization during apoptosis
During apoptosis, PS externalization is not a random biological event but a highly regulated one. The scramblase, Xkr8, is responsible for exposing PS during apoptosis. Xkr8 carries a caspase 3 recognition site in its C-terminal region. It is activated by caspase cleavage and starts to scramble PS to outside (Suzuki et al., 2013). Apoptotic caspases also inactivate flippase complex to stop the PS internalization (Segawa et al., 2014). Xkr8-deficient cells largely lose the PS scramble capacity upon apoptosis, thus cannot be labeled by Annexin V (Suzuki et al., 2013).
As Xkr8−/− cells cannot expose PS under apoptosis, we refer to these cells as PSin cells (Figures 4A and 4B). Note that WT and PSin cells proliferated similarly when cultured in vitro (Figure S4A). In immune-competent animals (C57BL/6), PSin tumors with Xkr8−/− PSin cells grew much slower and smaller (Figures 4C, 4D, S4B, and S4C, two independent clones). Meanwhile, in immune-deficient animals, all cells developed tumors the same or very close to it (NSG mice, Figures 4C, 4D, S4B, and S4C). Similar results were observed in flank CT26 tumor models, LLC tumor models, and B16 tumor models (Figures 4E–4H and S4D–S4G). Intriguingly, we found MC38 Xkr8−/− PSin tumor growth was still suppressed in Rag1−/− and Baft3−/− animals, similarly to that in WT animals (Figures 4C, 4D, S4B, and S4C).
Figure 4. KO of Xkr8 (PSin) led to enhanced anti-tumor immune responses.
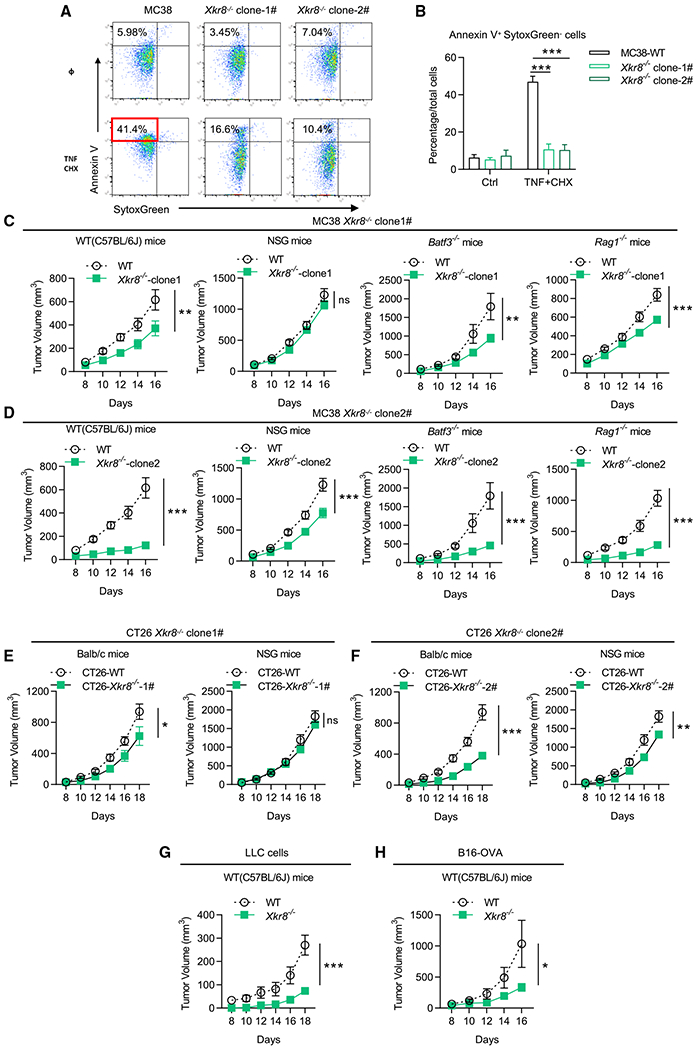
(A and B) PS externalization in Xkr8−/− PSin MC38 cells, indicated by Annexin V and SytoxGreen. Apoptosis was induced by 20 ng/mL TNFα + 20 βg/mL cycloheximide (CHX) for 6 h.
(C and D) Tumor growth of Xkr8−/− MC38 cells (two independent clones) and WT MC38 cells in WT mice (C57BL/6J), Rag1−/− mice, Batf3−/− mice, and NSG mice. n = 10 for WT mice in related group, n = 11 for NSG mice in related group, n = 5 for Rag1−/− mice and Batf3−/− mice in related group.
(E and F) Tumor growth of Xkr8−/− CT26 cells (two independent clones) and WT CT26 cells in WT mice (Balb/c), and NSG mice. n = 5 for mice in each group.
(G) Tumor growth of WT LLC cells and Xkr8−/− LLC cells in WT mice (C57BL/6J). n = 5 for mice in each group.
(H) Tumor growth of WT B16-OVA cells and Xkr8−/− B16-OVA cells in WT mice (C57BL/6J). n = 5 for mice in each group. Tumor volumes were analyzed with two-way ANOVA. Annexin V+ data were analyzed with unpaired t test. Data are representative of at least two independent experiments. Data represent mean ± SEM. ns, no significance difference; *p < 0.05; **p < 0.01; ***p < 0.001.
A closer look (Figure S5A) revealed that more TAMs with less CD163 and more CD80 were present in Xkr8−/− PSin TMEs (Figures 5A–5D). We further observed, using RNA-seq, that the PSin tumor macrophages significantly exhibited M1 markers (Figure 5E; Table S1). For T cells, we found slightly more T cell infiltration and higher early activation marker CD69 expression in PSin TMEs for both CD8+ and CD4+ T cells (Figures 5F–5M).
Figure 5. Immuno-profiling revealed an overall immune active Xkr8−/− PSin TME.
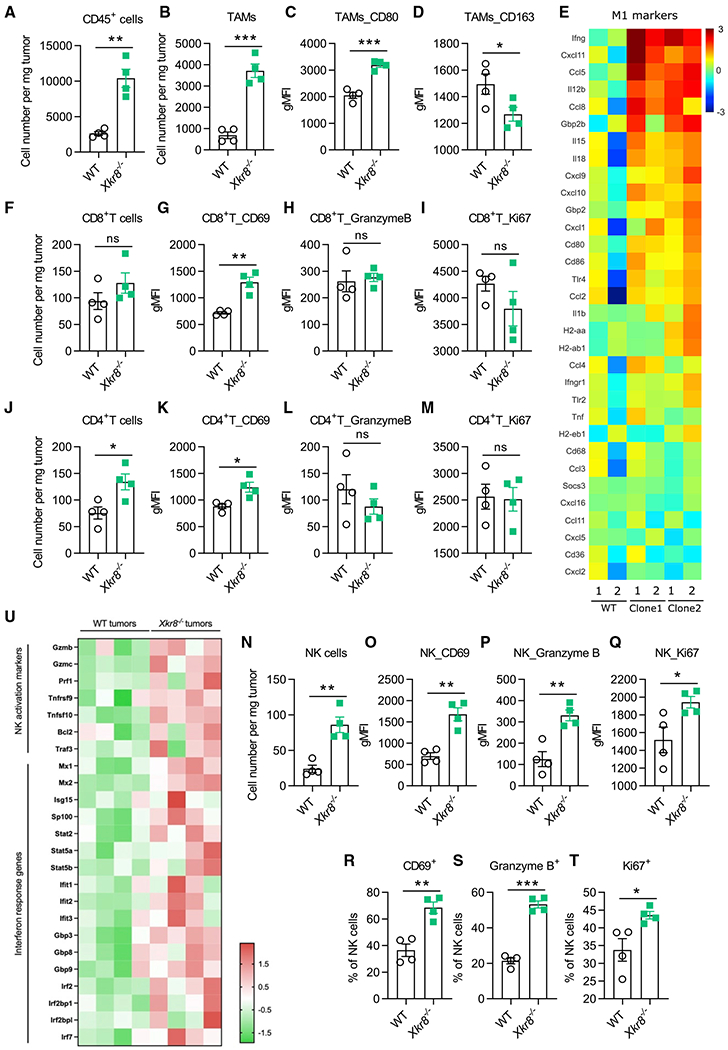
(A and B) Flow cytometry analysis of TILs at the endpoint of experiment in Figure 4 (day 16). TAMs were marked by CD45+CD11b+Ly6G−Ly6C−F4/80+ (B), n = 4.
(C and D) gMFI of CD80 (C) and CD163 (D) of (B).
(E) RNA-seq analysis of sorted TAMs in WT or PSin TMEs. Shown were the log2 fold change of gene expression (PSin versus WT). Shown are genes associated with M1 polarization, suggesting an overall M1 toward TAMs in PSin TMEs. n = 2 for each PSin independent clone and WT mice.
(F) Flow cytometry analysis of tumor-infiltrating CD8+ T cells.
(G–I) gMFI of CD69 (G), granzyme B (H), and Ki67 (I) in CD8+T cells.
(J) Flow cytometry analysis of tumor-infiltrating CD4+ T cells.
(K–M) gMFI of CD69 (K), granzyme B (L), and Ki67 (M) in CD4+T cells.
(N) Flow cytometry analysis of tumor-infiltrating NK cells.
(O–Q) gMFI of CD69 (O), granzyme B (P), and Ki67 (Q) in NK cells.
(R–T) Flow cytometry analysis of CD69 (R), granzyme B (S), and Ki67 (T) in NK cells.
(U) RNA-seq analysis of sorted NK cells in WT or PSin TMEs. Shown are the Z score of gene expression. n = 4 for each group, PSin #2 was used in this analysis. Data were analyzed with unpaired t test. Data are representative of at least two independent experiments (except RNA-seq). Data represent mean ± SEM. ns, no significant difference; *p < 0.05; **p < 0.01; ***p < 0.001.
We also found the accumulation of active NK cells in Xkr8−/− PSin TMEs compared with WT, shown by more granzyme B and interferon (IFN) γ upregulation (Figures 5N–5T and S5B). RNA-seq of the NK cells also confirmed the NK cell activation (Figure 5U). This is consistent with the results that only NSG mice, which lacked not only T and B lymphocytes but also NK cells, lost the ability to restrict the Xkr8−/− PSin tumor, while Rag1−/− mice, lacking T and B lymphocytes but with intact NK cell subsets, could still restricted PSin tumors. Hence, we reasoned that NK cell-mediated cytotoxicity was sufficient to restrict the Xkr8−/− PSin tumor development.
We also applied pathway enrichment analysis on the RNA-seq data in TAMs, where we found both type I and II IFN pathway genes were enriched in PSin TMEs (Figures 6A and 6B). NK cells in PSin TMEs were also equipped with higher IFN response genes (Figure 5U). Therefore, we asked whether the IFN pathway played any roles in the anti-tumor immunity in PSin TMEs. It was reported that antibody blockade of one PS receptor MerTK on TAMs could enhance STING activation by tumor-derived cGAMP (rather than TAM-derived cGAMP) (Zhou et al., 2020). Similar extracellular cGAMP produced by cancer cells was also involved in radiation-induced STING activation and anti-cancer immunity (Carozza et al., 2020). Therefore, we implanted PSin tumors on Stinggt mice and observed that STING activation was required for PSin tumor growth restriction (Figures 6C–6E and S6A). We also found the NK cell cytotoxicity in PSin tumors was reduced in Stinggt mice (Figures 6F and 6G), further indicating the role of NK cells in restricting PSin tumor. We found a similar phenotype when we implanted PSin tumors on Ifnar−/− mice (Figures 6H and S6B). We also generated cGAS KO PSin tumors (Xkr8cGAS DKO, Figure S6C). The results verified the role of tumor-derived cGAMP in PSin TMEs, as tumor growth could not be restrained when tumor cGAS was depleted (Figures 6I and S6D). Altogether, the cGAMP produced by Xkr8−/− tumor cells was essential for the overall immune activation. In fact, when performed on the bone marrow-derived macrophages (BMDMs) in vitro, cGAMP addition could recapture the gene upregulation signatures observed in vivo (Figure S6E). Since, once produced, cGAMP could freely migrate into all kind of cells in the TMEs via the transporters SLC19A1 and the widely expressed volume-regulated LRRC8A heteromeric channels (Lahey et al., 2020), we believe TAMs were not the only subset that responded to cGAMP and exhibited higher type I IFN response. Other subsets, such as NK cells, as mentioned above, could also sense tumor-derived cGAMP and contribute to Xkr8−/− PSin tumor growth repression.
Figure 6. cGAS-STING axis and IL-10 suppression were critical for Xkr8−/− PSin tumor restriction anti-cancer activity.
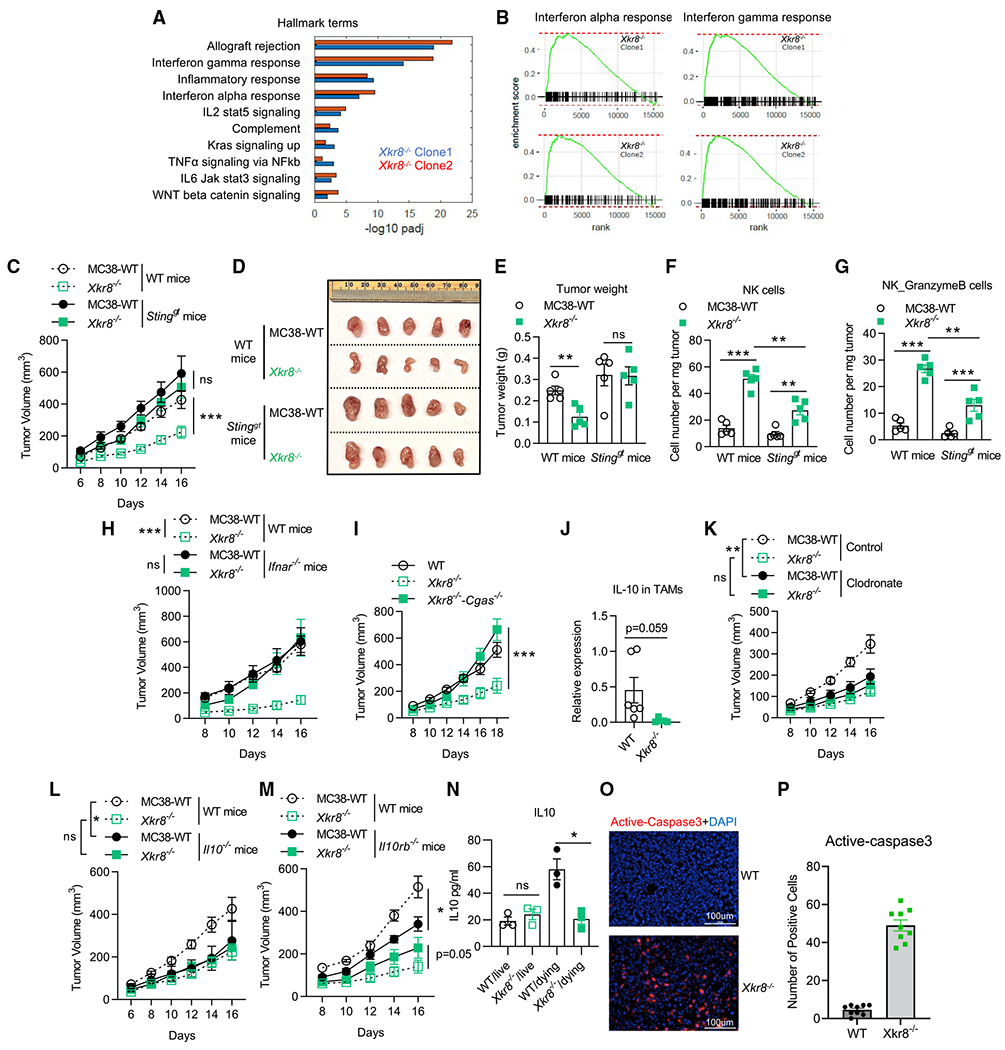
(A and B) Pathway enrichment analysis of the genes upregulated in TAMs in Xkr8−/− PSin TMEs (both independent clones in Figure 4, compared with WT TAMs), indicating both type I and II IFN response activation.
(C) Tumor growth showed Xkr8−/− PSin tumor developed at the same level as WT tumors in Stinggt mice. n = 5 for mice in each group.
(D) Image of tumors at the endpoint (day 16) of (C).
(E) Weight of tumors at the endpoint (day 16) of (C).
(F and G) FACS analysis indicated NK cells in Xkr8−/− TMEs, n = 5.
(H) Tumor growth showed Xkt8−/− PSin tumor developed at the same level as WT tumors in Ifnar−/− mice. n = 5 for mice in each group.
(I) Xkr8−/− tumor with cGAS deficiency (Xkr8−/−cGAS−/− double KO) developed at the same level as WT tumors in C57BL/6J mice. n = 5 for mice in each group.
(J) TAMs in Xkr8−/− TMEs produced less IL-10, indicated by qPCR, n = 6.
(K) Tumor growth of WT or Xkr8−/− MC38 cells in C57BL/6J mice with or without macrophage depletion via clodronate liposomes. n = 5 for mice in control group, n = 9 for mice in clodronate group.
(L and M) Tumor growth of WT or Xkr8−/− MC38 cells in C57BL/6J mice, Il10−/−, and Il10rb−/− mice. n = 5 for mice in each group.
(N) Living or apoptotic (dying) MC38 tumors (WT or Xkr8−/−) co-cultured with BMDMs in vitro for 18 h and IL-10 secretions in the supernatants were measured by ELISA.
(O) Fluorescent immunostaining showed the presence of dying/dead cells (active caspase-3, red) in Xkr8−/− tumors other than WT tumors (DAPI, blue).
(P) Quantitative analysis of percentage of the positive active caspase-3 cells in (O). Three tumors from three mice were analyzed in each group, and three random snapshots were captured from each tumor specimen. Tumor volumes were analyzed with two-way ANOVA. Column data were analyzed with unpaired t test. Data are representative of at least two independent experiments. Data represent mean ± SEM. ns, no significant difference; *p < 0.05; **p < 0.01; ***p < 0.001. PSin #2 was used in this analysis.
To test the type II IFN response, we implanted WT andXkr8−/− PSin tumors on Ifng−/− mice (Figure S6F). We found that IFN-γ was dispensable for PSin tumors restriction. It would be possible that the hyper-activated type I signaling could compensate the type II signaling deficiency.
Consistent with Figure 5E, which shows that TAMs in Xkr8−/− PSin tumors displayed higher M1 markers, we found high IL-10 production by TAMs was a signature only present in WT TMEs (Figure 6J). Further, we found macrophage depletion (by clodronate liposomes) could help the mice to constrain WT tumor growth to the same level as the PSin tumors (Figures 6K, S6G, and S6H). Thus, we hypothesized that IL-10 produced by TAMs was suppressed in Xkr8−/− PSin tumors and thus led to anti-tumor immunity activation. We completely understand that current data suggest that IL-10 may possess both immune-stimulating/antitumor and immune-suppressive/pro-tumor properties. For example, for MB49 (bladder), ID8 (ovarian), and MMTV-PyMT (mammary) tumor models, IL-10 blockade improves survival and restricts tumor growth, by either IL-10 KO animal models or IL-10 receptor blockade (Hart et al., 2011; Maimon et al., 2021; Ruffell et al., 2014). On the contrary, for EGFR-overexpressed B16 tumor models, IL-10 injection can inhibit tumor growth (Qiao et al., 2019). It may seem that administration of IL-10 before and immediately after tumor challenge results in immune suppression and tumor progression, in line with a predominant inhibitory activity of IL-10. However, injection of IL-10 just after tumor challenge enhanced anti-tumor immunity (Oft, 2014). Employing Il10rb−/− and Il10−/− mice, we found WT tumor developments were suppressed when IL-10 signaling was deficient, while Xkr8−/− PSin tumors developed similarly, regardless of IL-10 or its receptor (Figures 6L, 6M, S6I, and S6J). Our results imply that the IL-10 signaling-mediated immune suppression was only observed in WT tumors, rather than in Xkr8−/− PSin tumors.
We further investigated whether diminished IL-10 production is the direct effect of PS externalization blockade. When engaging with apoptotic cells and their exposed PS, dying cell-engulfing macrophages can secret IL-10 accompanying efferocytosis (Martinez et al., 2016). Meanwhile, with an inefficient efferocytosis, the engulfing macrophages fail to do so (Martinez et al., 2016). Without PS externalization, we found apoptotic Xkr8−/− PSin cells failed to elicit macrophage IL-10 production in vitro (Figure 6N). In addition, massive apoptotic cell accumulation (stained by anti-active caspase-3 antibody) was found only in Xkr8−/− PSin tumors (Figures 6O and 6P). Taken together, the altered efferocytosis efficiencies of WT and PSin apoptotic tumor cells by macrophages led to IL-10 expression change and different immune outcomes.
Inflammasome components, such as NLRP3, caspase-1, and the downstream GSDMD, could mediate the anti-tumor immunity, especially in TIM-3-deficient animals (Dixon et al., 2021). As PS is mainly sensed by TIM-3 in our PSout models, we wondered whether inflammasome activation played any role in the immune activation in PSin tumors. Taking advantage of the Casp1/11−/− and Gsdmd−/− mice, we did not detect a role of inflammasome in the PSin TMEs (Figures S6K and S6L).
Targeting Xkr8 for PS externalization blockade as a cancer immunotherapy
Our results related to Xkr8−/− PSin tumors established the proof-of-concept evidence that the apoptotic PS externalization blockade could shape a more anti-tumor microenvironment. Especially when combined with anti-PD-1 checkpoint blockade, Xkr8−/− could lead to a very satisfactory anti-tumor effect (Figures 7A and 7B). We chose to develop Xkr8 as a cancer immunotherapeutic target as transient Xkr8 block should not involve any predictable dramatic adverse effects. C57BL/6 background Xkr8−/− mice bred in a normal Mendelian ratio did not develop autoimmunity dysregulation, at least at early ages (Kawano and Nagata, 2018). Only the MRL mouse strain (MRL/MpJ-Faslpr) with Xkr8−/− generated accelerated lupus during aging (Kawano and Nagata, 2018). Furthermore, by analyzing the expression-survival database (https://kmplot.com/analysis/index.php?p=background), we found Xkr8 expression level negatively correlated with overall outcomes in lung cancer, gastric cancer, and liver cancer (Figures 7C–7E). Although Xkr8 is not a typical oncogene, these correlations suggest that Xkr8 can serve as an anti-cancer drug target.
Figure 7. Administration of Xkr8 depletion in vivo promotes durable tumor clearance.
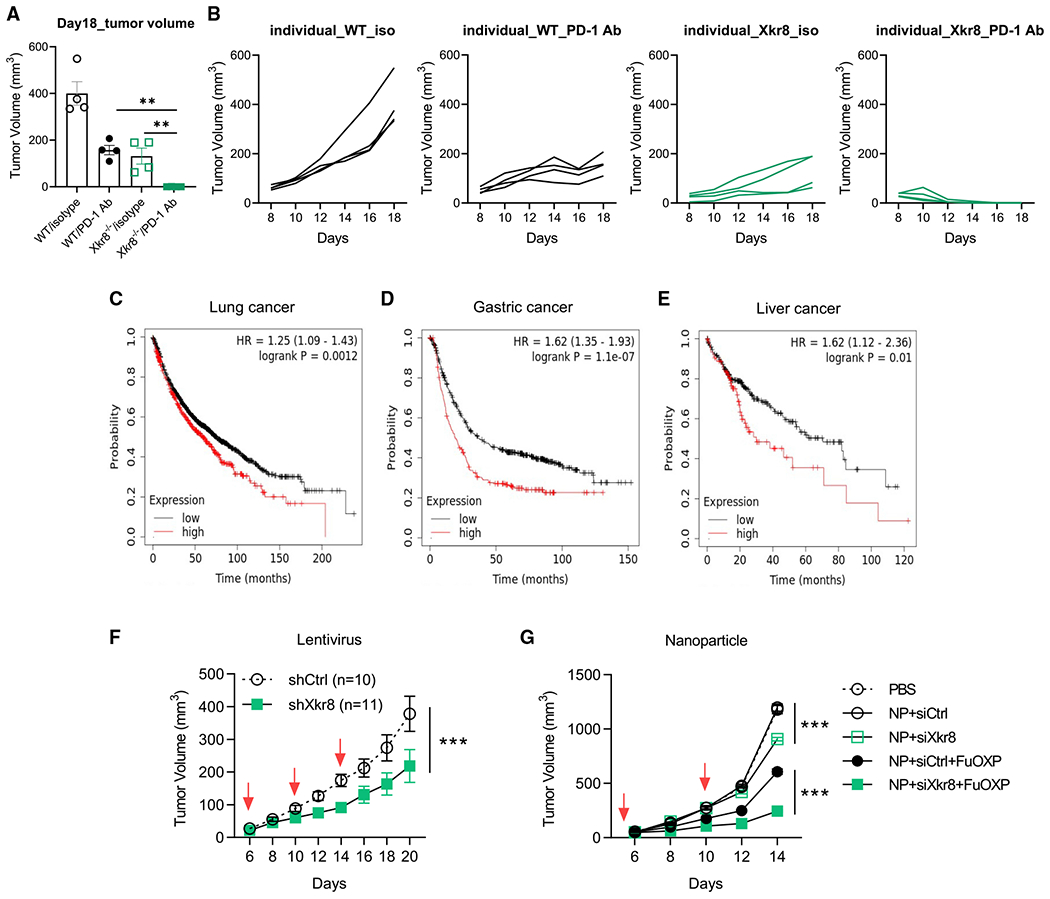
(A) Representative tumor volume at the end of point (day 18, n = 4 for each group).
(B) Assessment of individual tumor growth of WT or Xkr8−/− cells ± PD-1 antibody treatment. n = 4 for mice in each group.
(C–E) Negative correlations between Xkr8 expression and the overall outcomes of several types of cancers. Figures were generated from the Web-based interface of the database https://kmplot.com/analysis/index.php?p=background.
(F) Intratumoral injection of shRNA-delivering lentivirus could promote WT MC38 tumor growth restriction. n = 10 for Ctrl scramble shRNA, n = 11 for shXkr8.
(G) Mice bearing MC38 tumors received various treatments once every 5 days for three times at an siRNA dose of 1 mg/kg and FuOXP dose of 8 mg/kg. n = 6 for mice in each group. Column tumor volume data were analyzed with unpaired t test. Tumor volumes with time points were analyzed with two-way ANOVA. Data are representative of at least two independent experiments. Data represent mean ± SEM. ns, no significant difference; *p < 0.05; **p < 0.01; ***p < 0.001. PSin #2 was used in this analysis.
So far, no small-molecule inhibitors of Xkr8 are currently available. Therefore, we used RNA interference (RNAi)to silence tumor Xkr8 to reverse the PS immune-suppressive function. We first used lentivirus-mediated shRNA transduction to silence Xkr8 in MC38 tumors. As shown in Figures 7F and S7A, compared with scramble shRNA, Xkr8 shRNA intratumoral transduction recaptured the phenotype of the Xkr8−/− PSin tumors.
The effect of in vivo knockdown of Xkr8 was further examined following nanoparticle-mediated systemic delivery of Xkr8 siRNA, alone or in combination with FuOXP (a conjugate of fluorouracil [5-FU] and oxoplatin). Xkr8 siRNA nanoparticles alone showed modest effect in inhibiting the tumor growth in the MC38 model (Figures 7G and S7B). Codelivery of FuOXP and Xkr8 siRNA led to further improvement in the overall anti-tumor activity. Similar results were shown in CT26 and Panc02 models (Chen et al.).
Overall, these data demonstrated that Xkr8 inhibition-mediated PS externalization blockade (alone or combined with other anti-cancer therapies) conferred robust immune-mediated tumor restriction.
DISCUSSION
Here, we built up two tumor models, in which tumor cells are alive and proliferating but with constant PS externalization (Tmem30a−/− PSout), and tumor models in which cells would not scramble PS during apoptosis (and the cell death is unaffected, Xkr8−/− PSin). Employing these two models, we described the immune-suppressive roles of PS, its receptor, and the mechanism of PS externalization blockade as an anti-cancer immunotherapy. We further established Xkr8 as an anticancer target. Using RNAi approaches (shRNA and siRNA), we achieved the PS externalization blockade and made it exhibit a robust anti-cancer efficacy.
Given that various receptors have been shown to be involved in the PS-mediated immunosuppression, blockade of one PS receptor may not be sufficient to achieve the maximum therapeutic efficacy. Thus, our approach, which directly targets PS exposure, in theory, should bring more clinic benefits. It may also serve as a complementary approach for the PS receptor blockade. Another direct PS blockade anti-cancer strategy is the so-called PS-specific antibody (Birge et al., 2016). PS-targeting monoclonal antibodies have also shown preliminary anti-tumor activity, especially combined with immune checkpoint blockade (anti-cytotoxic T lymphocyte-associated protein 4 [anti-CTLA-4]; -PD-1) (Belzile et al., 2018). However, most PS-targeting antibodies (3G4 and its derivatives) do not directly bind to PS (PS is a lipid and may not serve as a robust antigen). Instead, they bind PS via a serum cofactor, β2 glycoprotein 1 (β2GP1), a known PS-interacting protein (Dayoub and Brekken, 2020). As β2GP1 is extremely abundant in sera (~200 μg/mL) and implicated in regulating coagulation, the therapeutic window could be challenging.
So far, no inhibitors for Xkr8 are available. Since the tumor drug delivery technology, either by viral particle or nanoparticle, are still not ready for oncology applications, it would be worthwhile to screen small-compound inhibitors for Xkr8. Annexin V labeling-based PS externalization assay could be easily achieved in vitro and in a high-throughput format. A small-molecule Xkr8 inhibitor will at least benefit basic biomedical research.
It is intriguing to find out that cGAS-catalyzed cGAMP is crucial for Xkr8−/− PSin tumor growth restrictions. During apoptosis, mitochondrial inner membrane permeabilization (MIMP) can occur following BAX/BAK pores (McArthur et al., 2018; Riley et al., 2018). The cytosolic release of mtDNA can be sensed by cGAS for cGAMP synthesis. It may seem reasonable to speculate that the Xkr8−/− PSin tumor cells, lacking PS as an eat-me signal, can avoid efferocytosis and have more time to produce cGAMP during apoptosis due to delayed engulfment (Figures 6O and 6P). However, this hypothesis is contrary to the fact that the pro-inflammatory effects of apoptotic cells occurred only under caspase-inhibited conditions (Giampazolias et al., 2017; Riley et al., 2018; Rongvaux et al., 2014; White et al., 2014). This is because cGAS is an apoptotic caspase substrate and can be inactivated during apoptosis (Ning et al., 2019). Meanwhile, a study from McArthur et al. (2018) would suggest otherwise: they did find mtDNA release and increase in IFN-βmRNA under caspase-proficient conditions. Thus, whether it is the long-lasting, not-engulfed tumor cells that make cGAMP or the cells still alive but somehow stimulated by the neighboring not-engulfed apoptotic cells that produce cGAMP is still unclear.
This work is another example that demonstrates the general principle of the effector response to cell death, proposed by Rothlin et al. (2021). The effector response (εff) of cell death can be determined by not only cell death (D) itself but also by the environments (εnv) of cell death and the specific efferocytes (εffero), which can be summarized as the equation f:D × εnv × εffero → εff. Moreover, D can be further determined by the set of types of programmed cell death (T), the identities of the dying cell (Jd) and other variables (O), which can be described as D: = T × Jd × O. Altogether, the effector response of cell death can be determined by the equation f: T × Jd × O × εnv × εffero → εff. In our study, we reprogramed the apoptosis to PSin (T), which led to the TME alterations (εnv, such as IL-10 suppression and cGAMP production) and macrophage IFN pathway activation (εffero). All these inputs successfully reversed the immune-suppressive effects (εffero) to immune-activated forms.
Altogether, we have successfully described the roles of PS in TMEs, identified the receptors (TIM-3), and provided therapeutic strategies (PS externalization blockade) and an anti-cancer target (Xkr8 silencing) to overcome the PS-mediated immune suppression. Our discoveries are also of high translative significance.
Limitations of the study
Note that Xkr8 targeting-based PS externalization blockade only works for apoptosis-associated PS exposure. Cytotoxic T cells can also induce tumor cell ferroptosis under checkpoint blockade therapies (Wang et al., 2019). Other cell deaths, such as necroptosis, also scramble PS prior to PM breakdown (Gong et al., 2017). The mechanism for necroptotic PS externalization is still unclear. Moreover, exosomes related to solid tumors also contain PS. Thus, the Xkr8 targeting may have limitations when apoptosis is not the dominant mode of cell death in the TMEs. Other strategies (such as the truncated MFG-E8Cter) that may neutralize PS from all sources would be of high interest to develop.
STAR★METHODS
RESOURCE AVAILABILITY
Lead contact
As lead contact, Yi-Nan Gong is responsible for all reagent and resource requests. All requests for non-commercial reagents will be fulfilled. Please contact Yi-Nan Gong (yngong@pitt.edu) with requests and inquiries.
Materials availability
Materials generated in this study are available from the lead contact upon request.
Data and code availability
The RNAseq data for TAMs (PSin) generated in this study were uploaded to GEO: GSE185591. The RNAseq data for TAMs (PSout) and NK cells (PSin) generated in this study were uploaded to GEO: GSE200752.
This paper does not report original code.
Any additional information required to reanalyze the data reported in this paper is available from the lead contact upon request.
EXPERIMENTAL MODEL AND SUBJECT DETAILS
Mice
C57BL/6J (RRID:IMSR_JAX:000664), Balb/cJ (RRID: IMSR_JAX:000651), Batf3−/− (RRID: IMSR_JAX:013755), and Rag1−/− (RRID: IMSR_JAX:002216), NSG (RRID: IMSR_JAX:005557), Stinggt (RRID: IMSR_JAX:017537), IL10−/− mice (RRID: IMSR_JAX:002251), IL10rb−/− mice (RRID: IMSR_JAX:005027), Gsdmd−/− mice (RRID: JAX032663) and Casp1/11−/− mice (RRID: JAX016621) were obtained from The Jackson Laboratory. Havcr2−/− mice were gifted by Dr. Binfeng Lu, and Timd4−/− mice were gifted from Dr. Vijay K. Kuchroo. All mice were maintained and bred under in specific pathogen-free conditions animal facilities at UPMC Hillman Cancer center. All mice were used for experiments at 8-10 weeks of age (age and sex matched, both sexes used). All animal experiments were performed under protocols approved by University of Pittsburgh Animal Care and Use Committee. All mice were housed in specific-pathogen-free conditions at an ambient temperature of 20–26°C and humidity of 30–70% with a 12 h:12 h light:dark cycle before use.
Cell lines
MC38, B16, LLC and CT26 and their derivatives were maintained at 37°C, 5% v/v CO2 in a humidified incubator in DMEM (GIBCO) supplemented with 10% FBS, 2 mM L-glutamine (GIBCO), 200 U/mL penicillin streptomycin (GIBCO) and 50 μg/mL plasmocin (Invivogen).
CRIPSR mediated knockout of Tmem30a, Xkr8 and cGAS was done by CRSPR/Cas9 plasmid pSpCas9(BB)-2A-GFP (PX458). The sequences of sgRNAs were documented in Table S2. In brief, cells were transfected with the sgRNA encoding plasmids, GFP positive cells were then collected by FACS and subjected into single cell culture. The successful knockout clones were be verified by PCR based genotyping, Western blot or Annexin-V staining.
For secreted MFG-E8C-ter expression, the coding sequence was cloned into vector FUIPW. The FUIPW empty vector or with MFG-E8C-ter expression were stably transduced into MC38 cells (WT or Tmem30a−/−) and selected by puromycin. The full sequence of MFG-E8C-ter was deposited in Table S2.
Tumor models
Mice were shaved at right flank and injected subcutaneously (s.c.) with 1 × 10⁵ or 2.5 × 10⁵ cells per mice in 100 μL PBS. Tumor growth was monitored every two days after a week with digital caliper, and tumor volume was calculated by the following formula: tumor volume = Width2 x Length x 0.5 mm3. Tumor weights were measured by electronic balance. Mice were euthanized when tumor volume reached 2000 mm3.
For PD-1 blockade in vivo experiments, mice were treated intraperitoneally (i.p.) with anti-PD1-(Clone 29F.1A12, P377, RRID: AB_2737558) antibody (200 μg/mice) or control antibody every 3 days, starting on day 6 after tumor implantation.
For Xkr8 shRNA lentivirus (Sigma-Aldrich, TRCN0000178308) in vivo transduction experiments, mice were treated intratumorally with 20 million viruses in 100 μL medium every 4 days, starting on day 6 after tumor implantations.
For Xkr8 siRNA delivery, MC38 tumor bearing mice were intravenously administered with various treatments. Control or Xkr8 siRNA (1 mg/kg) and FuOXP (8 mg/kg) were co-loaded into nanoparticles and were injected for three times at an interval of 5 days. Detailed nanoparticles preparation is described in (Chen Y. …Li S. et al. in press, Nature Nanotechnology).
METHOD DETAILS
Flow cytometry
Tumor tissues were harvested from sacrificed mice on day 16. Tumors were minced and then digested in 1640 complete medium with Liberase TL (Sigma, 5401020001) and DNase I (Sigma, 10104159001) for 30 mins at 37°C. Cells were filtered through 40-μm strainer. After being washed by 1x DPBS, single cell suspensions were ready for cell staining.
All samples were stained with fluorescent antibodies and analyzed by flow cytometry (Fortessa Aria II). Briefly, for cell viability determination, cells were stained with Zombie NIR (biolegend) in 1x DPBS for 30 min at 4°C. After being incubated with Fc-Blocking antibody, cells were performed with subsequent surface marker staining. The following antibodies were used: CD45 (clone 30-F11) (BioLegend 103151, RRID: AB_2565884), CD11b (clone M1/70) (BioLegend 101243, RRID: AB_2561373), F4/80 (clone BM8) (Thermo Fisher 11-4801-82, RRID:AB_2637191), Ly-6C (clone HK1.4) (BioLegend 128033, RRID: AB_2562351), Ly-6G (clone 1A8) (BioLegend 127627, RRID: AB_10897944), MHC II (clone M5/114.15.2) (Thermo Fisher 46-5321-80, RRID: AB_1834440), CD80 (clone 16-10A1) (BioLegend 104734, RRID: AB_2563113), CD86 (clone GL-1) (BioLegend 105020, RRID: AB_493464), CD163 (clone TNKUPJ) (Thermo Fisher 17-1631-82, RRID: AB_2784646), CD206 (clone C068C2) (BioLegend 141727, RRID: AB_2565822), CD3 (clone 17A2) (Thermo Fisher 56-0032-82, RRID: AB_529507), CD4 (clone RM4-5) (BioLegend 100515, RRID: AB_312718), CD8 (clone 53-6.7) (BD Biosciences 563234, RRID: AB_2738084), CD44(clone IM7) (Thermo Fisher 45-0441-82, RRID: AB_925746), CD62L (clone MEL-14) (BioLegend 104445, RRID: AB_2564215), Tim3 (clone RMT3-23) (Thermo Fisher 25-5870-82, RRID: AB_2573483), PD-1 (clone J43) (Thermo Fisher 11-9985-82, RRID: AB_465472), CXCR5 (clone L138D7) (BioLegend 145508, RRID: AB_2561972), IL-7R (clone A7R34) (BioLegend 135023, RRID: AB_10897948).
For intracellular staining, cells were performed with Foxp3/Transcription factor staining buffer set (eBioscience) according to the instruction. The following intracellular antibodies were used: Granzyme B (clone NGZB) (Thermo Fisher 17-8898-82, RRID: AB_2688068), TCF-7/TCF-1 (clone S33-966) (CST 564217, RRID: AB_2687845), IFN-γ (clone XMG1.2) (BioLegend 505821, RRID: AB_961361), T-bet (clone 4B10) (BioLegend 644806, RRID: AB_1595488), TNF (clone MP6-XT22) (BD Biosciences 563387, RRID: AB_2738173), Ki67 (clone SolA15) (Thermo Fisher 48-5698-80, RRID: AB_11151155). Data were analyzed with Flowjo 10.6.
To assess PS externalization, cells were trypsinized, resuspended in serum-free DMEM and stained with Annexin V-Alexa Fluor 647 (1:200, Thermo Fisher, A23204, RRID: AB_2341149) and 50 nM SytoxGreen (Thermo Fisher) for 2-5 min. Cells were then subjected for FACS analysis.
RNAseq library construction, sequencing, and analysis
Total RNA was extracted from culture cells using Purelink RNA Mini Kit (Thermo Fisher) and submitted for library construction to The Health Sciences Sequencing Core at Children’s Hospital of Pittsburgh using TruSeq Stranded Total RNA libraries that include rRNA depletion (Illumina).
Paired end sequencing reads were aligned to the MM10 refseq transcriptome and quantified by Salmon (V0.7.2) or Partek Flow. Transcripts were summed to obtain gene counts and analyzed using DESEQ2 (V1.30.1) in R (V4.1.1, R Foundation for Statistical Computing) or Partek Flow to obtain estimated fold change and p-values, these values were then analyzed for Gene Set Enrichment using FGSEA (V1.16.0) in R and hallmark gene sets, mouse Hallmark (V5) gene sets were obtained from (http://bioinf.wehi.edu.au/software/MSigDB). Plots were generated with R, Matlab (2017A, Mathworks) or Partek Flow. Gene list of M1 markers was obtained from (Cunha et al., 2018) and those genes that were observed in all datasets (>10 counts) were plotted.
Single cell RNAseq for TIM-3 and TIM-4 on immune lineages
Data accession and processing
To interrogate expression levels of TIM3 (HAVCR2) and TIM4 (TIMD4) on immune cells in patients with cancer, we leveraged singlecell RNAseq data from two previously published studies. The first study consisted of sorted live CD45+ cells from PBMC and tumor tissue from head and neck squamous cell carcinoma (HNSCC) patients, PBMC from healthy donors, and tonsil tissue from healthy donors generated using 10X Genomics’ 3′ single cell RNAseq chemistry (Cillo et al., 2020). The second study consisted of sorted live CD45+ cells from patients with colorectal cancer (CRC) generated using 10X Genomics’ 3′ single cell RNAseq chemistry or SMART-seq2 chemistry (Zhang et al., 2020). These data were downloaded from the Gene Expression Omnibus (accession number: GSE139324 for HNSCC and GSE146771 for CRC), and individual feature barcode matrices were used to create a unified Seurat v3 object. Expression levels were log-normalized for downstream analysis. To integrate data generated by the two different technologies from the CRC study, we utilized the reciprocal integration workflow described implemented in Seurat v3 (Stuart et al., 2019).
Identification of cell types for for HNSCC
Cell types were identified as previously described (Ruffin et al., 2021). Briefly, previously described sorted immune populations (Zheng et al., 2017) were used to define gene expression profiles of immune lineages, and logistic regression was utilized to build a classifier that predicted the immune lineage of individual cells. Graph-based unsupervised clustering was used to identify clusters of cells, and the aggregate predicted immune lineage in each cluster was used to define the immune lineage of that cluster. These cell type identities were then used to evaluate expression levels of HAVCR2 and TIMD4 across immune lineage in PBMC, tumors, and tonsils.
Identification of cell types for CRC
Cell type identities were provided in the Gene Expression Omnibus record for the CRC study at two different levels: “Global clusters” and “Subclusters”. The Global clusters consisted of high-level classification of cell types (e.g. T cells, B cells, myeloid cells, et cetera) while the Subclusters consisted of a more granular classification of immune subpopulations (e.g. tumor-associated macrophages, dendritic cells, monocytes, et cetera).
Evaluating HAVCR2 and TIMD4 expression levels
Expression levels of HAVCR2 and TIMD4 were evaluated across immune lineages using two different approaches. In the first approach, we interrogated the mean and standard deviation for expression of HAVCR2 and TIMD4 across immune cells in PBMC, tumor and tonsil tissues. In the second approach, we characterized the fraction of cells in each lineage that express either HAVCR2 or TIMD4 as well as the mean expression value, displaying these values simultaneously in a dot plot.
mRNA real-time PCR
Total RNA for real-time PCR was extracted and purified using the Purelink RNA Mini Kit (Thermo Fisher). Reverse transcription reactions were performed with M-MLV reverse transcriptase (Life Technology), following the standard protocol using random hexamers (NEB). Real-time PCR was performed with PowerUpTM SYBRTM Green Master Mix labeling in 7500 Fast Real-Time PCR System (Thermo Fisher). PCR conditions were 50°C for 2 min, 95°C for 10 min, and 43 cycles of 95°C for 15 s and 60°C for 1 min. mRNA expression was normalized against β-actin, allowing comparison of mRNA levels. Primers used in this study are listed in Table S2.
IL-10 ELISA
For stimulation of BMDM with living or apoptotic cells, 1 × 10⁵ macrophages were cocultured with 1 × 10⁶ WT orXkr8−/− MC38 cells for 18 hrs. Cell supernatants were collected for IL-10 ELISA (Invitrogen, 50-112-8654).
Immunofluorescence staining of cancer samples
Frozen sections (5 μm) were fixed with 4% paraformaldehyde-PBS 20 min at room temperature, permeabilized with 0.3% Triton X-100 in 1X PBS, blocked in 3% BSA (or 10% FBS) in 1X PBS, stained with primary antibodies for overnight at 4°C, followed by staining with 2° antibodies (1 hr) and DAPI stain. Samples were covered with coverglasses and imaged using Lionheart microscope (Biotek). Ac-caspase-3 monoclonal antibody (9661S, Cell Signaling, 1:200) was used to perform the immunofluorescence staining.
Flag immunoprecipitation (IP)
To verify the secretion of the secreted form of MFG-E8 C-terminus, we transfected plasmid pBabe-flag-MFG-E8 Cter into HEK293T cells in a 100 mm dish. 36 hr post transfection, culture supernatants and cells were separately collected. Cell supernatants and cell lysates (cells lyased by RIPA buffer) were subjected to standard flag-IP, using anti-flag beads (BioLegend, 651502). Beads after IP were eluted by SDS loading buffer and then analyzed by Western blot by anti-flag (BioLegend, 637302).
Western blot
Cells were lysed with loading buffer (50 mM Tris pH = 6.8, 2%SDS and 10% glycerol) and denatured by boiling. Protein concentration was then determined by the BCA assay (Thermo Fisher) and systematically normalized before SDS-PAGE. Following the transfer of proteins to nitrocellulose (Thermo Fisher), immunodetection was performed using the indicated primary and peroxidase-coupled secondary antibodies. cGAS primary antibody (cat# 31659) was purchased from CST. Proteins were visualized by enhanced chemiluminescence (ECL, Thermo Fisher).
QUANTIFICATION AND STATISTICAL ANALYSIS
Statistical analysis
The p values were calculated using an unpaired Student’s t test (two groups) or Two-way ANOVA (multiple groups). Values of p < 0.05 were considered significant. Values of p < 0.05 were ranked as *p < 0.05, **p < 0.01, ***p < 0.001, and ****p < 0.0001. Sample sizes were not statistically predetermined but were chosen on the basis of previous tumor immunology studies. These sample sizes are sufficient because they allowed for the determination of statistical significance between groups and minimized the number of mice or replicates needed for each experiment. Mice were placed into experimental groups by nature of their genotype, and/or if receiving injections were randomized within a genotype. Blinding was not possible as most of the data acquisition and analysis was carried out by a single person; having two individuals perform every experiment was not feasible during the course of our study.
Supplementary Material
KEY RESOURCES TABLE
| REAGENT or RESOURCE | SOURCE | IDENTIFIER |
|---|---|---|
| Antibodies | ||
| Alexa Fluor 647 anti-mouse CD86 (Clone GL-1) | BioLegend | Cat#105020, RRID:AB_493464 |
| Alexa Fluor 700 anti-mouse CD3 (Clone 17A2) | Thermo Fisher Scientific | Cat#56-0032-82, RRID:AB_529507 |
| APC anti-human/mouse Granzyme B (Clone NGZB) | Thermo Fisher Scientific | Cat#17-8898-82, RRID:AB_2688068 |
| APC anti-human/mouse TCF-7/TCF-1 (Clone S33-966) | Cell Signaling Technology | Cat#564217, RRID:AB_2687845 |
| APC anti-mouse CD163 (Clone TNKUPJ) | Thermo Fisher Scientific | Cat#17-1631-82, RRID:AB_2784646 |
| APC rat anti-mouse CD4 (Clone RM4-5) | BioLegend | Cat#100515, RRID:AB_312718 |
| Brilliant Violet 421 anti-mouse Ly-6G (Clone 1A8) | BioLegend | Cat#127627, RRID:AB_10897944 |
| Brilliant Violet 421 anti-mouse TNF (Clone MP6-XT22) | BD Biosciences | Cat#563387, RRID:AB_2738173 |
| Brilliant Violet 510 anti-mouse Ly-6C (Clone HK1.4) | BioLegend | Cat#128033, RRID:AB_2562351 |
| Brilliant Violet 650 anti-mouse CD45 (Clone 30-F11) | BioLegend | Cat#103151, RRID:AB_2565884 |
| Brilliant Violet 650 anti-mouse CD8 (Clone 53-6.7) | BD Biosciences | Cat#563234, RRID:AB_2738084 |
| Brilliant Violet 711 anti-mouse CD206 (Clone C068C2) | BioLegend | Cat#141727, RRID:AB_2565822 |
| Brilliant Violet 711(TM) anti-mouse CD62L (Clone MEL-14) | BioLegend | Cat#104445, RRID:AB_2564215 |
| Brilliant Violet 785 anti-mouse/human CD11b (Clone M1/70) | BioLegend | Cat#101243, RRID:AB_2561373 |
| eFluor 450 anti-Ki67 (Clone SolA15) | Thermo Fisher Scientific | Cat#48-5698-80, RRID:AB_11151155 |
| FITC anti-mouse CD279 (PD-1) (Clone J43) | Thermo Fisher Scientific | Cat#11-9985-82, RRID:AB_465472 |
| FITC anti-mouse F4/80 (Clone BM8) | Thermo Fisher Scientific | Cat#11-4801-82, RRID:AB_2637191 |
| PE anti-human/mouse Granzyme B (Clone QA16A02) | BioLegend | Cat#372207, RRID:AB_2687031 |
| PE/Cyanine7 anti-mouse CD80 (Clone 16-10A1) | BioLegend | Cat#104734, RRID:AB_2563113 |
| PE/Cyanine7 rat anti-mouse CD366 (Tim3) (Clone RMT3-23) | Thermo Fisher Scientific | Cat#25-5870-82, RRID:AB_2573483 |
| PerCP-eFluor 710 anti-mouse MHC Class II (I-A/I-E) (Clone M5/114.15.2) | Thermo Fisher Scientific | Cat#46-5321-80, RRID:AB_1834440 |
| PerCP/Cyanine5.5 anti-mouse CD185 (CXCR5) (Clone L138D7) | BioLegend | Cat#145508, RRID:AB_2561972 |
| PerCP/Cyanine5.5 rat anti-mouse CD44 (Clone IM7) | Thermo Fisher Scientific | Cat#45-0441-82, RRID:AB_925746 |
| PerCP/Cyanine5.5 rat anti-mouse IFN-γ (Clone XMG1.2) | BioLegend | Cat#505821, RRID:AB_961361 |
| Flag(anti-DYKDDDDK) | BioLegend | Cat#637301, RRID:AB_1134266 |
| cGAS (D3O8O) Rabbit mAb (Mouse Specific) | Cell Signling | Cat#31659, RRID:AB_2799008 |
| Cleaved Caspase-3 (Asp175) Antibody | Cell Signling | Cat#9661, RRID:AB_2341188 |
| β-actin | Proteintech | Cat#66009-1-Ig, RRID:AB_2687938 |
| Anti-Mouse CD279 (PD-1) purified In vivo antibody (Clone 29F.1A12) | Leinco Technologies | Cat#P377, RRID:AB_2737558 |
| Invivo rat IgG2a isotype control antibody | Bio X Cell | Cat#BE0089, RRID:AB_1107769 |
| Bacterial and virus strains | ||
| High titer, high volume lentivirus production of 1 TRC clone (target: XKR8) | Sigma-Aldrich | Cat#TRCN0000178308 |
| High titer, high volume lentivirus production of 1 non targeting control | Sigma-Aldrich | Cat#CSTVRS |
| Chemicals, peptides, and recombinant proteins | ||
| Annexin V AF647 | Innovative Research | Cat#A23204, RRID:AB_2341149 |
| BBL Thioglycollate Medium, Brewer Modified | BD Biosciences | Cat#211716 |
| CountBright Absolute Counting Beads, for flow cytometry | Thermo Fisher Scientific | Cat#C36950 |
| DNase I | Roche | Cat#10104159001 |
| GE Healthcare Percoll PLUS Centrifugation Media | GE Healthcare | Cat#17544502 |
| Liberase TL Research Grade | Roche | Cat#5401020001 |
| SYTOX Green Nucleic Acid Stain | Thermo Fisher Scientific | Cat#S7020 |
| Critical commercial assays | ||
| Zombie NIR Fixable Viability Kit | BioLegend | Cat#423106 |
| AbC Total Antibody Compensation Bead Kit | Thermo Fisher Scientific | Cat#A10497 |
| IL-10 Mouse Uncoated ELISA Kit with Plates | Thermo Fisher Scientific | Cat#88-7105-22 |
| Standard Macrophage Depletion Kit | Encapsula NanoSciences | Cat#CLD-8901 |
| Deposited data | ||
| RNAseq data for TAMs (PSin) | This study | GSE185591 |
| RNAseq data for TAMs (PSout) and NK cells (PSin) | This study | GSE200752 |
| scRNAseq data for HNSCC | (Cillo et al., 2020) | GSE139324 |
| scRNAseq data for CRC | (Zhang et al., 2020) | GSE146771 |
| Experimental models: Cell lines | ||
| M. musculus: MC38 | Douglas R. Green, SJCRH | N/A |
| M. musculus: CT26 | Jian Yu, Hillman Cancer Center | N/A |
| M. musculus: LLC | Douglas R. Green, SJCRH | N/A |
| M. musculus: B16-OVA | Douglas R. Green, SJCRH | N/A |
| Experimental models: Organisms/strains | ||
| Mouse: C57BL/6J | The Jackson Laboratory | RRID:IMSR_JAX:000664 |
| Mouse: BALB/cJ | The Jackson Laboratory | RRID:IMSR_JAX:000651 |
| Mouse: Batf3−/− mice | The Jackson Laboratory | RRID:IMSR_JAX:013755 |
| Mouse: Rag1−/− mice | The Jackson Laboratory | RRID:IMSR_JAX:002216 |
| Mouse: NSG mice | The Jackson Laboratory | RRID:IMSR_JAX:005557 |
| Mouse: Stinggt mice | The Jackson Laboratory | RRID:IMSR_JAX:017537 |
| Mouse: IL10−/− mice | The Jackson Laboratory | RRID:IMSR_JAX:002251 |
| Mouse: IL10rb−/− mice | The Jackson Laboratory | RRID:IMSR_JAX:005027 |
| Mouse: Havcr2−/− mice | Vijay K. Kuchroo, Harvard | N/A |
| Mouse: Tim4d−/− mice | Binfeng Lu, University of Pittsburgh | N/A |
| Mouse: Gsdmd−/− mice | The Jackson Laboratory | RRID:IMSR_JAX:032663 |
| Mouse: Casp1/11−/− mice | The Jackson Laboratory | RRID:IMSR_JAX:016621 |
| Recombinant DNA | ||
| FUIPW-MFG-E8Cter | This study | Table S2 |
| Software and algorithms | ||
| FlowJo 10 | FlowJo | https://www.flowjo.com/ |
| GraphPad Prism | GraphPad | https://www.graphpad.com/ |
| Partek Flow | Partek | https://upitt0a.partek.com/flow/homepage.xhtml |
Highlights.
PSout tumors grow larger than WT, with an immune-suppressive tumor microenvironment
TIM-3 is responsible for PS sensing in PSout tumors
PSin tumors activate STING, leading to TAM M1 polarization and NK cell cytotoxicity
Silencing Xkr8 in vivo to block PS externalization provides anti-tumor effects in mice
ACKNOWLEDGMENTS
This study was generously supported by start-up funding from Hillman Cancer Center (Y.N.G., J.S.O.) and in part by award number P30CA047904 and DP2GM146320 from the National Institutes of Health (Y.N.G.) and NCI grant R00CA207727 (J.S.O.). B.L. is supported by NIH grants R01CA254274 and R01CA239716. S.L. is supported by NIH grants R01CA174305, R01CA219399, and R01CA223788, and a grant from the Shear Family Foundation. D.V. is supported by R35CA263850, P50CA254865, and P50CA097190. We thank Susu Duan and Douglas R. Green for invaluable comments and editing.
Footnotes
SUPPLEMENTAL INFORMATION
Supplemental information can be found online at https://doi.org/10.1016/j.celrep.2022.111582.
DECLARATION OF INTERESTS
D.A.A.V. is cofounder and stockholder of Novasenta, Potenza, Tizona, and Trishula; stock holder of Oncorus, Werewolf, and Apeximmune; has patents licensed and royalties from Astellas, BMS, and Novasenta; is a scientific advisory board member of Tizona, Werewolf, F-Star, Bicara, Apeximmune, and T7/Imreg Bio; is a consultant for Astellas, BMS, Almirall, Incyte, G1 Therapeutics, and Inzen Therapeutics; and obtained research funding from BMS, Astellas, and Novasenta. A.R.C. is a consultant for AboundBio. All other authors declare no competing interests.
REFERENCES
- Andersen MH, Graversen H, Fedosov SN, Petersen TE, and Rasmussen JT (2000). Functional analyses of two cellular binding domains of bovine lactadherin. Biochemistry 39, 6200–6206. 10.1021/bi992221r. [DOI] [PubMed] [Google Scholar]
- Belzile O, Huang X, Gong J, Carlson J, Schroit AJ, Brekken RA, and Freimark BD (2018). Antibody targeting of phosphatidylserine for the detection and immunotherapy of cancer. ImmunoTargets Ther. 7, 1–14. 10.2147/ITT.S134834. [DOI] [PMC free article] [PubMed] [Google Scholar]
- Birge RB, Boeltz S, Kumar S, Carlson J, Wanderley J, Calianese D, Barcinski M, Brekken RA, Huang X, Hutchins JT, et al. (2016). Phosphatidylserine is a global immunosuppressive signal in efferocytosis, infectious disease, and cancer. Cell Death Differ. 23, 962–978. 10.1038/cdd.2016.11. [DOI] [PMC free article] [PubMed] [Google Scholar]
- Boada-Romero E, Martinez J, Heckmann BL, and Green DR (2020). The clearance of dead cells by efferocytosis. Nat. Rev. Mol. Cell Biol 21, 398–414. 10.1038/s41580-020-0232-1. [DOI] [PMC free article] [PubMed] [Google Scholar]
- Carozza JA, Böhnert V, Nguyen KC, Skariah G, Shaw KE, Brown JA, Rafat M, von Eyben R, Graves EE, Glenn JS, et al. (2020). Extracellular cGAMP is a cancer cell-produced immunotransmitter involved in radiation-induced anti-cancer immunity. Nat. Cancer 1, 184–196. 10.1038/s43018-020-0028-4. [DOI] [PMC free article] [PubMed] [Google Scholar]
- Chen Y, et al. , Pre-press. Nature Nanotechnology. [Google Scholar]
- Cillo AR, Kürten CHL, Tabib T, Qi Z, Onkar S, Wang T, Liu A, Duvvuri U, Kim S, Soose RJ, et al. (2020). Immune landscape of viral- and carcinogen-driven head and neck cancer. Immunity 52, 183–199.e9. 10.1016/j.immuni.2019.11.014. [DOI] [PMC free article] [PubMed] [Google Scholar]
- Cunha LD, Yang M, Carter R, Guy C, Harris L, Crawford JC, Quarato G, Boada-Romero E, Kalkavan H, Johnson MDL, et al. (2018). LC3-Associated phagocytosis in myeloid cells promotes tumor immune tolerance. Cell 175, 429–441.e16. 10.1016/j.cell.2018.08.061. [DOI] [PMC free article] [PubMed] [Google Scholar]
- Dayoub AS, and Brekken RA (2020). TIMs, TAMs, and PS-antibody targeting: implications for cancer immunotherapy. Cell Commun. Signal 18, 29. 10.1186/s12964-020-0521-5. [DOI] [PMC free article] [PubMed] [Google Scholar]
- DeKruyff RH, Bu X, Ballesteros A, Santiago C, Chim YLE, Lee HH, Karisola P, Pichavant M, Kaplan GG, Umetsu DT, et al. (2010). T cell/transmembrane, Ig, and mucin-3 allelic variants differentially recognize phosphatidylserine and mediate phagocytosis of apoptotic cells. J. Immunol 184, 1918–1930. 10.4049/jimmunol.0903059. [DOI] [PMC free article] [PubMed] [Google Scholar]
- Dixon KO, Tabaka M, Schramm MA, Xiao S, Tang R, Dionne D, Anderson AC, Rozenblatt-Rosen O, Regev A, and Kuchroo VK (2021). TIM-3 restrains anti-tumour immunity by regulating inflammasome activation. Nature 595, 101–106. 10.1038/s41586-021-03626-9. [DOI] [PMC free article] [PubMed] [Google Scholar]
- Giampazolias E, Zunino B, Dhayade S, Bock F, Cloix C, Cao K, Roca A, Lopez J, Ichim G, Proïcs E, et al. (2017). Mitochondrial permeabilization engages NF-kappaB-dependent anti-tumour activity under caspase deficiency. Nat. Cell Biol 19, 1116–1129. 10.1038/ncb3596. [DOI] [PMC free article] [PubMed] [Google Scholar]
- Gong YN, Guy C, Olauson H, Becker JU, Yang M, Fitzgerald P, Linkermann A, and Green DR (2017). ESCRT-III acts downstream of MLKL to regulate necroptotic cell death and its consequences. Cell 169, 286–300.e16. 10.1016/j.cell.2017.03.020. [DOI] [PMC free article] [PubMed] [Google Scholar]
- Hart KM, Byrne KT, Molloy MJ, Usherwood EM, and Berwin B (2011). IL-10 immunomodulation of myeloid cells regulates a murine model of ovarian cancer. Front. Immunol 2, 29. 10.3389/fimmu.2011.00029. [DOI] [PMC free article] [PubMed] [Google Scholar]
- Hiraizumi M, Yamashita K, Nishizawa T, and Nureki O (2019). Cryo-EM structures capture the transport cycle of the P4-ATPase flippase. Science 365, 1149–1155. 10.1126/science.aay3353. [DOI] [PubMed] [Google Scholar]
- Humphries JD, Byron A, and Humphries MJ (2006). Integrin ligands at a glance. J. Cell Sci 119, 3901–3903. 10.1242/jcs.03098. [DOI] [PMC free article] [PubMed] [Google Scholar]
- Kawano M, and Nagata S (2018). Lupus-like autoimmune disease caused by a lack of Xkr8, a caspase-dependent phospholipid scramblase. Proc. Natl. Acad. Sci. USA 115, 2132–2137. 10.1073/pnas.1720732115. [DOI] [PMC free article] [PubMed] [Google Scholar]
- Lahey LJ, Mardjuki RE, Wen X, Hess GT, Ritchie C, Carozza JA, Böhnert V, Maduke M, Bassik MC, and Li L (2020). LRRC8A:C/E heteromeric channels are ubiquitous transporters of cGAMP. Mol. Cell 80, 578–591.e5. 10.1016/j.molcel.2020.10.021. [DOI] [PubMed] [Google Scholar]
- Maimon A, Levi-Yahid V, Ben-Meir K, Halpern A, Talmi Z, Priya S, Mizraji G, Mistriel-Zerbib S, Berger M, Baniyash M, et al. (2021). Myeloid cell-derived PROS1 inhibits tumor metastasis by regulating inflammatory and immune responses via IL-10. J. Clin. Invest 131, 126089. 10.1172/JCI126089. [DOI] [PMC free article] [PubMed] [Google Scholar]
- Martinez J, Almendinger J, Oberst A, Ness R, Dillon CP, Fitzgerald P, Hengartner MO, and Green DR (2011). Microtubule-associated protein 1 light chain 3 alpha (LC3)-associated phagocytosis is required for the efficient clearance of dead cells. Proc. Natl. Acad. Sci. USA 108, 17396–17401. 10.1073/pnas.1113421108. [DOI] [PMC free article] [PubMed] [Google Scholar]
- Martinez J, Cunha LD, Park S, Yang M, Lu Q, Orchard R, Li QZ, Yan M, Janke L, Guy C, et al. (2016). Noncanonical autophagy inhibits the autoinflammatory, lupus-like response to dying cells. Nature 533, 115–119. 10.1038/nature17950. [DOI] [PMC free article] [PubMed] [Google Scholar] [Retracted]
- McArthur K, Whitehead LW, Heddleston JM, Li L, Padman BS, Oorschot V, Geoghegan ND, Chappaz S, Davidson S, San Chin H, et al. (2018). BAK/BAX macropores facilitate mitochondrial herniation and mtDNA efflux during apoptosis. Science 359, eaao6047. 10.1126/science.aao6047. [DOI] [PubMed] [Google Scholar]
- Nagata S (2018).Apoptosis and clearance of apoptotic cells. Annu. Rev. Immunol 36, 489–517. 10.1146/annurev-immunol-042617-053010. [DOI] [PubMed] [Google Scholar]
- Ning X, Wang Y, Jing M, Sha M, Lv M, Gao P, Zhang R, Huang X, Feng JM, and Jiang Z (2019). Apoptotic caspases suppress type I interferon production via the cleavage of cGAS, MAVS, and IRF3. Mol. Cell 74, 19–31.e7. 10.1016/j.molcel.2019.02.013. [DOI] [PubMed] [Google Scholar]
- Oft M (2014). IL-10: master switch from tumor-promoting inflammation to antitumor immunity. Cancer Immunol. Res 2, 194–199. 10.1158/2326-6066.CIR-13-0214. [DOI] [PubMed] [Google Scholar]
- Park D, Hochreiter-Hufford A, and Ravichandran KS (2009). The phosphatidylserine receptor TIM-4 does not mediate direct signaling. Curr. Biol 19, 346–351. 10.1016/j.cub.2009.01.042. [DOI] [PubMed] [Google Scholar]
- Qiao J, Liu Z, Dong C, Luan Y, Zhang A, Moore C, Fu K, Peng J, Wang Y, Ren Z, et al. (2019). Targeting tumors with IL-10 prevents dendritic cell-mediated CD8(+) T cell apoptosis. Cancer Cell 35, 901–915.e4. 10.1016/j.ccell.2019.05.005. [DOI] [PubMed] [Google Scholar]
- Riley JS, Quarato G, Cloix C, Lopez J, O’Prey J, Pearson M, Chapman J, Sesaki H, Carlin LM, Passos JF, et al. (2018). Mitochondrial innermembrane permeabilisation enables mtDNA release during apoptosis. EMBO J. 37, e99238. 10.15252/embj.201899238. [DOI] [PMC free article] [PubMed] [Google Scholar]
- Rongvaux A, Jackson R, Harman CCD, Li T, West AP, de Zoete MR, Wu Y, Yordy B, Lakhani SA, Kuan CY, et al. (2014). Apoptotic caspases prevent the induction of type I interferons by mitochondrial DNA. Cell 159, 1563–1577. 10.1016/j.cell.2014.11.037. [DOI] [PMC free article] [PubMed] [Google Scholar]
- Rothlin CV, Hille TD, and Ghosh S (2021). Determining the effector response to cell death. Nat. Rev. Immunol 21, 292–304. 10.1038/s41577-020-00456-0. [DOI] [PMC free article] [PubMed] [Google Scholar]
- Ruffell B, Chang-Strachan D, Chan V, Rosenbusch A, Ho CMT, Pryer N, Daniel D, Hwang ES, Rugo HS, and Coussens LM (2014). Macrophage IL-10 blocks CD8+ T cell-dependent responses to chemotherapy by suppressing IL-12 expression in intratumoral dendritic cells. Cancer Cell 26, 623–637. 10.1016/j.ccell.2014.09.006. [DOI] [PMC free article] [PubMed] [Google Scholar]
- Ruffin AT, Cillo AR, Tabib T, Liu A, Onkar S, Kunning SR, Lampenfeld C, Atiya HI, Abecassis I, Kürten CHL, et al. (2021). B cell signatures and tertiary lymphoid structures contribute to outcome in head and neck squamous cell carcinoma. Nat. Commun 12, 3349. 10.1038/s41467-021-23355-x. [DOI] [PMC free article] [PubMed] [Google Scholar]
- Segawa K, Kurata S, and Nagata S (2016). Human type IV P-type ATPases that work as plasma membrane phospholipid flippases and their regulation by caspase and calcium. J. Biol. Chem 291, 762–772. 10.1074/jbc.M115.690727. [DOI] [PMC free article] [PubMed] [Google Scholar]
- Segawa K, Kurata S, and Nagata S (2018). The CDC50A extracellular domain is required for forming a functional complex with and chaperoning phospholipid flippases to the plasma membrane. J. Biol. Chem 293, 2172–2182. 10.1074/jbc.RA117.000289. [DOI] [PMC free article] [PubMed] [Google Scholar]
- Segawa K, Kurata S, Yanagihashi Y, Brummelkamp TR, Matsuda F, and Nagata S (2014). Caspase-mediated cleavage of phospholipid flippase for apoptotic phosphatidylserine exposure. Science 344, 1164–1168. 10.1126/science.1252809. [DOI] [PubMed] [Google Scholar]
- Somersan S, and Bhardwaj N (2001). Tethering and tickling: a new role for the phosphatidylserine receptor. J. Cell Biol 155, 501–504. 10.1083/jcb.200110066. [DOI] [PMC free article] [PubMed] [Google Scholar]
- Stuart T, Butler A, Hoffman P, Hafemeister C, Papalexi E, Mauck WM 3rd, Hao Y, Stoeckius M, Smibert P, and Satija R (2019). Comprehensive integration of single-cell data. Cell 177, 1888–1902.e21. 10.1016/j.cell.2019.05.031. [DOI] [PMC free article] [PubMed] [Google Scholar]
- Suzuki J, Denning DP, Imanishi E, Horvitz HR, and Nagata S (2013).Xk-related protein 8 and CED-8 promote phosphatidylserine exposure in apoptotic cells. Science 341, 403–406. 10.1126/science.1236758. [DOI] [PubMed] [Google Scholar]
- Wang W, Green M, Choi JE, Gijón M, Kennedy PD, Johnson JK, Liao P, Lang X, Kryczek I, Sell A, et al. (2019). CD8(+) T cells regulate tumour ferroptosis during cancer immunotherapy. Nature 569, 270–274. 10.1038/s41586-019-1170-y. [DOI] [PMC free article] [PubMed] [Google Scholar]
- White MJ, McArthur K, Metcalf D, Lane RM, Cambier JC, Herold MJ, van Delft MF, Bedoui S, Lessene G, Ritchie ME, et al. (2014). Apoptotic caspases suppress mtDNA-induced STING-mediated type I IFN production. Cell 159, 1549–1562. 10.1016/j.cell.2014.11.036. [DOI] [PMC free article] [PubMed] [Google Scholar]
- Wolf Y, Anderson AC, and Kuchroo VK (2020). TIM3 comes of age as an inhibitory receptor. Nat. Rev. Immunol 20, 173–185. 10.1038/s41577-019-0224-6. [DOI] [PMC free article] [PubMed] [Google Scholar]
- Zhang L, Li Z, Skrzypczynska KM, Fang Q, Zhang W, O’Brien SA, He Y, Wang L, Zhang Q, Kim A, et al. (2020). Single-cell analyses inform mechanisms of myeloid-targeted therapies in colon cancer. Cell 181, 442–459.e29. 10.1016/j.cell.2020.03.048. [DOI] [PubMed] [Google Scholar]
- Zheng GXY, Terry JM, Belgrader P, Ryvkin P, Bent ZW, Wilson R, Ziraldo SB, Wheeler TD, McDermott GP, Zhu J, et al. (2017). Massively parallel digital transcriptional profiling of single cells. Nat. Commun 8, 14049. 10.1038/ncomms14049. [DOI] [PMC free article] [PubMed] [Google Scholar]
- Zhou Y, Fei M, Zhang G, Liang WC, Lin W, Wu Y, Piskol R, Ridgway J, McNamara E, Huang H, et al. (2020). Blockade of the phagocytic receptor MerTK on tumor-associated macrophages enhances P2X7R-dependent STING activation by tumor-derived cGAMP. Immunity 52, 357–373.e9. 10.1016/j.immuni.2020.01.014. [DOI] [PubMed] [Google Scholar]
Associated Data
This section collects any data citations, data availability statements, or supplementary materials included in this article.
Supplementary Materials
Data Availability Statement
The RNAseq data for TAMs (PSin) generated in this study were uploaded to GEO: GSE185591. The RNAseq data for TAMs (PSout) and NK cells (PSin) generated in this study were uploaded to GEO: GSE200752.
This paper does not report original code.
Any additional information required to reanalyze the data reported in this paper is available from the lead contact upon request.