

Abstract
Objectives:
To establish the incidence, risk factors and prognostic effect of anemia in children living with HIV (CLWH).
Design:
Retrospective nested case control study of patients 0 – 18 years in five centers in sub-Saharan Africa, 2004 – 2014.
Methods:
Incident cases of anemia were identified from electronic records and matched with CLWH without anemia. We calculated the incidence density of anemia and used conditional logistic regression to evaluate its association with risk factors, stratified by severity and type of anemia. We used a Cox proportional hazards model to evaluate the impact of anemia on survival.
Results:
2,137 children were sampled. The incidence density of anemia was 1 per 6.6 CLWH-years. Anemia was moderate in 31.8% and severe in 17.3% of anemia cases, which had 10-year mortality hazards of 3.4 and 4.5, respectively. Microcytic anemia (36% cases) was associated with 2.3-fold hazard of 10-year mortality, and with malnutrition and CD4 suppression. Normocytic anemia (50.5% cases) was associated with 2.6-fold hazards of 10-year mortality, and with more severe malnutrition, CD4 suppression, and WHO stage, but inversely associated with Lamivudine and Nevirapine therapy. Macrocytic anemia (13.5% cases) was not associated with higher 10-year mortality nor with severe malnutrition or CD4 suppression, but was associated with WHO stage II/III and negatively associated with Lamivudine therapy.
Conclusions:
This large multi-country study of CLWH found a high incidence density of anemia. Higher severity, normocytic and microcytic types of anemia were independently associated with long-term mortality. Laboratory studies are needed to decipher the mechanisms of anemia and how it impacts mortality in CLWH.
Keywords: Children living with HIV, anemia, antiretroviral therapy, sub-Saharan Africa
Introduction
There are an estimated 1.7 million children under 15 years old that are infected with Human Immunodeficiency Virus (HIV) worldwide, 91% of them in sub-Saharan Africa (SSA) [1]. With improved access to combination anti-retroviral therapy (ART) and adequate treatment of opportunistic infections, the survival of children living with HIV (CLWH) in SSA has improved significantly. As a result, non-infectious complications of HIV infection such as anemia are putatively becoming of major significance as causes of morbidity and mortality in CLWH [2, 3].
Anemia is a public health problem in children worldwide with about 42.6% of children affected. Anemia has major adverse effects on children’s survival, physical growth and cognitive development, and, subsequently, their social and economic productivity as adults [4, 5]. The global prevalence and severity of anemia is highest in children in SSA due to the interaction of multiple etiological factors, namely: nutrition (e.g., iron, folate, and Vitamin B12 deficiency), genetic (e.g., sickle cell disease and thalassemia), and infectious (e.g., malaria, HIV, and other viruses) factors. The co-existence and interplay of these complex factors is accentuated in CLWH on ART in SSA. This may potentially result in longstanding and/or severe anemia that impacts survival and quality of life. However, the multiple plausible causes of anemia in these CLWH also means there is difficulty to precisely determine the cause, and, therefore, inability to effectively prevent and treat anemia in these children [6–9]. Some pediatric HIV case-control or cross-sectional studies from the pre-ART era, and from smaller studies in the post-ART era, have shown conflicting patterns of anemia, its association with ART, and impact on outcomes [9–12]. The objectives of this study were to quantify the incidence density of anemia, characterize the types of anemia and associated risk factors, and their impact on survival of CLWH in SSA.
Materials and Methods
Study design and study population
We conducted a nested case control study of children with/without anemia in the Baylor International Pediatric AIDS Initiative (BIPAI) clinical cohort [13]. We used a nested case-control design to reduce bias from missing data in this retrospective study. The BIPAI network is one of the largest providers of pediatric HIV treatment centers in SSA and globally, consisting of eight specialized pediatric HIV centers in SSA (since 2000) and Romania with standardized HIV clinical practice guidelines across the network. The clinical centers routinely use an electronic medical record (EMR) system as part of clinical care and have IRB-approved protocols that allow for de-identified retrospective research. Children were referred to the centers from all over the respective countries following early infant screening and diagnosis, or when they developed clinical evidence of HIV infection. Children with HIV infection had longitudinal routine and sick clinic visits. Complete blood counts (CBC) were performed as clinically indicated during these visits using automated CBC analyzers. Children were treated according to WHO guidelines; in the 2004 – 2008 era, the standard practice was to commence children on ART when they met specific CD4 cell and WHO stage criteria. WHO’s “test and treat” policy was rolled out across the network after 2008.
Cases and controls
Cases were defined as children with HIV infection and any instance of anemia while controls were children with HIV infection but no instance of anemia throughout the course of their care at the BIPAI center. Anemia was defined as hemoglobin (HB) concentration less than the lower limit for age according to WHO reference ranges for individuals living at sea level (Supplementary Table 1)[14]. Anemia was further stratified by severity and mean corpuscular volume (MCV) according to WHO thresholds for age and sex. To classify anemia by severity, we used the nadir HB during the follow up period.
Children who were diagnosed with anemia within 3 months (wash-out period) of enrollment into HIV care were considered prevalent cases and were excluded from further analysis; those diagnosed with anemia after 3 months of enrollment were considered incident. All incident anemia cases were included in the analysis. Controls were randomly selected from the risk set of children without anemia and matched on follow-up time. Follow-up time was measured from time of enrollment into HIV care at the BIPAI center to the date of diagnosis of death or last attendance at the BIPAI center.
Study variables and definition
The records of all incident cases and selected controls were retrospectively reviewed from 1st January 2004 until 31st December 2014 for one of the following outcomes of interest: anemia, death, or no longer attending care at the BIPAI center. Children were censored at the date of death or last attendance at the BIPAI center if they had no diagnosis of anemia by 31st December 2014. The maximum possible follow-up time for an individual child in the cohort was 11 years. The following covariates were extracted from the EMR on all cases and controls at all time points they were available: age, sex, country, date of enrollment at BIPAI center, date of initiation of ART, names of ART agents, WHO HIV/AIDS Stage at enrollment, CD4 lymphocyte counts/percentages, height, and weight.
Data cleaning and organization
Data was electronically abstracted and transferred into Microsoft Excel version 16.16.3 (Redmond, WA), where it was collated before exportation into SAS version 9.4 (Cary, NC) for further curation, coding, organization, and analysis. Derivative variables were computed from raw data, e.g., survival time, was calculated from date of enrollment into HIV care to date of death. Continuous variables (e.g., age, CD4 cell counts, HB concentration) and ordinal variables (e.g., year of enrollment) were consolidated into logical categories (e.g., age groups and severity of anemia). Particularly, CD4 lymphocyte levels were categorized as defined by the World Health Organization [15]. We calculated z-scores for weight-for-length/height (age <5 years) and BMI-for-age (age >5 years) using World Health Organization guidelines for malnutrition[16], and categorized nutritional status as follows: adequate (>−1SD), mild malnutrition (−1 – −2 SD), moderate malnutrition (−2 – −3 SD), and severe malnutrition (≤−3 SD).
Statistical Analysis
We calculated the incidence density and risk factors associated with anemia. To evaluate the association of putative risk factors and anemia, we used conditional logistic regression to compute odds ratios (unadjusted and adjusted – where applicable). We calculated relative risks of death at 1, 5 and 10-year time points and used Gray’s test to assess whether incidence density curves were the same or different at all timepoints. We also performed Kaplan-Meier survival analysis to create survival curves and a Cox proportional hazard model to estimate hazard ratios of 10-year overall survival by type and severity of anemia. All hypothesis test computations included 95% confidence intervals to estimate the precision of associations and p-values to estimate the robustness of the statistical models, which were considered robust if p-value < 0.05.
Ethical review
Ethical approval was obtained from Baylor College of Medicine in addition to each of the relevant institutional review boards (IRBs) in Botswana, Malawi, Tanzania, and Uganda. Informed consent was waived by the respective IRBs in view of a retrospective study design using de-identified patient information.
Results
Clinical characteristics of the nested cohort
We sampled 2137 CLWH enrolled at the five BIPAI centers between January 2004 to December 2014 and who had at least one CBC result in the EMR during this period, for a total of 11,667 CLWH-years. The clinical and demographic characteristics of the study sample are summarized in Table 1. Cases of anemia were adequately matched with controls on follow-up time. The incidence density of anemia was 1 per 6.6 (95% CI 6.4 – 6.9) CLWH-years. Among CLWH with anemia (1,756), 50.9% had mild anemia, 31.8% had moderate anemia, while 17.3% had severe anemia (Supplementary Table 2). With regards to type of anemia as classified by MCV, 50.5% had normocytic anemia, 36% had microcytic anemia, while 13.5% had macrocytic anemia. About 50% of children had a concurrent quantitative blood cell abnormality, most commonly leukopenia in 23.4% and thrombocytosis in 18.1% of CLWH and anemia.
Table 1.
Demographic and clinical characteristics of children with Anemia and Controls in the BIPAI nested case control study.
| Demographic/Clinical Variables | N (%) |
|---|---|
| Year of enrollment into HIV care 2004 – 2008 | 1229 (49.58%) |
| 2008 – 2014 | 1250 (50.42%) |
| Sex | |
| Anemia (n=1756) Male | 1068 (60.82%) |
| Female | 688 (39.18%) |
| No anemia (n=381) Male | 189 (49.61%) |
| Female | 192 (50.39%) |
| Age (Mean, Median) | |
| Anemia (n=1756) | 6.45, 5.30 |
| No anemia (n=381) | 7.19, 6.30 |
| Follow-up time (Mean, Median, [Range]), years | |
| Anemia (n=1756) | 5.32, 5.33, [0 – 10] |
| No anemia (n=381) | 6.10, 6.42, [0 – 10] |
| Number of CBCs (Mean, Median, [Range]) | |
| Anemia (n=1756) | 7.91, 6.00, [1 – 58] |
| No anemia (n=381) | 5.74, 4.00, [1 – 23] |
BIPAI – Baylor International Pediatric AIDS Initiative; HIV – Human Immunodeficiency Virus; CBC – Complete blood count
Risk factors associated with anemia in CLWH
The association of risk factors of interest with anemia is summarized in Table 2. All degrees of malnutrition were associated with anemia. Since malnutrition has a strong multi-factorial association with anemia, we adjusted all other risk factors for nutrition status. Severe CD4 suppression and advanced (III/IV) WHO Stage were associated with 78% (95% CI 1.32 – 2.41, p<0.001) and 63% (95% CI 1.24 – 2.14, p<0.001) odds of anemia, respectively, after adjusting for malnutrition. On the other hand, the ART agents Lamivudine and Nevirapine were associated with 47% (95% CI 0.30 – 0.96, p<0.037) and 21% (95% CI 0.62 – 1.00, p<0.045) odds of anemia. Zidovudine had no association with anemia, nor did combining it with another nucleoside reverse transcriptase inhibitor (NRTI) i.e., Lamivudine, increase the risk of anemia. On average, and adjusted for malnutrition and CD4 count, HB levels increased by 0.18 g/dL per year, of ART treatment among children who had anemia before commencing ART.
Table 2.
Risk factors associated with anemia in children living with HIV infection in the BIPAI cohort.
| Risk Factor | Anemia, N (%) |
No Anemia, N (%) |
Odds Ratio (OR), (95% CI) |
Adjusted* OR, (95% CI) |
|---|---|---|---|---|
|
Nutrition (n=1923) Adequate (Ref) Mild Moderate Severe |
928 (59.0%) 329 (20.9%) 165 (10.5%) 151 (9.6%) |
270 (77.1%) 50 (14.3%) 14 (4.0%) 16 (4.6%) |
- 1.91, (1.38, 2.66)** 3.43, (1.95, 6.01)** 2.75, (1.61, 4.68)** |
N/A |
|
CD4 Nadir (n = 1893) Normal (Ref) Mild Moderate Severe |
311 (20.1%) 209 (13.5%) 344 (22.3%) 681 (44.1%) |
103 (29.6%) 51 (14.7%) 80 (23.00%) 114 (32.8%) |
- 1.36, (0.93, 1.98) 1.42, (1.02, 1.98)** 1.98, (1.47, 2.67)** |
- 1.32, (0.90, 1.93) 1.34, (0.96, 1.87) 1.78, (1.32, 2.41)** |
|
First WHO Stage (n = 1370) I/II (Ref) III/IV |
433 (39.2%) 671 (60.8%) |
144 (54.1%) 122 (45.9%) |
- 1.83, (1.40, 2.40)** |
- 1.63, (1.24, 2.14)** |
|
Zidovudine ART (n = 1923) No Zidovudine (Ref) Zidovudine |
836 (53.15%) 737 (46.85%) |
173 (49.43%) 177 (50.57%) |
- 0.86, (0.68, 1.09) |
- 0.925, (0.73, 1.17) |
|
Lamivudine ART (n = 1923) No Lamivudine Lamivudine |
111 (7.1%) 1462 (92.9%) |
13 (3.7%) 337 (96.3%) |
- 0.51, (0.28, 0.91)** |
- 0.53, (0.30, 0.96)** |
|
Nevirapine ART (n = 1923) No Nevirapine Nevirapine |
734 (46.66%) 839 (53.34%) |
148 (42.29%) 202 (57.71%) |
- 0.84, (0.66, 1.06) |
- 0.79, (0.62, 1.00)** |
|
Zidovudine+Lamivudine (n = 1923) Neither (Ref) Lamivudine only Combination with both |
111 (7.1%) 725 (46.1%) 737 (46.9%) |
13 (3.7%) 160 (45.7%) 177 (50.6%) |
0.53, (0.29, 0.97)** 0.49, (0.27, 0.89)** |
0.54, (0.29, 0.98)** 0.53, (0.29, 0.97)** |
BIPAI – Baylor International Pediatric AIDS Initiative; WHO – World Health Organization; ART – Anti-Retroviral Therapy
Adjusted for nutritional status as determined by weight and height for age
p-value <0.05
Nutrition categories: adequate (>−1SD); mild (−1 – −2 SD), moderate (−2 – −3 SD), and severe malnutrition (≤−3 SD)
Risk factors associated with microcytic anemia in CLWH
The risk of microcytic anemia was higher among children with malnutrition, and higher among those with moderate and severe malnutrition compared to those with mild malnutrition (Supplementary Table 3). After adjusting for malnutrition, severe CD4 suppression was associated with 77% (95% CI 1.23 – 2.54, p=0.002) odds of microcytic anemia; however, there was no association of advanced (III/IV) WHO Stage and microcytic anemia. Regarding the association of microcytic anemia and ART agents, only Nevirapine had a protective effect although it was small, (aOR=0.74, 95% CI 0.56 – 0.98, p=0.036) while Lamivudine and Nevirapine or a combination of these two NRTIs was associated with microcytic anemia. Zidovudine had no association with anemia in this cohort, nor did combining it with another nucleoside reverse transcriptase inhibitor (Lamivudine) increase the risk of anemia.
Risk factors associated with normocytic anemia in CLWH
The risk of normocytic anemia was higher among children with all degrees of malnutrition (Table 3). After adjusting for malnutrition, normocytic anemia was associated with CD4 suppression and advanced (III/IV) WHO Stage. Lamivudine and Nevirapine in the ART regimen were protective against normocytic anemia but Zidovudine had no association with risk of normocytic anemia.
Table 3.
Risk factors for normocytic anemia in children living with HIV infection in the BIPAI cohort.
| Risk Factor | Normocytic Anemia, N (%) |
No Anemia, N (%) |
Odds Ratio (OR), 95%CI |
Adjusted* OR, 95%CI |
|---|---|---|---|---|
|
Nutrition***
(n=1082) Adequate (Ref) Mild Moderate Severe |
443 (60.5%) 159 (21.7%) 63 (8.6%) 67 (9.2%) |
270 (77.1%) 50 (14.3%) 14 (4.0%) 16 (4.6%) |
- 1.94, (1.36 – 2.76)** 2.74, (1.51 – 4.99)** 2.55, (1.45 – 4.50)** |
- N/A |
|
CD4 Nadir (n = 1069) Normal (Ref) Mild Moderate Severe |
128 (17.8%) 102 (14.2%) 160 (22.2%) 331 (45.9%) |
103 (29.6%) 51 (14.7%) 80 (23.00%) 114 (32.8%) |
- 1.61, (1.05 – 2.46)** 1.61, (1.11 – 2.34)** 2.34, (1.67 – 3.27)** |
- 1.57, (1.02 – 2.42)** 1.53, (1.04 – 2.23)** 2.18, (1.55 – 3.06)** |
|
First WHO Stage (n = 791) I/II (Ref) III/IV |
206 (39.2%) 319 (60.8%) |
144 (54.1%) 122 (45.9%) |
- 1.82, (1.36 – 2.46)** |
- 1.66, (1.23 – 2.26)** |
|
Zidovudine ART (n = 1082) No Zidovudine (Ref) Zidovudine |
391 (53.4%) 341 (46.6%) |
173 (49.4%) 177 (50.6%) |
- 0.85, (0.66 – 1.10) |
- 0.91, (0.70 – 1.18) |
|
Lamivudine ART (n = 1082) No Lamivudine Lamivudine |
62 (8.5%) 670 (91.5%) |
13 (3.7%) 337 (96.3%) |
- 0.42, (0.23 – 0.77)** |
- 0.47, (0.25 – 0.87)** |
|
Nevirapine ART (n = 1082) No Nevirapine Nevirapine |
367 (50.1%) 365 (49.9%) |
148 (42.3%) 202 (57.7%) |
- 0.73, (0.56 – 0.94)** |
- 0.71, (0.55 – 0.92)** |
|
Zidovudine+Lamivudine (n = 1082) Neither (Ref) Lamivudine only Combination with both |
62 (8.5%) 329 (45.0%) 341 (46.6%) |
13 (3.7%) 160 (45.7%) 177 (50.6%) |
- 0.43, (0.23 – 0.81)** 0.40, (0.22 – 0.76)** |
- 0.47, (0.25 – 0.89)** 0.46, (0.25 – 0.87)** |
BIPAI – Baylor International Pediatric AIDS Initiative; WHO – World Health Organization; ART – Anti-Retroviral Therapy
Adjusted for nutritional status
p-value <0.05
Nutrition categories: adequate (>−1SD); mild (−1 – −2 SD), moderate (−2 – −3 SD), and severe malnutrition (≤−3 SD)
Risk factors associated with macrocytic anemia in CLWH
The risk of macrocytic anemia was higher among children with mild and moderate malnutrition, but, paradoxically, not those with severe malnutrition (Supplementary Table 4). After adjusting for malnutrition, macrocytic anemia was associated with advanced (III/IV) WHO Stage (aOR=2.99, 95% CI 1.88 – 4.77, p<0.001) but was not associated with CD4 suppression. Use of Lamivudine without Zidovudine in the ART regimen was protective against macrocytic anemia (aOR=0.42, 95% CI 0.18 – 0.98, p<0.044) but other ART agents were not associated with macrocytic anemia.
Anemia and survival of CLWH
Compared to CLWH who had no anemia, those with moderate and severe anemia had higher relative risk (RR) of death while those with mild anemia did not have an increased risk of death. The relative risk of death increased with severity of anemia and persisted through 10 years of HIV care. The RR of death at 1 year, 5 years, and 10 years from the first occurrence of moderate anemia for CLWH was 4.78 (95% CI 2.41 – 9.49), 4.96 (95% CI 2.88 – 8.53) and 4.00 (95% CI 2.48 – 6.45), Gray’s test p<0.001 for each of the RR. Moderate anemia had 3.4 hazards on 10-year mortality (95% CI 2.0 – 5.6), p < 0.001), after adjusting for malnutrition, CD4 nadir, WHO Stage, and use of Zidovudine and Lamivudine in ART (Figure 1). The RR of death at 1 year, 5 years, and 10 years from the first occurrence of severe anemia for CLWH was 9.24 (95% CI 4.69 – 18.23), 8.12 (95% CI 4.73 – 13.93) and 5.74 (95% CI 3.56 – 9.24), Gray’s test p<0.001 for each of the RR. Severe anemia had 4.5 hazards of 10-year mortality (95% CI 2.68 – 7.67), p < 0.001), after adjusting for malnutrition, CD4 nadir, WHO Stage, and use of Zidovudine and Lamivudine in cART.
Figure 1.
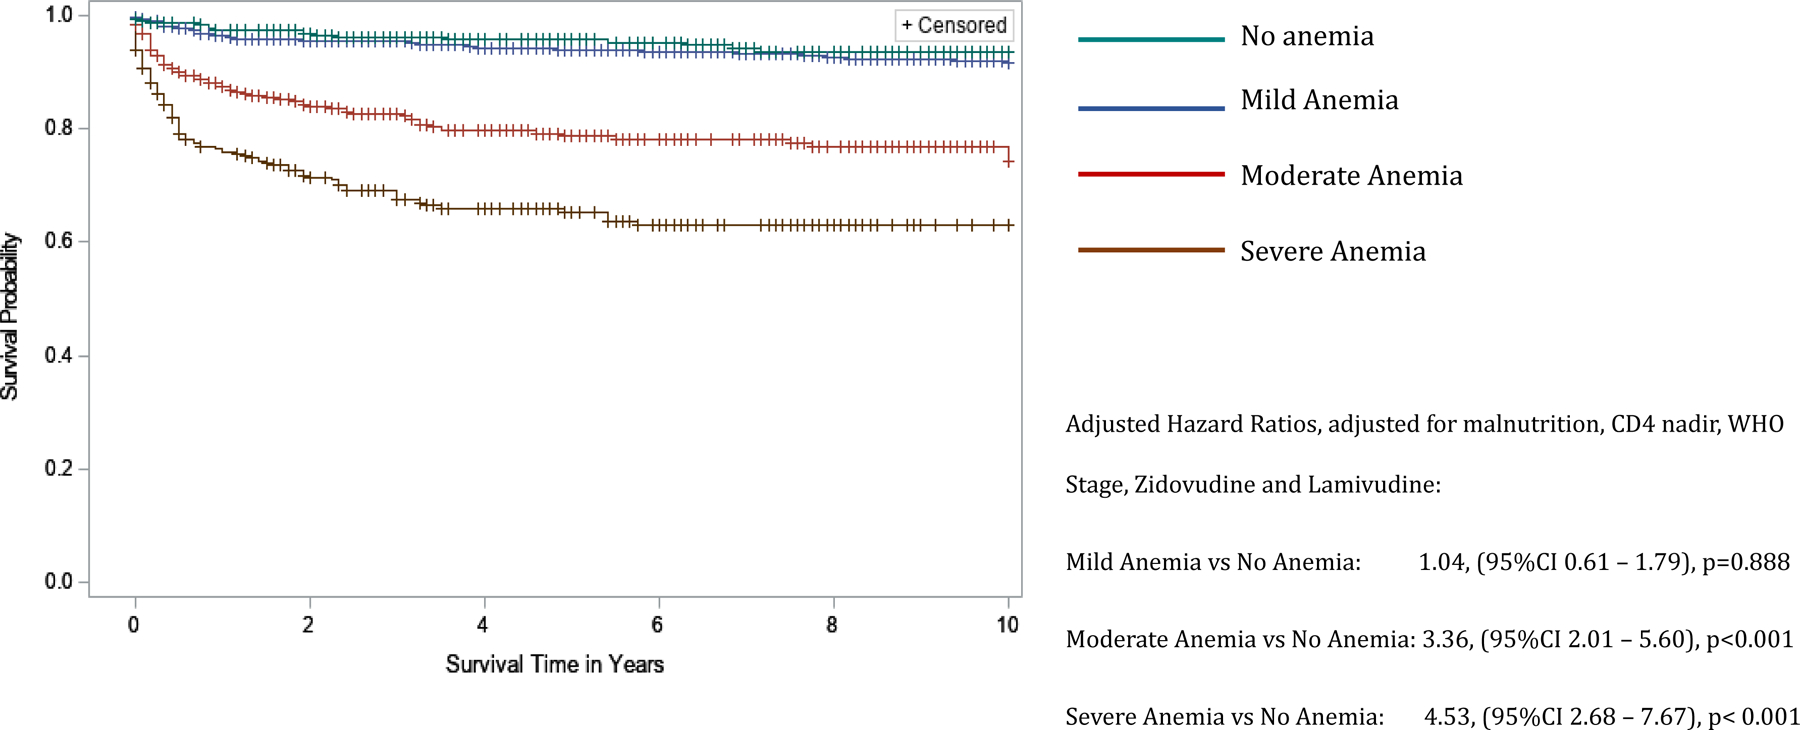
Kaplan-Meier curves comparing 10-year survival of children living with HIV infection in the BIPAI cohort by severity of anemia. Kaplan-Meier survival analysis was used to create survival curves and a Cox proportional hazard model to estimate hazard ratios of 10-year overall survival by severity of anemia: no anemia (n = 381) – green font survival curve, mild anemia (n = 894) – blue font survival curve, moderate anemia (n = 558) – red font survival curve, and severe anemia (n = 304) – brown font survival curve. Cross marks in the curves indicate the timing of censorship of the children upon death or loss to follow-up in the follow-up period. Using the no anemia group as reference, the adjusted hazard ratio (adjusted for nutrition status) associated with various categories of severity of anemia was 1.04, 95%CI 0.61 – 1.79, p-value=0.888 for mild anemia, 3.36, 95%CI 2.01 – 5.60, p-value<0.001 for moderate anemia, and 4.53, 95%CI 2.68 – 7.67, p-value<0.001 for severe anemia. All statistical models were considered robust if p-value <0.05.
Compared to CLWH who had no anemia, those with microcytic anemia or normocytic anemia had significantly higher mortality. Normocytic anemia had the strongest association with death; with RR at 1 year, 5 years, and 10 years from the first occurrence of normocytic anemia of 4.96 (95% CI 2.54 – 9.72), 4.16 (95% CI 2.43 – 7.12) and 3.15 (95% CI 1.97 – 5.06), respectively; Gray’s test p<0.001 for each of the RR. Normocytic anemia had 2.6 hazards of 10-year mortality (95% CI 1.60 – 4.36), p < 0.001), after adjusting for malnutrition, CD4 nadir, WHO Stage, and use of Zidovudine and Lamivudine in cART (Figure 2). The RR of death at 1 year, 5 years, and 10 years for CLWH with microcytic anemia was 3.48 (95% CI 1.73 – 7.00), 3.54 (95% CI 2.03 – 6.15) and 2.95 (95% CI 1.81 – 4.81), respectively; Gray’s test p<0.001 for each of the RR. Microcytic anemia had 2.3 hazards of 10-year mortality (95% CI 1.39 – 3.93), p = 0.002), after adjusting for malnutrition, CD4 nadir, WHO Stage, and use of Zidovudine and Lamivudine in cART. Macrocytic anemia was not associated with increased 10-year mortality hazards or relative risk of death except at 5 years when CLWH with macrocytic anemia had a RR=2.21 (95% CI 1.09 – 4.47), Gray’s test p=0.024.
Figure 2.
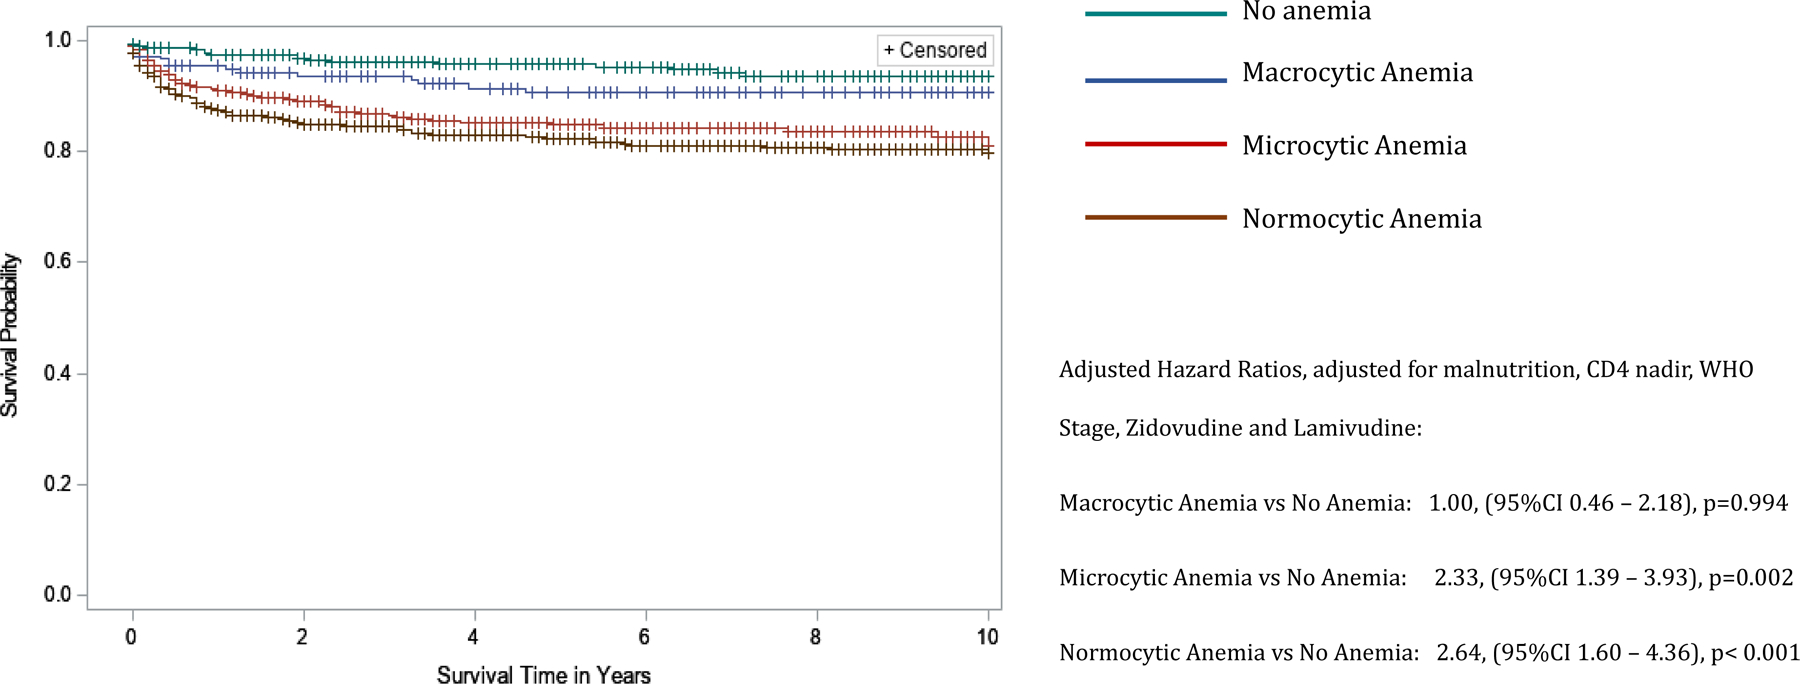
Kaplan-Meier curves comparing 10-year survival of children living with HIV infection by type of anemia in the BIPAI cohort. Kaplan-Meier survival analysis was used to create survival curves and a Cox proportional hazard model to estimate hazard ratios of 10-year overall survival by type of anemia: no anemia (reference group, n = 381) – green font survival curve, macrocytic anemia (n=216) – blue font survival curve, microcytic anemia (n=577) – red font survival curve, normocytic anemia (n=810) – brown font survival curve. Cross marks in the curves indicate the timing of censorship of the children upon death or loss to follow-up in the follow-up period. The adjusted hazard ratio (adjusted for nutrition status) associated with various types of anemia was 1.00, 95%CI 0.46 – 2.18, p-value=0.994 for macrocytic anemia, 2.33, 95%CI 1.39 – 3.93, p-value=0.002 for microcytic anemia, and 2.64, 95%CI 1.60 – 4.36, p-value<0.001 for normocytic anemia. All statistical models were considered robust if p-value <0.05.
Discussion
The objectives of this study were to quantify the incidence density of anemia, characterize the types of anemia and associated risk factors, and their impact on survival of CLWH and on cART in SSA.
Although there is a paucity of data on incidence of anemia in the pediatric population in SSA, the World Health Organization conducted a comprehensive Global Prevalence of Anemia report in 2011 that found a prevalence of anemia of 53.8% in Africa, and 3.6% with severe anemia[17]. Therefore, we surmise that the high proportion (17.3%) of severe anemia in this cohort of CLWH in SSA is indicative of a much higher burden of severe anemia in this population. Moreover, the results demonstrate that the occurrence of severe or even moderate anemia in CLWH predicts a remarkably lower probability of long-term survival. To devise clinical strategies to reduce mortality in CLWH, it is critical to understand the pathological mechanisms linking long-term mortality and anemia in these children. The types of anemia and their risk factors provide probable hypotheses regarding the mechanisms of anemia and, hence, mortality.
About one third (32%) of cases of anemia in children in SSA are attributed to iron deficiency, which classically causes microcytic erythrocytes. This cohort had a similar (36%) proportion of microcytic anemia. The differential diagnosis of microcytic anemia includes iron deficiency, anemia of chronic disease, thalassemia, and sideroblastic anemia. The latter two are relatively rare hereditary disorders; hence, most of the microcytic anemia in these CLWH is likely due to iron deficiency or anemia of chronic disease (also known as anemia of inflammation) – an acquired abnormality of iron metabolism that is associated with chronic immune activation whereby iron uptake by erythroid progenitors is inhibited. Whereas microcytosis due to iron deficiency in children, and in this cohort of CLWH, is strongly associated with malnutrition, microcytic anemia was still associated with a 2.3-fold higher ten-year mortality after adjusting for malnutrition. This suggests other mechanisms, such as anemia of inflammation, may account for microcytic anemia and its association with higher long-term mortality in CLWH. It is plausible that in this cohort microcytic anemia served as a marker of chronic immune activation and its associated long-term deleterious effects, leading to mortality. Future studies of iron metabolism in CLWH can elucidate the predominant mechanisms and inform preventive or treatment strategies.
Normocytic anemia had the strongest association with lower ten-year survival in this cohort. The risk of normocytic anemia was also associated with increasing severity of all indicators of poorly controlled HIV infection, i.e., malnutrition, CD4 suppression, and WHO stage, while ART agents were protective except for Zidovudine monotherapy. Hypothetically, likely causes of normocytic anemia in the setting of HIV infection may include anemia of inflammation, hemolysis due to immune dysfunction or infections, macronutrient (protein) deficiency, and bone marrow suppression due to opportunistic infections.
Unlike normocytic anemia and microcytic anemia, macrocytic anemia was not associated with lower ten-year survival in this cohort. Macrocytic anemia was associated with several indicators of relatively controlled HIV infection, i.e., associated with mild and moderate malnutrition but not severe malnutrition and not associated with CD4 suppression. Considering this, the association of macrocytic anemia with advanced WHO stage is difficult to explain; but may be related to the fact that these data represent the presenting WHO stage, while the anemia (and associated erythrocyte size) is evaluated throughout the course of disease and/or follow-up. Use of Lamivudine has been previously shown to result in macrocytosis as was observed in this cohort [18]. Zidovudine is also associated with macrocytosis although to a lesser degree than Lamivudine. Overall, we conclude that macrocytosis is a favorable feature in CLWH because it probably represents adherence to NRTI-containing ART [19]. Other hypothetical causes of macrocytic anemia in the setting of HIV infection may include vitamin B12 and folate deficiency and causes of bone marrow dyserythropoiesis other than NRTIs.
The Anemia in HIV Working Group (2003) previously identified several risk factors for anemia in adults with HIV infection in the US and Europe; these include advanced stage, severe CD4 suppression, Zidovudine and CD4 suppression [20–22]. The Working Group also showed anemia to be an independent predictor of HIV prognosis in adults, with variations depending on the specific population and severity of anemia [23–27]. For CLWH in SSA, widespread early infant diagnosis and use of ART has only been achieved over the last decade [28, 29], hence there is a paucity of robust evidence to understand the problem of anemia and its implications in this population that is particularly at high risk of anemia regardless of HIV infection, and for whom anemia may have major implications for survival and cognitive and physical development. This study fills some of these critical evidence gaps and generates hypotheses for future studies to address the problem of anemia in CLWH in SSA.
Limitations
This was a retrospective nested case control study; hence, it may be prone to bias due to missing data. We used a nested case control instead of a retrospective cohort design to mitigate this potential bias and applied the most common sparse-data fitting method for stratified logistic models, conditional logistic regression, to reduce sparse data bias. The ratio of cases to controls in the study was 4.6; the small proportion of controls was because most CLWH develop anemia in the course of their HIV disease. Furthermore, additional clinical variables such as specific opportunistic infections and viral loads would be relevant risk factors to examine; however, we did not include them in this analysis due to inconsistent specificity or availability of this data in the cohort. We were also unable to interrogate the causes of mortality in this cohort for the same reasons; this would help to identify mechanistic links between anemia and mortality.
Conclusion
This nested case control study used a large multi-country cohort of children treated using standardized evidence-based HIV clinical guidelines and a central EMR to quantify the incidence density, types, risk factors, and impact on long-term survival of anemia in CLWH in SSA. The study demonstrates the relatively high occurrence of anemia in CLWH, the strong independent predictive role of anemia on long-term survival, and the complex and multi-factorial risk factors associated with various types of anemia in CLWH. Future studies will focus on prospective designs that include laboratory analysis of blood and other biospecimens to decipher the etiological and pathogenetic mechanisms of anemia in CLWH, and their mechanistic sequalae that lead to increased long-term mortality.
Supplementary Material
Acknowledgements
The authors wish to thank the children and families of the BIPAI clinical centers and all the front-line clinical staff who have cared for them over the years. We also acknowledge the contributions of the following individuals to this work: Mr. Mike Mizwa and Mr. John Dudley.
This research was funded by National Institutes of Health/National Cancer Institute, P30 CA125123-09S3 and National Institutes of Health, National Cancer Institute, Baylor College of Medicine/University of Texas Houston Center for AIDS Research Pilot Grants
Funding
3P30CA125123-09S3, National Institutes of Health, National Cancer Institute, P30 Supplement for HIV-related Malignancies
Footnotes
Disclaimers: None
Conflicts of Interest
The authors declare no conflict of interest.
BIBLIOGRAPHY/REFERENCES CITED
- 1.UNAIDS. Global HIV & AIDS statistics — 2019 fact sheet 2019.
- 2.Frigati L, Archary M, Rabie H, Penazzato M, Ford N. Priorities for Decreasing Morbidity and Mortality in Children With Advanced HIV Disease. Clin Infect Dis 2018; 66(suppl_2):S147–s151. [DOI] [PMC free article] [PubMed] [Google Scholar]
- 3.Njuguna IN, Cranmer LM, Otieno VO, Mugo C, Okinyi HM, Benki-Nugent S, et al. Urgent versus post-stabilisation antiretroviral treatment in hospitalised HIV-infected children in Kenya (PUSH): a randomised controlled trial. Lancet HIV 2018; 5(1):e12–e22. [DOI] [PMC free article] [PubMed] [Google Scholar]
- 4.Collaborators GDaIIaP. Global, regional, and national incidence, prevalence, and years lived with disability for 328 diseases and injuries for 195 countries, 1990–2016: a systematic analysis for the Global Burden of Disease Study 2016. Lancet 2017; 390(10100):1211–1259. [DOI] [PMC free article] [PubMed] [Google Scholar]
- 5.World Health Organization. The Global Prevalence of Anemia in 2011 In; 2015.
- 6.Volberding PA, Levine AM, Dieterich D, Mildvan D, Mitsuyasu R, Saag M, et al. Anemia in HIV infection: clinical impact and evidence-based management strategies. Clin Infect Dis 2004; 38(10):1454–1463. [DOI] [PubMed] [Google Scholar]
- 7.Vaz SO, Guerra IC, Freitas MI, Marques L. Pure red cell aplasia and HIV infection: what to suspect? BMJ Case Rep 2018; 2018. [DOI] [PMC free article] [PubMed] [Google Scholar]
- 8.Wagnew F, Eshetie S, Alebel A, Tesema C, Kibret GD, Gebrie A, et al. Burden of anemia and its association with HAART in HIV infected children in Ethiopia: a systematic review and meta-analysis. BMC Infect Dis 2019; 19(1):1032. [DOI] [PMC free article] [PubMed] [Google Scholar]
- 9.Duffy C, Kenga DB, Gebretsadik T, Maússe FE, Manjate A, Zaqueu E, et al. Multiple Concurrent Illnesses Associated with Anemia in HIV-Infected and HIV-Exposed Uninfected Children Aged 6–59 Months, Hospitalized in Mozambique. Am J Trop Med Hyg 2020; 102(3):605–612. [DOI] [PMC free article] [PubMed] [Google Scholar]
- 10.Clark TD, Mmiro F, Ndugwa C, Perry RT, Jackson JB, Melikian G, et al. Risk factors and cumulative incidence of anaemia among human immunodeficiency virus-infected children in Uganda. Ann Trop Paediatr 2002; 22(1):11–17. [DOI] [PubMed] [Google Scholar]
- 11.Totin D, Ndugwa C, Mmiro F, Perry RT, Jackson JB, Semba RD. Iron deficiency anemia is highly prevalent among human immunodeficiency virus-infected and uninfected infants in Uganda. J Nutr 2002; 132(3):423–429. [DOI] [PubMed] [Google Scholar]
- 12.Beletew B, Mengesha A, Ahmed M, Fitwi A, Wudu M. Determinants of Anemia among HIV-Positive Children on Highly Active Antiretroviral Therapy Attending Hospitals of North Wollo Zone, Amhara Region, Ethiopia, 2019: A Case-Control Study. Anemia 2020; 2020:3720572. [DOI] [PMC free article] [PubMed] [Google Scholar]
- 13.Damonti J, Doykos P, Wanless RS, Kline M. HIV/AIDS in African children: the Bristol-Myers Squibb Foundation and Baylor response. Health Aff (Millwood) 2012; 31(7):1636–1642. [DOI] [PubMed] [Google Scholar]
- 14.World Health Organization. Haemoglobin concentrations for the diagnosis of anaemia and assessment of severity Vitamin and Mineral Nutrition Information System. In. Geneva; 2011. [Google Scholar]
- 15.World Health Organization. WHO case definitions of HIV for surveillance and revised clinical staging and immunologic classification of HIV-related disease in adults and children In; 2007. pp. 1–48.
- 16.World Health Organization. Length/height-for-age, weight-for-age, weight-for-length, weight-for-height and body mass index-for-age. In: WHO Child Growth Standards: methods and development Geneva: World Health Organization; 2006. [Google Scholar]
- 17.World Health Organization. The global prevalence of anaemia in 2011 In. Geneva: WHO; 2015. [Google Scholar]
- 18.Adediran A, Osunkalu V, Wakama T, John-Olabode S, Akinbami A, Uche E, et al. Impact of HIV Infection and Zidovudine Therapy on RBC Parameters and Urine Methylmalonic Acid Levels. Interdisciplinary Perspectives on Infectious Diseases 2016; 2016:5210963. [DOI] [PMC free article] [PubMed] [Google Scholar]
- 19.Steele RH, Keogh GL, Quin J, Fernando SL, Stojkova V. Mean cell volume (MCV) changes in HIV-positive patients taking nucleoside reverse transcriptase inhibitors (NRTIs): a surrogate marker for adherence. Int J STD AIDS 2002; 13(11):748–754. [DOI] [PubMed] [Google Scholar]
- 20.Levine AM, Berhane K, Masri-Lavine L, Sanchez M, Young M, Augenbraun M, et al. Prevalence and correlates of anemia in a large cohort of HIV-infected women: Women’s Interagency HIV Study. J Acquir Immune Defic Syndr 2001; 26(1):28–35. [DOI] [PubMed] [Google Scholar]
- 21.Mildvan D, Creagh T, Leitz G, Anemia Prevalence Study G. Prevalence of anemia and correlation with biomarkers and specific antiretroviral regimens in 9690 human-immunodeficiency-virus-infected patients: findings of the Anemia Prevalence Study. Curr Med Res Opin 2007; 23(2):343–355. [DOI] [PubMed] [Google Scholar]
- 22.Semba RD, Shah N, Klein RS, Mayer KH, Schuman P, Vlahov D, et al. Prevalence and cumulative incidence of and risk factors for anemia in a multicenter cohort study of human immunodeficiency virus-infected and -uninfected women. Clin Infect Dis 2002; 34(2):260–266. [DOI] [PubMed] [Google Scholar]
- 23.Mocroft A, Kirk O, Barton SE, Dietrich M, Proenca R, Colebunders R, et al. Anaemia is an independent predictive marker for clinical prognosis in HIV-infected patients from across Europe. EuroSIDA study group. AIDS 1999; 13(8):943–950. [DOI] [PubMed] [Google Scholar]
- 24.Kowalska JD, Mocroft A, Blaxhult A, Colebunders R, van Lunzen J, Podlekareva D, et al. Current hemoglobin levels are more predictive of disease progression than hemoglobin measured at baseline in patients receiving antiretroviral treatment for HIV type 1 infection. AIDS Res Hum Retroviruses 2007; 23(10):1183–1188. [DOI] [PubMed] [Google Scholar]
- 25.Harris RJ, Sterne JA, Abgrall S, Dabis F, Reiss P, Saag M, et al. Prognostic importance of anaemia in HIV type-1-infected patients starting antiretroviral therapy: collaborative analysis of prospective cohort studies. Antivir Ther 2008; 13(8):959–967. [PMC free article] [PubMed] [Google Scholar]
- 26.Kerkhoff AD, Wood R, Cobelens FG, Gupta-Wright A, Bekker LG, Lawn SD. The predictive value of current haemoglobin levels for incident tuberculosis and/or mortality during long-term antiretroviral therapy in South Africa: a cohort study. BMC Med 2015; 13:70. [DOI] [PMC free article] [PubMed] [Google Scholar]
- 27.Obirikorang C, Yeboah FA. Blood haemoglobin measurement as a predictive indicator for the progression of HIV/AIDS in resource-limited setting. J Biomed Sci 2009; 16(1):102. [DOI] [PMC free article] [PubMed] [Google Scholar]
- 28.Essajee S, Bhairavabhotla R, Penazzato M, Kiragu K, Jani I, Carmona S, et al. Scale-up of Early Infant HIV Diagnosis and Improving Access to Pediatric HIV Care in Global Plan Countries: Past and Future Perspectives. J Acquir Immune Defic Syndr 2017; 75 Suppl 1:S51–s58. [DOI] [PubMed] [Google Scholar]
- 29.Penazzato M, Amzel A, Abrams EJ, Kiragu K, Essajee S, Mukui I, et al. Pediatric Treatment Scale-Up: The Unfinished Agenda of the Global Plan. J Acquir Immune Defic Syndr 2017; 75 Suppl 1:S59–s65. [DOI] [PubMed] [Google Scholar]
Associated Data
This section collects any data citations, data availability statements, or supplementary materials included in this article.