Abstract
Deep learning allows automatic segmentation of teeth on cone beam computed tomography (CBCT). However, the segmentation performance of deep learning varies among different training strategies. Our aim was to propose a 3.5D U-Net to improve the performance of the U-Net in segmenting teeth on CBCT. This study retrospectively enrolled 24 patients who received CBCT. Five U-Nets, including 2Da U-Net, 2Dc U-Net, 2Ds U-Net, 2.5Da U-Net, 3D U-Net, were trained to segment the teeth. Four additional U-Nets, including 2.5Dv U-Net, 3.5Dv5 U-Net, 3.5Dv4 U-Net, and 3.5Dv3 U-Net, were obtained using majority voting. Mathematical morphology operations including erosion and dilation (E&D) were applied to remove diminutive noise speckles. Segmentation performance was evaluated by fourfold cross validation using Dice similarity coefficient (DSC), accuracy, sensitivity, specificity, positive predictive value (PPV), negative predictive value (NPV). Kruskal–Wallis test with post hoc analysis using Bonferroni correction was used for group comparison. P < 0.05 was considered statistically significant. Performance of U-Nets significantly varies among different training strategies for teeth segmentation on CBCT (P < 0.05). The 3.5Dv5 U-Net and 2.5Dv U-Net showed DSC and PPV significantly higher than any of five originally trained U-Nets (all P < 0.05). E&D significantly improved the DSC, accuracy, specificity, and PPV (all P < 0.005). The 3.5Dv5 U-Net achieved highest DSC and accuracy among all U-Nets. The segmentation performance of the U-Net can be improved by majority voting and E&D. Overall speaking, the 3.5Dv5 U-Net achieved the best segmentation performance among all U-Nets.
Subject terms: Dentine, Enamel, Biomedical engineering
Introduction
Cone beam computed tomography (CBCT) has been widely applied to orthodontics, periodontics, endodontics, stomatology, dental implant surgery, maxillofacial surgery, and forensic odontology1,2. It is superior to panoramic radiography and periapical radiography by providing 3D information rather than 2D information and has advantages over conventional CT including, but not limited to, lower radiation doses and lower costs.
Rapid, accurate, and robust segmentation of human teeth on CBCT is an important foundation of clinical practice in dentistry. It allows clear visualization of teeth on the one hand, and, is helpful for qualitative evaluation and quantitative analysis of dental diseases such as caries3,4, impacted tooth5, acute pulpitis6, apical periodontitis7, root fracture and periodontal lesion4. Manual segmentation by experts is usually considered as gold standard. However, it is laborious and time-consuming with the segmentation performance varying among different experts8. Semiautomatic segmentation facilitates the process of segmentation and is less laborious and less time-consuming with comparable segmentation performance with manual segmentation9,10. Automatic segmentation outperforms manual and semiautomatic segmentation by providing rapidest and most efficient segmentation of teeth11. However, automatic segmentation has been shown inferior to manual segmentation and semiautomatic segmentation in calculating tooth volume using water displacement method as gold standard9. In addition, automatic segmentation of teeth on CBCT remains challenging because of the more severe artifacts such as beam hardening artifacts12,13, unsharpness12–14, ring-like artifacts13,14, partial volume averaging13, undersampling13, cone-beam effect13,14, noises15, aliasing artifacts, and poorer soft-tissue contrast as compared to conventional CT16.
Deep learning is a subset of machine learning. Encouraged by the human neural structures, deep learn learns to think as the human brain by implementing multi-layer artificial neural networks. Supervised learning is the most common form of deep learning although the learning can also be semi-supervised or unsupervised. By feeding labeled data, including but not limited to images, into the complex and non-linear neural networks, deep learning works mimicking the human neural networks and gives results that enable us to detect, classify, and segment objects in interest17. Recently deep learning has a lot of attention because it can perform as good as human and even better in specific tasks.
First proposed in 2015 by Ronneberger et al.18, U-Net has been widely applied for medical imaging segmentation because it provides context information using fewer time and smaller data to train19. The U-Net contains a contraction path and an expansion path to encode the data using convolution and decode the data using up-convolution, respectively. It also concatenates the encoder and decoder by copying and cropping the input image to match the size of feature maps between the encoder and decoder layer by layer so that the net can not only classify but also localize the object for segmentation.
Several U-Nets including 2D U-Net20,21, 2.5D U-Net22, and 3D U-Net23 have been proposed for CBCT segmentation. A variant of 2.5D U-Net using majority voting of 2D U-Nets trained by 3 orthogonal imaging planes has been shown to outperform any single U-Net for maxillary and mandibular bony structure segmentation on CBCT24. To the best of our knowledge, CT using a 3.5D U-Net integrating 2D U-Nets, 2.5D U-Net, and 3D U-Net has never been documented yet.
We hypothesized that the segmentation performance of a 3.5D U-Net might be improved using majority voting by reducing the false positive results occurring in 2D U-Net, 2.5D U-Net and 3D U-Net. In this study, we intentionally applied 6 previously introduced U-Nets including three orthogonal 2D U-Nets, two 2.5D U-Nets, plus a 3D U-Net and added three newly proposed 3.5D U-Nets by integrating 2D U-Nets, 2.5D U-Nets and 3D U-Net using the majority voting method for segmentation of teeth on CBCT. The proposed 3.5D U-Nets were compared to the previous U-Nets using slice-by-slice calculation of Dice similarity coefficient (DSC) and other diagnostic metrics including accuracy (Ac), sensitivity (Sn), specificity (Sp), positive predictive value (PPV), and negative predictive value (NPV) to verify our hypothesis.
Materials and methods
This study was approved by the Institutional Review Board of China Medical University with written informed consent waived for this retrospective study. All methods were performed in accordance with the relevant guidelines and regulations.
Patient cohort and CBCT parameters
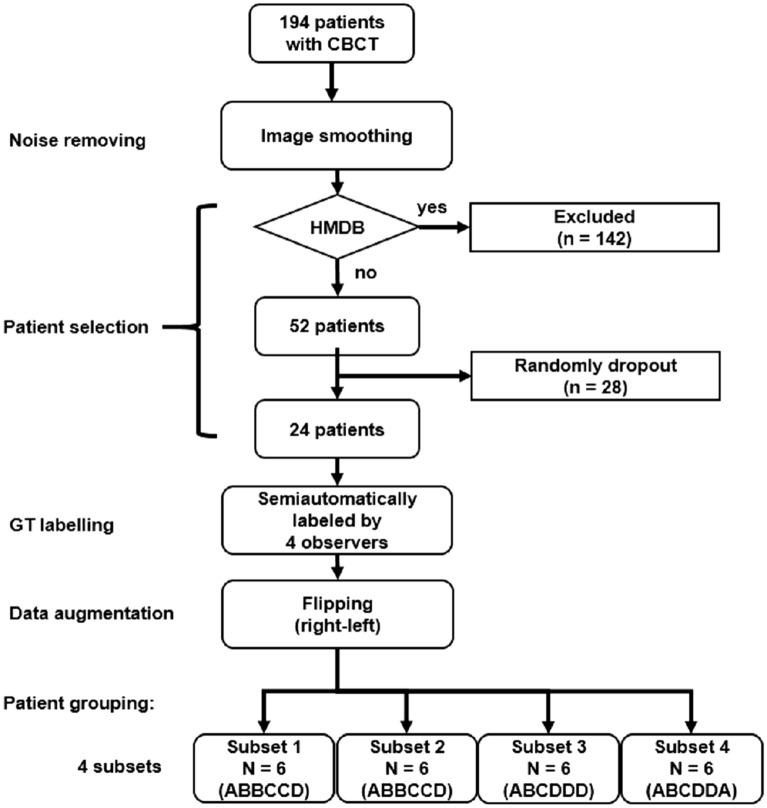
Figure 1 demonstrates the processes from noise removing, patient selection, GT labeling, data augmentation and patient grouping in our study. A total of 194 patients who received CBCT study from January to June 2020 were initially collected. All patients were scanned using an Auge Solio CBCT scanner (Asahi Roentgen Ind., Kyoto, Japan) that is widely used in dentistry and maxillofacial surgery. All scans were performed using a tube voltage of 85 kVp, a tube current of 6 mA, and an isotropic voxel size of 0.19 mm. The imaging protocol covered from the inferior orbital rim to the inferior end of the mandible.
Figure 1.
Flowchart describing noise removing, patient selection, GT labeling, data augmentation and patient grouping of this study. CBCT denotes cone beam computed tomography, GT denoted ground truth, and HMDB denotes heavy metallic dental burden. ABCD in subsets denotes observer A, B, C, D, respectively.
In order to minimize the potential influence of metal-related artifacts on the segmentation task, one of our exclusion criteria was patients with heavy metallic dental burden (MDB) including metallic dental implants, braces and crowns. CBCTs with heavy MDB due to metallic dental devices were automatically identified according to the following steps and excluded. First, two thresholds were empirically set with the first threshold (TH1) of 3070 HU and the second threshold (TH2) of 2500 HU, representing the density of metallic materials and the density of enamel, respectively. Second, MDB ratio (MDBR) was defined via dividing TH1 by TH2. Third, a third threshold (TH3) was set with the MDBR = 0.4. Fourth, heavy MDB was defined by MDBR > TH3. Fifth, patients with heavy MBD were excluded. A total of 24 patients were randomly selected from the rest of patients for segmentation of teeth in this study to prevent huge loading of manpower in defining the ground truth (GT). Patients were classified into 4 subsets, in which each subset containing same number of patients (N = 6) with the GT defined by different observers.
Imaging preprocessing
In order to remove high frequency noise in CBCT, a 3D Gaussian filter with standard deviation of 1 was applied first. All teeth were slice-by-slice contoured semiautomatically on CBCT by four different observers including one dentist (K.H. with 6-year experience in medical imaging research) and three researchers majoring in medical imaging analysis (P.S.L., G.X.P. and Y.C.Z. with one more year of experience in medical imaging analysis). The semiautomatic method is modified from that used in our previous study using thresholding method25. First, the CBCT images were loaded and displayed. Second, a polygonal region-of-interest (ROI) encompassing teeth was drawn. Third, a threshold was initially applied and then adjusted to fit the contour of teeth. Four, holes within the contour of teeth were filled. Finally, all images with teeth successfully contoured were save as GT. All GTs were verified by a neuroradiologist (C.J.J. with more than 20 years of experience in medical imaging analysis).
Data augmentation with an augmentation factor of 2 was achieved by flipping all images along the horizontal direction. For fair comparison among the original U-Nets, no additional data augmentation was performed for either 2.5D U-Net or 3D U-Net.
Deep learning models (DLMs)
U-Net was employed for semantic segmentation of teeth in this study18. The U-Net architecture consists of a decoding path and an encoding path symmetrically. The decoding path contains two convolution blocks in each layer with each convolution block followed by a rectified linear unit (Relu) to obtain lower-dimensional representation and then down-sampled by a max pooling operation. In the encoding path, the representation is concatenated with the corresponding features maps obtained in the encoding path, followed by two convolution blocks, and then up-sampled by nearest convolution operation. The final output layer of the U-Net was connected to a dual-class softmax classifier, i.e., teeth and non-teeth.
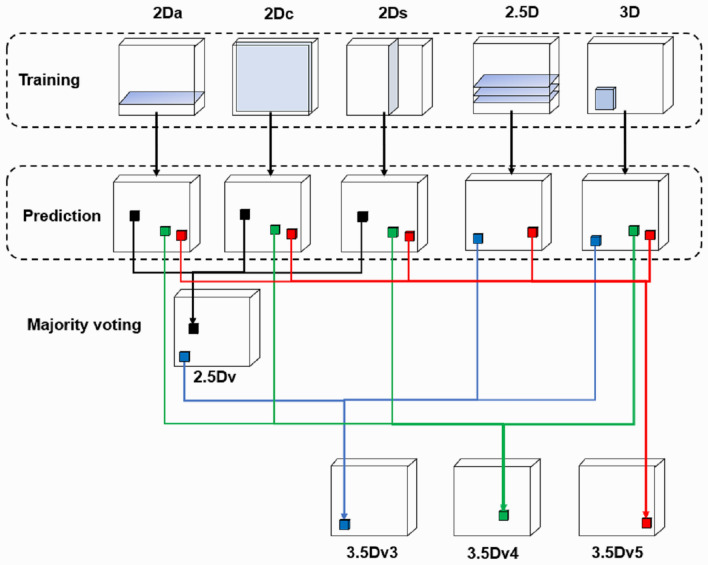
In our previous studies, we found the segmentation performance of 2D U-Net varies between different lesions with the DSC ranging from as low as 0.48 in salivary gland tumors26 to as high as 0.97 in acute ischemic stroke lesion25 on magnetic resonance imaging. In this study, we intentionally employed a total of nine different DLMs to perform automatic segmentation of the teeth. First, three sets of orthogonal images were applied to train axial, coronal, and sagittal 2D U-Nets (named as 2Da U-Net, 2Dc U-Net, and 2Ds U-Net). Second, a 2.5D U-Net was constructed using three continuous axial slices placed in three channels to form an ensemble input image and to train the DLM (named as 2.5D U-Net). Third, a 3D U-Net was constructed using a cuboid (64 × 64 × 128) as an input image. Architectures and hyperparameters of these U-Nets are shown in Table 1. Finally, we applied majority voting to create 4 additional U-Nets. Via combining the predictions of 2D U-Nets trained from each of three orthogonal slices24 using majority voting, a 2.5Dv U-Net was generated. Three additional 3.5D U-Nets (i.e., 3.5Dv3 U-Net, 3.5Dv4 U-Net, and 3.5Dv5 U-Net) were generated via majority voting the predictions of 2D U-Nets, 2.5D U-Net, and 3D U-Net at different combination strategies as illustrated in Fig. 2.
Table 1.
Architectures and hyperparameters of 2D U-Net, 2.5Da U-Net, and 3D U-Net structures.
| 2D U-Net | 2.5Da U-Net | 3D U-Net | ||
|---|---|---|---|---|
| Architecture | Convolution |
Size = 3 × 3 Stride = 1 Zero-padding |
Size = 3 × 3 Stride = 1 Zero-padding |
Size = 3 × 3 × 3 Stride = 1 Zero-padding |
| Down sampling maxpooling |
Size = 2 × 2 Stride = 1 |
Size = 2 × 2 Stride = 1 |
Size = 2 × 2 × 2 Stride = 1 |
|
| Up sampling |
Size = 2 × 2 Stride = 1 |
Size = 2 × 2 Stride = 1 |
Size = 2 × 2 × 2 Stride = 1 |
|
| Activation function | ReLu | ReLu | ReLu | |
| U-Net layers | 4 | 4 | 4 | |
| First layer features | 32 | 32 | 32 | |
| Hyper parameter | Input data size | 512 × 512 × 1 | 512 × 512 × 3 | 64 × 64 × 128 |
| Optimizer | Adam | Adam | Adam | |
| Loss function | BCE | BCE | BCE | |
| Initial learning rate | 0.0001 | 0.0001 | 0.0001 | |
| Batch size | 12 | 12 | 6 | |
| Epoch | 150 | 150 | 200 | |
| Callback function |
Reduce learning rate (newLR = LR × 0.95 when val_loss in 10 epochs are no better) Early stopping (training stop when val_loss in 50 epochs are no better) |
|||
Adam adaptive moment estimation, BCE binary cross entropy, ReLU rectified linear unit.
Figure 2.
Schematics of the 2.5D U-Net and our proposed 3.5D U-Nets using majority voting. The 2.5D U-Net combines the predictions of deep learning models trained by 2Da U-Net, 2Dc U-Net and 2Ds U-Net. The 3.5Dv3 U-Net combines the predictions of deep learning models trained by 2.5Dv U-Net, 2.5D U-Net and 3D U-Net. The 3.5Dv4 U-Net combines the predictions of deep learning models trained by 2Da U-Net, 2Dc U-Net, 2Ds U-Net and 3D U-Net. The 3.5Dv5 U-Net combines the predictions of deep learning models trained by 2Da U-Net, 2Dc U-Net, 2Ds U-Net, 2.5D U-Net and 3D U-Net.
Prediction of each of aforementioned nine U-Nets was treated by basic operations of mathematical morphology, i.e., erosion and dilation. The binary erosion of I by B, denoted by , is defined as Eq. (1):
| 1 |
where E denotes a Euclidean space, I denotes a binary image in E, B denotes a spherical structuring element with a radius of 2 pixels, and Bz denotes the translation of B by the vector z. The binary dilation of I by B, denoted by , is defined as Eq. (2):
| 2 |
where B denotes a spherical structuring element with a radius of 2 pixels, Bs denotes the symmetric of B as defined by Eq. (3):
| 3 |
Cross validation and model performance evaluation
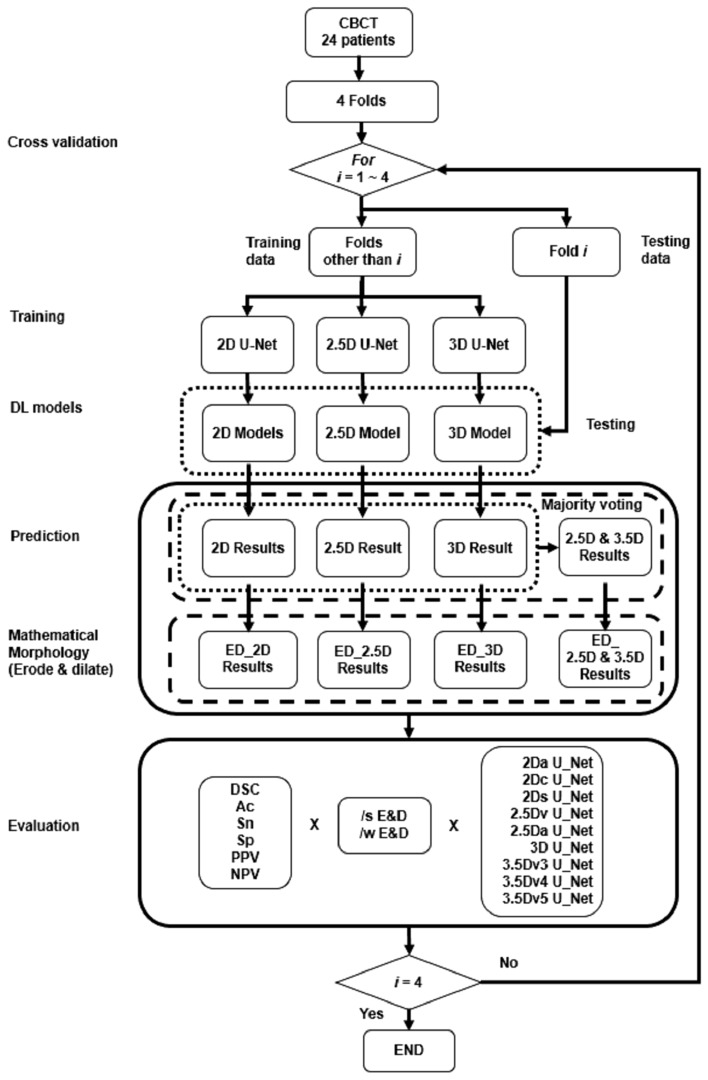
The flowchart of U-Nets in automatic segmentation of teeth using fourfold cross validation was shown in Fig. 327. Slice-based evaluation of the performance of a DLM was conducted using four-fold cross validation to reflect the performance of a DLM in every slice28. The overall segmentation performance was calculated by averaging the performance of every slice28. Each voxel of the CBCT image was defined as true positive (TP), true negative (TN), false positive (FP) and false negative (FN) by comparing the prediction to the GT. Segmentation performance of DLMs was evaluated using DSC, Ac, Sn, Sp, PPV, and NPV defined by Eqs. (4) to (9), respectively.
| 4 |
| 5 |
| 6 |
| 7 |
| 8 |
| 9 |
Figure 3.
Flowchart of U-Nets in automatic segmentation of teeth using fourfold cross validation.
Statistical analysis
In statistical analyses, the normality of data was analyzed first using Kolmogorov–Smirnov test first. Paired Wilcoxon rank test was used to compare continuous data before and after E&D. A nonparametric Kruskal–Wallis test with post hoc analysis using Bonferroni correction was applied for group comparison among 9 U-Nets. A P value less than 0.05 was considered as statistically significant.
Results
A total of 24 patients were finally recruited, including 15 men and 9 women, with an age of 29.1 ± 14.7 years (mean ± standard deviation). Demographic characteristics of different subsets and groups of patients were summarized in Table 2. There was no difference of age among different subsets of patients (P = 0.5658). Impacted teeth were the most common clinical diagnosis, comprising 75% (18 of 24) of patients received CBCT examination.
Table 2.
Demographics of patients in different subset.
| Subset | 1 | 2 | 3 | 4 | P value |
|---|---|---|---|---|---|
| Clinical diagnosis | |||||
| Patient number | 6 | 6 | 6 | 6 | |
| Gender (M: F) | 3: 3 | 5: 1 | 5: 1 | 2: 4 | |
| Age (years) | 25.3 ± 10.6 | 41.3 ± 22.9 | 30.1 ± 6.5 | 19.8 ± 4.2 | 0.566 |
| Caries | 1 | 1 | 0 | 1 | |
| Impacted tooth | 5 | 3 | 4 | 6 | |
| Periodontitis | 1 | 2 | 3 | 0 | |
| Acute apical periodontitis | 1 | 0 | 0 | 0 | |
| Implant design | 2 | 2 | 2 | 1 | |
| Residual root | 0 | 0 | 1 | 0 | |
Comparisons of DSC among U-Nets
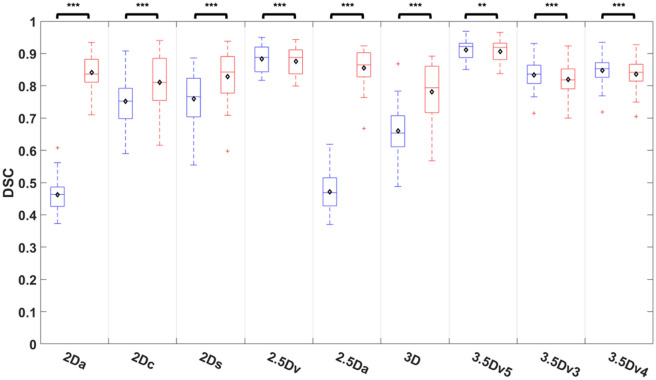
Comparisons of DSC among nine different U-Nets before and after E&D were shown on Fig. 4 and Table S1. The DSC after E&D was significantly different that before E&D in all U-Nets (all P < 0.01). While the DSC after E&D was significantly higher than that before E&D in 5 originally trained U-Nets (all P < 0.005), it was significantly lower than that before E&D in 4 U-Nets generated after majority voting (all P < 0.01). Before E&D, the 3.5Dv5 U-Net achieved highest DSC which was significantly higher than any of five originally trained U-Nets (all P < 0.005), while the 2Da U-Net and 2.5D U-Net performed poorest with DSC significantly lower than other U-Nets (P < 0.005) except 3D U-Net (P = 0.174 to 0.222). After E&D, the 3.5Dv5 U-Net achieved highest DSC which was significantly higher than most U-Nets (P < 0.01) except 2.5Dv U-Net (P = 0.551) and 2.5Da U-Net (P = 0.07).
Figure 4.
Comparison of DSC among 9 U-Nets before and after E&D.
Comparisons of accuracy among U-Nets
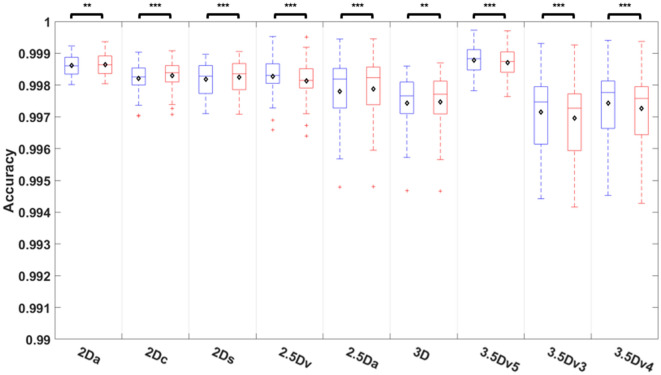
Comparisons of accuracy among 9 different U-Nets before and after E&D were shown on Fig. 5 and Table S2. The accuracy after E&D was significantly different that before E&D in all U-Nets (all P < 0.01) with the median accuracy higher than 0.997 in all U-Nets no matter before or after E&D. While the accuracy after E&D was significantly higher than that before E&D in 5 originally trained U-Nets (all P < 0.01), the it was significantly lower than before E&D in 4 U-Nets generated after majority voting (all P < 0.005). Before E&D, the 3.5Dv5 U-Net achieved highest accuracy which was significantly higher than that of 2.5Da U-Net, 3D U-Net, 3.5Dv3 U-Net, and 3.5Dv4 U-Net (P < 0.01). After E&D, the 3.5Dv5 U-Net still achieved highest accuracy, which was significantly higher than 2.5Da U-Net, 3D U-Net, 3.5Dv3 U-Net, and 3.5Dv4 U-Net (P < 0.05).
Figure 5.
Comparison of accuracy among 9 U-Nets before and after E&D.
Comparisons of sensitivity among U-Nets
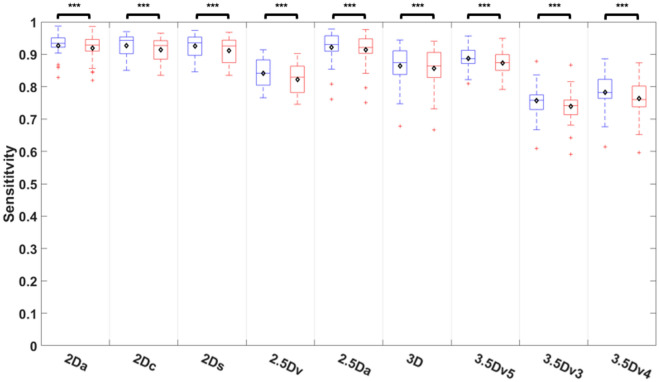
Comparisons of sensitivity among nine different U-Nets before and after E&D was shown on Fig. 6 and Table S3. Before E&D, the 2Dc U-Net achieved highest sensitivity, followed by the 2Ds U-Net, 2Da U-Net, 2.5Da U-Net, and 3.5Dv5 U-Net (P = 0.243 to 1), which was significantly higher than that of the 3D U-Net (P < 0.05) and other U-Nets with majority voting (P < 0.005). E&D significantly reduced the sensitivity in all U-Nets (all P < 0.005). After E&D, the 2Da U-Net achieved highest sensitivity, followed by 2Dc U-Net, 2Ds U-Net, 2.5Da U-Net, and 3.5Dv5 U-Net (P = 0.141 to 1), which was significantly higher than that of the 3D U-Net (P < 0.05) and other U-Nets with majority voting (P < 0.005).
Figure 6.
Comparison of sensitivity among 9 U-Nets before and after E&D.
Comparisons of specificity among U-Nets
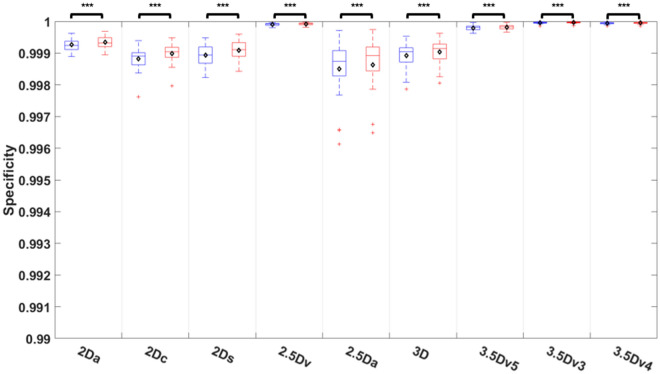
Comparisons of specificity among nine different U-Nets before and after E&D was shown on Fig. 7 and Table S4. The specificity after E&D was significantly higher than that before E&D in all U-Nets (all P < 0.005) with the median specificity higher than 0.998 in all U-Nets before or after E&D. The 3.5Dv3 U-Net and 2.5Dv U-Net achieved a median specificity of 1, significantly higher than that of the 3.5Dv5 U-Net (P < 0.05) and all 5 originally trained U-Nets no matter before or after E&D (all P < 0.005).
Figure 7.
Comparison of specificity among 9 U-Nets before and after E&D.
Comparisons of PPV among U-Nets
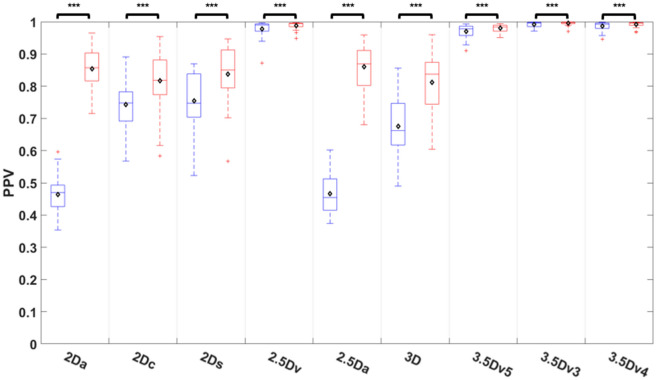
Comparisons of PPV among nine different U-Nets before and after E&D was shown on Fig. 8 and Table S5. The PPV was improved after E&D in all U-Nets (all P < 0.005). Before E&D, the 2Da U-Net and 2.5Da U-Net performed poorest with the PPV significantly lower than that of other U-Nets (P < 0.05) except the 3D U-Net (P = 0.197). The 3.5Dv3 U-Net achieved highest PPV which was similar to the 3.5Dv4 U-Net, 3.5Dv5 U-Net, and 2.5D U-Net (P = 0.405 to 0.922) but significantly higher than that of all 5 originally trained U-Nets (all P < 0.005). After E&D, the 2Da U-Net and 2.5Da U-Net performed similar to other originally trained U-Nets (P = 849 to 1). The 3.5Dv3 U-Net still achieved highest PPV which was similar to the 3.5Dv4 U-Net, 3.5Dv5 U-Net, and 2.5D U-Net (P = 0.184 to 0.995) but significantly higher than all 5 originally trained U-Nets (all P < 0.005).
Figure 8.
Comparison of positive predict value among 9 U-Nets before and after E&D.
Comparisons of NPV among U-Nets
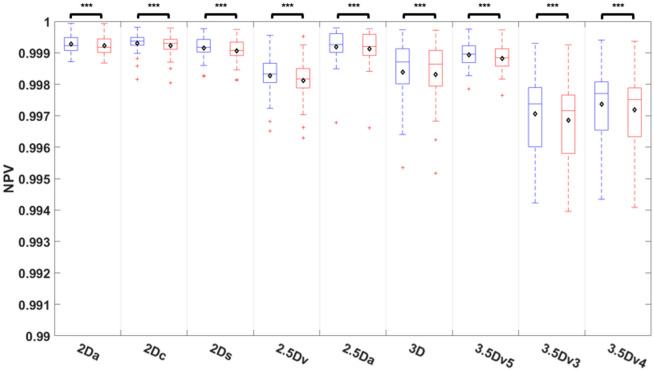
Comparisons of NPV among nine different U-Nets before and after E&D was shown on Fig. 9 and Table S6. E&D significantly reduced the NPV in all U-Nets (all P < 0.005) with the median NPV higher than 0.997 in all U-Nets before or after E&D. The 2Dc U-Net achieved highest NPV, followed by 2Da U-Net, 2.5Da U-Net, 2Ds U-Net, and 3.5Dv5 U-Net (P = 0.278 to 1), and significantly higher than 3D U-Net (P < 0.01) and other U-Nets with majority voting (P < 0.005) no matter before or after E&D.
Figure 9.
Comparison of negative predict value among 9 U-Nets before and after E&D.
Case demonstration
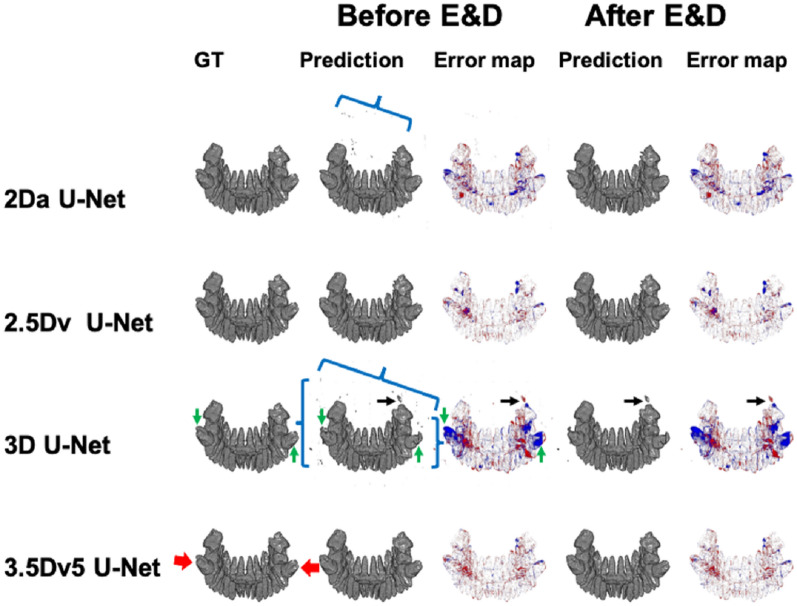
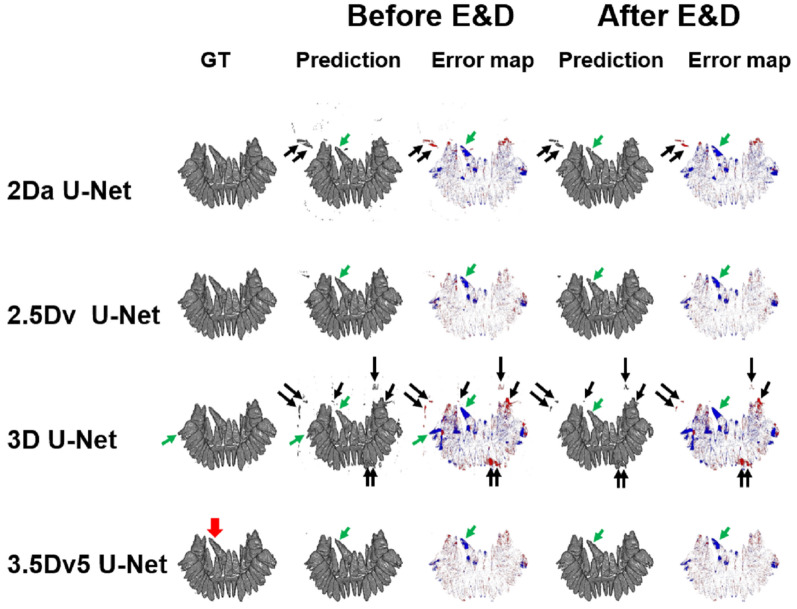
Figures 10 and 11 demonstrate the 3D illustration of predictions and error maps of 4 different U-Nets before and after E&D in two patients.
Figure 10.
Illustration of ground truth, prediction, and error map in a patient with impacted mandibular third molar teeth (red arrows) before and after E&D in 2Da U-Net, 2.5Dv U-Net, 3D U-Net, and 3.5Dv5 U-Net. The 2Da U-Net and 3D U-Net show lots of tiny false positive results (blue brackets) which could be eliminated by either majority voting or E&D. In 3D U-Net, additional larger false positive results (black arrows), which are not reduced by E&D, are successfully eliminated via majority voting (2.5Dv U-Net and 3.5Dv5 U-Net). Some false negative results (green arrows), which are more apparently seen on 3D U-Net before and after E&D, are successfully remedied via majority voting (2.5Dv U-Net and 3.5Dv5 U-Net).
Figure 11.
Illustration of ground truth, prediction, and error map in a patient with impacted right maxillary second incisor (red arrow) before and after E&D in 2Da U-Net, 2.5Dv U-Net, 3D U-Net, and 3.5Dv5 U-Net. The 2Da U-Net and 3D U-Net show different false positive results and false negative results, which are eliminated by either majority voting or E&D. Some larger false positive results (black arrows) in the 2Da U-Net and 3D U-Net, which are not eliminated by E&D, are completely eliminated by the 3.5Dv5 U-Net. On the other hand, the false negative results (green arrows) appearing in the 2Da U-Net and the 3D U-Net remain similar on 2.5Dv U-Net and 3.5Dv5 U-Net before and after E&D.
Discussion
Accurate segmentation of bony structures and teeth on CBCT is an important foundation of stomatology. Training strategy has been shown to be a factor influencing the segmentation performance of convolutional neural network (CNN) for bony structures on CBCT24. In our study, we intentionally applied nine different training strategies based on the U-Net architecture and compared the performance in teeth segmentation on CBCT among different strategies. Our study demonstrated that the segmentation performance of the U-Net varied among different training strategies. The 2Da U-Net and the 2.5Da U-Net had poor segmentation performance with a median DSC of 0.464 and 0.469, respectively. The segmentation performance of the 2Da U-Net was improved via 3 strategies. First, by changing the input imaging data, the median DSC was significantly improved to 0.752 and 0.766 in the 2Dc U-Net and the 2Ds U-Net, respectively (via changing slice orientation) and slightly improved to 0.653 in the 3D U-Net (via supplying additional z-axis information). Second, by using majority voting, the median DSC was significantly improved to 0.922 (3.5Dv5 U-Net). Third, by employing mathematical morphology using E&D, the median DSC was significantly improved to 0.836 and 0.865 in the 2Da U-Net and the 2.5Da U-Net, respectively. Table 3 compares the segmentation performance of our proposed methods to those proposed by other researchers. The DSC in our study is relatively lower than some previous studies20,21,27,29–32, in which the DSC ranges from 0.93431 to 0.9730. In our study, we calculated the DSC slice-by-slice and then averaged the DSC of all slices rather than calculated the DSC for the whole CBCT volume as other studies20,21,23,27,29–31,33–37. Nevertheless, the highest DSC achieved by our 3.5Dv5 U-Net is consistent with other previous studies23,33–35, in which the DSC ranges from 0.923 to 0.92133. Our study achieved an accuracy ranging from 0.997 to 0.999 which is higher than that reported in previous studies30,36,37. Our 2D U-Nets achieved a sensitivity ranging from 0.934 to 0.943 which is similar to that (0.91 to 0.94 and 0.932) of Fontenele’s study30 and Lee’s study34, respectively, and higher than that (0.83) of Shaheen’s study23. In addition, our U-Nets with majority voting achieve a PPV ranging from 0.978 to 0.996 which is similar to that (0.98) of Shaheen’s study23 and higher than that (0.904) of Lee’s study34.
Table 3.
Comparison of segmentation of human teeth on CBCT using CNN.
| Author | Year | Patients/images | CNN architecture | Training strategy | Evaluation strategy | DSC | Ac | Sn | SP | PPV | NPV |
|---|---|---|---|---|---|---|---|---|---|---|---|
| Xu37 | 2019 | 1200/NA | DNN | 3D volume | VB | NA | 0.991 | NA | NA | NA | NA |
| Tian36 | 2019 | 600/NA | U-Net + HN | 3D volume | VB | NA | 0.898 | NA | NA | NA | NA |
| Cui33 | 2019 | 20/NA | ToothNet | 3D volume | VB | 0.921 | NA | NA | NA | NA | NA |
| Li21 | 2020 | 24/1160 | AttU-Net + BDC-lstm | 2D slices | VB | 0.9526 | NA | NA | NA | NA | NA |
| Lee34 | 2020 | 102/NA | UDS-Net | 2D slices | NA | 0.918 | NA | 0.932 | NA | 0.904 | NA |
| Chen29 | 2020 | 25/NA | FCN + MWT | 3D volume | NA | 0.936 | NA | NA | NA | NA | NA |
| Rao35 | 2020 | NA/86 | SFCRN + DCRF | 2D slices | NA | 0.917 | NA | NA | NA | NA | NA |
| Wu32 | 2020 | 20/NA | GH + BADice + DASPP U-Net | 3D volume | VB | 0.962 | NA | NA | NA | NA | NA |
| Wang27 | 2021 | 28/9507 | MS-D | NA | VB | 0.945 | NA | NA | NA | NA | NA |
| Duan20 | 2021 | 30/NA | U-Net | 2D slices | VB | 0.957 | NA | NA | NA | NA | NA |
| Shaheen23 | 2021 | 186/NA | 3D U-Net | 3D volume | VB | 0.90† | NA | 0.83 | NA | 0.98 | NA |
| Lahoud31 | 2021 | 314/2924 | FPN | 2D slices | VB | 0.934 | NA | NA | NA | NA | NA |
| Fontenele30 | 2022 | 175/ | 3D U-Net | 3D volume | VB | 0.95–0.97 | 0.994–0.997 | 0.91–0.94 | NA | 1 | NA |
| Our study | 2022 | 24/12,552 | 2Da U-Net | 2D slices | SB | 0.839a | 0.999 | 0.925 | 0.999 | 0.852a | 0.999 |
| 3D U-Net | 3D volume | SB | 0.779a | 0.997 | 0.864 | 0.999 | 0.810a | 0.998 | |||
| 3.5Dv5 U-Net | 2D slices, 3D volume | SB | 0.911 | 0.999 | 0.888 | 1 | 0.970 | 0.999 |
Numerical data are presented as mean value.
BADice boundary aware dice loss, BDC-LSTM bidirectional convolution long short-term memory, DASPP densely connected Atrous spatial pyramid pooling, DCRF dense conditional random field, FCN fully convolutional network, FPN feature pyramid network, GH Gaussian heatmap localization, HN hierarchical network, LO label optimization, MS-D mixed-scale dense, MWT marker-controlled watershed transform, NA not available, PB volume-based, SB slice-based, SFCRN symmetric fully convolutional residual network, UDS-Net U-Net added by dense block and spatial dropout.
aData acquired after erosion and dilation of mathematical morphology.
Segmentation of teeth on whole volume of CBCT remains challenging on 2D U-Net because of the similar Hounsfield units between teeth and bony structures and insufficient spatial information along the perpendicular direction for the input images, i.e., lacking z-axis information in axial slice, y-axis information in coronal slice, and x-axis information in sagittal slice. Solely using axial images as input data, 2Da U-Net tends to predict clusters of tooth root-mimicking bony structures on axial plane false positively. Based on the Eq. (5), the DSC of a slice with any pixel which was predicted as tooth but were out of range of teeth in GT was zero. Accordingly, the overall DSC dropped due to the false positive results of prediction on slices that do not contain any pixel of teeth on GT. These false positive results on 2Da U-Net have two characteristic features, including (1) no specific spatial connection between two clusters along the z-axis and (2) specific tooth root-mimicking geometric shapes, i.e., round or ovoid shapes. Such false positive results could be eliminated or reduced by changing the orientation of the input slices from axial to coronal or sagittal. By choosing coronal slices or sagittal slices as input, 2Dc U-Net and 2Ds U-Net provided abundant z-axis information for the model to recognize the connection of tooth roots and the whole tooth and therefore help eliminate parts of false positive results around the tooth roots. Although the small round or ovoid false positive results on 2Da U-Net were reduced, 2Dc U-Net and 2Ds U-Net had drawbacks by taking the sheet-like bony structures as teeth false positively. The false positive results on 2Da U-Net could also be remedied by providing additional z-axis information in a 3D patch as input data. However, the 3D U-Net produced some different false positive results while reducing those on 2Da U-Net. These false positive results might be attributed to the insufficient and discontinuous information at the edge of each 3D patch.
Majority voting has been used to improve the segmentation performance of anatomic structures on MR images38, conventional CT images39, and CBCT24,40 by combing the prediction from axial, coronal, and sagittal images. We intentionally applied different voting strategies from five original U-Nets (i.e., 2Da U-Net, 2Dc U-Net, 2Ds U-Net, 2.5Da U-Net, and 3D U-Net) to generate 4 additional virtual U-Nets (i.e., 2.5Dv U-Net, 3.5Dv5 U-Net, 3.5Dv4 U-Net, 3.5Dv3 U-Net) in order to compare the performance of different weighting of majority voting. The 2.5Dv U-Net integrated results from three 2D U-Nets (2Da U-Net, 2Dc U-Net, and 2Ds U-Net) as used in prior studies24,38,39, while the 3.5D U-Nets integrate these 2D U-Nets together with additional 2.5Da U-Net and 3D U-Net. Our results show that the U-Nets with majority voting (2.5Dv U-Net, 3.5Dv3 U-Net, and 3.5Dv5 U-Net) improved segmentation performance with DSC significantly higher than originally trained U-Nets. By integrating five originally trained U-Nets, the 3.5Dv5 U-Net showed highest DSC, accuracy, specificity, and NPV.
Diminutive noise speckles could be eliminated using mathematical morphology41. The combination of erode and dilate operators is capable of noise removal by eroding the image with a kernel followed by dilating the image with another kernel. By applying 3D erosion and dilation, our results showed significant changes in segmentation performance, including significantly higher specificity and PPV of all U-Nets, significantly higher DSC and accuracy of all originally trained U-Nets but significantly lower DSC and accuracy of all U-Nets with majority voting, but significantly lower sensitivity and NPV in all U-Nets.
Our study has some limitations to be addressed. First, the sample size of our study is relatively small. Our sample size is similar to that in Li’s study (N = 24), Chen’s study (N = 25)29, Wu’s study (N = 20)32, Wang’s study (N = 28)27, and Duan’s study (N = 30)20. To remedy it, we applied fourfold cross validation to verify our results. Second, the GT was not purely defined by senior dentists but by a third-year resident in periodontology and 3 different junior researchers, leading potential bias in defining the GT of teeth. To remedy it, all GTs were slice-by-slice verified and corrected by a senior neuroradiologist. Third, we did not evaluate interobserver agreement and intraobserver reliability in this study. Further study designed to evaluate the interobserver agreement and intraobserver reliability is warranted to reduce the potential bias occurring in the step of GT generation. Fourth, we did not perform apply any boning box for the teeth in our study. We intentionally used whole volume of CBCT to train and test all U-Nets to compare the segmentation performance of U-Nets with different training strategies not only in the teeth-containing slices but also in slices beyond the levels of teeth. Finally, we did not calculate the volume-based performance matrix as previous studies. By using slice-based performance matrix, our study clearly discloses the pros and cons of different training strategies of U-Nets on the one hand and also allows comparison between our results and others’ results on the other hand. Finally, we did not evaluate the diagnostic performance of the proposed method in any specific dental pathologies although the majority (75%) of patients received CBCT examination in order to evaluate the details of impacted teeth. To evaluate the diagnostic performance of the proposed 3.5D U-Net, further study enrolling specific dental pathology is warranted.
Conclusion
Performance of U-Nets varies among different training strategies for teeth segmentation on CBCT. The segmentation performance of the U-Net can be improved by majority voting and E&D. Overall speaking, the 3.5Dv5 U-Net achieved the best segmentation performance among all U-Nets.
Supplementary Information
Abbreviations
- 2D U-Net
U-Net using a 2D image as the unit of the input data
- 2Da U-Net
U-Net using an axial slice as the unit of the input data
- 2Dc U-Net
U-Net using a coronal slice as the unit of the input data
- 2Ds U-Net
U-Net using a sagittal slice as the unit of the input data
- 2.5Da U-Net
U-Net using three continuous axial slices as the unit of the input data
- 2.5Dv U-Net
U-Net integrating the predictions of 2Da U-Net, 2Dc U-Net, and 2Ds U-Net via majority voting
- 3D U-Net
U-Net using a cuboid as the unit of the input data
- 3.5Dv3 U-Net
U-Net integrating the predictions of 2.5Dv U-Net, 2.5Da U-Net, and 3D U-Net via majority voting
- 3.5Dv4 U-Net
U-Net integrating the predictions of 2Da U-Net, 2Dc U-Net, 2Ds U-Net, and 3D U-Net via majority voting
- 3.5Dv5 U-Net
U-Net integrating the predictions of 2Da U-Net, 2Dc U-Net, 2Ds U-Net2.5Da U-Net, and 3D U-Net via majority voting
- Ac
Accuracy
- CBCT
Cone beam computed tomography
- DLM
Deep learning model
- DSC
Dice similarity coefficient
- E&D
Erosion and dilation
- FN
False negative
- FP
False positive
- GT
Ground truth
- HMDB
Heavy metallic dental burden
- NPV
Negative predictive value
- PPV
Positive predictive value
- Sn
Sensitivity
- Sp
Specificity
- TN
True negative
- TP
True positive
Author contributions
K.H., Y.J.L., and C.J.J. formulated the research concept. S.C.L, Y.J.L., and C.J.J. conducted the research design and constructed the study pipeline. K.H., P.S.L, G.X.P, and Y.C.Z defined the ground truth initially. C.J.J. supervised the preparation of ground truth. S.C.L, P.S.L, and Y.J.L conducted the imaging processing and analysis. K.H., C.C.C. and D.Y.Y. contributed to data preparation. H.H.P., Y.J.L., and C.J.J. contributed to data clearing and quality control. T.Y.L., C.H.J., and C.E.J. prepared the figure 1-3 and figure 10-11. K.H., T.Y.L., C.H.J., C.E.J., and C.J.J. wrote the main manuscript. All authors reviewed the manuscript.
Funding
This study was funded by Tri-Service General Hospital (Grant No. TSGH-D-111147), Ministry of Science and Technology, Taiwan (Grant No. 111-2314-B-035-001-MY3, 111-2314-B-039-036), China Medical University Hsinchu Hospital, Taiwan (Grant No. CMUH110-REC3-180).
Data availability
The datasets used or analyzed during the current study are available from the corresponding author on reasonable request.
Competing interests
The authors declare no competing interests.
Footnotes
Publisher's note
Springer Nature remains neutral with regard to jurisdictional claims in published maps and institutional affiliations.
These authors contributed equally: Yi-Jui Liu and Chun-Jung Juan.
Contributor Information
Yi-Jui Liu, Email: erliu@fcu.edu.tw.
Chun-Jung Juan, Email: peterjuancj@yahoo.com.tw.
Supplementary Information
The online version contains supplementary material available at 10.1038/s41598-022-23901-7.
References
- 1.Kamburoglu K. Use of dentomaxillofacial cone beam computed tomography in dentistry. World J. Radiol. 2015;7(6):128–130. doi: 10.4329/wjr.v7.i6.128. [DOI] [PMC free article] [PubMed] [Google Scholar]
- 2.Gaeta-Araujo H, Alzoubi T, Vasconcelos KF, Orhan K, Pauwels R, Casselman JW, Jacobs R. Cone beam computed tomography in dentomaxillofacial radiology: A two-decade overview. Dentomaxillofac. Radiol. 2020;49(8):20200145. doi: 10.1259/dmfr.20200145. [DOI] [PMC free article] [PubMed] [Google Scholar]
- 3.Mohammad-Rahimi H, Motamedian SR, Rohban MH, Krois J, Uribe SE, Mahmoudinia E, Rokhshad R, Nadimi M, Schwendicke F. Deep learning for caries detection: A systematic review. J. Dent. 2022;122:104115. doi: 10.1016/j.jdent.2022.104115. [DOI] [PubMed] [Google Scholar]
- 4.Agrawal P, Nikhade P. Artificial intelligence in dentistry: Past, present, and future. Cureus. 2022;14(7):e27405. doi: 10.7759/cureus.27405. [DOI] [PMC free article] [PubMed] [Google Scholar]
- 5.Celik ME. Deep learning based detection tool for impacted mandibular third molar teeth. Diagnostics (Basel) 2022 doi: 10.3390/diagnostics12040942. [DOI] [PMC free article] [PubMed] [Google Scholar]
- 6.Zhang X, Zhu X, Xie Z. Deep learning in cone-beam computed tomography image segmentation for the diagnosis and treatment of acute pulpitis. J. Supercomput. 2022;78:11245–11264. doi: 10.1007/s11227-021-04048-0. [DOI] [Google Scholar]
- 7.Wang X, Meng X, Yan S. Deep learning-based image segmentation of cone-beam computed tomography images for oral lesion detection. J. Healthc. Eng. 2021;2021:4603475. doi: 10.1155/2021/4603475. [DOI] [PMC free article] [PubMed] [Google Scholar]
- 8.Qiu B, van der Wel H, Kraeima J, Hendrik Glas H, Guo J, Borra RJH, Witjes MJH, van Ooijen PMA. Robust and accurate mandible segmentation on dental CBCT scans affected by metal artifacts using a prior shape model. J. Pers. Med. 2021 doi: 10.3390/jpm11050364. [DOI] [PMC free article] [PubMed] [Google Scholar]
- 9.Sabanci S, Sener E, Turhal RI, Gurses BO, Govsa F, Tekin U, Baltaci A, Boyacioglu H, Guneri P. Is manual segmentation the real gold standard for tooth segmentation? A preliminary in vivo study using conebeam computed tomography images. Meandros Med. Dent. J. 2021;22:263–273. doi: 10.4274/meandros.galenos.2021.14632. [DOI] [Google Scholar]
- 10.Kang HC, Choi C, Shin J, Lee J, Shin YG. Fast and accurate semiautomatic segmentation of individual teeth from dental CT images. Comput. Math. Methods Med. 2015;2015:810796. doi: 10.1155/2015/810796. [DOI] [PMC free article] [PubMed] [Google Scholar]
- 11.Luo D, Zeng W, Chen J, Tang W. Deep learning for automatic image segmentation in stomatology and its clinical application. Front. Med. Technol. 2021;3:767836. doi: 10.3389/fmedt.2021.767836. [DOI] [PMC free article] [PubMed] [Google Scholar]
- 12.Nagarajappa AK, Dwivedi N, Tiwari R. Artifacts: The downturn of CBCT image. J. Int. Soc. Prev. Commun. Dent. 2015;5(6):440–445. doi: 10.4103/2231-0762.170523. [DOI] [PMC free article] [PubMed] [Google Scholar]
- 13.Venkatesh E, Elluru SV. Cone beam computed tomography: Basics and applications in dentistry. J. Istanb. Univ. Fac. Dent. 2017;51(3 Suppl 1):S102–S121. doi: 10.17096/jiufd.00289. [DOI] [PMC free article] [PubMed] [Google Scholar]
- 14.Schulze R, Heil U, Gross D, Bruellmann DD, Dranischnikow E, Schwanecke U, Schoemer E. Artefacts in CBCT: A review. Dentomaxillofac. Radiol. 2011;40(5):265–273. doi: 10.1259/dmfr/30642039. [DOI] [PMC free article] [PubMed] [Google Scholar]
- 15.Endo M, Tsunoo T, Nakamori N, Yoshida K. Effect of scattered radiation on image noise in cone beam CT. Med. Phys. 2001;28(4):469–474. doi: 10.1118/1.1357457. [DOI] [PubMed] [Google Scholar]
- 16.Farman AG. Guest editorial—Self-referral: An ethical concern with respect to multidimensional imaging in dentistry? J. Appl. Oral Sci. 2009 doi: 10.1590/s1678-77572009000500001. [DOI] [PMC free article] [PubMed] [Google Scholar]
- 17.LeCun Y, Bengio Y, Hinton G. Deep learning. Nature. 2015;521(7553):436–444. doi: 10.1038/nature14539. [DOI] [PubMed] [Google Scholar]
- 18.Ronneberger O, Fischer P, Brox T. U-Net: Convolutional networks for biomedical image segmentation. Med. Image Comput. Comput.-Assist. Intervent. 2015;9351:234–241. [Google Scholar]
- 19.Yin XX, Sun L, Fu Y, Lu R, Zhang Y. U-Net-based medical image segmentation. J. Healthc. Eng. 2022;2022:4189781. doi: 10.1155/2022/4189781. [DOI] [PMC free article] [PubMed] [Google Scholar] [Retracted]
- 20.Duan W, Chen Y, Zhang Q, Lin X, Yang X. Refined tooth and pulp segmentation using U-Net in CBCT image. Dentomaxillofac. Radiol. 2021;50(6):20200251. doi: 10.1259/dmfr.20200251. [DOI] [PMC free article] [PubMed] [Google Scholar]
- 21.Li Q, Chen K, Han L, Zhuang Y, Li J, Lin J. Automatic tooth roots segmentation of cone beam computed tomography image sequences using U-net and RNN. J. Xray Sci. Technol. 2020;28(5):905–922. doi: 10.3233/XST-200678. [DOI] [PubMed] [Google Scholar]
- 22.Zhou H, Cao M, Min Y, Yoon S, Kishan A, Ruan D. Ensemble learning and tensor regularization for cone-beam computed tomography-based pelvic organ segmentation. Med. Phys. 2022;49(3):1660–1672. doi: 10.1002/mp.15475. [DOI] [PubMed] [Google Scholar]
- 23.Shaheen E, Leite A, Alqahtani KA, Smolders A, Van Gerven A, Willems H, Jacobs R. A novel deep learning system for multi-class tooth segmentation and classification on cone beam computed tomography. A validation study. J. Dent. 2021;115:103865. doi: 10.1016/j.jdent.2021.103865. [DOI] [PubMed] [Google Scholar]
- 24.Minnema J, Wolff J, Koivisto J, Lucka F, Batenburg KJ, Forouzanfar T, van Eijnatten M. Comparison of convolutional neural network training strategies for cone-beam CT image segmentation. Comput. Methods Programs Biomed. 2021;207:106192. doi: 10.1016/j.cmpb.2021.106192. [DOI] [PubMed] [Google Scholar]
- 25.Juan CJ, Lin SC, Li YH, Chang CC, Jeng YH, Peng HH, Huang TY, Chung HW, Shen WC, Tsai CH, Chang RF, Liu YJ. Improving interobserver agreement and performance of deep learning models for segmenting acute ischemic stroke by combining DWI with optimized ADC thresholds. Eur. Radiol. 2022 doi: 10.1007/s00330-022-08633-6. [DOI] [PubMed] [Google Scholar]
- 26.Chang YJ, Huang TY, Liu YJ, Chung HW, Juan CJ. Classification of parotid gland tumors by using multimodal MRI and deep learning. NMR Biomed. 2021;34(1):e4408. doi: 10.1002/nbm.4408. [DOI] [PMC free article] [PubMed] [Google Scholar]
- 27.Wang H, Minnema J, Batenburg KJ, Forouzanfar T, Hu FJ, Wu G. Multiclass CBCT image segmentation for orthodontics with deep learning. J. Dent. Res. 2021;100(9):943–949. doi: 10.1177/00220345211005338. [DOI] [PMC free article] [PubMed] [Google Scholar]
- 28.Lim M, Hacihaliloglu I. Structure-enhanced local phase filtering using L0 gradient minimization for efficient semiautomated knee magnetic resonance imaging segmentation. J. Med. Imaging (Bellingham) 2016;3(4):044503. doi: 10.1117/1.JMI.3.4.044503. [DOI] [PMC free article] [PubMed] [Google Scholar]
- 29.Chen Y, Du H, Yun Z, Yang S, Dai Z, Zhong L, Feng Q, Yang W. Automatic segmentation of individual tooth in dental CBCT images from tooth surface map by a multi-task FCN. IEEE Access. 2020;8:97296–97309. doi: 10.1109/ACCESS.2020.2991799. [DOI] [Google Scholar]
- 30.Fontenele RC, Gerhardt MDN, Pinto JC, Van Gerven A, Willems H, Jacobs R, Freitas DQ. Influence of dental fillings and tooth type on the performance of a novel artificial intelligence-driven tool for automatic tooth segmentation on CBCT images—A validation study. J. Dent. 2022;119:104069. doi: 10.1016/j.jdent.2022.104069. [DOI] [PubMed] [Google Scholar]
- 31.Lahoud P, EzEldeen M, Beznik T, Willems H, Leite A, Van Gerven A, Jacobs R. Artificial intelligence for fast and accurate 3-dimensional tooth segmentation on cone-beam computed tomography. J. Endod. 2021;47(5):827–835. doi: 10.1016/j.joen.2020.12.020. [DOI] [PubMed] [Google Scholar]
- 32.Wu, X., Chen, H., Huang, Y., Guo, H., Qiu, T., & Wang, L. Center-sensitive and boundary-aware tooth instance segmentation and classification from cone-beam CT. in 2020 IEEE 17th International Symposium on Biomedical Imaging (ISBI). 939–942 (2020).
- 33.Cui, Z., Li, C., & Wang, W. ToothNet: Automatic tooth instance segmentation and identification from cone beam CT images. in 2019 IEEE/CVF Conference on Computer Vision and Pattern Recognition (CVPR). Long Beach, CA, USA. 6368–6377 (2019).
- 34.Lee S, Woo S, Yu J, Seo J, Lee J, Lee C. Automated CNN-based tooth segmentation in cone-beam CT for dental implant planning. IEEE Access. 2020;8:50507–50518. doi: 10.1109/ACCESS.2020.2975826. [DOI] [Google Scholar]
- 35.Rao Y, Wang Y, Meng F, Pu J, Sun J, Wang Q. A symmetric fully convolutional residual network with DCRF for accurate tooth segmentation. IEEE Access. 2020;8:92028–92038. [Google Scholar]
- 36.Tian S, Dai N, Zhang B, Yuan F, Yu Q, Cheng X. Automatic classification and segmentation of teeth on 3D dental model using hierarchical deep learning networks. IEEE Access. 2019;7:84817–84828. doi: 10.1109/ACCESS.2019.2924262. [DOI] [Google Scholar]
- 37.Xu X, Liu C, Zheng Y. 3D tooth segmentation and labeling using deep convolutional neural networks. IEEE Trans. Vis. Comput. Graph. 2019;25(7):2336–2348. doi: 10.1109/TVCG.2018.2839685. [DOI] [PubMed] [Google Scholar]
- 38.Mlynarski P, Delingette H, Alghamdi H, Bondiau PY, Ayache N. Anatomically consistent CNN-based segmentation of organs-at-risk in cranial radiotherapy. J. Med. Imaging (Bellingham) 2020;7(1):014502. doi: 10.1117/1.JMI.7.1.014502. [DOI] [PMC free article] [PubMed] [Google Scholar]
- 39.Zhou X, Takayama R, Wang S, Hara T, Fujita H. Deep learning of the sectional appearances of 3D CT images for anatomical structure segmentation based on an FCN voting method. Med. Phys. 2017;44(10):5221–5233. doi: 10.1002/mp.12480. [DOI] [PubMed] [Google Scholar]
- 40.Wang L, Gao Y, Shi F, Li G, Chen KC, Tang Z, Xia JJ, Shen D. Automated segmentation of dental CBCT image with prior-guided sequential random forests. Med. Phys. 2016;43(1):336. doi: 10.1118/1.4938267. [DOI] [PMC free article] [PubMed] [Google Scholar]
- 41.Jamil N, Sembok TMT, Bakar ZA. Noise removal and enhancement of binary images using morphological operations. Int. Sympos. Inf. Technol. 2008;2008:1–6. [Google Scholar]
Associated Data
This section collects any data citations, data availability statements, or supplementary materials included in this article.
Supplementary Materials
Data Availability Statement
The datasets used or analyzed during the current study are available from the corresponding author on reasonable request.


