

Abstract
Due to the increasing water crisis, the reuse of wastewater deserves attention as a method to reduce the pressure of the water crisis, especially in developing countries. The application of health risk assessment models is a way to estimate disease burdens associated with crop irrigation by wastewater effluents. In this study, a quantitative microbial risk assessment (QMRA) with probabilistic Monte-Carlo simulation was used to estimate the annual risk of enteroviruses (EVs) infection and disease burden for consumers of effluent-irrigated raw vegetables in Tehran, the capital of Iran. Wastewater effluent samples were collected over two seasons: summer and winter. EVs were analyzed in three stages, concentration and separation, cell culture, and real-time PCR (RT-PCR). A questionnaire was used to determine the dominant patterns of vegetable washing by consumers. There were 4 vegetable washing steps: wiping away mud (A), rinsing (B), using detergents (C), using disinfectants (D). 5 patterns of washing were examined in the laboratory and the concentration of enteroviruses was measured in every pattern. pattern 1: just wiping away mud (A), pattern 2: wiping away mud and rinsing (AB), pattern 3: wiping away mud by using detergents and rinsing (ABCB), pattern 4: wiping away mud by using disinfectants and rinsing (ABDB), and pattern 5: wiping away mud by using detergents and disinfectants and rinsing (ABCBDB). For washing pattern 1, pattern 2, and pattern 3, the estimated annual infection risk of EVs was estimated to be 5.6 × 10⁻¹, 3.6 × 10⁻¹, 1.7 × 10⁻¹ (risk/per.day), and burden of disease was calculated as 3 × 10⁻², 2 × 10⁻², and 9 × 10⁻³ (burden/year), respectively. The results showed that if vegetables are washed according to method 5, the microbial risk will be minimized and the excess prevalence of viral infections will be eliminated.
Keywords: QMRA, Real-time PCR, Enterovirus infection, Wastewater effluents, Vegetables
Introduction
Limited access to water in different countries, especially in arid and semi-arid regions, is the greatest challenge in water resource management. Therefore, the use of unconventional water resources such as wastewater treatment plant effluents has become more and more important. Thus the high production rate of wastewater can be considered as a source of water and nutrients [1]. Due to the development of wastewater treatment technologies worldwide, a wide range of wastewater effluent quality is existing. In urban wastewater collection and treatment projects, there has been a long discussion on important issues such as effluent disposal and the reuse of wastewater for irrigation and agriculture [2]. It can be the most effective way to reduce the pressure on underground water resources. Municipal wastewater treatment effluents are considered as an invaluable resource of ecosystem-reinforcing compounds which for various applications require the selection of appropriate treatment processes, applying strict management, and control planning, In addition, application of reclaimed waters can reduce the environmental impacts that may be resulted from chemical fertilizers, by providing nutrients [3–5].
The application of reclaimed waters requires meeting the standards provided by environmental protection agency (EPA) and World Health Organization (WHO) guidelines to prevent adverse health, social, economic, and environmental impacts. In effluent irrigation, it is necessary to pay attention to factors such as the proximity of agricultural land to the treatment plant in order to reduce supply costs, soil quality, soil permeability, and groundwater level [6, 7]. Also, it is mandatory to take the health risks into account, which is important in transmitting pathogens and diseases to the farmers and product consumers. In addition, pathogens may be transmitted to livestock grazing on such farms and eventually endanger public health [8].
Bacteria, viruses, and also parasites are the major pathogens in domestic wastewater. Some pathogens are resistant and they don’t remove by treatment processes from wastewater and are present and detectable in the effluent. These types of pathogens infectiously pollute the environment [9, 10]. Fecal coliforms (FC) and Escherichia coli are bacterial indicators in wastewater. However, they are not a valid indicator for the presence of some resistant types of viruses [11, 12]. In other words, the concentration of fecal indicators below the guideline limits could not warrant the absence of enteric virus hazards. It is vital to determine the importance of enteric viruses due to the reuse of effluents in agricultural activities, as these viruses can survive longer than bacterial markers in wastewater. Hence, in addition to assay coliform bacteria as a bacterial contamination indicator, enteric viruses have also been identified as an indicator of virus contamination [13].
There is a wide range of enteric viruses in infected persons and they are easily entering wastewater. As reported frequently, enteric viruses are resistant types of viruses and because of that, they can spread in the environment even by treated wastewaters [14]. Many infectious diseases are caused by viruses in the human body. Hence, using wastewater effluent in agriculture is a way to transmit viral infection and it’s a potential risk for public health [15]. Raw vegetables such as basil, parsley, mint is usually irrigated by effluent especially in Tehran, a mega-city in Iran. Enteric viral infections outbreaks such as acute gastroenteritis have been approved with consuming effluent irrigated vegetables. Studies on at-risk groups indicate that consumers and farmers are the most exposed and vulnerable to the diseases [16, 17].
Quantitative microbial risk assessment (QMRA) is a mathematical computational method for determining microbial risk. The QMRA determines the concentration of pathogens to which the consumer is exposed and estimates the probability of disease. The QMRA model has been applied to determine the health risk of effluent use in agriculture [18]. Moazeni et al. in 2017 in Iran assessed the health risk of enteroviruses that existed in lettuce irrigated with treated wastewater by applying a QMRA model [19]. In Australia, Amed et al. in 2018 presented a QMRA model to estimate the concentration of pathogenic viruses wastewater treatment effluents [20] and also Schijven et al. in 2019 in Netherlands surveyed a QMRA model to estimate adeno viruses in water resources [21]. Microbial risk assessment based on the actual monitoring of effluent quality is more valid and wastewater effluents microbiological characteristics are highly dependent on the treatment technology and effectiveness of processes employed [19]. Among the enteric viruses, enteroviruses (EVs), small non-enveloped RNA viruses are considered as relevant waterborne pathogens by WHO, which cause infection and illness at all age groups worldwide [22].
There is inadequate information on the concentration of EVs in wastewater treatment plants and there are few studies on the EVs health risks derived from wastewater reuse in agricultural activities. Therefore, the present study aimed to estimate the disease burden and health risks for enteroviruses in vegetables irrigated with effluent from the wastewater treatment plant. The excess risk from the consumption of raw vegetables irrigated with wastewater by considering different cleaning scenarios was estimated in Tehran, the capital of Iran by applying a QMRA model. We selected some special types of raw vegetables in this study because of its high potential contamination and its high consumption rates in the community. Washing the vegetables before consumption has the greatest effect on decreasing the concentration of enteroviruses and coliforms. To wash the vegetables in the community, different methods can be used such as washing only with water, multi-step washing, and washing with detergents and disinfectants. Each of these methods has different effects in decreasing microbial concentration and reducing the risk of disease. Since washing the vegetables before consumption is the greatest step towards reducing the concentration of pathogens, different scenarios of exposure were designed in this study. The concentrations of enteroviruses, coliform bacteria, and disease burden were determined for each scenario, separately.
Material and methods
Studying area
In this study data collection was performed from October 2019 to September 2020, monthly, in Tehran, the capital of Iran. The characteristics of the studying area are given in Table 1 and the location (WWTPs and downstream farmlands) is shown in Fig. 1. South Tehran wastewater treatment plant is the last stage of the wastewater collection and treatment project in Tehran and is the largest wastewater treatment plant in the Middle East. The effluent is used to irrigate farmlands and to recharge the downstream aquifers. The treatment process in this plant is a conventional activated sludge method along with nitrogen removal operating with six active modules. It covers the collection and treatment of around four million people (with the capacity of 350,000 m3 domestic wastewater per day or 300 million m3 per year). Due to climate change and limited water resources, farmers are interested in using wastewater effluents in agricultural activities for restricted irrigation practices especially for vegetables.
Table 1.
The studying area characteristics
| Characteristics | Unit | Value | Characteristics | Unit | Value |
|---|---|---|---|---|---|
| Mean Temperature | Co | 17.4 | Groundwater depth | m | 3–150 |
| Rainfall | mm/year | 164.7 | Agriculture area | ha | 53,468 |
| Evaporation | mm/year | 2554 | Vegetables farmlands area | ha | 3521 |
| Aquifer volume | M.C.M | 4000 | Agriculture water use | % | 78.2 |
Fig. 1.

The studying area location (WWTPs and downstream farmlands)
Sample collection
Wastewater effluent samples were taken from the south Tehran wastewater treatment plant and also from farmlands irrigated by the effluent. Samples were collected in 1-L sterile glasses and transferred to the laboratory in an insulated cooling box and analyzed immediately. Temperature, pH, and free chlorine of the samples were measured at the time of sampling. Total coliforms (TC), fecal coliforms, and EVs were analyzed for all samples.
Determining the community dominant scenarios of washing vegetables
To determine the dominant patterns of vegetable washing, a questionnaire was designed for the consumers. According to this questionnaire, there were 4 vegetable washing steps asked, wiping away mud (A), rinsing (B), using detergents (C), and using disinfectants (D). According to the steps, 5 patterns of washing were examined in the laboratory and the concentration of EVs was measured in every pattern. pattern 1: just wiping away mud (A), pattern 2: wiping away mud and rinsing (AB), pattern 3: wiping away mud by using detergents and rinsing (ABCB), pattern 4: wiping away mud by using disinfectants and rinsing (ABDB), and pattern 5: wiping away mud by using detergents and disinfectants and rinsing (ABCBDB). The 5th pattern is similar to the pattern World Health Organization (WHO) proposed for washing vegetables (wiping away mud, using detergents and disinfectants and rinsing). Finally, the burden of disease for each pattern was calculated and the dominant washing pattern was compared with the WHO pattern. In addition to determining washing patterns, the average number of days of vegetable consumption per year (days), the average amount of vegetables consumed per person per day (g/person.day), the most types of vegetables consumed, and the incidence of related diseases were also derived from the questionnaire.
Detection of total and fecal coliforms
Total and fecal coliform bacteria concentrations were determined based on the standard method, multiple-tube fermentation method, and results were reported as the most probable number (MPN) of detected bacteria per 100 ml of wastewater (MPN /100 ml) [23].
Detection of enteroviruses
EVs were analyzed in three-stage of concentration and separation, cell culture, and real-time PCR (RT PCR) as described in WHO guideline: “Guidelines for environmental surveillance” by ordering code: WHO/V&B/03.03. Briefly, after initial centrifuge, half (500 ml) of the collected wastewater effluent was concentrated by PEG 6000, Dextran T40, and NaCl in Imhoff funnel before inoculation into cell cultures. Pelleting of larger suspended solids obtained from the initial centrifuge was kept at 4 °C, to be later combined with the concentrated supernatant. The homogenous mixture was left to stand overnight at 4 °C in a separation funnel. In the next day, the bottom layer and the interphase were collected drop-wise. The pellet was suspended in this concentrate and then treated with chloroform and assayed for the presence of the virus. Two cell lines, L20 and RD used in the cell culture stage. Since the L20 is selective for polioviruses. Plates were incubated at 37 °C. The positive plates in the second passage were prepared to determine the viral load and injected into RT PCR. Eventually, the results were used to calculate the 50% tissue culture infective dose (TCID50) of cultivable EVs and results reported quantitative as pfu/ml [24].
Enteroviruses concentration in vegetables
An elution–concentration method based on Tris–glycine buffer (pH 9.5) and PEG (Polyethylene Glycol) 6000 was employed for viral concentration in vegetables. Briefly, 5 g of vegetable sample was soaked in 30 mL of elution buffer (100 mM Tris–HCl, 50 mM glycine, 1% beef extract, pH 9.5) and kept shaking for 20 min at lab temperature, then centrifuged at 8000 rpm for 5 min at 4 °C. Subsequently, the supernatant was centrifuged for 30 min at 4 °C. The second supernatant was adjusted to pH 7 to 7.5 by 5 mol/L HCl while being constantly swirled, after which the neutralized supernatant was precipitated with 70% PEG and 5 mol/L NaCl to final concentrations. Viral particles were pelleted by centrifugation for 30 min at 4 °C and suspended in water and finally stored at -20 °C refrigerator [25].
Quantitative microbial risk assessment
Consumers' exposure assessment
The daily dose of EVs on vegetable surface (dLS; viruses ingested (pfu/person. day)) ingested by consumers as defined in Eq. (1) and described by Mok and Hamilton in 2014 and Moazeni et al. in 2017 [19, 26]:
| 1 |
where, Ceff is the EVs concentration in the wastewater effluent used for irrigation of vegetables (pfu/ml), Vsurf is the volume of irrigation water captured by vegetables (ml/g), k is the constant of virus kinetic decay (day−1), t is withholding time between the last irrigation event and harvesting (days), M is the vegetables daily consumption which obtained by questionnaire (g/person. day), and Rwash is the reduction of surface viruses due to washing with water in any washing method separately (in Log unit). The water capture factor (Vsurf) for vegetables was taken from spray irrigation (Mok and Hamilton, 2014). It was assumed that all EVs that existed in the wastewater effluent would transfer to the plant (Mok and Hamilton, 2014; Sales Ortells et al., 2015; Mok et al., 2014; Hamilton et al., 2006). The withholding time between last irrigation and harvest (t) was estimated 1–3 days according to the information from common actions in the field at the study site. In this study, it was assumed that the most consumption of vegetables is on the harvest day, thus the reduction of viruses in the lapsed time is assumed to be zero.
Dose—response model and risk characterization
The probability of EV infection risk per person per day (Pi (d)) was calculated by an exponential model in Eq. (2) [18, 19, 27]:
| 2 |
where, k` is the exponential model parameter (0.00374), and d is the dose of EVs which here is dLS (pfu/day). The annual infection risk per person (Pi (A)) was estimated by using Eq. (3).
| 3 |
where n is the number of days in a year which a consumer is exposed to dose dLs.
The annual burden of disease (DB) resulting from illness caused by EV infection, can be described by disability-adjusted life years (DALY) per person per year (pppy) in Eq. (4).
| 4 |
where, B is the disease burden per case of illness (DALY per case), and S is the susceptible fraction of the population. In this study, it was assumed all individuals are susceptible to EV infections therefore, S = 1. Iill/inf is the ratio of illness to infection for EVs. As no data is available for B parameter for EVs, the related value for hepatitis A virus (a member of the picornaviridae family) was considered as an estimation for parameter B. For Iill/inf value a uniform distribution with a maximum of 43% for the rate of asymptomatic echovirus infection and a minimum of 76% for coxsackievirus was assumed.
Model implementation
The model parameters are classified into four categories: variable (V), uncertain (U), variable, and uncertain (VU) and constant parameters (C). Eleven assumptions and inputs for the QMRA model were defined in this study: Ceff (pfu/ml) concentration of EVs (VU), M (g/d) per capita consumption of vegetables by consumers (VU), Vsurf (ml/g) the volume of wastewater left on vegetables (VU), n (days) days of exposure for consumers or the number of vegetable consumption days in the community (C), t (days) the length of time between the last wastewater effluent irrigation event and vegetable harvesting (VU), k (day−1) virus kinetic decay (U), Wash Log (Log10) the log removal of EVs by post vegetable washing (VU), S susceptibility fraction of population (C), B (DALY) the parameter for disease burden per case (VU), Iill/inf the illness to infection ratio for EVs (VU) and k` parameter for exponential dose–response model (U). All distribution input was given in Table 2. Monte-Carlo simulations method with 10,000 random samplings was used to incorporate the uncertainty and variability around each parameter. The effect of the value of the model's input on the disease probability was calculated by varying a model parameter to the 95% confidence interval limits of its variability while the other parameters variability was keeping [28]. The sensitivity analysis between the DALY pppy and each input was calculated by Spearman rank-order correlation (r) and assessed by plotting tornado charts.
Table 2.
Input parameters of QMRA model
| Parameter | Unit | Distribution (values) | References |
|---|---|---|---|
| EV concentration in irrigation water (Ceff) | pfu/ml |
gamma (211, 21.1, 2) |
this study |
| volume of water left on vegetables (Vsurf) | ml/g |
normal (0.024,0.37) |
[29] |
| consumption of vegetables by consumers (M) | g/day |
PERT (14.25, 17.81, 21.37) |
this study |
| days of exposure for vegetable consumers per year (n) | days |
uniform (104,156) |
this study |
| withholding time between the last wastewater effluent irrigation event and harvesting (t) | days | normal (3, 0.85) | this study |
| virus kinetic decay constant (k) | days−1 | normal (1.07, 0.07) | [26] |
| EVs removal in post vegetable washing (Rwash) | log10 |
method 1 (0.21) method 2 (0.498) method 3 (0.863) method 4 (missed*) method 5 (neg) |
this study |
| exponential dose- response model parameter (k`) | exponential |
PERT (0.00183,0.00374,0.00562) |
[19, 27] |
| burden of disease parameter (B) |
DALY per case |
PERT (0.076, 0.133, 0.191) |
[30] |
| illness to infection ratio (Iill/inf) | proportion | uniform (0.24, 0.57) | [30, 31] |
| susceptible fraction of the population (S) | ____ | constant (1) | [31] |
gamma (location, scale, shape), normal (mean, sd), PERT (minimum, mode, maximum), uniform (minimum, maximum).
* The sample was missed in laboratory.
Statistical analysis
Statistical analyses were performed by SPSS version 26 and Oracle Crystal Ball software. The correlations between coliforms indicator bacteria, EVs, pH, and temperature were determined by Spearman's correlation analysis. The Mann–Whitney test was done to evaluate the difference of EV, TC, and FC bacteria concentrations in two seasons, summer and winter. A P-value of < 0.05 was considered significant.
Results
Questionnaire analysis
According to the information provided by the questionnaire, more than 30% of respondents consume vegetables 2 or 3 times a week (Fig. 2). Also, 41% of respondents consume an average amount of 50 g (a med-plate) of raw-eatable vegetables in every meal (Fig. 3). Therefore, for the amount of consumption (M) a minimum of 14.25 and a maximum of 21.37 (g/person.day) by the mean of 17.81 (g/person.day) were estimated. The average value for consumer exposure days (n) was estimated to be 130 days a year.
Fig. 2.

Frequency of vegetable consumption in the community
Fig. 3.

Amount of vegetable consumption in a meal per person
The washing patterns results are showing in Fig. 4. Accordingly, 65% of respondents followed method 3, pattern (ABCD) as the dominant pattern including wiping away muds, using detergents, and rinsing.
Fig. 4.

Vegetable washing patterns
Detection of EVs and indicator bacteria
Microbiological and physicochemical characteristics of WWTP effluent are presented in Table 3. EVs were detected in 25% of samples in winter and 75% of samples in summer. The comparison of EVs and total coliforms (TC) concentrations is shown in Fig. 5 for two seasons (summer and winter).
Table 3.
Mean range of physicochemical and microbiological parameters in summer and winter
| Season | EVs (pfu/ml) | Total coliforms (MPN/100 ml) | Fecal coliforms (MPN/100 ml) | pH | Sample temperature (oC) | Environment temperature (oC) |
|---|---|---|---|---|---|---|
| summer | 211 | 6.8 × 10³ | 4 × 10³ | (6.7, 7.9) | 27 | 34 |
| winter | 48 | 1.6 × 10³ | 9.2 × 10² | (6.5, 7.4) | 21 | 13 |
Fig. 5.

The comparison of EVs and total coliforms (TC) concentrations in two seasons
Based on statistical analysis, EVs, TC, and FC concentrations had a significant difference between the two seasons (p < 0.05). Spearman's correlation analysis showed no significant correlation between the concentration of TC, FC, and detected EVs. There was not also a correlation between bacterial indicators and physicochemical parameters.
Quantitative Microbial Risk assessment
EVs concentration was described by gamma distribution as it has previously described for noroviruses and rotaviruses concentrations in effluents (Sales Ortells et al., 2015). The 95% confidence interval for estimated infection risk for raw vegetables consumers was 5.6 × 10⁻¹ for washing scenario (pattern) 1, 3.6 × 10⁻¹ for washing scenario 2, and 7 × 10⁻¹ for washing scenario 3, respectively. The EV’s attributed estimated disease burden was 3 × 10⁻² for washing scenario 1, 2 × 10⁻² for washing scenario 2, and 9 × 10⁻³ for washing scenario 3, respectively.
Figure 6 compares the levels of estimated infection risks and burden of disease with target levels of 10–4 DALY pppy for every washing scenario.
Fig. 6.

The box plots. (A): estimated annual probability of infection risk (Pi (A)) (pppy) and
(B): burden of disease (BD) (DALY pppy) in comparison to 10_4 DALY pppy (solid red line).
The variability cumulative distribution plots for the estimated EV disease burden for every washing scenario are presented in Fig. 7. Light gray bands correspond to the 95% uncertainty range on each quantile of variability and the 50% uncertainty range on each quantile of variability is corresponded to dark gray bands.
Fig. 7.
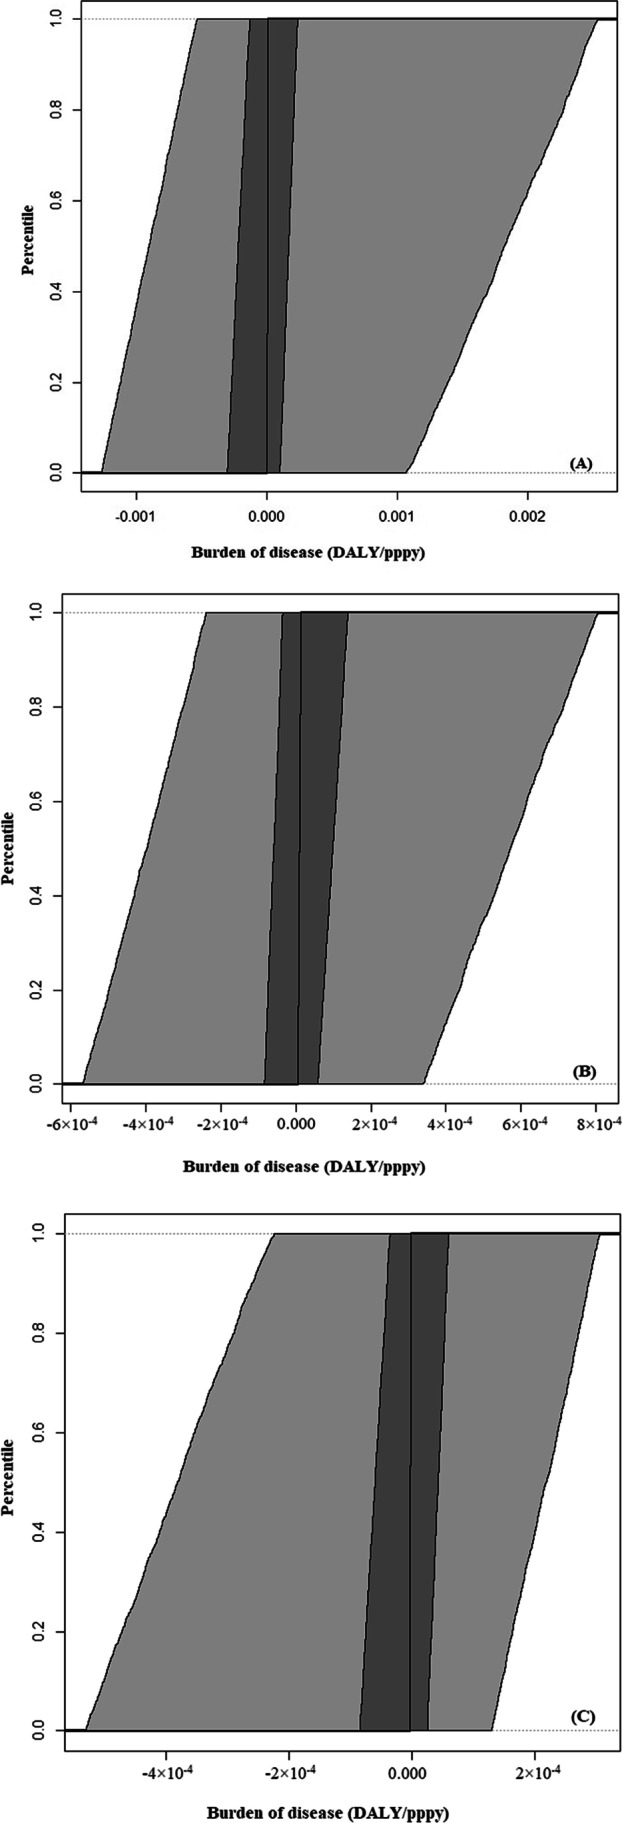
Variability cumulative distribution plots of the EV burden of disease for every washing scenario. A: pattern 1, B: pattern 2 and C: pattern 3. Y-axis is the percentile of variability and the X-axis is the point estimate of the burden of disease. Light gray bands correspond to the 95% uncertainty range on each quantile of variability and the 50% uncertainty range on each quantile of variability is corresponded by dark gray bands
Burden of disease sensitive analysis is shown in Fig. 8. The sensitivity analysis exhibited that the post washing of vegetables (Rwash) before consuming the product, EVs concentration in irrigation water (Ceff), and consumption of vegetables by consumers (M) are the key parameters that significantly affects the magnitude of risk of infection or burden of disease among different washing scenario methods and they were the most important factors influencing the disease burden for all scenarios.
Fig. 8.

Burden of disease sensitive analysis
Discussion
Interpretation of the questionnaire
Information such as the number of family members, the number of vegetables consumed, where do they buy vegetables, how to wash it, and related diseases were extracted from the questionnaire, and the results were given. According to the analysis of the questionnaire, the real conditions of the community were simulated in the laboratory.
The vegetables were brought to the laboratory and washed in different scenarios. As expected, the predominant scenario was the third washing pattern (65%), and consumption of vegetables was two to three days a week (31%), equivalent to 104 to 156 days a year and the average was 130 days used in equations. It is less than the minimum five daily servings of fruits and vegetables recommended by WHO. 41% of the population used a med-plate (50 g) of vegetables in every meal. As a result, the amount of 17.81 (g) of vegetables are consumed per day and per person in society. Hall et al. in 2009 surveyed the global variability in fruit and vegetable consumption in Canada. They concluded that 77.6% of men and 78.4% of women from the 52 mainly low- and middle-income countries consumed less than the minimum recommended servings of fruits and vegetables [32]. In the UK, Feng J He et al. in 2006 conducted a meta-analysis of cohort studies on the necessity of Fruit and vegetable consumption and its relation to strokes. Their results provided strong support for the recommendations to consume more than five servings of fruit and vegetables per day, which is likely to cause a major stroke reduction[33].
Effluent characteristics
Although wastewater reuse is becoming a key point in agricultural activities (especially in arid and semiarid regions) in terms of sustainable development, its associated, pathogen-driven risks to public health have caused global concern. According to the aim of this study, indicator bacteria and infectious EVs were surveyed in effluents, which are used to irrigate farmlands. As reported in Table 3 the mean concentration of TC and FC was not higher than the recommended concentration by the WHO for effluent usage in agricultural irrigation in both seasons, summer and winter (4 × 10³, 9.2 × 10² < 104 per 100 ml) [34]. The results show that the wastewater treatment processes can well reduce the concentration of indicator bacteria and indicate acceptable efficiency in the removal of microorganisms. In the United States, Sanders et al. in 2013 reported that 16% – 34% of sample concentrations exceeded the 800 cfu/100 mL sample maximum for fecal coliforms and 34% – 75% of samples exceeded the full-body contact standard of 235 cfu/100 mL established for E. coli [35].
Although there was a decrease in coliforms in the effluent in both seasons, a significant difference was observed in the concentration of coliforms between the summer and winter seasons, which may be related to ambient temperature, available dissolved oxygen, and low concentration of suspended solids in winter [36]. As reported in Table 3, the results showed a high concentration of EVs in both seasons, and the frequency of EVs detections was higher in summer than in winter. Inconsistent with this study results, Youn-Joo et al. in 2002 investigated Escherichia coli and total coliforms in sediments. They concluded that the concentration of total coliforms and Escherichia coli was greatly increased in the summer [37]. In Saudi Arabia, the study of Al-Harbi et al. in 2003 showed that the abundance of indicator bacteria coliforms was greater in the warm months than in the cold months [38]. Despite the fact that the concentration of EVs and indicator coliforms was higher in summer, the ratio of EVs to total coliforms and the ratio of EVs to fecal coliforms were approximately the same in the two seasons.
Statistical analysis showed a significant difference (p < 0.05) in the concentration of EVs and coliforms in two seasons. The results showed no correlation between TC, FC, and EVs in the effluent samples. In other words, the presence of total coliforms and fecal coliforms was not predictive of the virus presence. Petrinca et al. in 2009 in Italy showed that the presence of fecal indicators was not an indicator for EVs presence [13]. Several studies confirmed this result and even some studies suggested an analysis of enteric viruses instead of coliform bacteria for microbiological monitoring of fecal pollution of water and wastewater and introduce it more reliable indicator [13]. In general, the lack of association between intestinal viruses and coliform markers underscores the need to identify enteroviruses for microbial risk assessment analysis.
Concentration, separation, cell culture, and RT-PCR method were used to assess enteroviruses in wastewater effluent samples. EVs were detected in wastewater effluents in a higher concentration level in summer. 48 and 211 pfu/ml in winter and summer, respectively, 25% of winter samples and 75% of summer samples. Based on previous studies, human EVs are the most prevalent in summer especially from April to July [39]. This issue may be related to the low efficiency of wastewater treatment processes in the inactivation of EVs in the summer. The higher temperature in the summer can survive EVs for a long time in the environment. Therefore, wastewater reuse in agriculture activities would lead to viral infections in consumers of vegetables irrigated by wastewater effluents [19, 26]. In line with this study, Kargar et al. in 2009 in Iran studied the environmental surveillance of non-polio enteroviruses. The results of their research showed the seasonal circulation of enteroviruses and detected the highest concentration of EVs in the summer [40] Also, in Poland, Wieczorek et al. in 2015 detected the highest level of EVs in summer [39]. However, there are some studies that violated these results such as the study of Petrinca et al. in Italy in 2009 reporting the peak concentration of EVs in the winter [13].
Vegetables washing scenarios
In this study, 5 vegetable washing patterns were designed based on washing steps. Vegetables washing steps included wiping away mud (A), rinsing (B), using detergents (C), and using disinfectants (D). According to the steps, 5 patterns of washing were simulated in the laboratory, and the concentration of EVs was measured in every pattern. pattern 1: just wiping away mud (A), pattern 2: wiping away mud and rinsing (AB), pattern 3: wiping away mud by using detergents and rinsing (ABCB), pattern 4: wiping away mud by using disinfectants and rinsing (ABDB), and pattern 5: wiping away mud by using detergents and disinfectants and rinsing (ABCBDB). The fifth pattern was similar to the WHO pattern for washing vegetables. Considering the 95% confidence interval, in scenario (pattern) 1 the estimated annual infection risk of EVs was 5.6 × 10⁻¹, and the burden of disease calculated 3 × 10⁻². In scenario 2, the annual infection risk of EVs was estimated as 3.6 × 10⁻¹ and burden of disease was calculated as 2 × 10⁻². In scenario 3, the annual infection risk of EVs was estimated at 1.7 × 10⁻¹, and the burden of disease was 9 × 10⁻³. Sample for method 4 was missed in laboratory and EVs result of method 5 was negative in cell culture. In other words, if the vegetables are being washed according to pattern 5 that is similar to a pattern WHO proposed, there will not be any health risks related to EVs. According to the questionnaire, pattern 3 was the predominant pattern of washing vegetables in society. Hence, the results of pattern 3 (annual infection risk and burden of disease) can be attributed to society. According to the results, washing vegetables carefully and using detergents and disinfectants can reduce the risk of infection for consumers. This risk will minimize by following the washing pattern 5.
As shown in Fig. 6A, the box plots of annual infection risk estimation showed that just the range of pattern 1 (10–8 to 10–4) exceeded the WHO guideline threshold of 10–4 DALY/pppy and the median values for vegetable consumers for patterns 2 and 3 by a range of (10–7 to 10–5 and 10–10 to 10–5) were lower than WHO guideline threshold. As shown in Fig. 6B, the box plots of the burden of disease estimation showed that the median values for vegetable consumers in all scenarios (patterns) (10–6 to 10–11, 10–7 to 10–12, and 10–7 to 10–14 DALY/pppy) were lower than WHO guideline threshold. Moazeni et al. in 2017 in Iran estimated the health risks related to enteroviruses from the agricultural application of wastewater effluents in two wastewater treatment plants. The results indicated that the box plots of annual infection risk, and disease burden values for lettuce consumers exceeded the WHO guideline threshold, and the activated sludge effluents required an additional reduction of EVs to achieve the acceptable level of risk for agricultural reuse of wastewater and lettuce consumers [19]. Mok et al. in 2014 in Australia assessed the norovirus annual burden of disease due to vegetables irrigated by waste stabilization pond effluent. Their results indicated that the annual disease burden for different vegetables ranged from 10–5 to 10–3 DALY/pppy and all of the median values exceeded the more stringent WHO guideline threshold of 10–6 DALY/pppy for an acceptable level of risk from wastewater reuse [29].
Conclusion
The microbiological analysis of effluent revealed a high concentration of total and fecal coliforms in some samples, but the concentration of EVs had no correlation by indicator coliform bacteria. Therefore, it is clear that the bacterial quality of wastewater effluent is not an appropriate indicator for safe wastewater reuse, especially for the presence of infectious EVs. It’s also assessed that the concentration of EVs and indicator coliforms was higher in summer than in winter.
An approved method involving glycine buffer elution–polyethylene glycol concentration, followed by the detection of RT-PCR was employed for the identification of EVs in vegetable samples. Scenario (pattern) 3 (wiping away mud, using detergents, and rinsing) was considered as the predominant pattern of washing vegetables in society which its results could be attributed to society. It was also concluded that by washing vegetables using washing patter 5 (wiping away mud by using detergents and disinfectants and rinsing) which is similar to the pattern proposed by the WHO, the risk of infection can be reduced for the consumers to a level of acceptance of 10–4.
The results also showed that if vegetables are washed according to washing pattern 5 that is similar to the pattern proposed by the WHO, the microbial risk could be minimized and the prevalence of viral infections caused by consumption of vegetables can be eliminated in the community.
The average annual infection risk and disease burden of EVs for vegetable consumers was lower than the WHO guideline threshold in all scenarios, except scenario 1 (wiping away mud).
The sensitivity analyses exhibited that post washing of vegetables (Rwash) before consuming the product, EVs concentration in irrigation water (Ceff), and consumption of vegetables by consumers (M) were the most important factors influencing the disease burden for all scenarios.
Acknowledgements
This study is a part of a Ph.D. dissertation and supported financially by the Institute for Environmental Research (IER) of Tehran University of Medical Sciences (Grant No: 97-03-46-40) and Iran National Science Foundation (INSF) (Grant No: 98005741). The authors also gratefully acknowledge the support of the Vice-Chancellery in Research Affairs at Tehran University of Medical Sciences.
Author Contributions
All authors contributed to the study's conception and design. Material preparation, data collection, and analysis were performed by Seyed Yaser Hashemi, Hamideh Tabatabaei, and Ahmad Nejati. Application of statistical and other formal techniques to analyze study data performed by Mahdi Hadi, Ramin Nabizadeh Noodehi, and Mahmood Alimohammadi. Validation and verification of study performed by Shohreh Shahmahmoodi. Supervision and leadership responsibility for the research activity planning and execution was by Alireza Mesdaghinia. The first draft of the manuscript was written by Seyed Yaser Hashemi and all authors commented on previous versions of the manuscript. All authors read and approved the final manuscript.
Funding
This study was funded by the Institute for Environmental Research (IER) of Tehran University of Medical Sciences (Grant No: 97–03-46–40) and Iran National Science Foundation (INSF) (Grant No: 98005741).
Data Availability
The datasets used and analyzed during the current study are available from the corresponding author on reasonable request.
Declarations
Competing interests
The authors declare that they have no competing interests.
Financial interests
The authors declare they have no financial interests.
Ethical approval and Consent to Participate
This research has a Research Ethics Certificate approved by Vice-Chancellery in Research Affairs at Tehran University of Medical Sciences by approval ID: IR.TUMS.VCR.REC.1397.885. Hereby, we consciously assure that the followings are fulfilled: 1) This research is the authors' own original work, which has not been previously published elsewhere. 2) The paper is not currently being considered for publication elsewhere. 3) The paper reflects the authors' own research and analysis in a truthful and complete manner. 4) The paper properly credits the meaningful contributions of co-authors and co-researchers. 5) The results are appropriately placed in the context of prior and existing research. 6) All sources used are properly disclosed. 7) All authors have been personally and actively involved in substantial work leading to the paper and will take public responsibility for its content.
Consent for publication
The manuscript has not been published elsewhere and it is not under submission to any other Journal. All the authors mutually agree that it should be submitted to journal of International Journal of Environmental Science and Technology.
Footnotes
Publisher's Note
Springer Nature remains neutral with regard to jurisdictional claims in published maps and institutional affiliations.
References
- 1.L. Chacón, K. Barrantes, C. Santamaría-Ulloa, M. Solano, L. Reyes, L. Taylor, et al., "A somatic coliphage threshold approach to improve the management of activated sludge wastewater treatment plant effluents in resource-limited regions," Applied and Environmental Microbiology, vol. 86, 2020. [DOI] [PMC free article] [PubMed]
- 2.J. Fito and S. W. Van Hulle, "Wastewater reclamation and reuse potentials in agriculture: towards environmental sustainability," Environment, Development and Sustainability, pp. 1–24, 2020.
- 3.Revitt DM, Lundy L, Fatta-Kassinos D. Development of a qualitative approach to assessing risks associated with the use of treated wastewater in agricultural irrigation. Journal of Hazardous Materials. 2021;406:124286. doi: 10.1016/j.jhazmat.2020.124286. [DOI] [PubMed] [Google Scholar]
- 4.Baghapour MA, Nasseri S, Djahed B. Evaluation of Shiraz wastewater treatment plant effluent quality for agricultural irrigation by Canadian Water Quality Index (CWQI) Iranian journal of environmental health science & engineering. 2013;10:1–9. doi: 10.1186/1735-2746-10-27. [DOI] [PMC free article] [PubMed] [Google Scholar]
- 5.Lotfi K, Bonakdari H, Ebtehaj I, Delatolla R, Zinatizadeh AA, Gharabaghi B. A novel stochastic wastewater quality modeling based on fuzzy techniques. J Environ Health Sci Eng. 2020;18:1099–1120. doi: 10.1007/s40201-020-00530-8. [DOI] [PMC free article] [PubMed] [Google Scholar]
- 6.Sayo Sussy Kiratu, Nyamato John M, G. S, Heavy metal concentrations in soil and vegetables irrigated with sewage effluent: A case study of Embu sewage treatment plant, Kenya. Scientific African. 2020;8:e00337. doi: 10.1016/j.sciaf.2020.e00337. [DOI] [Google Scholar]
- 7.S. Y. Hashemi, M. Yegane Badi, H. Pasalari, A. Azari, H. Arfaeinia, and A. Kiani, "Degradation of Ceftriaxone from aquatic solution using a heterogeneous and reusable O3/UV/Fe3O4@ TiO2 systems: operational factors, kinetics and mineralisation," International Journal of Environmental Analytical Chemistry, pp. 1–17, 2020.
- 8.Marleni NNN, Saleh L, Andriani N, Ermawati R, Firdaus NA. Selection of Municipal Wastewater Reuse Technology for Agricultural Water by Using Multi Criteria Analysis (MCA): The Case of Walcheren Wastewater Treatment Plant, The Netherlands. Journal of Wetlands Environmental Management. 2020;8:63–76. doi: 10.20527/jwem.v8i1.207. [DOI] [Google Scholar]
- 9.Benito M, Menacho C, Chueca P, Ormad MP, Goñi P. Seeking the reuse of effluents and sludge from conventional wastewater treatment plants: Analysis of the presence of intestinal protozoa and nematode eggs. Journal of environmental management. 2020;261:110268. doi: 10.1016/j.jenvman.2020.110268. [DOI] [PubMed] [Google Scholar]
- 10.Shamsollahi HR, Ghoochani M, Sadeghi K, Jaafari J, Masinaei M, Sillanpää M, et al. Evaluation of the physical and chemical characteristics of water on the removal efficiency of rotavirus in drinking water treatment plants and change in induced health risk. Process Saf Environ Prot. 2019;130:6–13. doi: 10.1016/j.psep.2019.07.014. [DOI] [Google Scholar]
- 11.Tandukar S, Sherchan SP, Haramoto E. Applicability of crAssphage, pepper mild mottle virus, and tobacco mosaic virus as indicators of reduction of enteric viruses during wastewater treatment. Sci Rep. 2020;10:1–8. doi: 10.1038/s41598-020-60547-9. [DOI] [PMC free article] [PubMed] [Google Scholar]
- 12.Mesdaghinia A, Younesian M, Nasseri S, Nodehi RN, Hadi M. A bibliometric and trend analysis on the water-related risk assessment studies for Cryptosporidium pathogen. Iran J Parasitol. 2015;10:338. [PMC free article] [PubMed] [Google Scholar]
- 13.Petrinca A, Donia D, Pierangeli A, Gabrieli R, Degener A, Bonanni E, et al. Presence and environmental circulation of enteric viruses in three different wastewater treatment plants. J Appl Microbiol. 2009;106:1608–1617. doi: 10.1111/j.1365-2672.2008.04128.x. [DOI] [PubMed] [Google Scholar]
- 14.Okitsu S, Khamrin P, Takanashi S, Thongprachum A, Hoque SA, Takeuchi H, et al. Molecular detection of enteric viruses in the stool samples of children without diarrhea in Bangladesh. Infection, Genetics and Evolution. 2020;77:104055. doi: 10.1016/j.meegid.2019.104055. [DOI] [PubMed] [Google Scholar]
- 15.Nodehi RN, Aslani H, Alomohammadi M, Nemati R, Naddafi K, Ghany M. Performance comparison of Fenton and Fenton modified with copper in raw wastewater disinfection for reuse in agriculture. Iranian Journal of Health and Environment. 2012;5:189–200. [Google Scholar]
- 16.Alimohammadi M, Naderi M. Effectiveness of Ozone Gas on Airborne Virus Inactivation in Enclosed Spaces: A Review Study. Ozone: Science & Engineering. 2021;43:21–31. doi: 10.1080/01919512.2020.1822149. [DOI] [Google Scholar]
- 17.Ebomah KE, Okoh AI. An African perspective on the prevalence, fate and effects of carbapenem resistance genes in hospital effluents and wastewater treatment plant (WWTP) final effluents: A critical review. Heliyon. 2020;6:e03899. doi: 10.1016/j.heliyon.2020.e03899. [DOI] [PMC free article] [PubMed] [Google Scholar]
- 18.Pasalari H, Ataei-Pirkooh A, Aminikhah M, Jafari AJ, Farzadkia M. Assessment of airborne enteric viruses emitted from wastewater treatment plant: atmospheric dispersion model, quantitative microbial risk assessment, disease burden. Environ Pollut. 2019;253:464–473. doi: 10.1016/j.envpol.2019.07.010. [DOI] [PubMed] [Google Scholar]
- 19.Moazeni M, Nikaeen M, Hadi M, Moghim S, Mouhebat L, Hatamzadeh M, et al. Estimation of health risks caused by exposure to enteroviruses from agricultural application of wastewater effluents. Water Res. 2017;125:104–113. doi: 10.1016/j.watres.2017.08.028. [DOI] [PubMed] [Google Scholar]
- 20.Ahmed W, Hamilton KA, Lobos A, Hughes B, Staley C, Sadowsky MJ, et al. Quantitative microbial risk assessment of microbial source tracking markers in recreational water contaminated with fresh untreated and secondary treated sewage. Environ Int. 2018;117:243–249. doi: 10.1016/j.envint.2018.05.012. [DOI] [PubMed] [Google Scholar]
- 21.Schijven J, Teunis P, Suylen T, Ketelaars H, Hornstra L, Rutjes S. QMRA of adenovirus in drinking water at a drinking water treatment plant using UV and chlorine dioxide disinfection. Water Res. 2019;158:34–45. doi: 10.1016/j.watres.2019.03.090. [DOI] [PubMed] [Google Scholar]
- 22.Shahmahmoodi S, Zahraei SM, Gouya MM, Mousavi T, Hosseini M, OstovarEsfandabadi M, et al. Relative frequency and type identification of non-polio enteroviruses isolated from acute flaccid paralysis cases in Iran, 1995–2000. Journal of School of Public Health and Institute of Public Health Research. 2012;10:53–66. [Google Scholar]
- 23.Apha A. WEF (2005) Standard methods for the examination of water and wastewater. American Water Works Association, and Water Environment Federation: American Public Health Association; 2007. [Google Scholar]
- 24.WHO, "Guidelines for environmental surveillance of poliovirus circulation," World Health Organization, 2003.
- 25.Ruan J, Sun CJ, Chen F, Zhou C, Li YQ, Liu YP, et al. Capillary Electrophoresis-Based Detection for Foodborne Enteroviruses in Vegetable Samples. Chromatographia. 2015;78:1191–1199. doi: 10.1007/s10337-015-2931-x. [DOI] [Google Scholar]
- 26.Mok HF, Hamilton AJ. Exposure factors for wastewater-irrigated Asian vegetables and a probabilistic rotavirus disease burden model for their consumption. Risk Anal. 2014;34:602–613. doi: 10.1111/risa.12178. [DOI] [PMC free article] [PubMed] [Google Scholar]
- 27.Huang Y. "Enteroviruses Dose Response Models. Quantitative Microbial Risk Assessment Wiki," Center for Advancing Microbial Risk Assessment, Michigan State University. 2013. http://qmrawiki.msu.edu/index.php. Accessed 25 Jan 2015
- 28.Pouillot R, Delignette-Muller ML. Evaluating variability and uncertainty separately in microbial quantitative risk assessment using two R packages. Int J Food Microbiol. 2010;142:330–340. doi: 10.1016/j.ijfoodmicro.2010.07.011. [DOI] [PubMed] [Google Scholar]
- 29.Mok H-F, Barker SF, Hamilton AJ. A probabilistic quantitative microbial risk assessment model of norovirus disease burden from wastewater irrigation of vegetables in Shepparton, Australia. Water Res. 2014;54:347–362. doi: 10.1016/j.watres.2014.01.060. [DOI] [PubMed] [Google Scholar]
- 30.A. Havelaar and J. Melse, "Quantifying public health risk in the WHO Guidelines for drinking-water quality: A burden of disease approach," 2003.
- 31.Symonds E, Verbyla M, Lukasik J, Kafle R, Breitbart M, Mihelcic J. A case study of enteric virus removal and insights into the associated risk of water reuse for two wastewater treatment pond systems in Bolivia. Water Res. 2014;65:257–270. doi: 10.1016/j.watres.2014.07.032. [DOI] [PubMed] [Google Scholar]
- 32.Hall JN, Moore S, Harper SB, Lynch JW. Global variability in fruit and vegetable consumption. American journal of preventive medicine. 2009;36:402–409e5. doi: 10.1016/j.amepre.2009.01.029. [DOI] [PubMed] [Google Scholar]
- 33.Feng CAN, He J, MacGregor GA. Fruit and vegetable consumption and stroke: meta-analysis of cohort studies. The Lancet. 2006;367:320–326. doi: 10.1016/S0140-6736(06)68069-0. [DOI] [PubMed] [Google Scholar]
- 34.WHO, WHO guidelines for the safe use of wasterwater excreta and greywater vol. 1: World Health Organization, 2006.
- 35.Sanders EC, Yuan Y, Pitchford A. Fecal coliform and E. coli concentrations in effluent-dominated streams of the Upper Santa Cruz watershed. Water. 2013;5:243–261. doi: 10.3390/w5010243. [DOI] [Google Scholar]
- 36.Aali R, Nikaeen M, Khanahmad H, Hassanzadeh A. Monitoring and comparison of antibiotic resistant bacteria and their resistance genes in municipal and hospital wastewaters. Int J Prev Med. 2014;5:887. [PMC free article] [PubMed] [Google Scholar]
- 37.An Y-J, Kampbell DH, Breidenbach GP. Escherichia coli and total coliforms in water and sediments at lake marinas. Environ Pollut. 2002;120:771–778. doi: 10.1016/S0269-7491(02)00173-2. [DOI] [PubMed] [Google Scholar]
- 38.Al-Harbi AH. Faecal coliforms in pond water, sediments and hybrid tilapia Oreochromis niloticus× Oreochromis aureus in Saudi Arabia. Aquac Res. 2003;34:517–524. doi: 10.1046/j.1365-2109.2003.00832.x. [DOI] [Google Scholar]
- 39.Wieczorek M, Ciąćka A, Witek A, Kuryk Ł, Żuk-Wasek A. Environmental surveillance of non-polio enteroviruses in Poland, 2011. Food and environmental virology. 2015;7:224–231. doi: 10.1007/s12560-015-9195-3. [DOI] [PubMed] [Google Scholar]
- 40.Kargar M, Sadeghipour S, Nategh R. Environmental surveillance of non-polio enteroviruses in Iran. Virology Journal. 2009;6:1–5. doi: 10.1186/1743-422X-6-149. [DOI] [PMC free article] [PubMed] [Google Scholar]
Associated Data
This section collects any data citations, data availability statements, or supplementary materials included in this article.
Data Availability Statement
The datasets used and analyzed during the current study are available from the corresponding author on reasonable request.