

Abstract
Purpose
Fluoride level, due to its narrow therapeutical range, must be constantly monitored in beverages, especially in daily-consumed plant infusions. Fluoride is important for prevention of tooth decay and osteoporosis, but its excess leads to fluorosis. Since tea can selectively absorb fluorides from soils, the question arises if a long-term consumption can pose an adverse effect on human health.
Methods
Infusions of 33 popular teas (black, green, white, earl grey, pu-erh), tea-like products (rooibos, yerba mate) and herbs (chamomile, mint, nettle, purges, yarrow) available in the Polish market were analyzed with respect to a fluoride level by means of a validated ion-selective electrode method, which is proven to be fast and reliable.
Results
Significantly different fluoride concentrations in infusions were observed, with black tea on top, where extraction of fluoride is the highest (average 2.65 mg F−/L, range 0.718–6.029 mg/L). Two-fold higher fluoride contents were measured in infusions made from black tea bags than from leaves (average 3.398 mg/L and 1.529 mg/L, respectively). Green teas released comparable amounts of fluoride as black teas, while in herbal extracts the fluoride content was negligible.
Conclusions
The rank with respect to the fluoride concentration in an infusion is as follows: black tea > green tea > earl grey > pu-erh > white tea>>>rooibos, yerba mate, herbal products. Increasing of brewing time results in an increased fluoride content, but the overall content of fluoride in the analyzed infusions of teas and herbs was not high enough to cause a risk of fluorosis, even if left to brew up to 15 min.
Keywords: Fluoride, Herbal products, Ion-selective electrode, Poland, Tea
Introduction
Fluorine is a reactive halogen element often present in nature, hence also in environmental samples, food and materials of biological origin. Fluoride (F−), in a suitable dose, is considered beneficial for humans, as it is necessary for growth of tissues, bones and teeth. An increased dosage, however, can cause damage to a human body, not only in the form of dental or skeletal fluorosis, but also to soft tissues, such as brain, kidney, liver and spinal cord [1]. The lethal dose for adults is from 0.20 to 0.35 g F−/kg of body weight [2]. According to WHO [3], fluoride is classified, next to arsenic and nitrate, as a contaminant in drinking water, which may cause large-scale health problems. This situation occurs mainly in endemic areas where drinking water sources have a high fluoride content, such as in parts of India, Africa, China, and Iran [4–7].
Fluoride can be released into the groundwater by slow dissolution of fluorine-containing rocks [8], but it may also leach out from anthropogenic sources such as, coal fired power stations, brick and iron works, beryllium extraction plans and aluminium smelters [9]. Moreover, in certain countries (e.g. the United States), drinking water is fluoridated (by adding sodium fluoride, sodium fluorosilicate and/or hydrofluorosilicic acid), which keeps a fluoride level at 0.7 mg/L [10, 11]. The amount of fluoride consumed with drinking water contributes vastly to fluoride intake. According to Malin and Till [11], before 2010 drinking water in US was even more fluoridated, reaching 1.2 mg/L, which led to serious fluoride exposure of children. In Poland water is not fluoridated, with the fluoride level below 0.3 mg/L (in the majority of the settlements in Poland), with just a few spots, where the concentration exceeds 2 mg/L [12]. Even without purposely fluoridated water, there is a need for monitoring fluoride in food and beverages. Many epidemiological observations showed that fluorosis may be caused by long-term consumption of large amounts of tea, such as observed in Tibet, Mongolia and in the western parts of China [13] Which concerned both adults and children [14]. The studies on a correlation between an elevated level of fluoride in drinking water and incidence of hypertension [15], infertility and risk of spontaneous abortion [16, 17], and Attention-Deficit Hyperactivity Disorder (ADHD) are particularly disturbing [11]. Considering that tea is the most popular non-alcoholic beverage in the world (two thirds of the world’s population drinks tea every day), there is no doubt that tea consumers must become aware about fluoride and its presence in tea infusions [18].
Among the plants, tea (Camellia sinensis L.) is described as „hyper-accumulator” of fluoride [19] because of selective absorption from soils, mainly acidic, rich with fluorine-containing minerals [20]. Historically, tea was grown only under natural conditions, but nowadays many tea growers apply phosphate fertilizers [10] or fluorine-containing pesticides [21] which would increase a fluoride content in tea plants even more. It should also be emphasized that absorption and accumulation of fluoride is proportional to the concentration in the soil [22] and progresses in time, which makes aged leaves much richer with fluoride [20]. Gao et al. [23] revealed, that fluoride in a tea plant is accumulated in a soluble fraction of tea roots and leaves. It is located mainly in vacuoles (98.1% of total fluorides measured in the protoplasts), which reduces its toxicity to organelles, hence leaves with a high content of fluoride did not indicate any symptoms of toxicity and did not differ from the others. During a brewing process fluoride contained in tea leaves is released into an infusion; creating a potential health risk related to the consumption of tea for adults and children [24]. According to Fung et al. [25] 53–80% of total fluoride accumulated in tea leaves can be released, but it depends quite significantly on a type of brewed tea.
The history of tea goes back more than 5000 years in Asian countries, such as China, Japan, India and Thailand [26]. As reported on 23th session of FAO Intergovernmental Group on Tea, production reached 5.73 million tons in 2016 year (5.35 million tons in 2013 year). Although China, being a cradle of tea, is still a leader of its production (2.44 million tons in 2016), nowadays tea is produced in 45 countries. Countries with an old tradition and culture of drinking tea are major tea producers, i.e. India, Kenya, Sri Lanka, Vietnam, Turkey and Iran [27]. Poland, on the other hand, is a major importer of tea, reaching about 38 thousand tons in 2019 [28].
Drinking tea can show health-promoting effects, related to a presence of tannins (which are able to bind toxins), polyphenols (cholesterol decreasing, antioxidant, antimutagenic and anticancer properties) [29], theanine, caffeine (stimulant properties), and bioactivities of catechins or polysaccharides [30]. However, it can also have a negative effect, not only because of fluoride. Tea may contain harmful elements such as Al [18, 31], As, Cr, Cd, Cu, Fe, Mn, Ni and Pb [18, 32, 33], as well as organic contaminants, like pesticide residues or mycotoxins [34–36] and process-induced toxicants as acrylamide [37, 38] and polycyclic aromatic hydrocarbons [39].
We aimed our research at determination of a fluoride content in infusions of popular teas in Poland, accessible in local supermarkets. Our research covered various types and brands of tea, as well as few tea-like products used for making beverages called “tea”, but produced from other plants, such as rooibos (Aspalathus linearis) or yerba mate (Ilex paraguariensis), consumed broadly for their alleged health-beneficial properties or simply for their taste. We also included the most popular herbs, which are willingly consumed in Poland, brewed similarly to tea. To measure fluoride concentration an ion-selective fluoride electrode (fluoride-ISE) was used. The screening of fluoride content in the collection of teas and tea-like products is often presented in scientific literature, particularly in the countries wherein tea consumption is really high, such as: China [40], Denmark [41], Iran [42] and [43], UK [44] and [45], Japan [46], New Zealand [47], Sri Lanka [48], Ireland [49], etc. The reasoning behind this research is always a need to monitor a potential health risk due to fluoride exposure. In our work we verified which brand/type of tea and tea-like products (including herbs) releases a higher level of fluoride and how it is affected by a brewing time. Ultimately, evaluation of average tea consumption and potential risk of fluoride overdosing was presented.
Materials and methods
Sample collection and preparation
Twenty-four tea samples, four tea-like products (rooibos and yerba mate) and five herbal products were evaluated in this study. All products were purchased from supermarkets in Poland (Table 3). Before preparing the infusions, the samples were stored under dry conditions at room temperature.
Table 3.
Content of fluorides [mg/L] in infusions of selected teas and herbs (replicates n = 9, mean ± SD)
| Brand | Package type | Origin | Brewing time [min] | |||
|---|---|---|---|---|---|---|
| 5 | 15 | |||||
| Content ± SD [mg/L] | RSD [%] | Content ± SD [mg/L] | RSD [%] | |||
| black tea | bag | China | 3.172 ± 0.066 | 2.08 | 4.085 ± 0.060 | 1.47 |
| black tea | bag | India | 2.212 ± 0.015 | 0.66 | 2.540 ± 0.012 | 0.77 |
| black tea | bag | Sri Lanka | 2.178 ± 0.051 | 2.35 | 2.442 ± 0.046 | 1.90 |
| black tea | bag | India, Indonesia | 4.480 ± 0.034 | 0.75 | 6.098 ± 0.149 | 2.45 |
| black tea | bag | India, Africa | 6.029 ± 0.127 | 2.10 | 6.759 ± 0.143 | 2.12 |
| black tea | leaf | Turkey | 1.564 ± 0.027 | 1.72 | 2.108 ± 0.104 | 4.93 |
| black tea | leaf | Turkey | 1.836 ± 0.032 | 1.75 | 2.088 ± 0.083 | 3.96 |
| black tea | leaf | Turkey | 1.595 ± 0.060 | 3.73 | 1.890 ± 0.045 | 2.39 |
| black tea | bag | Sri Lanka | 2.320 ± 0.013 | 0.56 | 2.948 ± 0.064 | 2.15 |
| black tea | leaf | Sri Lanka | 1.122 ± 0.032 | 2.87 | 1.376 ± 0.052 | 3.79 |
| green tea | bag | NA | 4.893 ± 0.053 | 1.08 | 4.908 ± 0.167 | 3.40 |
| green tea | bag | NA | 4.041 ± 0.108 | 2.68 | 4.494 ± 0.125 | 2.78 |
| green tea | leaf | NA | 2.051 ± 0.042 | 2.06 | 2.384 ± 0.102 | 4.27 |
| green tea | leaf | China, India, Sri Lanka | 0.832 ± 0.030 | 3.57 | 0.997 ± 0.034 | 3.40 |
| green tea | leaf | NA | 0.869 ± 0.018 | 2.10 | 0.944 ± 0.045 | 4.72 |
| white tea | bag | China | 2.258 ± 0.026 | 1.14 | 2.476 ± 0.120 | 4.85 |
| white tea | bag | NA | 2.359 ± 0.039 | 1.66 | 2.492 ± 0.010 | 0.38 |
| white tea | bag | India, Africa | 1.122 ± 0.006 | 0.51 | 1.186 ± 0.047 | 3.99 |
| earl grey | bag | Asia | 4.070 ± 0.054 | 1.32 | 4.722 ± 0.095 | 2.01 |
| earl grey | bag | Sri Lanka | 2.290 ± 0.021 | 0.92 | 2.930 ± 0.062 | 2.11 |
| earl grey | leaf | NA | 0.718 ± 0.012 | 1.66 | 0.817 ± 0.028 | 3.45 |
| pu-erh | bag | China | 2.634 ± 0.059 | 2.24 | 2.673 ± 0.096 | 3.57 |
| pu-erh | bag | NA | 2.169 ± 0.019 | 0.88 | 2.351 ± 0.091 | 3.88 |
| pu-erh | leaf | China | 1.186 ± 0.003 | 0.28 | 1.364 ± 0.023 | 1.65 |
| rooibos (Aspalathus linearis) | bag | RPA | 0.090 ± 0.004 | 4.47 | 0.091 ± 0.004 | 4.73 |
| rooibos (Aspalathus linearis) | bag | RPA | 0.038 ± 0.002 | 4.36 | 0.053 ± 0.002 | 3.81 |
| yerba mate (Ilex paraguariensis) | leaf | Argentina | 0.045 ± 0.002 | 4.31 | 0.066 ± 0.003 | 3.84 |
| yerba mate (Ilex paraguariensis) | fine leaf | NA | 0.041 ± 0.002 | 4.14 | 0.057 ± 0.003 | 4.53 |
| chamomile (Chamomillae anthodium) | bag | Poland | 0.043 ± 0.002 | 4.95 | 0.056 ± 0.002 | 3.18 |
| mint (Menthae piperitae folium) | bag | Poland | 0.077 ± 0.001 | 1.60 | 0.086 ± 0.004 | 4.83 |
| nettle (Urticae folium) | bag | Poland | 0.059 ± 0.003 | 4.55 | 0.075 ± 0.003 | 4.56 |
| purges (Cistus incanus) | herbal drought | Albania | 0.044 ± 0.002 | 4.46 | 0.083 ± 0.004 | 4.41 |
| yarrow (Achillea millefolium) | bag | Poland | 0.063 ± 0.005 | 7.80 | 0.065 ± 0.003 | 3.97 |
NA- data not available
The protocol of preparing an infusion (1% w/v water extract) was adjusted to mimic a domestic manner of brewing, i.e. one tea bag (selected randomly from each branded box of tea) or one teaspoon (sample weight 2.000 g) per one cup of boiling water (200 mL). The tea or herbal product was poured with 200 mL of deionized water (conductivity 0.08 µS/cm) at the temperature of 100oC [20, 50].
The brewing process was conducted in a glass beaker covered with a lid. After extraction, the tea was removed and the infusion was cooled down to a room temperature (18–20oC). To verify an influence of brewing time, we applied two time spans: 5 and 15 min. After brewing, the infusions were filtered through a cellulose filter. The samples were prepared in triplicates.
Fluoride determination
The analysis of fluoride (F−) level was made according to EPA Method 9214 by a combined fluoride ion-selective electrode (Orion™ Fluoride Electrode 9609, Thermo Scientific, USA), containing a monocrystalline form of lanthanum fluoride (LaF3) as an ion-sensitive membrane and Ag/AgCl system as a reference electrode. The measurements were performed with an ion-meter/pH-meter CPI-505 (Elmetron, Poland) in triplicates. To stabilize an ionic strength and pH and to remove interfering ions, the infusions were spiked with TISAB (Total Ionic Strength Adjustment Buffer) in 1:1 ratio. TISAB, due to a presence of CDTA reagent, ensured the preferentially complexation of interfering aluminum and iron (III) cations up to the level of 5 ppm. TISAB was prepared of 57 mL of glacial acetic acid, 56 g of sodium chloride, 136 g of sodium acetate, and 4 g of CDTA (trans 1,2-diamino-cyclohexane-N,N,N’,N’-tetraacetic acid monohydrate) dissolved in 500 mL of deionized water, adjusted to pH about 5-5.5 with 5 M NaOH solution, and diluted up to 1 L [Method 9214]. The measurements were carried out until the stable potential value was observed, but not longer than five minutes after immersing the electrode in the solution.
The calibration was done in the range from 0.1 to 30 mg/L of fluoride at six calibration levels (EPA Method 9214). An intermediate standard solution of fluoride with a concentration 100 mg/L was prepared by diluting a stock solution (1000 mg/L, Sigma Aldrich, USA). Fluoride standard solutions of lower concentrations were obtained through further dilution. All solutions were prepared with deionized water II class according to EN ISO 3696 − 1999 (Hydrolab System HLP10p, Poland). They were stored in polyethylene containers in 8°C. The deionized water spiked with TISAB was taken as a blank sample.
The samples with fluoride standard addition (1.0 mg/L) were measured to perform method validation. Certified Reference Material (CRM) QC3162 (traceable to: NIST SRM 3183) Fluoride in Water (Sigma Aldrich, USA) with a certified content of fluoride 0.420 ± 0.0147 mg/L was also used for assessment of method accuracy.
Statistical analysis
All results were expressed as the mean ± standard deviation (SD). The data were analyzed by one-way ANOVA using Statgraphics Plus 3.0. The differences among treatments were determined by comparison of means using Tukey test. The level of statistical significance was considered at p<0.05.
Results and discussion
Method validation
Linearity
The calibration was performed using a series of standards with the defined fluoride concentrations: 0.1, 0.3, 1.0, 3.0, 10.0 and 30.0 mg/L. The calibration curve reflects a linear relationship between a fluoride concentration in a standard solution and mV-reading for this standard. The standards were run in triplicates, and the mean values were used for the calibration curve (Fig. 1). The linear regression coefficient R2 was 0.9998.
Fig. 1.
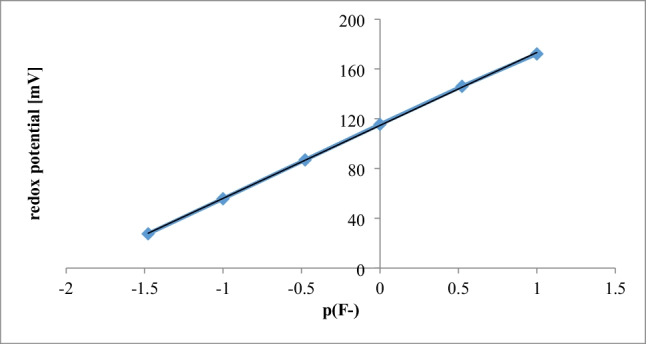
Calibration curve in the range 0 ÷ 30.0 mg/L fluoride in water (n = 3)
Limit of detection (LOD) and limit of quantification (LOQ)
LOD and LOQ were calculated according to the equations, usually applied to ion-selective measurements [51]:
where: SD – standard deviation of the average blank sample (n = 6).
LOQ of our method was 0.005 mg/L and LOQ was 0.0169 mg/L.
Repeatability and reproducibility
To demonstrate precision of fluoride determination in infusions, both intra-day and inter-day precision were assessed. The inter-day precision (repeatability) and intra-day (reproducibility) were evaluated by measuring six fluoride solutions (n = 6) at one concentration level 1.0 mg/L, under the specific experimental conditions. For repeatability, the analysis was conducted in one day by the same analyst and with the same instrument. The repeatability was expressed as the relative standard deviation (RSD) of six replicates (Table 1).
Table 1.
The inter-day and intra-day precisions
| F−concentration | inter-day | intra-day | ||
|---|---|---|---|---|
| 1.0 mg/L |
c* [mg/L] SD [mg/L] RSD recovery n |
0.9931 0.0252 2.53% 99.31% 6 |
c* [mg/L] SD [mg/L] RSD recovery n |
0.9857 0.0197 2.00% 98.70% 18 |
c* – mean fluoride concentration
The intra-day precision was assessed by measuring the same fluoride solutions every day in triplicates for three consecutive days. The reproducibility was expressed by RSD of the average from 18 measurements (Table 1).
Accuracy
Accuracy of the applied analytical method was verified using the CRM material (Certified Reference Material QC3162 Fluoride in Water, Sigma Aldrich) with a certified content of fluoride 0.420 ± 0.0147 mg/L was used. The CRM solutions were prepared in a same way as the samples, i.e. 3 mL of CRM material was mixed with 3 mL of TISAB.
The accuracy was expressed as relative error (%RE). RE indicates the differences between measured value and certified value. The relative error was less than ± 5% in all CRM/TISAB solutions. The results agreed well with the reported certified value of the Certified Reference Material (Table 2).
Table 2.
Results of the CRM measurements
| Day | n | Mean [mg/L] | RSD[%] | RE [%] |
|---|---|---|---|---|
| 1 | 6 | 0.4171 | 2.66 | 2.41 |
| 2 | 3 | 0.4172 | 0.91 | 0.91 |
| 3 | 4 | 0.4114 | 0.98 | 2.04 |
| 4 | 3 | 0.4195 | 2.55 | 1.70 |
| Overall mean | 0.4161 | |||
| Pooled SD | 0.0084 | |||
| Intra SD [%] | 2.01 | |||
| Certified value | 0.420 ± 0.0147 [mg/L] |
n- number of replicate determinations per day
SD- standard deviation of mean
RSD- relative standard deviation
RE – relative error
Matrix effect
To verify the influence of the interferences and possible matrix effect, the recovery was determined by spiking one randomly selected tea sample (one tea bag, Lipton, black) with a standard solution to get the final concentration 1.0 mg/L. The infusion was prepared in the same way as every other sample (the tea bag was placed in a beaker and poured with 200 mL of boiling water). The 3 µL of standard solution (1000 mg/L) was added to 3 mL of sample and mixed with 3 mL of TISAB prior to measurement. The recovery values were calculated by comparing concentrations obtained from the non-spiked samples F− concentration: 6.759 ± 0.143 mg/L with the spiked ones. The recovery was 98.61%, which confirmed that adding a chelating reagent (TISAB buffer containing CDTA) worked efficiently to avoid the matrix interferences.
Teas and herbs analysis
Based on various manufacture and processing techniques, tea can be categorized into black (fermented, the leaves are almost completely subjected to oxidation by peroxidases and polyphenol oxidases), green (non-fermented, only heated and dried), oolong (partially fermented), red, pu-erh (prolong fermented, but traditionally produced from bigger leaves collected from higher and older trees) and white (un-oxidized, slight fermented, collected only from selected young leaves and petals) [30]. We divided our experimental set into 8 groups: the largest one was the group of black teas (10 products: 6 as tea bags and 4 as leaves). The others were: green teas (5), white teas (3), earl grey (3), pu-erh (3), rooibos (2), yerba mate (2). The investigated herbal samples (5) comprised a separate category. Fluoride was detected in the infusions of all tested teas and herbs and values are given in Table 3.
Our study revealed that fluoride content in the infusions made from teas available on the Polish market varies to a large extent (from 0.718 mg/L to 6.029 mg/L). The highest level was obtained for the infusion of black tea, with the mean fluoride concentration reaching 2.651 ± 1.522 mg/L. Two out of ten tested brands of black tea released a substantial amount of fluoride (4.480 and 6.029 mg/L).
The statistical analysis (one way ANOVA) confirmed the significant differences between groups, p<0.05 (Fig. 2).
Fig. 2.
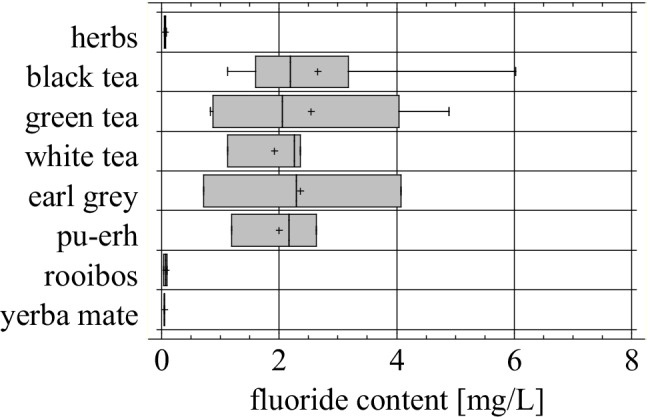
Fluoride content in infusions of tested products (number of products, n = 33), after 5 min of brewing (p = 0.0136)
Our results obtained for black tea infusions after 5 min brewing were comparable with the data presented by other authors, given in Table 4: 0.6–5.5 [49], 1.15–6.01 [52], 1.47–5.45 [53] and 1.057–6.680 mg/L [46]. The fluoride content at the level of 3 mg/L or lower were also often reported: from 0.56 to 3.06 mg/L [50] 0.57–3.72 mg/L [54], 0.32–2.76 [55], 1.38 [56], 0.53–2.60 [57]. On the other hand, the studies conducted earlier in Poland by Kłódka et al. [58] showed significantly lower fluoride concentrations in black tea from 0.121 to 0.652 mg/L.
Table 4.
Comparison of fluoride concentration in tea infusion [mg/L], based on the literature data
| Type of tea | leaves/bags/ stick shape |
F concentration in infusion [mg/L] | No. of samples | Tea [g]: water [mL] ratio | Time of brewing [min] | Ref. |
|---|---|---|---|---|---|---|
| Black | bags | 1.39–3.06 | 3 | 1:100 | 5 | [50] |
| stick shape | 0.56–1.47 | 5 | ||||
| bags | 1.40–2.82 | 11 | tea bag:100 | 5 | [54] | |
| stick shape | 0.57–0.94 | 3 | ||||
| bags | 0.6–5.5 | 54 | tea bag:200 | 5 | [49] | |
| bags | 0.121–0.652 | 5 | 0.1:50 | 6 | [58] | |
| bags | 1.15–6.01 | 25 | 2:200 | 10 | [52] | |
| stick | 0.95–1.45 | 6 | ||||
| bags | 2.03–2.76 | 13 | 2:100 | 5 | [55] | |
| leaves | 0.32–2.26 | 13 | ||||
| bags | 2.29–3.28 | 4 | 10 | |||
| leaves | 0.53–2.49 | 4 | ||||
| lack of data | 0.64–3.55 | 9 | 10:400 | lack of data | [2] | |
| bags | 1.47–5.45 | 8 | 0.5:50 | 5 | [53] | |
| granular | 2.38–3.84 | 7 | ||||
| leaves | 1.38 ± 0.03 | 1 | 1:200 | 5 | [56] | |
| leaves | 2.31 ± 0.05 | 1 | 15 | |||
| lack of data | 0.53–2.60 | 60 | 0.2:50 | 10 | [57] | |
| bags | 1.057–6.680 | 5 | 1:100 | 5 | [46] | |
| Green | bags | 1.40–1.79 | 3 | 1:100 | 5 | [50] |
| stick shape | 0.44–0.92 | 3 | ||||
| bags | 0.164–0.693 | 5 | 0.1:50 | 6 | [58] | |
| leaves | 0.59–1.83 | 10 | 2:100 | 5 | [55] | |
| leaves | 0.88–2.14 | 10 | 10 | |||
| leaves | 0.061–0.746 | 12 | 2:200 | 20 | [19] | |
| bag | 2.43–6.94 | 5 | 0.5:50 | 5 | [53] | |
| leaves | 3.68–5.31 | 4 | ||||
| leaves | 0.18 ± 0.00 | 1 | 1:200 | 5 | [56] | |
| leaves | 0.29 ± 0.01 | 1 | 15 | |||
| bags | 0.2557 ± 0.0542 | 1 | 1:100 | 5 | [46] | |
| leaves | 2.177–4.087 | 4 | ||||
| White | leaves | 0.37–0.54 | 3 | 2:100 | 5 | [55] |
| leaves | 0.47–0.59 | 3 | 10 | |||
| leaves | 5.39 | 1 | 0.5:50 | 5 | [53] | |
| leaves | 1.07 ± 0.03 | 1 | 1:200 | 5 | [56] | |
| leaves | 1.57 ± 0.05 | 1 | 15 | |||
| Earl grey | bags | 1.33–3.72 | 6 | tea bag:100 | 5 | [54] |
| stick | 1.41 | 1 | ||||
| bags | 2.49–3.55 | 3 | 1:100 | 5 | [50] | |
| leaves | 1.22–2.62 | 2 | 2:100 | 5 | [55] | |
| leaves | 1.44–3.03 | 2 | 10 | |||
| Pu-erh | bags | 0.55 ± 0.02 | 1 | 1:100 | 5 | [50] |
| stick shape | 0.33 ± 0.02 | 1 | ||||
| bags | 0.43–0.92 | 3 | 2:100 | 5 | [55] | |
| leaves | 0.39 | 1 | ||||
| bags | 0.57–1.04 | 3 | 10 | |||
| leaves | 0.64 | 1 | ||||
| leaves | 2.87 | 1 | 0.5:50 | 5 | [53] | |
| granular | 4.09–4.96 | 2 | ||||
| lack of data | 0.34–0.690 | 20 | 1:50 | 5 | [59] | |
| Rooibos | herbs | 0.04–0.06 | 2 | 2:100 | 5 | [55] |
| bags | 0.02–0.03 | 2 | ||||
| herbs | 0.05–0.08 | 2 | 10 | |||
| bags | 0.04–0.05 | 2 | ||||
| Yerba mate | leaves | 0.03–0.09 | 2 | 2:100 | 5 | [55] |
| leaves | 0.03–0.10 | 2 | 10 | |||
| Chamomile | bags | 0.03 | 1 | tea bag:100 | 5 | [54] |
| bags | 0.03 | 1 | 10 | |||
| lack of data | 1.12 | 1 | 1:80 | 5–30* | [60] | |
| bag | 0.1450 ± 0.0026 | 1 | 1:100 | 5 | [46] | |
| Peppermint | bag | 0.1707 ± 0.0091 | 1 | 1:100 | 5 | [46] |
| bags | 0.03 | 1 | tea bag:100 | 5 | [54] | |
| bags | 0.03 | 1 | 10 | |||
| Nettle | bags | 0.02 | 1 | tea bag:100 | 5 | [54] |
| bags | 0.03 | 1 | 10 | |||
| Mint (domestic) | lack of data | 0.18 | 1 | 1:80 | 5–30* | [60] |
| Mint (wild) | leaves | 12.00 | 1 | 5–30* | ||
| Mint | leaves | 0.002–0.016 | 15 | 2:200 | 20 | [19] |
*time of brewing according to the manufacturer’s manual for tea preparing
Among the samples of black tea aromatized with bergamot (‘earl grey tea’) the significant amounts of fluoride were extracted, similarly to the black tea samples (Fig. 2). These concentrations were very close to () the values found for non-flavored, “pure” black tea samples (2.359 ± 1.67 mg/L and 2.651 ± 1.52 mg/L, respectively). It seems that an addition of oil from the rind of bergamot oranges (Citrus bergamia) had no influence on fluoride extraction, however the number of samples may be not sufficient to make a viable conclusion. Our highest determined value (4.070 ± 0.054 mg F−/L) corresponds with the results found in the literature for earl grey teas: 3.72 mg/L [54] and 3.55 mg/L [50] (Table 4).
The form of tea used for brewing is also meaningful. Our studies showed that significantly higher fluoride contents were measured in black tea infusions made from tea bags than from leaves (Fig. 3.).
Fig. 3.
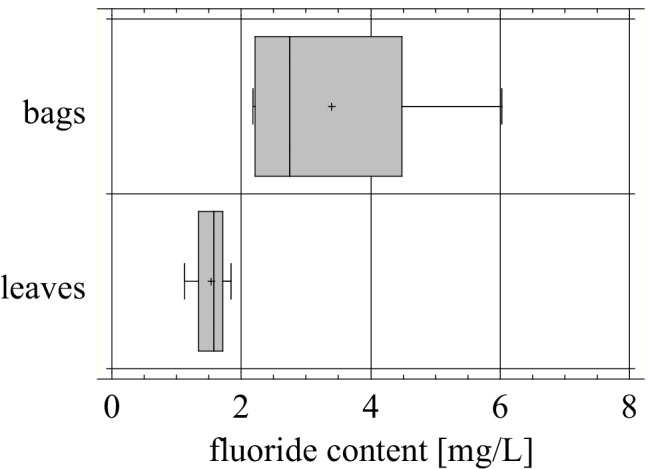
Fluoride content in infusions of black teas: bags (n = 6, mean = 3.398 mg/L) and leaves (n = 4, mean = 1.529 mg/L, p = 0.0489)
The earlier reports indicated that uptake and accumulation of fluoride in tea leaves increased in time, younger leaves are designated for a production of high-quality tea, while the older ones, richer in fluoride, are used for a cheaper version of the product, such as tea bags, express, bricks or granulated tea [20]. According to Cao et al. [14] brick tea infusions are responsible for adult fluorosis in Tibet irrespective to the fluoride level in drinking water. The similar regularity was also observed in China [61]. Malinowska et al. [55] suggested the use a concentration of fluoride in tea infusion as an indicator/marker of a tea quality. The leaves harvested in early summer are superior in quality to older ones, collected in later seasons, which would be reflected as less fluoride in the infusions. However, more studies should be done to confirm it, particularly in order to compare tea bags and tea leaves, since extraction of fluoride from these two proceed differently. Also the level of fragmentation/fineness can influence the rate of fluoride release from tea material.
An average fluoride concentration in the infusion of the green tea samples was 2.537 ± 1.853 mg/L which was similar to the black tea samples. Only two green tea infusions appeared richer with fluoride, even up to 4.041 and 4.893 mg/L. The average is higher than the results for green tea published by Malinowska et al. [55] ranging from 0.59 to 1.83 mg/L, and by Koblar et al. [50] which were in the range from 0.44 to 1.79 mg/L. Low levels of fluoride in green teas were also reported by other authors [19, 56, 58]. Out of the five samples analyzed in our studies, only two showed a fluoride concentration consisted with a general concept of producing green tea from a bud and two young leaves which are supposed to contain less fluoride than aged leaves. The elevated fluoride concentrations in green teas reported here would require further investigations, as it might be related to a low quality of green teas present on the global market or – again – with the form of tea used here (tea bags, not leaves). However, there are available data about fluoride concentration similar to our results: 0.2557–4.087 in Japanese green teas [46] or even higher: 2.43–6.94 mg/L in Chinese and American teas [53] (Table 4).
More delicate and younger tea leaves are used for production of white tea; this has been reflected in the 2–3 fold-decreased fluoride concentration; the mean value for the white tea samples was 1.913 ± 0.687 mg/L. In the literature data on the white tea, a low F− level is reported, such as 0.37–0.54 [55] and 1.07 mg/L [56], but there is also one, particularly high content of 5.39 mg/L [53], which is closer to the one in a black tea infusion.
In the case of pu-erh (so-called red tea), our results were similar to white tea varying between 1.186 and 2.634 mg/L, with the mean value 1.996 ± 0.739 mg/L (Table 3). Other authors presented a comparable fluoride content in infusion from pu-erh leaves, i.e. 2.87 mg/L, or even higher (from pu-erh in granular form) i.e. 4.09–4.96 mg/L [53], but there were also lower values (Table 4) [50, 55, 59].
Herbal infusions, in comparison to traditional black or green teas, contained almost negligible amounts of fluoride, with a mean value 0.0572 mg/L for all studied herbs, ranging from 0.043 ± 0.002 mg/L (chamomile) to 0.077 ± 0.001 mg/L (mint). The values reported by other authors about chamomile, nettle and mint at the level 0.016–0.03 mg/L (Table 4) [19, 54] are consistent with our results (Table 3). In the other studies, the values were not always comparable, from 0.145 mg/L for chamomile and 0.170 mg/L for peppermint [46], 0.18 mg/L for domestic mint, 1.12 mg/L for chamomile and extremely high, 12.00 mg/L for wild mint [60].
Additionally, it is worth noting that there is absolutely no available data on herbs as common as yarrow (Achillea millefolium) and purges (Cistus incanus).
Comparing rooibos infusions (from 0.038 to 0.090 mg/L) and yerba mate (from 0.041 to 0.045 mg/L) we observed a similarly low level of fluoride. These results are consistent with the literature data [55], although the publications related to the fluoride content in infusion of rooibos and yerba mate are rather sparse. It appears, that only the ‘original tea plant’ (Camellia sinensis L.) has truly selective possibility to accumulate fluoride. The two above-mentioned popular beverages, despite being called “tea”, are not produced from the tea plant (Camellia sinensis L.), but from other species (rooibos – Aspalathus linearis, yerba mate – Ilex paraguariensis).
Influence of brewing time
Brewing time of 5 min is most often recommended by tea manufacturers and this time span was selected as the first variant in our studies, although tea consumers usually do not strictly respect the time of brewing, which may result in elution of additional quantities of fluoride. The second brewing time used in our experiments was 15 min. After the prolonged time of brewing the same tendency of fluoride concentrations in the tested groups of tea was observed, and the differences between various types of tea were statistically significant (Fig. 4).
Fig. 4.
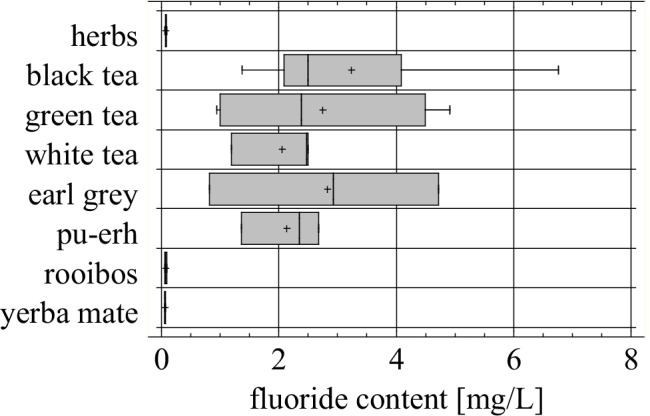
Fluoride content in infusions of the tested products (number of products n = 33), after 15 min of brewing (p = 0.0091)
Prolonging the brewing time from five to fifteen minutes increased the fluoride extraction from black tea by 12 to even 36% (Fig. 5.). A similar observation was reported by other researches (Table 4) [55, 56]. In the case of green and white tea, the fluoride concentration was also elevated, but not that much, i.e. by 0.3 to 15.8% and by 5.7–9.6%, respectively. The highest growth was observed at the lowest concentration level, meaning in herbal, rooibos and yerba mate infusions.
Fig. 5.
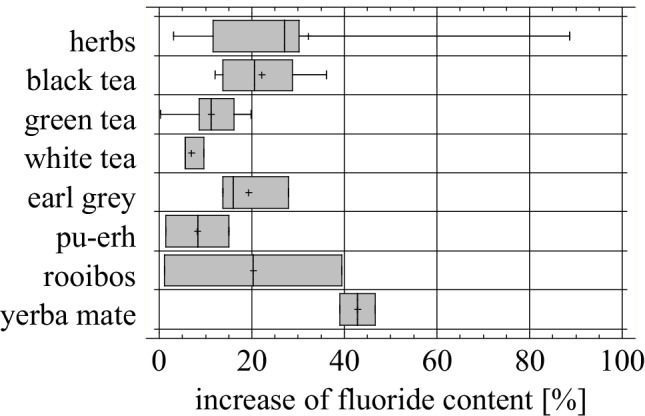
Percentage increase in fluoride content after additional 10 min of brewing
The longer brewing time of herbs also led to increasing a concentration of fluoride, although it remained (as before) very low, comparing to the original tea products. The level of fluoride in the herbal infusions remained lower than in the tea extracts by about two orders of magnitude (Table 3), despite the time of brewing.
In our studies, after 5 min of brewing, the highest fluoride concentration was observed in the infusions of mint leaves, and it was increasing by about 11% after additional 10 min. The other herbs reacted nearly the same way (nettle and chamomile by 27% and 30%, respectively), except for purges, where almost a double increase of fluoride concentration in herbal was determined. The infusions of yarrow kept steady concentrations of fluoride, both during 5 and 15 min of brewing. Emekli-Alturfan and co-workers [54] confirmed the increase of fluoride concentration only in case of nettle, from 0.02 to 0.03 mg/L. The other studied herbs (chamomile and peppermint) did not show such a trend and the fluoride level was stable. It must be emphasized though, that the fluoride contents in the herb infusions are so extremely low, that increasing the brewing time will not make the beverages dangerous for human health.
According to WHO, the optimum fluoride intake for humans should range from 2 to 4 mg/day [3]. The level recommended by US EPA is similar, from 2.5 to 4 mg F−/day for children and adults, respectively [62]. This amount of fluoride can be covered by about 2–3 cups (ca. 400–600 mL) daily of a popular black tea with F− concentration about 6 mg/L, even after 15-minute brewing, but without taking into account other sources of fluoride (e.g. toothpaste etc.).
Conclusions
Infusions made from plants (different types of tea, tea-like products and herbs), which are capable to accumulate fluoride, may constitute an important source of this element supplied for a human body and it can be considered as an substantial part of a healthy diet. Infusions of herbal products, as well as rooibos and yerba mate contain almost negligible concentrations of fluoride, contrary to the products prepared out of the tea plant (Camellia sinensis L.), which is proved to be a “specific fluoride accumulator”. All the tested tea infusions (of black, green, white and red tea) contain substantial amounts of fluoride. It was related to the type/form of tea or the way of fermentation. Our results showed the general rank with respect to the fluoride concentration in an infusion:
black tea > green tea > earl grey > pu-erh > white tea>>>rooibos, yerba mate, herbal products
Moreover, the longer the brewing time, the higher the concentration is observed in the infusion, particularly of black tea, rising from 12 to 36%. It must be emphasized that the amount of fluoride in the analyzed infusions of teas and herbs was not high enough to cause a risk of fluorosis, even if left to brew up to 15 min. Nevertheless, a fluoride intake from teas and herbs consumed regularly should be taken into account in view of the potential health effects, both positive and negative, especially for children, and pregnant women who often choose plant infusions as healthier replacement of coffee. Above all, in the total fluoride balance, it is necessary to take into account the fluoride content in water used for brewing, which may be significant and variable depending on the country and other sources of fluoride.
Although the confirmed levels were not alarmingly high, due to constantly changing environment and the methods of cultivation of tea and other herbal plants used for the preparation of daily consumed infusions, the awareness of harm obligate to a constant monitoring of the fluoride content. Similarly to the publications related to tea consumption in other societies (considered as “heavy tea drinkers”) it is emergent to verify if this process can be considered as a health risk or not. Our experiments revealed that even with a highly fluoride-enriched tea infusion or longer than necessary tea brewing, fluoride exposure is negligible for Polish society. Moreover, in our screening we added the most popular herbs, which are prepared such as tea infusion and willingly consumed. The fluoride level appeared insignificant for health risk assessment, which gives an opportunity in the future to look for tea replacement (particularly now, when the world-wide pandemic can compromise trade exchange across the world).
Acknowledgements
The authors gratefully acknowledge the use of the services and facilities of The John Paul II Catholic University of Lublin, Lublin, Poland, co-funded by the European Union from the European Regional Development Fund in the frame of the Operational Programme Development of Eastern Poland 2007–2013 (POPW.01.03.00-06-003/09 − 00).
Author contributions
The first author named is lead and corresponding author. We describe contributions to the paper using the taxonomy provided above. Conceptualization: A.S. and E.A.S.; Methodology: A.S.; Validation: A.S. and A.K.; Formal Analysis: A.S. and A.K.; Investigation: A.S. and A.K.; Resources: A.S.; Writing – Original Draft: A.S. and A.K.; Writing – Review & Editing: A.S., A.K. and E.A.S.
Declarations
Disclaimer
The reported names of tea and herbal brands were used only to presenting the values and cannot be used to introduce customers to buy a given product. None of measured values pose threat to public health. The study does not provide any health-based arguments for buying specific brand of product.
Conflict of interest
The authors declare that they have no conflict of interest.
Footnotes
Publisher’s Note
Springer Nature remains neutral with regard to jurisdictional claims in published maps and institutional affiliations.
Contributor Information
Agnieszka Szmagara, Email: szmagara@kul.pl.
Agnieszka Krzyszczak, Email: agnieszka.krzyszczak@kul.pl.
Elżbieta Anna Stefaniak, Email: elzbieta.stefaniak@kul.pl.
References
- 1.Zhang M, Wang A, Xia T, He P. Effects of fluoride on DNA damage, S-phase cell-cycle arrest and the expression of NF-kappaB in primary cultured rat hippocampal neurons. Toxicol Lett. 2008;179:1–5. doi: 10.1016/j.toxlet.2008.03.002. [DOI] [PubMed] [Google Scholar]
- 2.Tokalioglu S, Kartal S, Şahin U. Determination of fluoride in various samples and some infusions using a fluoride selective electrode. Turk J Chem. 2004;28:203–11. [Google Scholar]
- 3.WHO. Guidelines for drinking-water quality, 4th edition, incorporating the 1st addendum 2017. World Health Organization. Geneva. [Internet]. [cited 2021 Apr 29]. Available from: https://www.who.int/publications-detail-redirect/9789241549950.
- 4.Yousefi M, Kazemi Moghaddam V, Nasab S, Nabizadeh R, Hadei M, Zarei A, et al. Northwest of Iran as an endemic area in terms of fluoride contamination: a case study on the correlation of fluoride concentration with physicochemical characteristics of groundwater sources in Showt. Desalination Water Treat. 2019;155:183–9. [Google Scholar]
- 5.Mohammadi AA, Yousefi M, Mahvi AH. Fluoride concentration level in rural area in Poldasht city and daily fluoride intake based on drinking water consumption with temperature. Data Brief. 2017;13:312–5. doi: 10.1016/j.dib.2017.05.045. [DOI] [PMC free article] [PubMed] [Google Scholar]
- 6.Yousefi M, Ghalehaskar S, Asghari FB, Ghaderpoury A, Dehghani MH, Ghaderpoori M, et al. Distribution of fluoride contamination in drinking water resources and health risk assessment using geographic information system, northwest Iran. Regul Toxicol Pharmacol. 2019;107:104408. doi: 10.1016/j.yrtph.2019.104408. [DOI] [PubMed] [Google Scholar]
- 7.Mirzabeygi (Rad Fard) Yousefi M, Soleimani M, Mohammadi H, Mahvi AA, Abbasnia AH. The concentration data of fluoride and health risk assessment in drinking water in the Ardakan city of Yazd province, Iran. Data Brief. 2018;18:40–6. doi: 10.1016/j.dib.2018.02.069. [DOI] [PMC free article] [PubMed] [Google Scholar]
- 8.Bhatnagar A, Kumar E, Sillanpää M. Fluoride removal from water by adsorption—A review. Chem Eng J. 2011;171:811–40. [Google Scholar]
- 9.Vinati A, Mahanty B, Behera SK. Clay and clay minerals for fluoride removal from water: A state-of-the-art review. Appl Clay Sci. 2015;114:340–8. [Google Scholar]
- 10.Pehrsson PR, Patterson KY, Perry CR. The fluoride content of select brewed and microwave-brewed black teas in the United States. J Food Compos Anal. 2011;24:971–5. [Google Scholar]
- 11.Malin AJ, Till C. Exposure to fluoridated water and attention deficit hyperactivity disorder prevalence among children and adolescents in the United States: an ecological association. Environ Health. 2015;14:17. doi: 10.1186/s12940-015-0003-1. [DOI] [PMC free article] [PubMed] [Google Scholar]
- 12.Opydo-Szymaczek J, Opydo J. Fluoride content of beverages intended for infants and young children in Poland. Food Chem Toxicol. 2010;48:2702–6. doi: 10.1016/j.fct.2010.06.043. [DOI] [PubMed] [Google Scholar]
- 13.Yi J, Cao J. Tea and fluorosis. J Fluorine Chem. 2008;129:76–81. [Google Scholar]
- 14.Cao J, Zhao Y, Liu J, Xirao R, Danzeng S, Daji D, et al. Brick tea fluoride as a main source of adult fluorosis. Food Chem Toxicol. 2003;41:535–42. doi: 10.1016/s0278-6915(02)00285-5. [DOI] [PubMed] [Google Scholar]
- 15.Yousefi M, Yaseri M, Nabizadeh R, Hooshmand E, Jalilzadeh M, Mahvi AH, et al. Association of Hypertension, Body Mass Index, and Waist Circumference with Fluoride Intake; Water Drinking in Residents of Fluoride Endemic Areas, Iran. Biol Trace Elem Res. 2018;185:282–8. doi: 10.1007/s12011-018-1269-2. [DOI] [PubMed] [Google Scholar]
- 16.Yousefi M, Mohammadi AA, Yaseri M, Mahvi AH. Epidemiology of drinking water fluoride. and its contribution to fertility, infertility, and abortion: an ecological study in West Azerbaijan Province, Poldasht County, Iran. Fluoride. 2017;50(3)343–53.
- 17.Moghaddam VK, Yousefi M, Khosravi A, Yaseri M, Mahvi AH, Hadei M, et al. High concentration of fluoride can be increased risk of abortion. Biol Trace Elem Res. 2018;185:262–5. doi: 10.1007/s12011-018-1250-0. [DOI] [PubMed] [Google Scholar]
- 18.Karak T, Bhagat RM. Trace elements in tea leaves, made tea and tea infusion: A review. Food Res Int. 2010;43:2234–52. [Google Scholar]
- 19.Giljanović J, Prkić A, Bralić M, Brkljača M. Determination of fluoride content in tea infusion by using fluoride ion-selective electrode. Int J Electrochem Sci. 2012;2918–27.
- 20.Wong MH, Fung KF, Carr HP. Aluminium and fluoride contents of tea, with emphasis on brick tea and their health implications. Toxicol Lett. 2003;137:111–20. doi: 10.1016/s0378-4274(02)00385-5. [DOI] [PubMed] [Google Scholar]
- 21.Chen L, ShangGuan L, Wu Y, Xu L, Fu F. Study on the residue and degradation of fluorine-containing pesticides in Oolong tea by using gas chromatography–mass spectrometry. Food Control. 2012;25:433–40. [Google Scholar]
- 22.Cai H, Zhu X, Peng C, Xu W, Li D, Wang Y, et al. Critical factors determining fluoride concentration in tea leaves produced from Anhui province, China. Ecotoxicol Environ Saf. 2016;131:14–21. doi: 10.1016/j.ecoenv.2016.04.023. [DOI] [PubMed] [Google Scholar]
- 23.Gao H, Zhao Q, Zhang X, Wan X, Mao J. Localization of fluoride and aluminum in subcellular fractions of tea leaves and roots. J Agric Food Chem. 2014;62(10):2313–9. [DOI] [PubMed]
- 24.Karami MA, Fakhri Y, Rezania S, Alinejad AA, Mohammadi AA, Yousefi M, et al. Non-carcinogenic health risk assessment due to fluoride exposure from tea consumption in Iran using Monte Carlo simulation. Int J Environ Res Public Health. Multidisciplinary Digital Publishing Institute; 2019;16:4261. [DOI] [PMC free article] [PubMed]
- 25.Fung KF, Zhang ZQ, Wong JWC, Wong MH. Fluoride contents in tea and soil from tea plantations and the release of fluoride into tea liquor during infusion. Environ Pollut. 1999;104:197–205. [Google Scholar]
- 26.Cao H. Polysaccharides from Chinese tea: recent advance on bioactivity and function. Int J Biol Macromol. 2013;62:76–9. doi: 10.1016/j.ijbiomac.2013.08.033. [DOI] [PubMed] [Google Scholar]
- 27.IGG TEA.23 | Food and Agriculture Organization of the United. Nations 17–20 May 2018, Hangzhou, China [Internet]. [cited 2021 May 6]. Available from: http://www.fao.org/ccp/tea23/en/.
- 28.Yearbook Trade of Foreign Statistics of Poland., Statistics Poland; Warsaw, 2020, pp.278. ISSN 0079–2691.
- 29.Chung F-L, Schwartz J, Herzog C, Yang Y-M. Tea and cancer prevention: studies in animals and humans. J Nutr. 2003;133:3268S–3274S. doi: 10.1093/jn/133.10.3268S. [DOI] [PubMed] [Google Scholar]
- 30.Chen G, Yuan Q, Saeeduddin M, Ou S, Zeng X, Ye H. Recent advances in tea polysaccharides: Extraction, purification, physicochemical characterization and bioactivities. Carbohydr Polym. 2016;153:663–78. doi: 10.1016/j.carbpol.2016.08.022. [DOI] [PubMed] [Google Scholar]
- 31.Sofuoglu SC, Kavcar P. An exposure and risk assessment for fluoride and trace metals in black tea. J Hazard Mater. 2008;158:392–400. doi: 10.1016/j.jhazmat.2008.01.086. [DOI] [PubMed] [Google Scholar]
- 32.Zhang L, Zhang J, Chen L, Liu T, Ma G, Liu X. Influence of manufacturing process on the contents of iron, copper, chromium, nickel and manganese elements in Crush, Tear and Curl black tea, their transfer rates and health risk assessment. Food Control. 2018;89:241–9. [Google Scholar]
- 33.Schulzki G, Nüßlein B, Sievers H. Transition rates of selected metals determined in various types of teas (Camellia sinensis L. Kuntze) and herbal/fruit infusions. Food Chem. 2017;215:22–30. doi: 10.1016/j.foodchem.2016.07.093. [DOI] [PubMed] [Google Scholar]
- 34.Mannani N, Tabarani A, Abdennebi EH, Zinedine A. Assessment of aflatoxin levels in herbal green tea available on the Moroccan market. Food Control. 2020;108:106882. [Google Scholar]
- 35.Yang Y, Peng C, Thompson HJ, Wang Y. Assuring that your cup of tea is risk-free. Curr Opin Food Sci. 2019;30:98–102. [Google Scholar]
- 36.Li X, Zhang Z, Li P, Zhang Q, Zhang W, Ding X. Determination for major chemical contaminants in tea (Camellia sinensis) matrices: A review. Food Res Int. 2013;53:649–58. [Google Scholar]
- 37.Canbay HS, Doğantürk M, Yilmaz Y. Acrylamide content of Turkish black tea, instant and Turkish coffee samples. Süleyman Demirel Üniversitesi Fen Bilimleri Enstitüsü Dergisi. 2019;23:245–50. [Google Scholar]
- 38.Cladière M, Delaporte G, Le Roux E, Camel V. Multi-class analysis for simultaneous determination of pesticides, mycotoxins, process-induced toxicants and packaging contaminants in tea. Food Chem. 2018;242:113–21. doi: 10.1016/j.foodchem.2017.08.108. [DOI] [PubMed] [Google Scholar]
- 39.Garcia Londoño VA, Reynoso CM, Resnik SL. Polycyclic aromatic hydrocarbons (PAHs) survey on tea (Camellia sinensis) commercialized in Argentina. Food Control. 2015;50:31–7. [Google Scholar]
- 40.Shao L, Xu S, Wang G, Yang L, Li R, Zhu J, et al. Fluoride in tea from Shandong Province, China and exposure assessment. Food Addit Contam Part B Surveill. 2020;13:77–81. doi: 10.1080/19393210.2019.1710267. [DOI] [PubMed] [Google Scholar]
- 41.Krishnankutty N, Storgaard Jensen T, Kjær J, Jørgensen JS, Nielsen F, Grandjean P. Public-health risks from tea drinking: Fluoride exposure. Scand J Public Health. 2022;50(3):355–61. [DOI] [PMC free article] [PubMed]
- 42.Miri M, Bhatnagar A, Mahdavi Y, Basiri L, Nakhaei A, Khosravi R, et al. Probabilistic risk assessment of exposure to fluoride in most consumed brands of tea in the Middle East. Food Chem Toxicol. 2018;115:267–72. doi: 10.1016/j.fct.2018.03.023. [DOI] [PubMed] [Google Scholar]
- 43.Maleki A, Daraei H, Mohammadi E, Zand S, Teymouri P, Mahvi A, et al. Daily fluoride intake from Iranian Green Tea: Evaluation of various flavorings on fluoride release. Environ Health Insights. 2016;10:59–63. doi: 10.4137/EHI.S38511. [DOI] [PMC free article] [PubMed] [Google Scholar]
- 44.Chan L, Mehra A, Saikat S, Lynch P. Human exposure assessment of fluoride from tea (Camellia sinensis L.): A UK based issue? Food Res Int. 2013;51:564–70. [Google Scholar]
- 45.Ruxton CHS, Bond TJ. Fluoride content of retail tea bags and estimates of daily fluoride consumption from typical tea drinking in UK adults and children. Nutr Bull. 2015;40:268–78. [Google Scholar]
- 46.Satou R, Oka S, Sugihara N. Risk assessment of fluoride daily intake from preference beverage. J Dent Sci. 2021;16:220–8. doi: 10.1016/j.jds.2020.05.023. [DOI] [PMC free article] [PubMed] [Google Scholar]
- 47.Waugh DT, Godfrey M, Limeback H, Potter W. Black tea source, production, and consumption: assessment of health risks of fluoride intake in New Zealand. J Environ Public Health. 2017;2017:5120504. doi: 10.1155/2017/5120504. [DOI] [PMC free article] [PubMed] [Google Scholar]
- 48.Chandrajith R, Bhagya S, Diyabalanage S, Wimalasiri S, Ranatunga MAB, Barth JAC. Exposure assessment of fluoride intake through commercially available black tea (Camellia sinensis L.) from areas with high incidences of Chronic Kidney Disease with Undetermined Origin (CKDu) in Sri Lanka. Biol Trace Elem Res. 2022;200(2):526–34. [DOI] [PubMed]
- 49.Waugh DT, Potter W, Limeback H, Godfrey M. Risk assessment of fluoride intake from tea in the republic of Ireland and its implications for public health and water fluoridation. Int J Environ Res Public Health. Multidisciplinary Digital Publishing Institute; 2016;13:259. [DOI] [PMC free article] [PubMed]
- 50.Koblar A, Tavčar G, Ponikvar-Svet M. Fluoride in teas of different types and forms and the exposure of humans to fluoride with tea and diet. Food Chem. 2012;130:286–90. [Google Scholar]
- 51.Kjellevold Malde M, Bjorvatn K, Julshamn K. Determination of fluoride in food by the use of alkali fusion and fluoride ion-selective electrode. Food Chem. 2001;73:373–9. [Google Scholar]
- 52.Cao J, Zhao Y, Li Y, Deng HJ, Yi J, Liu JW. Fluoride levels in various black tea commodities: Measurement and safety evaluation. Food Chem Toxicol. 2006;44:1131–7. doi: 10.1016/j.fct.2006.01.010. [DOI] [PubMed] [Google Scholar]
- 53.Das S, de Oliveira LM, da Silva E, Liu Y, Ma LQ. Fluoride concentrations in traditional and herbal teas: Health risk assessment. Environ Pollut. 2017;231:779–84. doi: 10.1016/j.envpol.2017.08.083. [DOI] [PubMed] [Google Scholar]
- 54.Emekli-Alturfan E, Yarat A, Akyuz S. Fluoride levels in various black tea, herbal and fruit infusions consumed in Turkey. Food Chem Toxicol. 2009;47:1495–8. doi: 10.1016/j.fct.2009.03.036. [DOI] [PubMed] [Google Scholar]
- 55.Malinowska E, Inkielewicz I, Czarnowski W, Szefer P. Assessment of fluoride concentration and daily intake by human from tea and herbal infusions. Food Chem Toxicol. 2008;46:1055–61. doi: 10.1016/j.fct.2007.10.039. [DOI] [PubMed] [Google Scholar]
- 56.Esfehani M, Ghasemzadeh S, Mirzadeh M. Comparison of fluoride ion concentration in black, green and white tea. Int J Ayurvedic Med. 2018;9:263–5. [Google Scholar]
- 57.Mahvi AH, Zazoli MA, Younecian M, Esfandiari Y. Fluoride content of Iranian black tea and tea liquor. Fluoride. 2006;39(4):266–8.
- 58.Kłódka D, Telesiński A, Bońkowski M. Estimating the dependence between the content of fluorine and of selectived vitamins in different kinds of tea infusions. Bromatol Chem Toksykol. 2008;XLI:957–63. [Google Scholar]
- 59.Lv H-P, Lin Z, Tan J-F, Guo L. Contents of fluoride, lead, copper, chromium, arsenic and cadmium in Chinese Pu-erh tea. Food Res Int. 2013;53:938–44. [Google Scholar]
- 60.Rajković MB, Novaković ID. Determination of fluoride content in drinking water and tea infusions using fluoride ion selective electrode. J Agric Sci Belgrade. 2007;52:155–68. [Google Scholar]
- 61.Li H, Liu Q, Wang W, Yang L, Li Y, Feng F, et al. Fluoride in drinking water, brick tea infusion and human urine in two counties in Inner Mongolia, China. J Hazard Mater. 2009;167:892–5. doi: 10.1016/j.jhazmat.2009.01.094. [DOI] [PubMed] [Google Scholar]
- 62.US EPA. National primary drinking water regulations; Announcement of the results of EPA’s review of existing drinking water standards and request for public comment and/or information on related issues [Internet]. Federal Register. 2017 [cited 2021 May 6]. Available from: https://www.federalregister.gov/documents/2017/01/11/2016-31262/national-primary-drinking-water-regulations-announcement-of-the-results-of-epas-review-of-existing.