

Abstract
In this work, the amount and physical and chemical characteristics of airborne microplastics (MPs) pollution in dust samples in Sistan, located in the eastern part of Iran, is reported. Sampling stations were selected according to the wind direction and population density. MPs were collected by a static dust sampler and analyzed by optical microscopy and FT-IR spectroscopy. Results showed that the distribution frequency of MPs in residential and non-residential areas was 6 to 11 pieces per 100 g (pcs/100 g) with an average abundance of 9.8 pcs/100 g. Fragmented MPs were approximately consisted 64% of total MPs and their sizes were in the range of 0.9–3.8 mm. Polyethylene (49%), polystyrene (21%) and polyester (18%) were the main MPs presented in the dust samples. It was observed that population density and wind direction were the most important parameters affecting MPs pollution in dust.
Supplementary Information
The online version contains supplementary material available at 10.1007/s40201-022-00833-y.
Keywords: Microplastics, Dust, Air pollution, Polyethylene, Polystyrene, Polyester
Introduction
About 5 Gt of plastic waste is accumulated in the environment. Due to weathering, physical abrasion, exposure to sunlight, or biological degradation, they fragment to smaller particles, partly into dangerous microplastics (MPs). MPs have been detected all over the world, from the air to deep sea sediments, from arctic sea ice to all ecosystems. On the other hand, the wide range of synthetic polymers with different chemical structures (aliphatic, aromatic, with or without functional groups) and with different compositions (blends, copolymers, etc.) as well as possible contained additives and verity in shape and size pose excessive health issues [1]. MPs are small plastic debris, which often have a range of several millimeters, mostly less than 5 mm [2–4]. Due to their small size, they cause damage to the environmental and life ecosystems in several ways. MPs can easily pass through water filtration systems and enter into the environmental aquatics and finally can eventually enter into the food chain [5]. In addition, contaminant and pollutant spices can be accumulated on their surface which can be moved by them in the ecosystems [6]. If present in air, MPs can enter the respiratory system and change the shape of human lung cells and slow down their metabolism [7, 8].
It has become clear that the residential areas can be considered as a potential source for production of MPs [9]. It has been shown that MPs can be easily transported by wind and hydrological cycles in deserts [10], remote areas [11], mountains [12] and beaches [13].
Sistan is a hot and dry region in the eastern border of Iran with an average annual rainfall of less than 60 mm, located in geographic coordinates of 30 degrees and 8 min north latitude, and 61 degrees and 50 min east longitude. This area is located near the Lut desert and has five cities with a maximum distance of 50 km from each other [14]. These cities are Zabol, Zahak, Hirmand, Hamoon and Nimrooz with a population of 170, 80, 70, 41 and 48 thousand people, respectively. In the last twenty years, due to drought, Hamun Lake, the largest freshwater lake of Iran, located in Sistan, became completely dry, casing a vast increase of air pollutants in this region. As a result, Sistan cities are always exposed to dust storms with speeds up to 100 Km/h. Moreover, famous 120-day winds play an important role in increasing and spreading dust and pollutants in the area. Direction of these winds are from northwest to southeast and are dominated in all cities of Sistan. In 2016, Zabol was introduced as the most polluted city in the world, the main reason being the constant blowing winds on Sistan [15].
Recent studies [16, 17] proved the presence of toxic metals, sulfate, phosphate, calcium, sodium and chloride in the airborne dust of Sistan but no study has ever been performed on the presence of MPs in dust samples in this region. In fact, while extensive studies on the existence of MPs in different ecosystems; e.g., deep sea [18], ocean [19], and polar regions [20] have been performed, Only limited studies focused on determination of MPs in the atmosphere. In this study, for the first time, MPs were determined in the airborne dust samples, and transportation of these pollutants by wind were surveyed. To obtain an overall estimate, samples were collected from all five cities of Sistan and several selected sampling sites outside of them.
Materials and methods
Chemicals and instruments
All chemicals were of analytical grade and were used as received. Hydrogen peroxide (H2O2) and zinc chloride (ZnCl2) were purchased from Merck KGaA, Darmstadt, Germany. Steel sieve (mesh 5, 5 mm, 10 cm diameter) was obtained from Whatman (Whatman, USA). Fourier-transformed infrared (FT-IR) spectroscopy spectra were recorded using a Perkin-Elmer Spectrum-FTIR Version 10.01.00 (Perkin-Elmer, USA). A binocular optical microscope (Motic, Spain) with 40x magnification was used for examining MPs.
Sampling
For dust sampling, Sistan region was divided into 5 different areas. In each area, according to the geographical location and population density, sampling stations were set up in areas inside and outside of the cities. Totally 15 sampling stations were selected. Figure 1 shows the sampling area and population density of the selected geographical region. No plastic containers were used in any of the sampling, shipping to laboratory and analysis of MPs. In residential areas (10 sampling stations), a passive method was applied for sampling of MPs in a metallic vessel with a volume of 245 L (70 × 70 × 50 cm3) that has an inlet window with dimension of 50 × 50 cm. Containers were located at 6 m height from the ground. Sampling was performed during the evenings between June to September 2021. The sampler was exposed to the dust storm for at least two hours. Out of the cities, samples were taken from dune [12, 21].
Fig. 1.
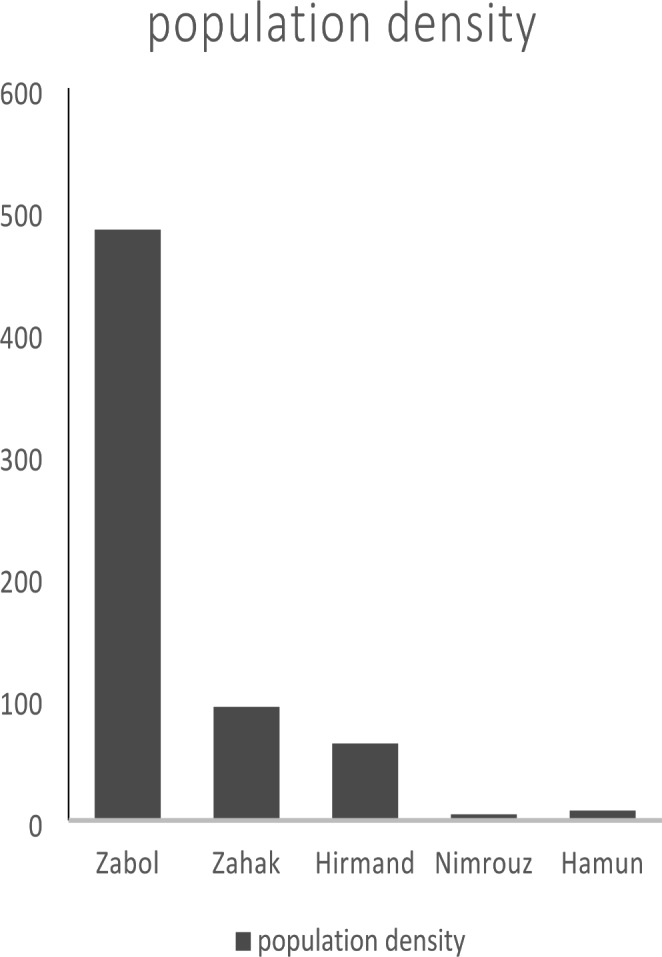
Geographic location and population density of studied area and sampling stations
Sample preparation
Collected dust samples were sieved using a steel sieve. For decomposition of organic residues, sieved samples were exposed to hydrogen peroxide for 8 days. After that, samples were washed with double distilled water for removing excess of H2O2. After drying of digested samples, a floatation procedure was performed for MPs separation using a saturated solution of ZnCl2. For this purpose, 100 g of dust was mixed with ZnCl2 solution in a 1000 mL beaker and stirred for 24 h. After sedimentation of precipitate, MPs were floated on the surface of solution and for their separation, supernatant was filtered using a vacuum pump. Suspicious samples collected on filter paper were taken by tweezers for identification and analysis. This process was repeated at least three times for each sample. The frequency of MPs was expressed in pieces per 100 g of dry sample (pcs/100 g) [22].
Statistical analysis
Statistical analyses were performed by SPSS 19.0 software and graphs were generated using Excel® 2016. Data were evaluated for normality with the Shapiro-Wilk and Kruskal-Wallis non-parametric tests at 95% confidence level. Statistical significance was considered at alpha level of 0.05. Suspected microplastics were recorded and the actual presence of MPs were re-calculated after FT-IR scanning.
Results and discussion
Abundance and distribution of MPs in Sistan region
MPs were found in all sampling stations. In total, from 250 suspected particles, 147 MPs were detected by FT-IR. Figure 2 shows the number of MPs (pcs/100 g) found in sampling stations. The average abundance of MPs in atmospheric dust samples of Sistan was 9.8 pcs/100 g. The highest amount of MPs was found in Zabol (mean 14.5 pcs/100 g), and the smallest amount was observed near Hamun Lake (mean 4.5 pcs/100 g). Previous studies revealed that human activity and population are key factors in the production of MPs [23]. Zabol has the highest population density and human activities than the other cities in the Sistan region. However, no significant differences were observed among the other sampling stations (Kruskal-Wallis test, p = 0.745 > 0.05) which is probably due to the displacement of MPs by wind. Liu et al. [24], showed that the transportation of atmospheric MPs is dependent on the climate conditions such as heat stress index, wet bulb temperature, wind speed, barometric pressure, wind direction and humidity. Due to the small sizes and low densities, MPs can be easily distributed by wind. Hence, in the Sistan region, direction and wind speed can be regarded as the main source of MPs distribution, especially in low populated areas. Dehghani has already reported that the average amount of MPs in deposited dust of Tehran was 10 pcs/100 g [25].
Fig. 2.
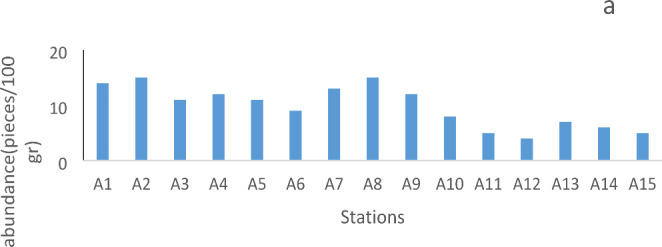
Characterization of obtained MPs in dust samples of Sistan. Abundance (a), average size (b), average colors (c), average shape (d) and average composition (e)
Morphological features of MPs in Sistan
Sizes of MPs
MPs collected from the atmospheric dust samples of Sistan were ranged in 5 sizes of size 1 (500–1000 μm), Size 2 (1000–2000 μm), size 3 (2000–3000 μm), size 4 (3000–4000 μm) and size 5 (4000–5000 μm) (Fig. 2b). The smallest size that was found in Zabol was 650 μm and the largest one with a size of 4300 μm was belonged to Hamun Lake. As shown in Fig. 2b, size 2 was dominant in most sampling stations (53.3%), which was found in urban sampling stations. Sizes 3 and 4 were observed outside of the residential area. Previous studies showed that size of MPs play an important role for their transmission and displacement by dust particles [26]. Generally, larger MPs are heavier and their transport by dust particles is more difficult and tend to deposit. that’s why larger MPs were observed in dune samples outside of urban areas. Klein et al. [27] studied atmospheric MPs in Hamburg and showed that larger MPs commonly deposit near the emission source. There was a significant difference between the size of MPs obtained in urban samples compared to dune samples (Kruskal-Wallis test, p = 0.445 < 0.05).
Shapes and colors
The observed MPs had a variety of colors including transparent (46%), green (19%), blue (16%), red (7%) and gray (6%). Other colors such as black, yellow and purple were also found. Figure 2c shows that transparent MPs were present in all sampling stations. A total of 57% of fragmented MPs were transparent and 33% of fibers were green. The color of MPs can refer to the distribution of MPs based on their origin. In areas with higher population density, a variety of colors could be seen. The variety of colors may also be due to the industrial nature of some areas [28].
Based on the obtained results, the predominant shape of MPs in Sistan were fragmented (64%), followed by fibers (33%) and granular (1%) (Fig. 2d). There was no significant difference in the obtained shape of atmospheric MPs among the sampling sites (Kruskal-Wallis test, p = 0.635 > 0.05). It means that the emission source and distribution of MPs in Sistan is almost similar. Fragmented MPs are commonly produced from plastic bags that are used in large scale in Sistan. Fibers are usually produced from the clothing and textile industry and can be easily emitted to the air [29]. Due to the lack of such industry in the Sistan region, fibrous forms of MPs were less than fragmented shapes. Granular MPs are used in industry, and can be found in areas with high industry activity [30]. The differences in local activities is an important factor that caused changes in the shape of MPs.
Chemical composition of MPs
Figure 3 shows FT-IR spectra of the obtained MPs collected from the sampling stations. Four types of polymers including polyethylene (PE) (49%), polystyrene (PS) (21%), polyester (PES) (18%) and Polyacrylonitrile (PAN) (6%) were observed, with smaller amounts of polypropylene, polyethylene terephthalate and epoxy resins. Based on statistical analysis, there was no significant difference in the type of polymer between sampling sites (Kruskal-Wallis test, p = 0.715 > 0.05).
Fig. 3.
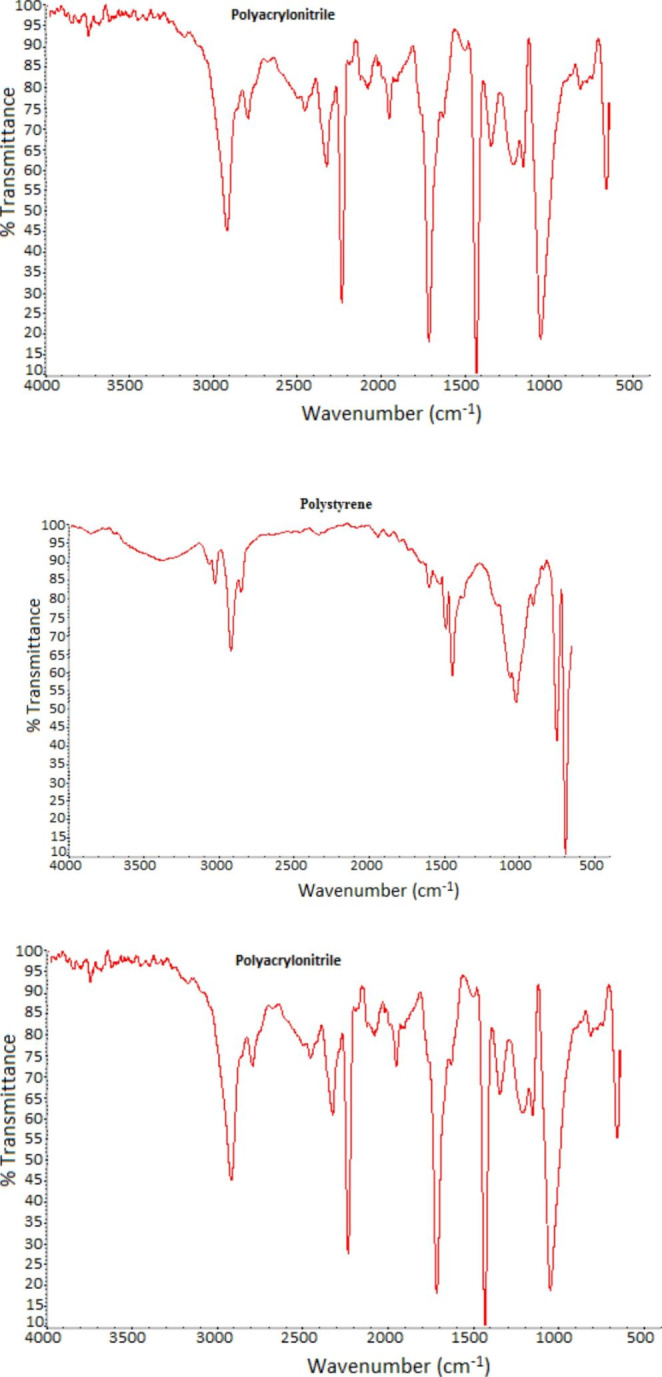
FT-IR spectra of some MPs founded in Sistan
Vianello et al. [31] showed that the main source of large MPs is breakdown of plastic waste, clothes and similar objects [32]. PE which was the dominant type of MP in all sampling stations is widely used for various purposes including plastic bags, pipes, polymer sheets, bottles and food packing, and were positively correlated with fragmented MPs in Sistan. PS is an aromatic synthetic polymer made from styrene monomer and is used in in house building, making dishes, household appliances and covers, as well as in sports equipment and toys. It is found as fragmented or granular shapes in the air.
Comparison of detected atmospheric MPs in Sistan with other parts of the world
Table 1 shows a detailed comparison of several studies on atmospheric MPs with results we obtained for Sistan area. Some similarities in morphological features and chemical composition can be observed. MPs found in Paris were fibrous in shape and their size was between 50 and 3250 μm. Rayon, PE and PA were the main types of polymers. In Shanghai, various shapes of MPs including fiber, fragmented and granulated were detected. The types of polymers found in Shanghai were also diverse and included 9 different types of polymers. In our study, the most abundant polymers found were PE, PS, PES and PAN. The dominant color of MPs in Sistan was transparent, while in the cities mentioned in Table 1, a variety of colors reported.
Table 1.
A comparison between atmospheric MPs in Sistan with other reported studies
| City | MP Size (µm) | MP Shape | Polymer type | Color | Ref |
|---|---|---|---|---|---|
| Shanghai | 110 | Fiber, fragment, granular | PET, PE, PES, PAN, PAA, RY, EVA, EP, ALK | Blue, black, red, transparent, brown, green, yellow, grey | 24 |
| Paris | 50-3250 | Fiber | RY, PA, PE, PP | N.M | 33 |
| Dongguan | N.D |
Fiber, foam, film, fragment |
RY, PE, PP, PS | Blue, black, red yellow, pink, white | |
| Jakarta | 300 − 100 | Foam, fragment, fiber | PES, PS, PBD, and PE | N.M | 34 |
| Yanati | 50-1000 |
Fiber, foam, film, fragment |
PET, PE, PVC, PS | Black, red, white, transparent | 35 |
| Sistan | 500–5000 | Fragment, fiber, granular | PE, PS, PES, PAN | Transparent, green, blue, red, gray | This study |
polystyrene = PS, Polybutadiene = PBD, polyethylene terephthalate = PET, polyethylene = PE, polyester = PES, polyacrylonitrile = PAN, poly(N-methyl acrylamide) = PAA, rayon = RY, ethylene vinyl acetate = EVA, epoxy resin = EP; alkyd resin = ALK; Not mentioned = N.M
Limitations
Due to limitation in the budget, it was not possible to take an active high volume environmental dust sampler for performing test, therefore reporting concentration of MPs as the number of MPs per cubic meters of air (pcs/m3) could not be achieved. We were also unable to estimate health risk assessment of MPs in Sistan because of the lack of a systematic and standardized model for that. Liu et al. [24] developed a modified version of potential ecological risk assessment of MPs in Shanghai. For calculating the risk index, they used heavy metal toxicity coefficients for polymer and outdoor MPs abundance of Paris as the background value of MPs. Their results showed that the potential risk index for all funded MPs were at minor level. It should be mentioned that geographic conditions such as direction and velocity of wind, high temperature and sand storm were unavoidable problems in our sampling process.
Concluding Remarks.
In this study, the frequency and type of atmospheric microplastics in Sistan was investigated. The results showed presence of MPs in all of the samples taken. The highest diversity and number of MPs were detected in the areas with higher population density and with more human activities. Transparent MPs were dominant in all of the examined samples, which shows the high use of plastic bags. Two parameters, wind and population density, can be regarded as the most important sources of MP pollution in Sistan.
Acknowledgements.
The authors hereby thanks the staff of laboratories of Faculty of Health in Zabol University of Medical Sciences.
Electronic supplementary material
Below is the link to the electronic supplementary material.
Author contribution
MRRK planned the study, performed the practical work and wrote the manuscript. MS co-wrote the manuscript and interpret the data. JP performed data modeling. AS performed the practical work. MK planned the revised study and co-wrote the manuscript. All authors read and approved the final manuscript.
Funding
This study was funded by Zabol University of Medical Sciences and the University of Sistan and Baluchestan.
Data Availability
All data generated or analyzed during this study are included in this published article.
Declarations
Ethics approval and consent to participate
Not applicable.
Consent for publication
Not applicable.
Competing interests
The authors declare no competing interests.
Footnotes
Publisher’s Note
Springer Nature remains neutral with regard to jurisdictional claims in published maps and institutional affiliations.
References
- 1.Kitahara K-I, Nakata H. Sci Total Environ. 2020;736:139694. doi: 10.1016/j.scitotenv.2020.139694. [DOI] [PubMed] [Google Scholar]
- 2.Lindeque PK, Cole M, Coppock RL, Lewis CN, Miller RZ, Watts AJ, Wilson-McNeal A, Wright SL, Galloway TS. Environ Pollut. 2020;265:114721. doi: 10.1016/j.envpol.2020.114721. [DOI] [PubMed] [Google Scholar]
- 3.Rillig MC, Lehmann A. Science 2020;368(6498):1430–1431. [DOI] [PMC free article] [PubMed]
- 4.Haave M, Lorenz C, Primpke S, Gerdts G. Mar Pollut Bull. 2019;141:501–13. doi: 10.1016/j.marpolbul.2019.02.015. [DOI] [PubMed] [Google Scholar]
- 5.Alam FC, Sembiring E, Muntalif BS, Suendo V. Chemosphere. 2019;224:637–45. doi: 10.1016/j.chemosphere.2019.02.188. [DOI] [PubMed] [Google Scholar]
- 6.Xue B, Zhang L, Li R, Wang Y, Guo J, Yu K, Wang S. Environ Sci Technol. 2020;54(4):2210–7. doi: 10.1021/acs.est.9b04850. [DOI] [PubMed] [Google Scholar]
- 7.Dewar-Fowler VH. 2017. Uptake and Biological Impacts of Microplastics and Nanoplastics in Sea Squirts, Master’s Thesis, University of Exeter.
- 8.Szymańska M, Obolewski K. Ecohydrol Hydrobiol. 2020;20(3):333–45. doi: 10.1016/j.ecohyd.2020.05.001. [DOI] [Google Scholar]
- 9.Gola D, Tyagi PK, Arya A, Chauhan N, Agarwal M, Singh S, Gola S. Environ Nanatechnol Monit Manage. 2021;16:100552. [Google Scholar]
- 10.Brahney J, Mahowald N, Prank M, Cornwell G, Klimont Z, Matsui H, Prather KA. Proceed Nat Acad Sci. 2021, 118 (16), e2020719118. [DOI] [PMC free article] [PubMed]
- 11.Bergmann M, Lutz B, Tekman MB, Gutow L. Mar. Pollut. Bull. 2017, 125 (1–2), 535–540. [DOI] [PubMed]
- 12.Wang F, Lai Z, Peng G, Luo L, Liu K, Huang X, Xu Y, Shen Q, Li D. Sci Total Environ. 2021;800:149529. doi: 10.1016/j.scitotenv.2021.149529. [DOI] [PubMed] [Google Scholar]
- 13.Du J, Zhou Q, Li H, Xu S, Wang C, Fu L, Tang J. J Appl Toxicol 2021, 41 (1), 52–64. [DOI] [PubMed]
- 14.Rashki A, Eriksson PG, Rautenbach CdW, Kaskaoutis DG, Grote W, Dykstra J. Chemosphere. 2013;90(2):227–36. doi: 10.1016/j.chemosphere.2012.06.059. [DOI] [PubMed] [Google Scholar]
- 15.Ahmadi S, Ezeliora C, Sharki S, Osagie C, Ghosh S, Igwegbe C, Khan N. Int J Environ Sci Technol 2021, 1–14.
- 16.Behrooz RD, Esmaili-Sari A, Bahramifar N, Kaskaoutis D, Saeb K, Rajaei F. Aeolian Res 2017, 25, 87–105.
- 17.Behrooz RD, Kaskaoutis D, Grivas G, Mihalopoulos N. Chemosphere. 2021;262:127835. doi: 10.1016/j.chemosphere.2020.127835. [DOI] [PubMed] [Google Scholar]
- 18.Peng G, Zhu B, Yang D, Su L, Shi H, Li D. Environ Pollut. 2017;225:283–90. doi: 10.1016/j.envpol.2016.12.064. [DOI] [PubMed] [Google Scholar]
- 19.Liu K, Wu T, Wang X, Song Z, Zong C, Wei N, Li D. Environ Sci Technol. 2019;53(18):10612–9. doi: 10.1021/acs.est.9b03427. [DOI] [PubMed] [Google Scholar]
- 20.Obbard RW. Curr Opin Environ Sci Health. 2018;1:24–9. doi: 10.1016/j.coesh.2017.10.004. [DOI] [Google Scholar]
- 21.Abbasi S, Turner A, Hoseini M, Amiri H. Environ Sci Technol. 2021;55(9):5993–6000. doi: 10.1021/acs.est.1c00615. [DOI] [PubMed] [Google Scholar]
- 22.Abidli S, Toumi H, Lahbib Y, Trigui El Menif, N. Water, Air, & Soil Pollut 2017, 228 (7), 1–10.
- 23.Chen G, Feng Q, Wang J. Sci Total Environ. 2020;703:135504. doi: 10.1016/j.scitotenv.2019.135504. [DOI] [PubMed] [Google Scholar]
- 24.Liu K, Wang X, Fang T, Xu P, Zhu L, Li D. Sci Total Environ. 2019;675:462–71. doi: 10.1016/j.scitotenv.2019.04.110. [DOI] [PubMed] [Google Scholar]
- 25.Dehghani S, Moore F, Akhbarizadeh R. Environ Sci Pollut Res 2017;24 (25):20360–20371. [DOI] [PubMed]
- 26.Perez L, Tobías A, Querol X, Pey J, Alastuey A, Díaz J, Sunyer J. Environ Int. 2012;48:150–5. doi: 10.1016/j.envint.2012.07.001. [DOI] [PubMed] [Google Scholar]
- 27.Klein M, Fischer EK. Sci Total Environ. 2019;685:96–103. doi: 10.1016/j.scitotenv.2019.05.405. [DOI] [PubMed] [Google Scholar]
- 28.Mbachu O, Jenkins G, Pratt C, Kaparaju P. Water, Air & Soil Pollution 2020;231(2):1–27.
- 29.Prata JC. Environmental Pollution 2018, 234, 115–126. [DOI] [PubMed]
- 30.Abbasi S, Keshavarzi B, Moore F, Turner A, Kelly FJ, Dominguez AO, Jaafarzadeh N. Environ Pollut. 2019;244:153–64. doi: 10.1016/j.envpol.2018.10.039. [DOI] [PubMed] [Google Scholar]
- 31.Vianello A, Jensen RL, Liu L, Vollertsen J. Scientific Reports 2019;9(1):1–11. [DOI] [PMC free article] [PubMed]
- 32.Begum SA, Rane AV, Kanny K, Applications of compatibilized polymer blends in automobile industry. In Compatibilization of Polymer Blends, Elsevier: 2020; pp 563–593.
- 33.Dris R, Gasperi J, Mirande C, Mandin C, Guerrouache M, Langlois V, Tassin B. Environ pollut 2017; 221:453–458. [DOI] [PubMed]
- 34.Purwiyanto AIS, Prartono T, Riani E, Naulita Y, Cordova MR, Koropitan AF. Mar Pollut Bull. 2022;174:113195. doi: 10.1016/j.marpolbul.2021.113195. [DOI] [PubMed] [Google Scholar]
- 35.Liu J, Zhu X, Teng J, Zhao J, Li C, Shan E, Zhang C, Wang Q. Bull Environ Contam Toxicol. 2021;107:693–9. doi: 10.1007/s00128-021-03276-7. [DOI] [PubMed] [Google Scholar]
Associated Data
This section collects any data citations, data availability statements, or supplementary materials included in this article.
Supplementary Materials
Data Availability Statement
All data generated or analyzed during this study are included in this published article.