Abstract
PD-1 blockade is highly effective in classical Hodgkin lymphomas (cHLs) which exhibit frequent chromosome 9p24.1/CD274 (PD-L1)/PDC1LG2 (PD-L2) copy gains. However, in this largely MHC class I-negative tumor, the mechanism of action of anti-PD-1 therapy remains undefined. We utilized the complementary approaches of T-cell receptor (TCR) sequencing and cytometry by time-of-flight analysis (CyTOF) to obtain a peripheral immune signature of responsiveness to PD-1 blockade in 56 patients treated in the CheckMate 205 phase II clinical trial (NCT02181738). Anti PD-1 therapy was most effective in patients with a diverse baseline TCR repertoire and an associated expansion of singleton clones during treatment. CD4+, but not CD8+, TCR diversity significantly increased during therapy, most strikingly in patients who achieved complete responses. Additionally, responding patients had an increased abundance of activated NK cells and a newly identified CD3−CD68+CD4+GrB+ subset. These studies highlight the roles of recently expanded, clonally diverse CD4+ T cells and innate effectors in the efficacy of PD-1 blockade in cHL.
Introduction
Classical Hodgkin lymphomas (cHLs) include rare malignant Hodgkin Reed-Sternberg (HRS) cells admixed with abundant inflammatory and immune cells1. Although the cHL inflammatory infiltrate is T-cell rich, it is not associated with an effective anti-tumor immune response.
We previously identified near-universal copy gain of chromosome 9p24.1/CD274(PD-L1)/PDCD1LG2(PD-L2) and copy number-dependent increased expression of the PD-1 ligands on HRS cells2-5. PD-1 ligands engage PD-1 receptor-positive T-cells and induce T cell “exhaustion”, which can be abrogated by PD-1 blockade6. Patients with relapsed/refractory (R/R) cHL, who have a genetic basis for enhanced PD-1 signaling, also exhibit the highest reported response rates to PD-1 blockade7-13. As a consequence, multiple PD-1 antibodies have been approved for the treatment of R/R cHL and incorporated into frontline clinical trials14,15. Despite these genetic observations and rapid clinical translation, the precise mechanism of action of PD-1 blockade in cHL remains undefined.
In certain solid tumors, PD-1 blockade is reported to increase the activity of CD8+ cytotoxic T-cells in the tumor microenvironment (TME)16-19. However, HRS cells frequently lack cell surface expression of β2M and MHC class I due to inactivating mutations of B2M or copy loss of B2M or MHCI4,5,20,21. As MHC class I-mediated tumor antigen presentation is essential for recognition by CD8+ T cells, these findings implicate non-CD8+ effector mechanisms of PD-1 blockade in cHL.
MHC class II-mediated antigen presentation to CD4+ effector cells also plays an important role in anti-tumor immunity22-27. HRS cells are often MHC class II+ likely reflecting their MHC class II+ germinal center B-cell lineage28,29. In intact tumors, PD-L1+ HRS cells are also more likely to be in physical contact with PD-1+ CD4+ T-cells than PD-1+ CD8+ T-cells30. Our previous single-cell analyses of primary cHL cell suspensions also revealed a CD4+ T-cell rich TME with expanded numbers of T-helper1 (Th1)-polarized effectors and regulatory T cells31.
Consistent with these observations, we also found that HRS cell expression of MHC class II, but not MHC class I, was associated with responses to PD-1 blockade (nivolumab) in patients with R/R cHL4. Additional evidence of non-MHC restricted immune mechanisms came from patients who achieved short-lived complete responses (CRs) to anti-PD-1 blockade although their HRS cells lacked β2M, MHC class I and MHC class II expression4.
Recent studies in murine models and patients with certain solid tumors associate circulating immune cell subsets with responses to checkpoint blockade32-38. Herein, we utilized complementary approaches – TCR sequencing and cytometry by time of flight (CyTOF) analyses – to characterize the peripheral immune signature of patients with R/R cHL who received anti-PD-1 therapy.
Results
Patient cohorts and samples
We obtained baseline and on-treatment peripheral blood mononuclear cell (PBMC) samples from 56 patients with recurrent cHL who were treated with nivolumab on the CheckMate 205 clinical trial and had best overall responses of CR, PR or PD (Supplemental Table 1)8. In this phase II study, patients who relapsed following autologous stem cell transplantation (ASCT) alone (Cohort A) or ASCT and brentuximab vedotin (BV) (Cohorts B and C)8 received nivolumab 3 mg/kg IV every 2 weeks until disease progression or unacceptable toxicity; patients in Cohort C who achieved a CR discontinued nivolumab following 1 year of therapy8.
PBMCs from trial patients were collected immediately before the initiation of therapy (cycle 1 day 1 [C1D1]) and at two timepoints during PD-1 blockade, cycle 2 day 1 (C2D1) and cycle 4 day 1 (C4D1). PBMCs were also obtained from patients with newly diagnosed, previously untreated cHL and healthy donors for comparisons (Online Methods and Supplemental Table 1).
Analyses of baseline TCR diversity
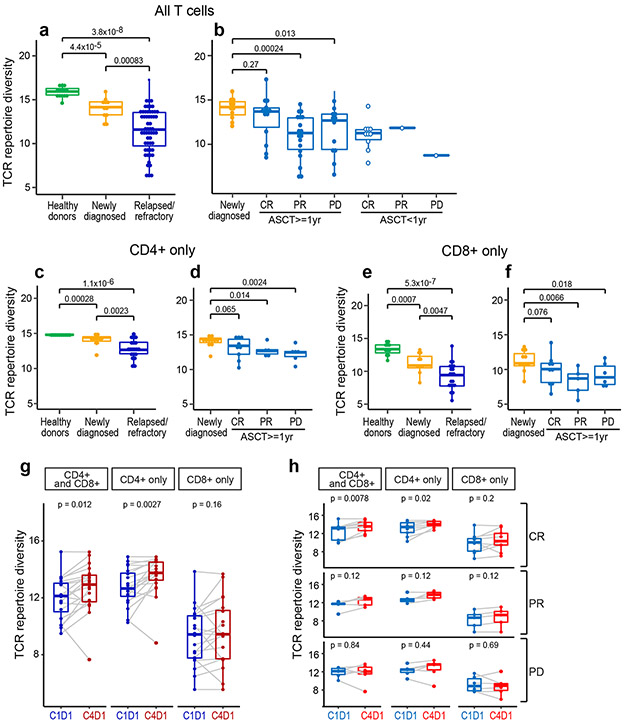
We first sequenced the TCR beta chain CDR3 regions from all PBMC samples and analyzed TCR repertoire diversity using the Shannon entropy index (Online Methods). Baseline TCR diversity was significantly higher in normal healthy donors than in patients with newly diagnosed cHL (p=4.4 x 10⁻⁵), indicating that these patients have a reduced TCR repertoire prior to the initiation of therapy (Fig. 1a). Additionally, TCR diversity was significantly higher in patients with newly diagnosed cHL than in patients with relapsed/refractory (R/R) disease (p =0.00083), potentially reflecting disease progression and/or prior treatment (Fig. 1a).
Figure 1. Analyses of peripheral TCR repertoire diversity at baseline and following PD-1 blockade.
(a) TCR repertoire diversity, as determined by the Shannon diversity index, in healthy donors (n=14) and patients with newly diagnosed (n=11) or relapsed/refractory cHL (n=56). (b) TCR repertoire diversity in patients with relapsed/refractory cHL separated by subsequent response to PD-1 blockade (CR, PR and PD) and time interval between prior myeloablative ASCT (< 1 year versus ≥ 1 year) and initiation of anti-PD-1 treatment. Patients with CR and ASCT ≥ 1 year (n=14); PR and ASCT ≥ 1 year (n=18); PD and ASCT ≥ 1 year (n=12); CR and ASCT < 1 year (n=10); PR and ASCT < 1 year (n=1) and PD and ASCT < 1 year (n=1). Patients with newly diagnosed cHL included for comparison. Analyses in (a and b) were done by Wilcoxon rank sum tests with two-sided p-values. (c-f) TCR repertoire diversity in CD4+ (c,d) or CD8+ (e,f) peripheral T cells from healthy donors (n=13), patients with newly diagnosed (n=11) or relapsed/refractory cHL and ASCT ≥ 1 year prior to anti-PD-1 therapy (n=20, including 9 CRs, 5 PRs and 6 PDs). Analyses were done by Wilcoxon rank sum tests with one-sided p-values. (g) Changes in TCR repertoire diversity following PD-1 blockade (cycle 1 day 1 [C1D1] to cycle 4 day 1 [C4D1]). In patients with relapsed/refractory cHL and ASCT ≥ 1 year prior to anti-PD-1 therapy, changes in TCR diversity between C1D1 and C4D1 were evaluated in combined CD4+ and CD8+, CD4+ only and CD8+ only peripheral T cells from a subset of patients with available paired samples (n=20, all). (h) Changes in TCR diversity following PD-1 blockade (C1D1 to C4D1) in patients (from g) separated by BOR to treatment (CRs, n=9; PRs, n=5; and PDs, n=6). Analyses were done by Wilcoxon rank sum tests with two-sided p-values in g and h. For all box plots, the lower and upper hinges correspond to the 25th and 75th percentiles. The whiskers extend from the largest to smallest value but no further than 1.5 x interquartile range (IQR) with outliers plotted individually.
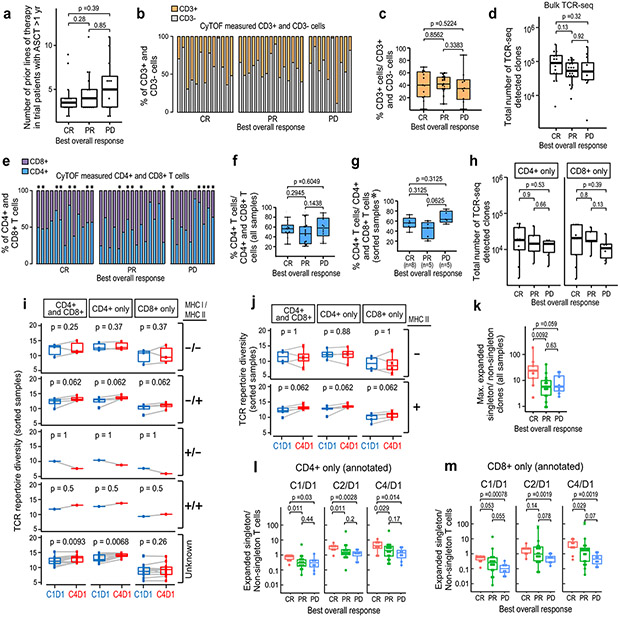
The loss of TCR diversity in patients with R/R disease (Fig. 1a) prompted us to assess a potential association between baseline TCR repertoire and subsequent response to PD-1 blockade (Fig. 1b). Earlier analyses suggested that functional T-cell recovery requires ≥ 1 year following myeloablative therapy and ASCT4,39-41. For this reason, we separately analyzed patients who began nivolumab therapy < or ≥ 1 year after myeloablative ASCT (Fig. 1b). As expected, patients who were < 1 year from prior ASCT had lower baseline TCR diversity (Fig. 1b). To avoid the confounding variable of ongoing immune reconstitution, we restricted our subsequent analyses to patients who were treated with nivolumab ≥ 1 year following myeloablative ASCT. The number of prior therapies were not significantly different in these trial patients although those who progressed on nivolumab had higher median values (Extended data Fig. 1a). The percentages of circulating T cells and numbers of detected TCR sequences at baseline were not significantly different in these trial patients (Extended data Fig. 1b-d).
Baseline TCR diversity in R/R patients who achieved a CR with nivolumab was not significantly different from that in newly diagnosed patients (p=0.27, Fig, 1b); in contrast, baseline TCR diversity was significantly lower in R/R patients who obtained only a partial response (PR) (p=0.00024) or had progressive disease (PD) (p=0.013) following PD-1 blockade (Fig. 1b).
In our earlier studies of the CheckMate 205 patients, HRS cell expression of MHC class II, but not MHC class I, was associated with response to PD-1 blockade4. Additionally, we previously found that the cHL TME was enriched for CD4+ cells, including those in immediate proximity to HRS cells30,31. These findings prompted us to perform TCR sequencing of highly purified peripheral CD4+ and CD8+ T-cells and assess their respective repertoires in healthy donors, patients with newly diagnosed cHL and trial patients with R/R cHL who were treated with nivolumab ≥ 1 year following ASCT at baseline and following PD-1 blockade (Fig. 1c-f). The trial patients had no significant differences in ratios of input CD4+ and CD8+ T-cells or total detected CD4+ and CD8+ TCR sequences at baseline (Extended data Fig. 1e-h).
Peripheral CD4+ TCR repertoire diversity was significantly higher in healthy donors than in patients with newly diagnosed or R/R cHL (p=0.00028 and p=1.1x10⁻⁶, respectively, Fig. 1c). Whereas baseline CD4+ TCR diversity was not significantly different in newly diagnosed patients and R/R patients who obtained subsequent CRs to nivolumab (p=0.065), it was significantly lower in patients with PRs or PD (p=0.014 and p=0.0024, respectively, Fig. 1d). Similar patterns were observed in baseline CD8+ TCR diversity; however, Shannon indices were lower in CD8+ than CD4+ subsets (Fig. 1c-f).
After characterizing baseline differences in CD4+ and CD8+ TCR diversity in trial patients, we assessed dynamic changes in these repertoires following PD-1 blockade (C1D1 to C4D1, Fig. 1g and h). Following 6 weeks of therapy (C4D1), there was a highly significant increase in CD4+, but not CD8+, TCR repertoire diversity (p=0.0027 and p=0.16, respectively, Fig. 1g). In addition, the selective increase in CD4+ TCR repertoire diversity was most apparent in patients who achieved CRs to nivolumab (p=0.02, Fig. 1h). Furthermore, in the subset of patients whose HRS cells were previously characterized for MHC class I and MHC class II expression4, only those with MHC class II+ tumor cells had significantly increased TCR repertoire diversity following PD-1 blockade (Extended data Fig. 1i and j). These data highlight the importance of a CD4+ T-cell response to PD-1 blockade in this lymphoid malignancy which is largely MHC class I-negative.
Clonal T-cell expansion following PD-1 blockade.
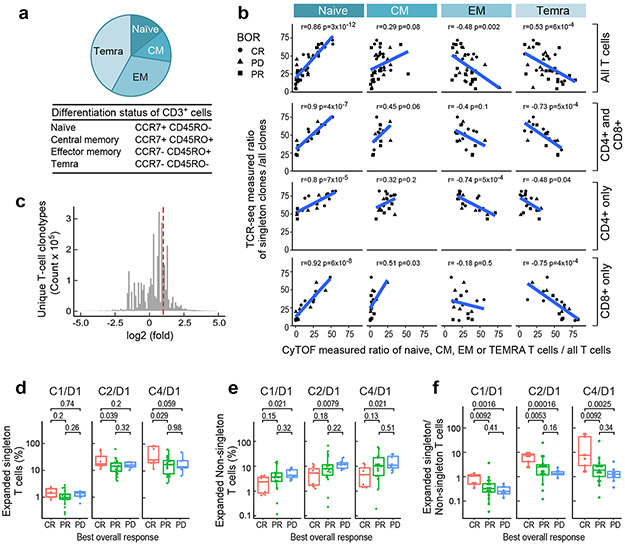
We postulated that TCR diversity, which reflects the number of individual T-cell clones capable of recognizing distinct antigens, would align with peripheral T-cell differentiation in our trial patients. For this reason, we used our recently described CyTOF panel31 (Online Methods) to identify CD3+ naïve, central memory (CM), effector memory (EM) and terminally differentiated effector memory (TEMRA) T cells based on their expression of CCR7 and CD45RO (Fig. 2a).
Figure 2. Clonal expansion following PD-1 blockade.
(a) The median CyTOF-based measurement of CD3+ T-cell differentiation subsets (naïve, central memory [CM], effector memory [EM] and TEMRA) in patients with relapsed/refractory cHL and ASCT ≥ 1 year prior to anti-PD-1 treatment (n=38 total). (b) Correlation between the relative abundance of TCR-seq measured singleton clones (ratio of singleton clones/ all clones) and relative abundance of CyTOF-defined T-cell differentiation subsets (ratio of naïve, CM, EM or TEMRA/ all T cells). Analyses were performed in all CD3+ T cells (top panel, n=38); the combination of sorted CD4+ and CD8+ T cells (upper middle panel); CD4+ T cells only (lower middle panel); and CD8+ T cells only (bottom panel) (CD4+ and CD8+, CD4+ only and CD8+ only, n=20). The Pearson’s correlation was applied and the two-sided p-value was estimated by a T distribution. (c) Unique T- cell clonotypes in patients with relapsed/refractory cHL treated with PD-1 blockade. All patients in the analysis began nivolumab treatment ≥ 1 year following myeloablative therapy and ASCT. TCR sequences (clonotypes) from baseline (C1/D1) and on-treatment (C2/D1 and C4/D1) samples. The area to the right of the dotted red line denotes T-cell clonotypes with 2-fold or greater expansion following treatment. Clonotypes at zero or below are unchanged or decreased/lost with treatment. The distribution is for 4,045,691 clonotypes from the 34 trial patients with available samples from all 3 timepoints (C1D1, C2D1 and C4D1). (d, e and f) The percent expansion of singleton clones (0 or 1 copy at baseline) (d), non-singleton clones which have 2 or more copies at baseline (e) and the ratio of expanded singleton/non-singleton clones (f) in patients with CR, PR or PD to PD-1 blockade. Only patients with samples at all three time-points (n=34) were included in the analysis. C1D1 shows baseline (pretreatment) levels of clones that subsequently expand at C2/D1 and C4/D1. Patients with CR to PD-1 blockade have significantly greater expansion of singleton, as opposed to non-singleton, clones (Wilcoxon rank sum test with two-sided p-values). For all box plots, the lower and upper hinges correspond to the 25th and 75th percentiles. The whiskers extend from the largest to smallest value but no further than 1.5 x IQR with outliers plotted individually.
We reasoned that singleton TCR clones which appeared only once in TCR sequencing were more likely to represent peripheral T cells that had not yet encountered antigen or had undergone limited clonal expansion. To assess this, we compared the TCRseq-measured ratio of singleton/ all clones to the CyTOF-determined ratio of naive, CM, EM or TEMRA T cells/ all T cells in trial patients (Fig. 2b). In all CD3+ T cells and purified CD4+ and CD8+ T-cell subsets, the relative abundance of singleton clones was more closely associated with that of naïve and central memory T cells (Fig. 2b, top and bottom panels). These data suggest that T cells with singleton TCRs are less likely to be terminally differentiated.
Given the association between increased TCR repertoire diversity and response to PD-1 blockade (Fig. 1g and h), we next evaluated clonal T-cell expansion following therapy. In patients who were treated with nivolumab ≥ 1 year after ASCT, we identified 4,045,691 unique TCR sequences at baseline; 792,705 of these TCR clones expanded ≥ 2-fold following treatment (Fig. 2c) (Online Methods).
We compared the expansion of T-cell clones derived from singletons (0 or 1 copy pre-treatment) or non-singletons (2 or more copies pretreatment) and assessed the ratio of expanded singleton over non-singleton T cells following PD-1 blockade (Fig. 2d-f). Patients who achieved a CR exhibited significantly greater expansion of singleton over non-singleton clones, in comparison to those who obtained only a PR or PD (Fig. 2d-f and Expanded data Fig. 1k). These data indicate that clonal expansion of less terminally differentiated singletons, rather than non-singletons, is associated with a favorable response to PD-1 blockade in cHL. Similar results were seen in purified CD4+ singleton over non-singleton clones and, to a lesser extent, in CD8+ TCR subsets (Extended data Fig. 1l and m).
CD3+ cells in healthy donors and patients with newly diagnosed cHL.
We next used CyTOF to characterize peripheral CD3+ cell types in three scenarios, respectively: healthy donors and patients with newly diagnosed cHL (Fig. 3a-c and Fig. 4a); patients with newly diagnosed and R/R cHL at baseline (Fig. 3f-h and Fig. 4b); and patients with R/R cHL at baseline and following PD-1 blockade (Fig. 4e and f). These cohorts were analyzed separately to maximize resolution of distinct immune clusters.
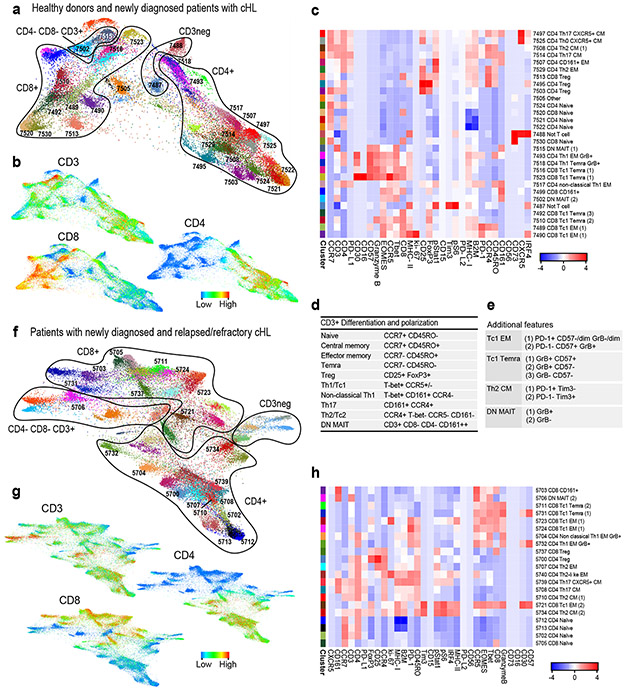
Figure 3. Analyses of circulating CD3+ cells in healthy donors and patients with newly diagnosed or relapsed/refractory cHL.
(a) Forced-directed layout (FDL) of circulating CD3+ cells from healthy donors and newly diagnosed patients with cHL. For CD3+ cell analyses, all antibody channels except PAX5, CD163, CD68, CD33 and CD14 were included. Each unique population (cluster) is labeled with a distinct color and identified by a unique number. (b) Major lineages in (a) defined by expression of CD3, CD4 and CD8. (c) Heatmap showing relative expression of CyTOF panel proteins in clusters with > 100 cells in ≥ 10% of samples from (a). (d) Markers used to identify major CD3+ subsets. (e) Markers used to define polarization, differentiation and functional status. (f) FDL of circulating CD3+ cells from patients with newly diagnosed and relapsed/refractory cHL. (g) Expression of CD3, CD4 and CD8 in (f). (h) Heatmap showing relative expression of CyTOF panel proteins in clusters with > 100 cells in ≥ 10% of samples from (g). For inclusion in the analyses of CD3+ clusters in healthy donors (n=11) and patients with newly diagnosed cHL (n=9) in (a), available samples must have had 12000 sampled events. For inclusion in the analyses of CD3+ clusters in patients with newly diagnosed cHL (n=9) and relapsed/refractory cHL (n=36) in (f), available samples must have had 7500 sampled events.
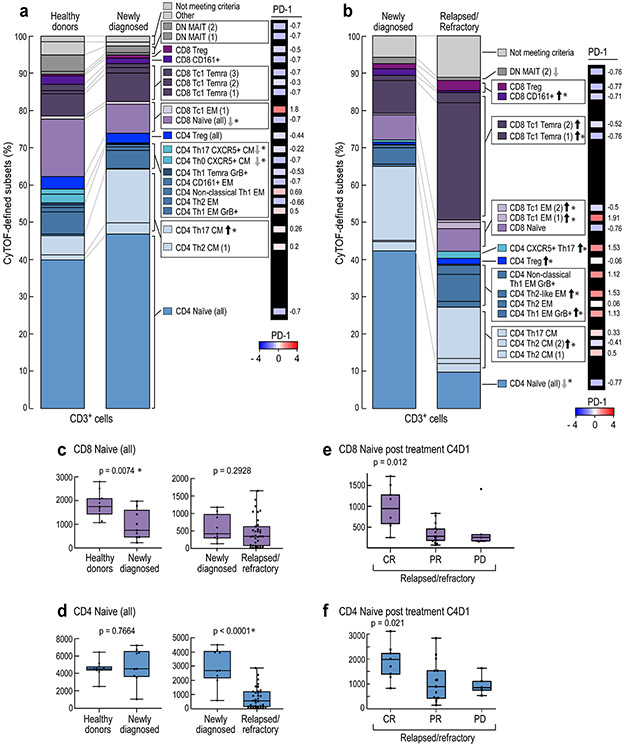
Figure 4. Comparative analyses of CD3+ clusters in healthy donors and patients with newly diagnosed and relapsed/refractory cHL.
To quantify the immune cell clusters in each group, we calculated the median cluster cell counts in healthy donors versus newly diagnosed patients and newly diagnosed versus relapsed/ refractory patients. Results are displayed in comparison bar graphs (healthy donors vs. newly diagnosed cHL, a, and newly diagnosed vs relapsed/refractory cHL, b). Significant differences (Wilcoxon rank sum test with nominal two- sided p-values ≤ 0.05) and directions of the differences on right. P-values that remain significant after Benjamini-Hochberg correction are noted (*) See also extended data Figs. 3a, b and 4a, b for exact p-values. Relative levels of PD-1 expression in specific clusters are visually represented alongside each bar graph, a and b, far right. See also extended data Fig. 4d. (a) Healthy donors versus patients with newly diagnosed cHL. (b) Patients with newly diagnosed cHL versus patients with relapsed/refractory cHL. (c) CD8+ naïve T-cell counts at baseline in healthy donors versus newly diagnosed patients (left) and patients with new diagnosed versus relapsed/ refractory cHL (right). (d) CD4+ naïve T-cell counts at baseline in healthy donors versus newly diagnosed patients (left) and patients with new diagnosed versus relapsed/refractory cHL (right). (e) CD8+ naïve T-cell counts post treatment (C4D1) by BOR to PD-1 blockade. (f) CD4+ naïve T-cell counts post treatment (C4D1) by BOR. In panels c and d, differences between groups were assessed with Wilcoxon rank sum tests with nominal two-sided p-values. A Benjamini-Hochberg correction was applied in CD3+ (CD4+ and CD8+) cell types and nominal p-values that retain significance are noted (*). In panels e and f, a Cuzick trend test was used to compare across the groups and two-sided nominal p-values are shown. All box plots (generated in GraphPad Prism) define the 25th and 75th percentile and median values and whiskers for minimum and maximum values. In these analyses, clusters with similar phenotypes, such as CD4+ naïve clusters 7524, 7521, 7522, were collapsed. For inclusion in the analyses of CD3+ clusters in healthy donors (n=11) and patients with newly diagnosed cHL (n=9) in (a), available specimens must have had 12000 sampled events. For inclusion in the analyses of CD3+ clusters in patients with newly diagnosed cHL (n=9) and relapsed/refractory cHL (n=36) in (b), available specimens must have had 7500 sampled events. For inclusion in the post-treatment C4D1 analysis of relapsed/refractory cHLs (n=29; CR=9, PR=15 and PD=5) in (e) and (f), available specimens must have had 7500 sampled events; and included patients must also have had a baseline sample. Six patients with relapsed/refractory cHL who had sufficient events for the baseline analysis in (b) had no C4D1 sample; one patient who had sufficient events for the baseline analysis in (b) had < 7500 sampled events at C4D1 and was excluded from the C4D1 analyses in (e) and (f).
An equivalent number of single cells from each sample were analyzed and clustered with the VorteX/X-shift algorithms and visualized in a force-directed layout (FDL) (Online Methods)31,42. The FDL of viable peripheral CD3+ cells from healthy donors and patients with newly diagnosed cHL revealed individual clusters (Fig. 3a) arranged into larger groups defined by known cell lineage markers, CD3+, CD4+ and CD8+ (Fig. 3b), and additional markers of differentiation, polarization and function (Extended data Fig. 2a). For downstream analyses, we focused on major clusters with at least 100 cells in ≥ 10% of samples and evaluated the relative expression of CyTOF panel proteins with a heatmap (Fig. 3c). Thereafter, we manually annotated the identified clusters using additional lineage, differentiation, polarization and functional markers (Fig. 3c, d and e).
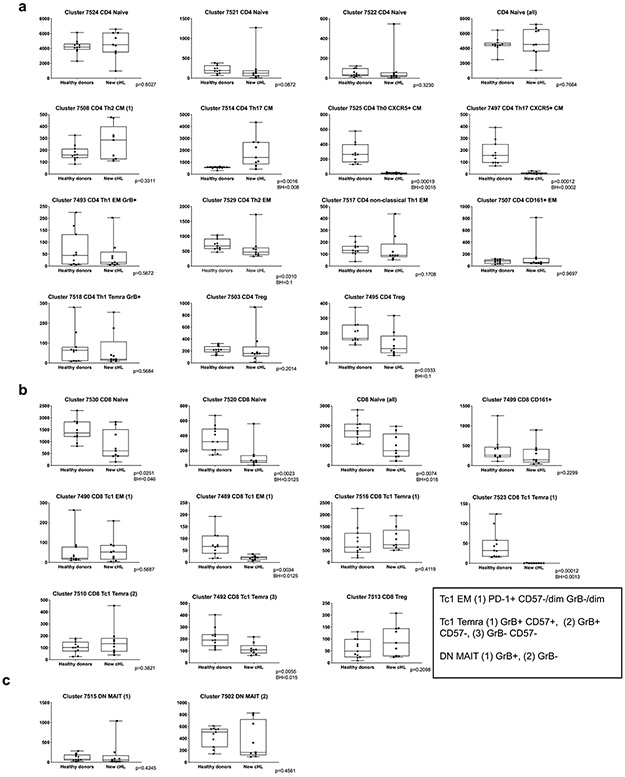
CD4+ and CD8+ T-cells were then identified as naïve, central memory (CM), effector memory (EM), or terminally differentiated effector memory (TEMRA) cells based on CCR7 and CD45RO expression (Fig. 3d); regulatory T-cells (Tregs) were defined as CD25+ and FoxP3+ (Fig. 3d). As expected, we detected CD4+ and CD8+ naïve T-cell clusters (cluster IDs 7524, 7521, 7522 and 7520); however, in the absence of local cytokine gradients, there was less polarization of circulating CD4+ T-cell subsets (CM, EM, TEMRA and Treg) (Fig. 3c and d) than in previously characterized primary cHL cell suspensions 31. PD-1 was largely expressed on CD8+ and CD4+ EM cells, including circulating CD4+ Th1 Granzyme B+ (GrB+) cytotoxic T-cells (ID: 7493) (Fig. 3c). CD4+ CM cells (IDs: 7508 and 7514) had lower levels of PD-1, and CD4+ and CD8+ Tregs were PD-1− (IDs: 7495, 7503 and 7513). We also identified CD3+CD4−CD8− subsets that expressed CD161 with or without GrB (IDs: 7515 and 7502) (Fig. 3e). These CD161+ cells may represent mucosal-associated invariant (MAIT) cells, which have a limited TCR repertoire and innate-like effector responses43.
CD3+ T cells in patients with newly diagnosed and R/R cHL.
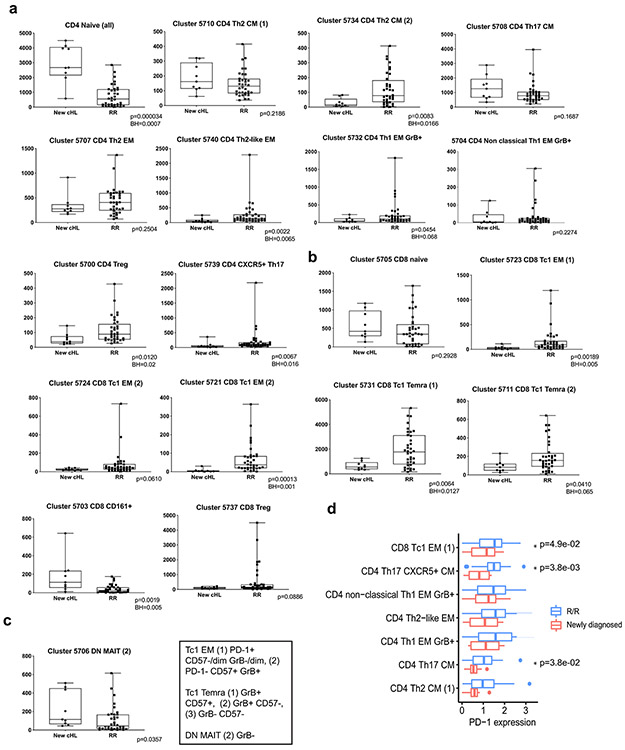
We similarly analyzed CD3+ PBMCs from patients with newly diagnosed and R/R cHL (at baseline) (Fig. 3f and g and Extended data Fig. 2b). Focusing again on the major clusters with at least 100 cells in ≥ 10% of samples, we identified comparable CD3+ subsets including CD4+ Th1 GrB+ PD-1+ cells (IDs: 5704 and 5732) (Fig. 3h). PD-1 was expressed on CD8+ (IDs: 5723 and 5724) and CD4+ EM cells (IDs: 5704, 5732 and 5740) with lower levels on CD4+ CM cells (ID: 5734) (Fig. 3h). We also detected a likely GrB− CD161+ MAIT-cell subset (ID: 5706) (Fig. 3h).
Comparative analyses of CD3+ clusters in healthy donors and patients with newly diagnosed and relapsed/refractory cHL.
The median cluster cell counts in healthy donors versus newly diagnosed patients (Extended data Fig. 3) and newly diagnosed versus R/R patients (Extended data Fig. 4) were calculated and displayed as comparison bar graphs (healthy donors vs. newly diagnosed cHL, Fig. 4a and newly diagnosed vs R/R cHL, Fig. 4b) with highlighted significant differences and relative levels of PD-1 expression (Fig. 4a and b, right panels).
In comparison to healthy donors, patients with newly diagnosed cHL had significantly fewer peripheral CD8+ naïve cells (p=0.0074) but similar numbers of CD4+ naïve cells (p=0.7664) (Fig. 4a and 4c and d, left panel). Although patients with newly diagnosed and R/R cHLs had similar numbers of peripheral CD8+ naïve cells (p=0.2928) (Fig. 4b and 4c, right panel), patients with R/R cHL had significantly fewer peripheral CD4+ naïve cells (p<0.0001) (Fig. 4b and 4d, right panel) and increased numbers of more differentiated CD4+ and CD8+ effector T-cell subsets that were largely PD-1+ with higher relative levels of PD-1 expression (Fig. 4b and Extended data Fig. 4d).
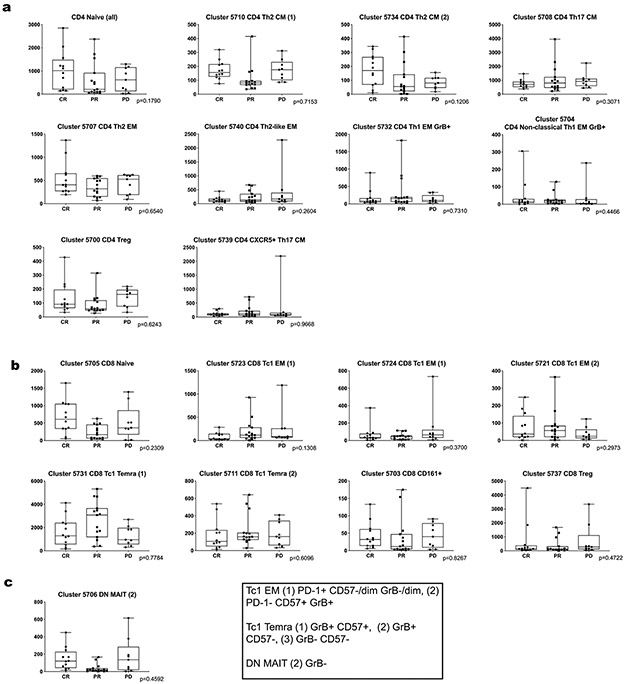
Given the decreased number of CD3+ naïve cells in patients with R/R cHL at baseline (Fig. 4c and d, right panels, and Extended data Fig. 5), we also assessed naïve T-cell numbers following PD-1 blockade (C4D1, Fig. 4e and f). Patients with higher numbers of naïve T-cells at C4D1 had more favorable responses to nivolumab treatment (C4D1 CD8+ naive T cells, CR>PR>PD p=0.012 [Fig. 4e] and C4D1 CD4+ naive T cells, CR>PR>PD p=0.021 [Fig. 4f]). These findings align with the response-related differences in TCR repertoire diversity and singleton clonal T-cell expansion during treatment (Fig. 1g and h and Fig. 2f, respectively) and likely reflect continued capacity to generate new immune responses.
CD3− cells in healthy donors, patients with newly diagnosed cHL and patients with R/R cHL
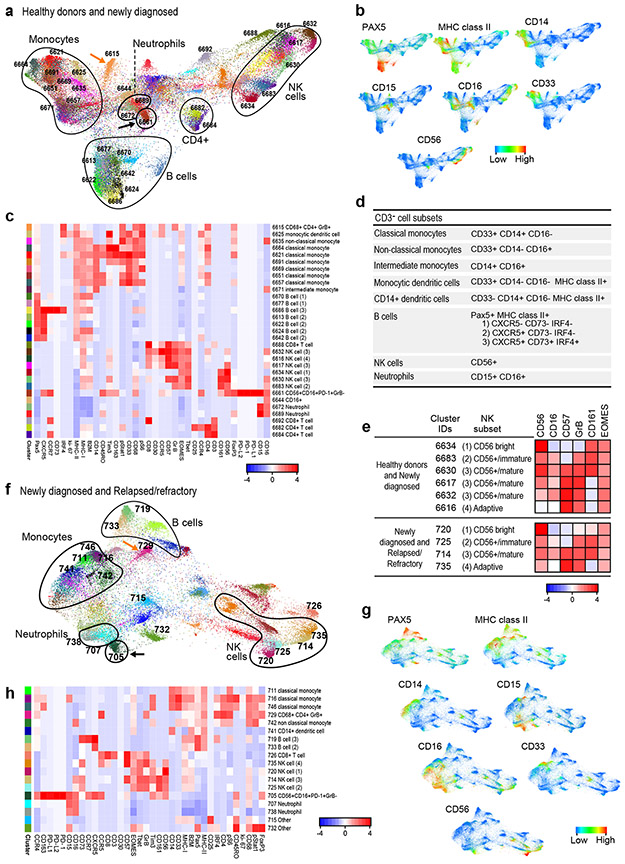
We similarly analyzed peripheral CD3− subsets, including B cells, monocytes and NK cells, with CyTOF. In healthy donors and patients with newly diagnosed cHL, the associated FDL included individual clusters arranged into larger groups of B cells (PAX5/MHC class II), monocytes (CD33/CD14/CD16) and NK cells (CD56) (Fig. 5a and b). The major clusters (≥ 100 cells in ≥ 10% of samples) were evaluated for the relative expression of CyTOF panel proteins (Fig. 5c) and defined by their phenotype (Fig. 5d and e): classical monocytes, CD33+CD14+CD16−; non-classical monocytes, CD33+CD14−CD16+; intermediate monocytes, CD14+CD16+; monocytic dendritic cells, CD33+CD14−CD16−MHC class II+; and neutrophils, CD15+CD16+44. B-cell clusters expressed PAX5 and MHC class II with or without CXCR5, CD73 and IRF4. NK-cell clusters were defined by the expression of CD56, 4 additional markers – CD16, CD57, GrB and CD161 – that reflected stages of NK cell differentiation (CD56bright, CD56+/immature, CD56+/mature and adaptive)45 and EOMES (Fig. 5d and e). We also detected a CD56+CD16+PD-1+GrB− cluster (ID: 6661) at a distance from other NK cell clusters on the FDL and a discrete CD3− CD68+CD4+GrB+ subset that lacked expression of other monocyte markers (ID: 6615) (Fig. 5a, c and d).
Figure 5. Analyses of circulating CD3− cells in healthy donors and patients with newly diagnosed or relapsed/refractory cHL.
(a) FDL of circulating CD3− cells from healthy donors and newly diagnosed patients with cHL. Every unique population (cluster) is labelled with a distinct color. (b) Major lineages in (a) defined by expression levels of key markers: Pax5, MHC class II (B cells); CD33, CD14, CD16, MHC class II (monocytes); and CD56, CD16 (NK cells). (c) Heatmap showing relative expression of CyTOF panel proteins in clusters with > 100 cells in ≥ 10% of samples from (a). (d) Markers used to identify major CD3− subsets. (e) Markers used to characterize NK stages of differentiation. (f) FDL of circulating CD3− cells from patients with newly diagnosed and relapsed/refractory cHL. (g) Major lineages in (f) defined by expression of the indicated markers (as in b). (h) Heatmap showing relative expression of CyTOF panel proteins in clusters with 100 cells in ≥ 10% of samples in (f). For inclusion in the analyses of CD3− clusters in healthy donors (n=11) and patients with newly diagnosed cHL (n=10) in (a), available specimens must have had 12000 sampled events. For inclusion in the analyses of CD3− clusters in patients with newly diagnosed cHL (n= 10) and relapsed/refractory cHL (n=35) in (f), available specimens must have had 7500 sampled events. One patient with relapsed/refractory cHL who had sufficient events for the analysis of CD3+ clusters in (Figure 3f) had <7500 CD3− sampled events and was excluded from the CD3− analysis in (f).
In patients with newly diagnosed and R/R cHL (at baseline) (Fig. 5f), the CD3− subsets were largely analogous to those in the healthy donors and newly diagnosed patients albeit with fewer B-cell and monocyte clusters (Fig. 5h). NK cell clusters with features resembling CD56bright, CD56+/immature, CD56+/mature and adaptive subsets were also identified (Fig 5e, f and h). As in healthy donors and newly diagnosed patients (Fig. 5a and c), we detected a CD56+CD16+PD-1+GrB− cluster (ID: 705) that was distinct from other NK subsets and a CD3− CD68+ CD4+ GrB+ subset (ID: 729) (Fig. 5f and h).
Comparative analyses of CD3− clusters in healthy donors and patients with newly diagnosed and relapsed/refractory cHL.
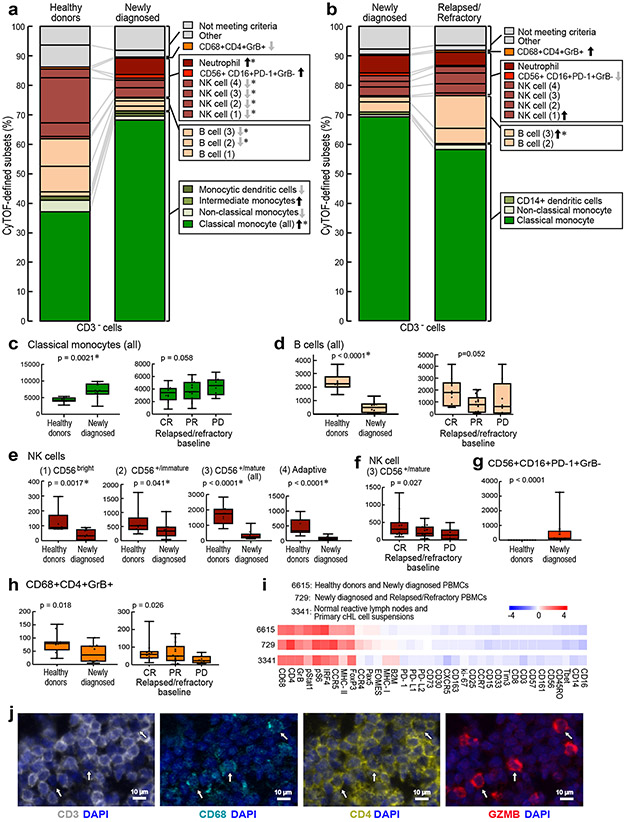
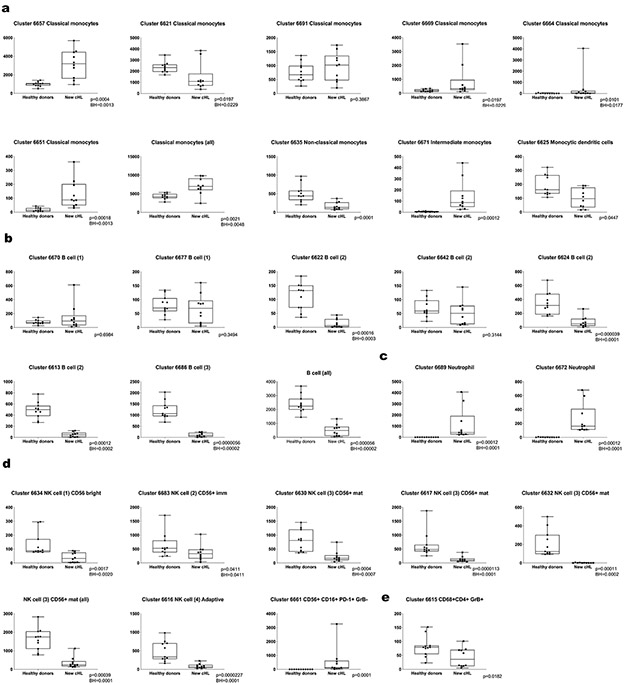
We next quantified the differences in abundance of the CD3− clusters in healthy donors versus newly diagnosed patients (Extended data Fig.6) and newly diagnosed versus R/R patients (Extended data Fig. 7) and displayed these data in comparison bar graphs (healthy donors versus newly diagnosed patients, Fig. 6a, and newly diagnosed versus R/R patients, Fig. 6b), with highlighted statistically significant differences. In comparison to healthy donors, patients with newly diagnosed cHL had expanded numbers of classical monocytes (Fig. 6a and Fig 6c, left panel, p=0.0021) and neutrophils (Fig. 6a and Extended data Fig. 6c), and a highly significant loss of B cells (Fig. 6a and Fig. 6d, left panel B cells (all), [p<0.0001]) and normal NK cells at all stages of differentiation (NK1, CD56bright [p=0.0017]; NK2, CD56+/immature [p= 0.041]; NK3, CD56+/mature (all) [p<0.0001]; and NK4, adaptive [p<0.0001]) (Fig. 6a and e). These circulating NK cell subsets were largely PD-1−, in contrast to a prior report46. Notably, the newly identified and potentially dysfunctional CD56+CD16+PD-1+GrB− cell population was absent in healthy donors and only detected in patients with newly diagnosed cHL (p=0.0001) (Fig. 6a and g). The CD3−CD68+CD4+GrB+ subset was significantly more abundant in healthy donors than in newly diagnosed patients (Fig. 6a and 6h, left panel, p=0.018).
Figure 6. Comparative analyses of CD3− clusters in healthy donors and patients with newly diagnosed and relapsed/refractory cHL.
The differences in abundance of the CD3− clusters in healthy donors versus newly diagnosed patients (a) and newly diagnosed versus relapsed/refractory patients (b) are displayed in comparison bar graphs with highlighted statistically significant differences (Wilcoxon rank sum test with nominal two-sided p-values ≤0.05). P-values that remain significant after Benjamini-Hochberg correction are noted (*). See also extended data Figs. 6a-d, 7a-d, 8a-d for exact p-values. (a) Healthy donors versus newly diagnosed patients. (b) Newly diagnosed patients versus patients with relapsed/refractory cHL. (c) Classical monocytes (all) at baseline in healthy donors versus newly diagnosed patients (left) and patients with cHL relapsed/refractory by BOR (right). (d) B cells (all) at baseline in healthy donors versus newly diagnosed patients (left) and patients with relapsed/refractory cHL by BOR (right). (e) NK cell subsets at baseline in healthy donors versus newly diagnosed patients. (f) CD56+/mature NK cells at baseline in patients with relapsed/refractory disease by BOR. (g) CD56+CD16+PD-1+GrB− subset at baseline in healthy donors versus newly diagnosed patients. (h) CD3−CD68+CD4+GrB+ subset at baseline in healthy donors versus newly diagnosed patients (left) and relapsed/refractory patients by BOR (right). Clusters with similar phenotypes, such as classical monocytes 6664, 6621, 6691, 6669, 6651 and 6657, were collapsed for these analyses. In panels c-h, differences between healthy and newly diagnosed groups were assessed by Wilcoxon rank sum test and Cuzick trend test was used to compare CRs, PRs and PDs. All tests were two-sided and equal variance was not assumed. Given the heterogeneity in CD3− cells, nominal p-values are provided for all individual cluster comparisons. Separate Benjamini-Hochberg corrections were performed in classical monocytes, B cells or NK cell groups; nominal p values that retain significance are noted (*). All box plots (generated in GraphPad Prism) define the 25th and 75th percentile and median values and whiskers for minimum and maximum values. (i) Full phenotype of the CD3−CD68+CD4+GrB+ clusters from PBMCs of healthy donors and newly diagnosed patients with cHL (ID 6615) and newly diagnosed and relapsed/refractory patients with cHL (ID 729) and normal reactive lymph nodes and primary cHL cell suspensions (ID 3341)31. (j) Multiparametric immunofluorescence of CD3, CD68, CD4 and Granzyme B with DAPI counterstain in one of the four examined biopsies of relapsed cHL. In this representative field of view, white arrows denote CD3−CD68+CD4+GrB+ cells, with an illustrative enlarged cell in the inset (left upper corner). For inclusion in the analyses of CD3− clusters in healthy donors (n=11) and patients with newly diagnosed cHL (n=10) in (a), available specimens must have had 12000 sampled events. For inclusion in the analyses of CD3− clusters in patients with newly diagnosed cHL (n=10) and relapsed/refractory cHL (n=35, [(CR n=12, PR n=15, PD n=8)] in (b), (c), (d), (e), (f), (g) and (h), available specimens must have had 7500 sampled events. One patient with newly diagnosed cHL who had sufficient numbers of CD3− sampled events in (a) had insufficient numbers of CD3+ sampled events and was excluded from the CD3+ analysis (in Fig. 3a). One patient with relapsed/refractory cHL had sufficient numbers of CD3+ sampled events for inclusion in (Fig. 3f) but had insufficient numbers of CD3− sampled events and was excluded from the CD3− analyses (b), (c), (d), (e), (f), (g) and (h).
There were less striking differences in the abundance of specific CD3− subsets when patients with newly diagnosed cHL were compared to the entire group with R/R disease (Fig. 6b). However, among patients with R/R cHL, baseline differences in the abundance of certain CD3− subsets were associated with subsequent response to PD-1 blockade. Specifically, patients with fewer circulating classical monocytes and more abundant B cells, mature NK cells and CD3−CD68+CD4+GrB+ cells had more favorable responses to PD-1 blockade (classical monocytes, CR<PR<PD p=0.058, Fig. 6c, right panel; B cells, CR>PR>PD p=0.052, Fig. 6d, right panel; CD56+/mature NK cells, CR>PR>PD p=0.027, Fig. 6f; and CD3−CD68+CD4+GrB+ cells, CR>PR>PD p=0.026, Fig. 6h, right panel and Extended data Fig. 8). Patients who achieved a CR to nivolumab had CD3− peripheral immune signatures that more closely resembled those of healthy donors (Fig. 6c-f, h), suggesting that the relative composition of circulating CD3− cells may be more important than the abundance of a single CD3− subtype35.
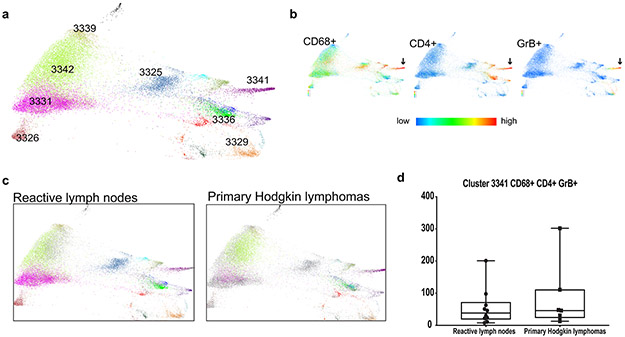
The peripheral immune signatures highlighted the potential role of 2 innate populations – NK cells and CD3−CD68+CD4+GrB+ cells – in the cytotoxic response to PD-1 blockade (Fig. 6f and Fig. 6h, right panel). As the circulating CD3−CD68+CD4+GrB+ subset was newly identified, we queried our earlier CyTOF analyses of primary cHLs31 and detected cells with the same phenotype in the inflammatory infiltrate (Fig. 6i and Extended data Fig. 9). These CD3−CD68+CD4+GrB+ cells also expressed IRF4, pSTAT1 and pS6, suggesting prior exposure to IFNγ (Fig. 6i). In complementary studies, we used multiparametric immunofluorescence to assess the presence and frequency of CD3−CD68+CD4+GrB+ cells in intact tumor biopsies from 4 additional patients with relapsed cHL (Fig. 6j); in these cases, 22.7% [+/−3.1], 11% [+/−1.3], 9.2% [+/− 1.2] and 2% [+/−1] of all CD68+ cells were CD3−CD4+GrB+. Together, these data define an additional innate GrB+ cell population associated with favorable response to PD-1 blockade in cHL (Fig. 6h-j).
Discussion
We used TCR sequencing and CyTOF analysis to define a peripheral immune signature associated with response to PD-1 blockade in patients with R/R cHL. To provide context, we similarly characterized the circulating immune signature in patients with newly diagnosed cHL and healthy donors. In comparison to healthy donors, patients with newly diagnosed cHL had a significantly reduced TCR repertoire; patients with R/R cHL had an even greater decrease in TCR diversity. In patients with R/R cHL who received nivolumab, bulk and CD4+-specific TCR diversity at baseline and during therapy were associated with response. Bases for the observed differences in TCR repertoire remain to be defined and potentially include disease activity and prior therapy. The current study is also limited to a single clinical trial cohort.
In comparison to healthy donors and patients with newly diagnosed cHL, those with R/R disease had significantly fewer peripheral CD3+ naive T cells and greater numbers of differentiated CD4+ and CD8+ effector cells that were largely PD-1+. Similar results – decreased numbers of circulating CD4+ and CD8+ naïve cells and increased percentages of differentiated effectors – have been described in certain solid tumors36. Previous studies revealed the limited capacity of terminally differentiated exhausted T cells to respond to PD-1 blockade due to a fixed epigenetic profile47,48. Additionally, emerging data suggests that stem-like T cells with low or no expression of checkpoint receptors are needed to respond to PD-1 blockade49-53. In our trial patients with cHL, PD-1 blockade was more effective in those who had a diverse peripheral TCR repertoire and an associated expansion of singleton T-cell clones during therapy.
Our findings align with those in patients with solid tumors whose responses to PD-1 blockade were more dependent upon the recruitment of novel T-cell clones than the further expansion of previously identified tumor-specific T cells53,54. In cHL, which has a high tumor mutational burden5 and a T-cell rich inflammatory infiltrate, PD-1 blockade may facilitate T-cell responses to new neoantigens.
After 6 weeks of PD-1 blockade, there was a highly significant increase in CD4+, but not CD8+, TCR diversity; additionally, these CD4+-selective changes were most striking in patients with the best responses (CRs) to treatment. These findings directly implicate the CD4+ T-cell axis in the response to PD-1 blockade in cHL. In this tumor with frequent MHC class I loss, CD4+ T cells may function directly as cytotoxic effectors. In this regard, we identified candidate circulating CD4+ cytotoxic T cells (CD4+ Th1 EM GrB+ PD1+ cells) that were more abundant in patients with R/R cHL than those with newly diagnosed disease.
However, our data also prompt speculation regarding CD4+ T-cell modulation of innate cytotoxic effectors. In comparison to normal healthy donors, patients with newly diagnosed cHL had significantly fewer circulating NK cells at all stages of differentiation. Among patients with R/R cHL, the relative abundance of mature NK cells was also associated with response to PD-1 blockade4,21. Previous studies highlighted the synergy between CD4+ T-cell and NK-cell anti-tumor responses55, the role of impaired CD4+ T-cells in NK-cell dysfunction and the benefit of PD-1 blockade in improving CD4+ T-cell/ NK-cell cooperation in part via enhanced IL-2 and IL-12 signaling56. In certain solid tumors, NK cell abundance was associated with more favorable responses to PD-1 blockade57.
In this study, we identified an additional circulating CD3−CD68+CD4+GrB+ subset that was associated with response to PD-1 blockade and detectable in the TME of relapsed cHLs. Human monocytes, like NK cells, may utilize granzyme B to destroy antibody (Ab)-coated targets via Ab-dependent cellular cytotoxicity (ADCC)58. As circulating B-cell abundance was also associated with response to PD-1 blockade in cHL, immunoglobulins directed against tumor antigens could promote ADCC of HRS cells by innate effectors59. Of importance, cHL patients with the most favorable responses to PD-1 blockade had coordinate CD3− peripheral immune signatures – increased circulating B cells, NK cells and CD68+GrB+ innate cells – more like those of healthy donors.
Taken together, our studies of the peripheral immune signature in cHL revealed potential complementary roles of newly expanded, clonally diverse CD4+ T cells and additional innate effectors in the response to PD-1 blockade. These new insights may lead to the identification of predictive biomarkers and additional rational therapeutic targets to evaluate in concert with PD-1 blockade in cHL and other tumors.
Online Methods
Patient samples
Baseline and on-treatment cryopreserved peripheral blood mononuclear cells (PBMCs) were obtained from patients with relapsed/refractory (R/R) cHL who received single-agent nivolumab in a multi-center, multi-cohort phase II trial, CheckMate 205 (ClinicalTrials.gov identifier: NCT02181738)8 and gave written informed consent. The IRB at each institution participating in the CheckMate 205 clinical trials8 approved the banking of PBMC samples for associated research studies. The Dana-Farber Cancer Institute IRB also approved the laboratory research studies. CheckMate 205 included patients with R/R cHL who previously underwent autologous stem-cell transplantation (ASCT) and received: no brentuximab vedotin (BV) (Cohort A); BV after ASCT (Cohort B); or BV before and/or after ASCT (Cohort C). Patients were treated with nivolumab 3 mg/kg every 2 weeks until disease progression or unacceptable toxicity. Best overall response (BOR) and PFS were assessed by an independent review committee (IRC) using 2007 International Working Group response criteria8. Cryopreserved PBMCs were also obtained from: 1) patients with newly diagnosed, previously untreated cHL, with informed consent; and 2) normal healthy donors (Supplementary Table 1). Samples from normal healthy donors were obtained under an umbrella protocol for otherwise discarded anonymized tissues.
Peripheral blood samples were collected in 8 mL Vacutainer® Cell Preparation Tubes and PBMCs were isolated by centrifugation and cryopreserved for subsequent T-cell receptor (TCR) sequencing and CyTOF analysis.
CD4+ and CD8+ cell separation of PBMCs
In cases with an additional available PBMC sample, purified unmanipulated CD4+ and CD8+ cells were obtained from the bulk PBMCs by negative selection using Miltenyi Biotec separation kits: CD4+ T cell isolation (includes anti- CD8, CD14, CD15, CD16, CD19, CD36, CD56, CD123, TCR gamma/delta and CD235a biotin-conjugated monoclonal antibodies, #130-096-533) and CD8+ T cell isolation (includes anti- CD4, CD14, CD15, CD16, CD19, CD36, CD56, CD123, TCR gamma/delta and CD235a biotin-conjugated monoclonal antibodies, #130-096-495). Cryopreserved cells were partially thawed and resuspended in warmed RPMI media supplemented with FBS (1:1 v/v). To remove large clumps and ensure a single cell suspension, cells were passed through a 70 μm cell strainer. The cell suspension was split into 2 tubes (a) and (b) and washed by centrifugation (300g x 5 min). The supernatants were aspirated and pellets were resuspended in 40 μL of cold Miltenyi buffer (1:20 BSA stock (#130-091-376) diluted with AutoMACS rinsing solution (#130-091-222)). Ten microliters of CD4+ negative selection, biotin-conjugated antibody cocktail or CD8+ negative selection, biotin-conjugated antibody cocktail was added to the cell suspension (tube (a) or (b), respectively). Samples were mixed well and refrigerated for 5 min. Next, 30 μL of Miltenyi buffer was added followed by 20 μL of the appropriate microbeads (tube (a) or (b), respectively). Samples were again mixed well and refrigerated for 10 min.
Isolation of highly pure CD4+ or CD8+ T cells was achieved by depletion of magnetically labelled cells. Specifically, LS columns (Miltenyi Biotec #130-042-401) were placed in a quadroMACS separator magnet (Miltenyi Biotec) and rinsed with 3 mL of Miltenyi buffer. Each cell suspension was supplemented to 500 μL and added to a rinsed column (1 column per sample) and flow through was collected into a new tube. The column was then washed with 3 mL of buffer and combined with cell suspension effluent.
T Cell Receptor sequencing and repertoire analysis
Genomic DNA was extracted from unsorted bulk PBMC samples and the negatively selected CD4+ (CD8+-depleted) and CD8+ (CD4+-depleted) cell subsets using the commercially available Qiagen DNAesy kit #69506 and subsequently subjected to T cell receptor (TCR) sequencing. TCR beta chain CDR3 regions were sequenced by ImmunoSeq™ (Adaptive Biotechnologies, Seattle, WA), using multiplex PCR with primers annealing to V and J segments, resulting in amplification of rearranged VDJ segments from each cell. By comparing to a synthetic immune receptor repertoire, amplification biases were identified and minimized, and residual bias were computationally removed after sequencing60. A list of TCR sequences and their copy numbers/counts () was then generated.
TCR-seq results were analyzed by custom Python scripts, which compute the Shannon entropy index (H) for repertoire diversity, reflecting both richness and evenness of the repertoire61. For any repertoire , we defined the Shannon entropy diversity index by:
Unsorted T cells and sorted CD4+ and CD8+ T cells were analyzed separately, except where “CD4+ and CD8+” analyses are indicated in the manuscript. For “CD4+ and CD8+” analyses, the CD4+ and CD8+ TCR sequences were combined in silico. The changes in TCR repertoire diversity over time were measured from C1D1 (baseline) to C4D1 and evaluated in paired samples using Wilcoxon tests. For a subset of 9 trial patients with previously determined HRS cell expression of MHC class I and II4, changes in TCR diversity were separately evaluated according to HRS MHC class I and II status.
Clonal expansion following PD-1 blockade
To measure the level of clonal expansion after immunotherapy, we computed the fold change of the clonal frequency before (C1D1) and after the treatment (C2D1 and C4D1). For every clone in each patient, we defined the clonal expansion level , was the clonal frequency in each repertoire for clones of the same TCR beta chain protein sequence. If a clone could not be detected in the sample prior to treatment (C1D1) but was observed at C2D1 or C4D1, we added a pseudo count 0.5 at C1D1 to avoid division by zero. We defined a 2-fold (E ≥ 2) increase at any timepoint after treatment in a given clonotype as T cell expansion. Singleton clones were defined as having 0 or 1 copy at C1D1 whereas non-singleton clones had 2 or more copies at C1D1.
Clonal expansion was first evaluated by tracing clones of the same protein sequence in unsorted T cells. Next, using data from the sorted CD4+ and CD8+ T cells, we annotated the origin of expanded clones as CD4+, CD8+, or unknown depending on the presence of the same protein sequence in sorted T cells of the same patient. The same computational procedure was applied to all clones in the unsorted T-cell samples, allowing estimation of the relative proportion of expanded CD4+ or CD8+ T cells over the specific population in Extended data Fig. 1k and l and Fig. 2g.
Antibodies
Mass cytometry antibodies and reporter isotopes are included in Supplemental Table 2 and described in Cader et al31.
CyTOF Sample Preparation
Samples were prepared and stained as previously described31. In brief, individual samples were rapidly thawed and assayed for viability31. Thereafter, cells were washed, resuspended in cell-staining media, and incubated with human FcR blocking reagent and, subsequently, the surface antibody cocktail31. After washing and permeabilization, samples were incubated with the intracellular antibody cocktail, washed and treated with the DNA intercalator, as described31. After additional washes, cells were resuspended at a concentration of 1x10⁶ cells/ml in deionized water containing calibration beads31.
Mass cytometry data analysis
CyTOF data acquisition is described in detail in Cader et al31. CyTOF analyses of trial patient samples were performed blinded to clinical parameters.
Analyses of T-cell differentiation.
Using the Cytobank platform, we first manually gated the CyTOF data from cHL trial patients to identify viable, singlet cells and then all CD3+ cells, CD3+CD4+ and CD3+CD8+ T cell subsets. CD4+CD8+ and CD4−CD8− cells were excluded. Thereafter, all T cells, CD4+ T cells and CD8+ T cells were evaluated for differentiation status based on CCR7 and CD45RO expression - naïve (CCR7+ CD45RO−), central memory (CCR7+CD45RO+), effector memory (CCR7−CD45RO+), or TEMRA (CCR7−CD45RO−).
VorteX clustering and visualization.
The Cytobank platform was used for bead-based normalization, identification of viable singlets and selection of relevant populations to export31. An equivalent number of single cells from each sample were imported into the VorteX visualization environment and clustered with the algorithm, X-shift (version ‘VorteX 26-Apr-2018’) as previously described31,42 Seven separate X-shift analyses were performed: (1) CD3+ cells and (2) CD3− cells from healthy donors and patients with newly diagnosed cHL, sampling 12000 events; (3) CD3+ cells and (4) CD3− cells from patients with newly diagnosed and R/R cHL, sampling 7500 events, and (5) CD3+ cells and (6) CD3− cells from all cases, sampling 7500 events. Lastly, (7) CD3− cells from a previous CyTOF analysis of normal reactive lymph nodes and primary cHL suspensions31 were reanalyzed, sampling 4500 events based on available cell counts from the smallest specimen.
For analyses (3) and (4), only patients with R/R cHL who initiated PD-1 blockade > 12 months from completion of ASCT were included. Data interpretation for analyses (5) and (6) was restricted to patients with a greater than 12 months interval between their prior myeloablative ASCT and study therapy (nivolumab) who had paired Cycle 1 Day 1 (C1D1) and Cycle 4 Day 1 (C4D1) samples.
For the CD3− cell analysis, all antibody channels were used to perform the clustering in the viable singlet population. For the CD3+ cell analysis, all antibody channels except PAX5, CD163, CD14, CD33 and CD68 were used.
Force-directed layouts and heatmaps.
After X-shift analysis, a randomly sampled proportional number of events from each sample were visualized in a force-directed layout (FDL) in which similar clusters were more closely aligned in 2-dimensional space as previously described31. Each cluster was assigned a unique color with hex color code software (http://www.color-hex.com). The protein expression profiles of each cluster were visualized in a heatmap as previously described31. In brief, median protein expression levels were collated in an overall expression matrix which was then normalized into z-scores (−4 to +4) in R (scale function) and bi-directionally clustered using “pheatmap” package31. Clusters were phenotypically labeled using known lineage, differentiation and polarization markers31. We applied an inclusion criteria of at least 100 events in each cluster in a minimum of 10% of samples.
To quantify the immune clusters in healthy donors, patients with newly diagnosed cHL and patients with R/R cHL at baseline, we calculated the median cluster cell counts in each group. We further subdivided patients with R/R cHL at baseline and C4D1 according to BOR to nivolumab therapy.
Comparative analysis of PD-1 expression.
In each analyzed sample, PD-1 expression was calculated as the median PD-1 level for all cells in the associated VorteX cluster. Z-score normalized PD-1 expression values for each CD3+ cluster were determined and included in Fig. 4. From the analysis in Fig. 4b, T-cell subsets from patients with newly diagnosed or R/R cHL were separately evaluated for PD-1 expression (Extended data Fig. 4d). The differences in PD-1 expression in T-cell subsets from patients newly diagnosed and R/R cHL were measured by the Wilcoxon rank sum test with two-sided p-values.
Statistical Methods
In TCRseq analyses, we reported two-sided p-values for bulk T-cell analyses and one-sided p-values for CD4+ and CD8+ T-cell analyses as the bulk data provided directions for the subsequent CD4+ and CD8+ comparisons.
Distributions for each CyTOF-defined cluster in CD3+ and CD3− populations were represented as median and inner quartile range with individual data points displayed. In cHL patients, associations with disease status (newly diagnosed, R/R) and response groups (CR>PR>PD) were assessed with a Wilcoxon rank-sum test or a Cuzick trend test62 for ordinal response categories. Nominal p-values were reported for exploratory or supplemental analyses; p-values <0.05 were considered statistically significant. A Benjamini-Hochberg correction63 was used to control the false discovery rate (FDR) in CD3+ (CD4+ and CD8+) cell types. Given the heterogeneity in CD3− cells, we provide nominal p-values for all individual cluster comparisons. Separate Benjamini-Hochberg corrections were performed to control for FDR within classical monocytes, B cells or NK cell groups. Statistical analyses were performed using R (version 3.3.2). All tests were two-sided and equal variance was not assumed.
Immunohistochemical analyses of formalin-fixed paraffin-embedded (FFPE) samples.
Sample acquisition.
Additional formalin-fixed, paraffin-embedded (FFPE) lymph node biopsies from patients with cHL who relapsed following ABVD induction therapy were obtained from the archives of Brigham & Women’s Hospital, Boston, MA, with institutional review board approval (2014P001721). Hematoxylin & eosin-stained tissue sections and the original diagnostic reports were reviewed by an expert hematopathologist (S.J.R.).
Multiplex Immunofluorescence.
Multiplex Immunofluorescent staining and analysis was performed as previously described on a Bond RX autostainer 30,64. Five-micron thick FFPE tissue sections were deparaffinized (Bond DeWax, Leica Biosystems) and rehydrated per standard protocols. Antigen retrieval was performed (ER1, Leica Biosystems) at pH 6 for 10 minutes at 98C. Slides were next serially stained with antibodies (40 minutes per antibody). Anti-rabbit Polymeric Horseradish Peroxidase (Poly-HRP, BOND Polymer Refine Detection Kit, Leica Biosystems) was then applied for 10 minutes. Signal for antibody complexes were then labeled and visualized with corresponding Opal Fluorophore Reagents (5 minute incubations). The same process was repeated for subsequent antibodies/ fluorescent dyes. Finally, Prolong Diamond Anti-fade mounting medium (#P36965, Life Technologies) was applied and the stained slides were stored in a light-proof box at 4 °C before imaging.
The target antigens, antibody clones, and dilutions for markers used in this analysis are included in Supplemental Table 3.
Image acquisition and cell Identification.
Image acquisition was performed using the Mantra multispectral imaging platform (PerkinElmer, Hopkinton, MA). Areas with non-tumor or residual normal tissue were excluded from the analysis. Representative regions of interest were chosen by the pathologist (S.J.R.), and 3-5 fields of view (FOVs) were acquired at 20x resolution as multispectral images. After image capture, the FOVs were spectrally unmixed and then analyzed using supervised machine learning algorithms within Inform 2.4 (PerkinElmer). Thresholds for positive staining and the accuracy of phenotypic algorithms were optimized and confirmed for each case.
Extended Data
Extended Data Figure 1. Analyses of peripheral TCR repertoire diversity at baseline and following PD-1 blockade.
a) Number of prior therapies in trial patients who were treated with nivolumab ≥ 1 yr after ASCT by best overall response to PD-1 blockade (CR n=14, PR n=18, PD n=12). b) Percentages of CD3+ and CD3− viable cells at baseline in trial patients with relapsed/refractory cHL. Viable singlet cells identified by manual gating of CyTOF data were divided according to CD3 expression (CD3−, grey and CD3+, orange, n=38). Individual samples from patients with available CyTOF files who had relapsed/refractory cHL with ≥ 1 year between nivolumab and prior myeloablative ASCT are shown (n=38) (CR n=13, PR n=15, PD n=10). c) Comparison of baseline CD3+ populations in trial patients with relapsed/refractory cHL (from b) according to their subsequent response to PD1 blockade d) Total number of TCR-seq detected clones at baseline in trial patients (from a) according to their subsequent response to PD1 blockade. e) Percentages of CD4+ (blue) and CD8+ (purple) cells at baseline in trial patients with relapsed/refractory cHL. CD3+ cells identified (from b) and divided according to CD4+ or CD8+ expression by manual gating of CyTOF data. Additional cryopreserved samples from indicated cases (*) were available for CD4+ and CD8+ sorting (n=18, 2 excluded from this analysis as no CyTOF files available). f) Comparison of baseline CD4+ populations in all trial patients with relapsed/ refractory cHL (from e) according to their subsequent response to PD1 blockade (CR, PR, PD). g) Comparison of baseline CD4+ populations in trial patients with relapsed/refractory cHL (from e*) with additional PBMC samples sorted for CD4+ and CD8+ T cells (n=18). h) Total numbers of CD4+ and CD8+ TCR-seq detected clones at baseline in trial patients (from g) according to their subsequent response to PD-1 blockade. Differences between groups in panels a, c, d, f, g and h were assessed with a Wilcoxon rank sum test of the median with two-tailed p values. i) Changes in TCR diversity from C1D1 to C4D1 in the subset of trial patients with known HRS cell expression of MHC class I and MHC class II and CD4+ and CD8+ TCRseq data (n=9). Definitions of positive (positive or decreased) and negative expression of MHC class I and class II on HRS cells previously described in (Roemer et al 20184). j) Changes in TCR diversity from C1D1 to C4D1 separated by HRS cell expression of MHC class II only, samples from h. Differences in panels i and j were assessed by Wilcoxon rank sum test with one-sided p-values. k) The ratio of maximum expansion of singleton clones (0 or 1 copy at baseline)/ non-singleton clones which have 2 or more copies at baseline in patients with BOR of CR (n=9), PR (n=17) or PD (n=8) to PD-1 blockade. Only patients with all 3 timepoints are included in the analysis. Differences between groups were assessed with a Wilcoxon rank sum test of the median, two-tailed p values. (l and m) The ratio of expanded singleton / non-singleton clones from CD4+ only T cells (l) or CD8+ only T cells (m) from patients with CR, PR or PD to PD-1 blockade (n=20). Differences in panels l and m were assessed by Wilcoxon rank sum test with one-sided p-values. Graphpad Prism (v8) or R (ggplot function) was used to generate box plots (GraphPad Prism panels b, c, e-g and R panels a, d, h-m). The box corresponds to the first and third quartiles and whiskers define minimum and maximum values. Outliers beyond 1.5x IQR in R- generated plots are plotted individually.
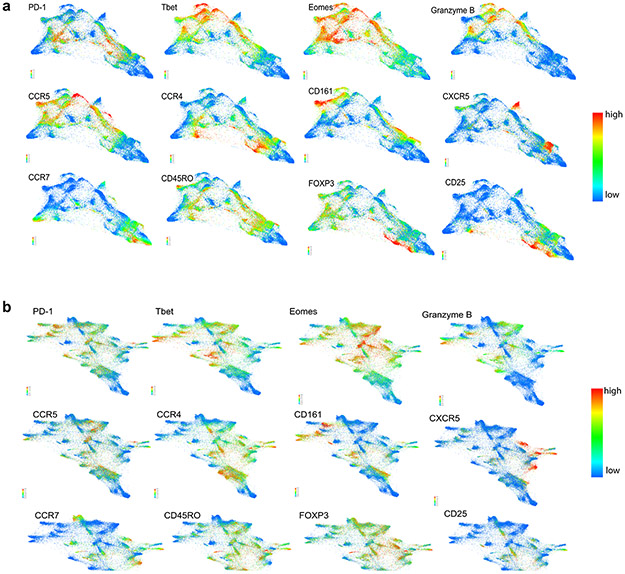
Extended Data Figure 2. Forced-directed layout of CD3+ populations at baseline in a) healthy donors and patients with newly diagnosed cHL and b) patients with newly diagnosed and relapsed/refractory cHL.
Each FDL shows expression of individual proteins ranging from no/low expression in blue to high expression in red. Clusters can be assigned a phenotype on the basis of these FDLs. Shown here are 12 proteins which allow identification of differentiation status (CCR7, CD45RO), polarization (CCR5, CCR4, CD161), activation (PD-1, T-bet, Eomes, Granzyme B), Tregs (FoxP3, CD25) and CXCR5+ cells.
Extended Data Figure 3. Comparison of CD3+ populations in healthy donors versus patients with newly diagnosed cHL.
To quantify differences between these 2 groups, healthy donors (n=11) and patients with newly diagnosed cHL (n=9), we determined the number of cells that each sample contributed to a given cluster and applied a Wilcoxon rank sum test with two-sided p-values. Nominal p-values with Benjamini-Hochberg (BH) corrections for p≤0.05 (CD4+ and CD8+ cells separately). Shown here graphically are box plots (generated in GraphPad Prism) defining the 25th and 75th percentile and median values and whiskers for minimum and maximum values: a) CD4+ clusters; b) CD8+ clusters; and c) CD3+CD4−CD8− subsets.
Extended Data Figure 4. Comparison of CD3+ populations in patients with newly diagnosed cHL versus relapsed/refractory cHL (all) at baseline.
To quantify differences between these 2 groups, newly diagnosed cHL (n=9) and relapsed/refractory cHL (n=36), we determined the number of cells that each sample contributed to a given cluster and applied a Wilcoxon rank sum test with two-sided p-values. Nominal p-values with Benjamini-Hochberg corrections for p≤0.05 (CD4+ and CD8+ cells separately). ). Shown here graphically are box plots (generated in GraphPad Prism) defining the 25th and 75th percentile and median values and whiskers for minimum and maximum values: a) CD4+ clusters; b) CD8+ clusters; and c) CD3+CD4−CD8− subsets. d) PD-1 expression on CD3+ T cell clusters identified by Vortex in patients with newly diagnosed cHL vs. relapsed/refractory disease. Only clusters with z-score normalized PD-1 expression greater than 0 (ie. greater than the mean) in the PD-1 columns in the Figure 3h heat-maps are shown. The differences in PD-1 expression in T-cell subsets from patients with newly diagnosed and relapsed/refractory cHL were measured by the Wilcoxon rank sum test with two-sided p-values, significance denoted by asterisks.
Extended Data Figure 5. Comparison of CD3+ populations in patients with relapsed/refractory cHL at baseline split by best overall response to subsequent PD-1 blockade (CR, PR, PD).
To quantify differences between these groups, (CR n=12, PR n=15, PD n=9) we determined the number of cells that each sample contributed to a given cluster and applied a Cuzick trend test (two-sided nominal p-values). Shown here graphically are box plots (generated in GraphPad Prism) defining the 25th and 75th percentile and median values and whiskers for minimum and maximum values: a) CD4+ clusters; b) CD8+ clusters; and c) CD3+CD4−CD8− subsets.
Extended Data Figure 6. Comparison of CD3− populations in healthy donors versus patients with newly diagnosed cHL.
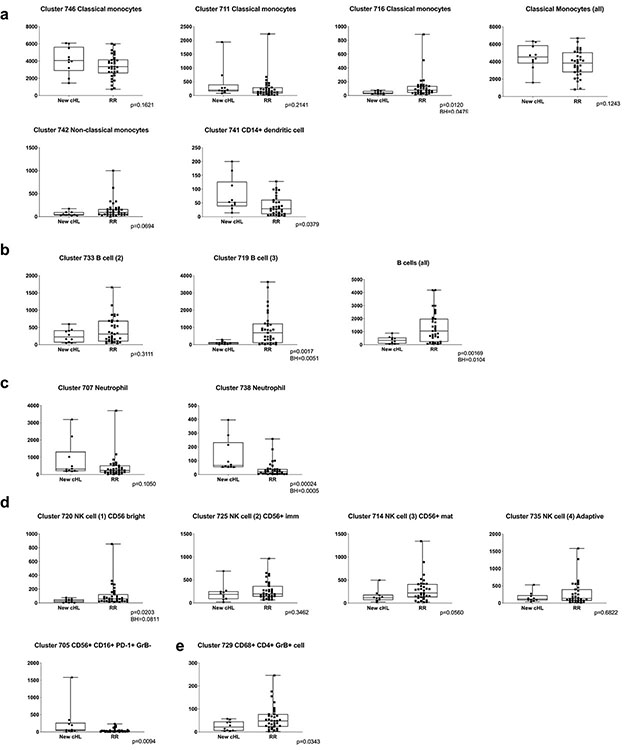
To quantify differences between these 2 groups, patients with newly diagnosed cHL (n=10) and relapsed/refractory cHL (n=35), we determined the number of cells that each sample contributed to a given cluster and applied a Wilcoxon rank sum test (two-sided nominal p-values) with Benjamini-Hochberg (BH) corrections for p ≤ 0.05 (Classical Monocytes, Neutrophils, B cells and NK cells separately). One patient with newly diagnosed cHL who had sufficient numbers of CD3− sampled events in Extended Data Figures 6-8 had insufficient numbers of CD3+ sampled events and was excluded from the CD3+ analysis in Extended Data Figures 3-5). One patient with relapsed/refractory cHL had sufficient numbers of CD3+ sampled events for inclusion in Extended Data Figures 4-5 but had insufficient numbers of CD3− sampled events and was excluded from the CD3− analyses in Extended Data Figures 6-8. Shown here graphically are box plots (generated in GraphPad Prism) defining the 25th and 75th percentile and median values and whiskers for minimum and maximum values: a) Monocyte clusters; b) B cell clusters [(1) CXCR5− CD73− IRF4−, (2) CXCR5+ CD73−IRF4−, (3)CXCR5+ CD73+ IRF4+] ; c) Neutrophils; d) NK cell clusters and e) CD68+CD4+GrB+ cells.
Extended Data Figure 7. Comparison of CD3− populations in patients with newly diagnosed cHL versus relapsed/refractory cHL (all) at baseline.
To quantify differences between these 2 groups, patients with newly diagnosed cHL (n=10) and relapsed/refractory cHL (n=35), we determined the number of cells that each sample contributed to a given cluster and applied a Wilcoxon rank sum test (two-sided nominal p-values) with Benjamini-Hochberg (BH) corrections for p ≤ 0.05 (Classical Monocytes, Neutrophils, B cells and NK cells separately). Shown here graphically are box plots (generated in GraphPad Prism) defining the 25th and 75th percentile and median values and whiskers for minimum and maximum values: a) Monocyte clusters; b) B cell clusters [(2) CXCR5+ CD73−IRF4−, (3) CXCR5+ CD73+ IRF4+]; c) Neutrophils; d) NK cell clusters and e) CD68+CD4+GrB+ cells.
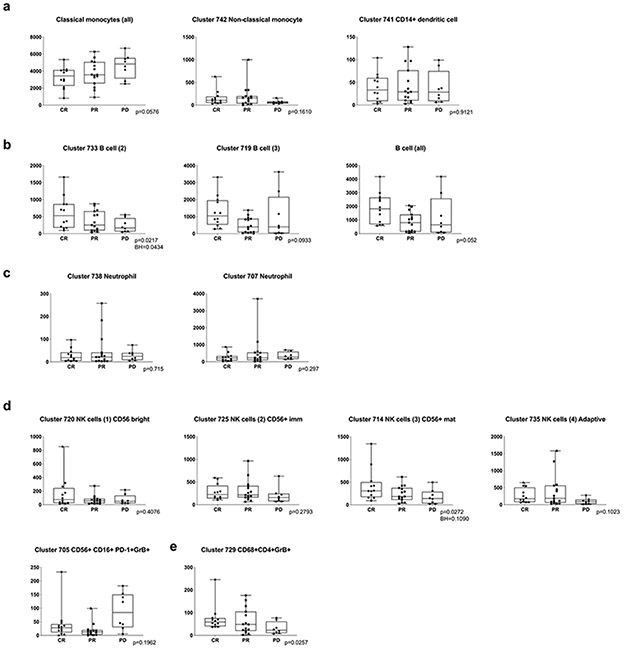
Extended Data Figure 8. Comparison of CD3− populations in patients with relapsed/refractory cHL split by best overall response at baseline (CR, PR, PD).
To quantify differences between these groups (CR n=12, PR n=15, PD n=8), we determined the number of cells that each sample contributed to a given cluster and applied Cuzick trend test (two-sided nominal p-values) with Benjamini-Hochberg (BH) corrections for p ≤ 0.05 (B cells and NK cells separately). Shown here graphically are box plots (generated in GraphPad Prism) defining the 25th and 75th percentile and median values and whiskers for minimum and maximum values: a) Monocyte clusters; b) B-cell clusters [(2) CXCR5+ CD73−IRF4−, (3) CXCR5+ CD73+ IRF4+]; c) Neutrophils; d) NK-cell clusters and e) CD68+CD4+GrB+ cells.
Extended data Figure 9. CyTOF analyses of CD3− cell populations from viable singlet cells from 7 primary cHLs and 10 reactive lymph nodes/tonsils from31.
a) Force-directed layouts generated from X-shift analysis within VorteX visualization environment by sampling 4500 events from each sample and pooling resulting events together prior to clustering. The X-shift algorithm clusters events according to similarities in expression of CyTOF panel proteins, grouping events with shared lineage, differentiation and polarization within the pool. Every identified unique population is labeled with a specific color based on the Hex color code. b) Expression of CD68, CD4 and Granzyme B across all samples. c) Separate force-directed layouts (FDLs) of reactive lymph node and primary cHL cell suspensions. In each FDL, the events pertaining to the group of interest retain their Hex color code. Events belonging to the other group are represented in grey. d) Comparison of CD3−CD68+CD4+GrB+ Cluster 3341 between reactive lymph nodes and primary cHLs. Shown here graphically are box plots (generated in GraphPad Prism) defining the 25th and 75th percentile and median values and whiskers for minimum and maximum values. To quantify differences between these 2 groups, we determined the number of cells that each sample contributed to a given cluster and applied a Wilcoxon rank sum test with two-sided p-values.
Supplementary Material
Acknowledgements
This work was supported in part by Bloodwise Fellowship 14042 and a Helen Gurley Brown Fellowship (F.Z.C.), a R01 CA161026 (M.A.S), the Miller Family Fund (M.A.S), the BMS International Immuno-Oncology Network (M.A.S. and S.J.R.) and a R01 CA234018 (X.S.L.). The authors thank Lindy Boyne (Dana-Farber Cancer Institute) for providing editorial assistance.
Footnotes
Competing Interests Statement
After completing the current studies at DFCI, F.Z.C. and X.H. became full-time employees at Astra Zeneca and GV20, respectively. P.A. consults for Merck, Bristol Myers Squibb (BMS), Pfizer, Affimed, Adaptive, Infinity, ADC Therapeutics, Celgene and receives institutional research funding from Merck, BMS, Affimed, Adaptive, Roche, Tensha, Otsuka, Sigma Tau, Genentech, IGM and honoraria from Merck and BMS. S.J.R. has received research funding from BMS, Merck, Affimed and Kite/Gilead. X.S.L. is a cofounder and board member of GV20 Oncotherapy, SAB of 3DMedCare, consultant for Genentech, and stockholder of BMY, TMO, WBA, ABT, ABBV, and JNJ. M.A.S. has received research funding from BMS, Merck and Bayer and has served on advisory boards for BMS and Celgene. The remaining authors declare no competing financial interests.
Data Availability Statement
The TCR sequences for this study were processed through the immunoSEQ platform of Adaptive Biotechnologies. The TCR sequences are publicly available (DOI: 10.21417/FZC2020NM) through this link https://adaptivebiotech.com/pub/cader-2020-nm. The raw CyTOF.fcs files are publicly available through login at Cytobank, https://premium.cytobank.org/cytobank/experiments#project-id=2539 and https://premium.cytobank.org/cytobank/experiments/310927. Source data for all main and extended data figures are available in the Supplementary Dataset.
Code Availability Statement
CyTOF data was processed by VorteX (26-Apr-2018) and the output was processed by a custom R script. TCRseq data was processed and analyzed by custom Python and R scripts. The codes are available at https://github.com/huxihao/cHL-PBMC.
References
- 1.Mathas S, Hartmann S & Kuppers R Hodgkin lymphoma: Pathology and biology. Semin Hematol 53, 139–147 (2016). [DOI] [PubMed] [Google Scholar]
- 2.Green MR, et al. Integrative analysis reveals selective 9p24.1 amplification, increased PD-1 ligand expression, and further induction via JAK2 in nodular sclerosing Hodgkin lymphoma and primary mediastinal large B-cell lymphoma. Blood 116, 3268–3277 (2010). [DOI] [PMC free article] [PubMed] [Google Scholar]
- 3.Roemer MG, et al. PD-L1 and PD-L2 Genetic Alterations Define Classical Hodgkin Lymphoma and Predict Outcome. J Clin Oncol 34, 2690–2697 (2016). [DOI] [PMC free article] [PubMed] [Google Scholar]
- 4.Roemer MGM, et al. Major Histocompatibility Complex Class II and Programmed Death Ligand 1 Expression Predict Outcome After Programmed Death 1 Blockade in Classic Hodgkin Lymphoma. J Clin Oncol 36, 942–950 (2018). [DOI] [PMC free article] [PubMed] [Google Scholar]
- 5.Wienand K, et al. Genomic analyses of flow-sorted Hodgkin Reed-Sternberg cells reveal complementary mechanisms of immune evasion. Blood Adv 3, 4065–4080 (2019). [DOI] [PMC free article] [PubMed] [Google Scholar]
- 6.Wherry EJ & Kurachi M Molecular and cellular insights into T cell exhaustion. Nat Rev Immunol 15, 486–499 (2015). [DOI] [PMC free article] [PubMed] [Google Scholar]
- 7.Ansell SM, et al. PD-1 blockade with nivolumab in relapsed or refractory Hodgkin's lymphoma. N Engl J Med 372, 311–319 (2015). [DOI] [PMC free article] [PubMed] [Google Scholar]
- 8.Armand P, et al. Nivolumab for Relapsed/Refractory Classic Hodgkin Lymphoma After Failure of Autologous Hematopoietic Cell Transplantation: Extended Follow-Up of the Multicohort Single-Arm Phase II CheckMate 205 Trial. J Clin Oncol 36, 1428–1439 (2018). [DOI] [PMC free article] [PubMed] [Google Scholar]
- 9.Armand P, et al. Programmed Death-1 Blockade With Pembrolizumab in Patients With Classical Hodgkin Lymphoma After Brentuximab Vedotin Failure. J Clin Oncol 34, 3733–3739 (2016). [DOI] [PMC free article] [PubMed] [Google Scholar]
- 10.Chen R, et al. Phase II Study of the Efficacy and Safety of Pembrolizumab for Relapsed/Refractory Classic Hodgkin Lymphoma. J Clin Oncol 35, 2125–2132 (2017). [DOI] [PMC free article] [PubMed] [Google Scholar]
- 11.Shi Y, et al. Safety and activity of sintilimab in patients with relapsed or refractory classical Hodgkin lymphoma (ORIENT-1): a multicentre, single-arm, phase 2 trial. Lancet Haematol 6, e12–e19 (2019). [DOI] [PubMed] [Google Scholar]
- 12.Song Y, et al. Treatment of relapsed or refractory classical Hodgkin lymphoma with the anti-PD-1, tislelizumab: results of a phase 2, single-arm, multicenter study. Leukemia 34, 533–542 (2020). [DOI] [PMC free article] [PubMed] [Google Scholar]
- 13.Song Y, et al. A single-arm, multicenter, phase 2 study of camrelizumab in relapsed or refractory classical Hodgkin lymphoma. Clin Cancer Res 25, 7363–7369 (2019). [DOI] [PubMed] [Google Scholar]
- 14.Merryman RW, Armand P, Wright KT & Rodig SJ Checkpoint blockade in Hodgkin and non-Hodgkin lymphoma. Blood Adv 1, 2643–2654 (2017). [DOI] [PMC free article] [PubMed] [Google Scholar]
- 15.Ramchandren R, et al. Nivolumab for Newly Diagnosed Advanced-Stage Classic Hodgkin Lymphoma: Safety and Efficacy in the Phase II CheckMate 205 Study. J Clin Oncol 37, 1997–2007 (2019). [DOI] [PMC free article] [PubMed] [Google Scholar]
- 16.Tumeh PC, et al. PD-1 blockade induces responses by inhibiting adaptive immune resistance. Nature 515, 568–571 (2014). [DOI] [PMC free article] [PubMed] [Google Scholar]
- 17.Im SJ, et al. Defining CD8+ T cells that provide the proliferative burst after PD-1 therapy. Nature 537, 417–421 (2016). [DOI] [PMC free article] [PubMed] [Google Scholar]
- 18.Kamphorst AO, et al. Rescue of exhausted CD8 T cells by PD-1-targeted therapies is CD28-dependent. Science 355, 1423–1427 (2017). [DOI] [PMC free article] [PubMed] [Google Scholar]
- 19.Juneja VR, et al. PD-L1 on tumor cells is sufficient for immune evasion in immunogenic tumors and inhibits CD8 T cell cytotoxicity. J Exp Med 214, 895–904 (2017). [DOI] [PMC free article] [PubMed] [Google Scholar]
- 20.Reichel J, et al. Flow sorting and exome sequencing reveal the oncogenome of primary Hodgkin and Reed-Sternberg cells. Blood 125, 1061–1072 (2015). [DOI] [PubMed] [Google Scholar]
- 21.Roemer MG, et al. Classical Hodgkin Lymphoma with Reduced beta2M/MHC Class I Expression Is Associated with Inferior Outcome Independent of 9p24.1 Status. Cancer Iimmunology Research 4, 910–916 (2016). [DOI] [PMC free article] [PubMed] [Google Scholar]
- 22.Johnson DB, et al. Melanoma-specific MHC-II expression represents a tumour-autonomous phenotype and predicts response to anti-PD-1/PD-L1 therapy. Nature Communications 7, 10582 (2016). [DOI] [PMC free article] [PubMed] [Google Scholar]
- 23.Kreiter S, et al. Mutant MHC class II epitopes drive therapeutic immune responses to cancer. Nature 520, 692–696 (2015). [DOI] [PMC free article] [PubMed] [Google Scholar]
- 24.Linnemann C, et al. High-throughput epitope discovery reveals frequent recognition of neo-antigens by CD4+ T cells in human melanoma. Nat Med 21, 81–85 (2015). [DOI] [PubMed] [Google Scholar]
- 25.Ott PA, et al. An immunogenic personal neoantigen vaccine for patients with melanoma. Nature 547, 217–221 (2017). [DOI] [PMC free article] [PubMed] [Google Scholar]
- 26.Choi IK, et al. Signaling by the Epstein-Barr virus LMP1 protein induces potent cytotoxic CD4(+) and CD8(+) T cell responses. Proc Natl Acad Sci U S A 115, E686–E695 (2018). [DOI] [PMC free article] [PubMed] [Google Scholar]
- 27.Alspach E, et al. MHC-II neoantigens shape tumour immunity and response to immunotherapy. Nature 574, 696–701 (2019). [DOI] [PMC free article] [PubMed] [Google Scholar]
- 28.Kanzler H, Kuppers R, Hansmann ML & Rajewsky K Hodgkin and Reed-Sternberg cells in Hodgkin's disease represent the outgrowth of a dominant tumor clone derived from (crippled) germinal center B cells. J Exp Med 184, 1495–1505 (1996). [DOI] [PMC free article] [PubMed] [Google Scholar]
- 29.Weniger MA, et al. Human CD30+ B cells represent a unique subset related to Hodgkin lymphoma cells. J Clin Invest 128, 2996–3007 (2018). [DOI] [PMC free article] [PubMed] [Google Scholar]
- 30.Carey CD, et al. Topological analysis reveals a PD-L1-associated microenvironmental niche for Reed-Sternberg cells in Hodgkin lymphoma. Blood 130, 2420–2430 (2017). [DOI] [PMC free article] [PubMed] [Google Scholar]
- 31.Cader FZ, et al. Mass cytometry of Hodgkin lymphoma reveals a CD4(+) regulatory T-cell-rich and exhausted T-effector microenvironment. Blood 132, 825–836 (2018). [DOI] [PMC free article] [PubMed] [Google Scholar]
- 32.Bakhru P, et al. Combination central tolerance and peripheral checkpoint blockade unleashes antimelanoma immunity. JCI Insight 2, pii: 93265. doi: 932 10.91172/jci.insight.93265. eCollection 92017 Sep 93221. (2017). [DOI] [PMC free article] [PubMed] [Google Scholar]
- 33.Hogan SA, et al. Peripheral Blood TCR Repertoire Profiling May Facilitate Patient Stratification for Immunotherapy against Melanoma. Cancer Immunology Research 7, 77–85 (2019). [DOI] [PubMed] [Google Scholar]
- 34.Jacquelot N, et al. Predictors of responses to immune checkpoint blockade in advanced melanoma. Nature Communications 8, 592 (2017). [DOI] [PMC free article] [PubMed] [Google Scholar]
- 35.Krieg C, et al. High-dimensional single-cell analysis predicts response to anti-PD-1 immunotherapy. Nat Med 24, 144–153 (2018). [DOI] [PubMed] [Google Scholar]
- 36.Manjarrez-Orduno N, et al. Circulating T Cell Subpopulations Correlate With Immune Responses at the Tumor Site and Clinical Response to PD1 Inhibition in Non-Small Cell Lung Cancer. Front Immunol 9, 1613 (2018). [DOI] [PMC free article] [PubMed] [Google Scholar]
- 37.Spitzer MH, et al. Systemic Immunity Is Required for Effective Cancer Immunotherapy. Cell 168, 487–502 (2017). [DOI] [PMC free article] [PubMed] [Google Scholar]
- 38.Zuazo M, et al. Functional systemic CD4 immunity is required for clinical responses to PD-L1/PD-1 blockade therapy. EMBO Mol Med 11, e10293 (2019). [DOI] [PMC free article] [PubMed] [Google Scholar]
- 39.Mackall CL T-cell immunodeficiency following cytotoxic antineoplastic therapy: a review. Stem Cells 18, 10–18 (2000). [DOI] [PubMed] [Google Scholar]
- 40.Glowala-Kosinska M, et al. Thymic Activity and T Cell Repertoire Recovery after Autologous Hematopoietic Stem Cell Transplantation Preceded by Myeloablative Radiotherapy or Chemotherapy. Biol Blood Marrow Transplant 22, 834–842 (2016). [DOI] [PubMed] [Google Scholar]
- 41.Ljungman P, et al. Vaccination of hematopoietic cell transplant recipients. Bone Marrow Transplant 44, 521–526 (2009). [DOI] [PubMed] [Google Scholar]
- 42.Samusik N, Good Z, Spitzer MH, Davis KL & Nolan GP Automated mapping of phenotype space with single-cell data. Nat Methods 13, 493–496 (2016). [DOI] [PMC free article] [PubMed] [Google Scholar]
- 43.Godfrey DI, Koay HF, McCluskey J & Gherardin NA The biology and functional importance of MAIT cells. Nat Immunol 20, 1110–1128 (2019). [DOI] [PubMed] [Google Scholar]
- 44.Pillay J, Tak T, Kamp VM & Koenderman L Immune suppression by neutrophils and granulocytic myeloid-derived suppressor cells: similarities and differences. Cell Mol Life Sci 70, 3813–3827 (2013). [DOI] [PMC free article] [PubMed] [Google Scholar]
- 45.Freud AG, Mundy-Bosse BL, Yu J & Caligiuri MA The Broad Spectrum of Human Natural Killer Cell Diversity. Immunity 47, 820–833 (2017). [DOI] [PMC free article] [PubMed] [Google Scholar]
- 46.Vari F, et al. Immune evasion via PD-1/PD-L1 on NK cells and monocyte/macrophages is more prominent in Hodgkin lymphoma than DLBCL. Blood 131, 1809–1819 (2018). [DOI] [PMC free article] [PubMed] [Google Scholar]
- 47.Pauken KE, et al. Epigenetic stability of exhausted T cells limits durability of reinvigoration by PD-1 blockade. Science 354, 1160–1165 (2016). [DOI] [PMC free article] [PubMed] [Google Scholar]
- 48.Sen DR, et al. The epigenetic landscape of T cell exhaustion. Science 354, 1165–1169 (2016). [DOI] [PMC free article] [PubMed] [Google Scholar]
- 49.Kurtulus S, et al. Checkpoint Blockade Immunotherapy Induces Dynamic Changes in PD-1(−)CD8(+) Tumor-Infiltrating T Cells. Immunity 50, 181–194 e186 (2019). [DOI] [PMC free article] [PubMed] [Google Scholar]
- 50.Siddiqui I, et al. Intratumoral Tcf1(+)PD-1(+)CD8(+) T Cells with Stem-like Properties Promote Tumor Control in Response to Vaccination and Checkpoint Blockade Immunotherapy. Immunity 50, 195–211 e110 (2019). [DOI] [PubMed] [Google Scholar]
- 51.Miller BC, et al. Subsets of exhausted CD8(+) T cells differentially mediate tumor control and respond to checkpoint blockade. Nat Immunol 20, 326–336 (2019). [DOI] [PMC free article] [PubMed] [Google Scholar]
- 52.Sade-Feldman M, et al. Defining T Cell States Associated with Response to Checkpoint Immunotherapy in Melanoma. Cell 175, 998–1013 e1020 (2018). [DOI] [PMC free article] [PubMed] [Google Scholar]
- 53.Acharya N & Anderson AC New Clones on the Block. Immunity 51, 606–608 (2019). [DOI] [PubMed] [Google Scholar]
- 54.Yost KE, et al. Clonal replacement of tumor-specific T cells following PD-1 blockade. Nat Med 25, 1251–1259 (2019). [DOI] [PMC free article] [PubMed] [Google Scholar]
- 55.Perez-Diez A, et al. CD4 cells can be more efficient at tumor rejection than CD8 cells. Blood 109, 5346–5354 (2007). [DOI] [PMC free article] [PubMed] [Google Scholar]
- 56.Porichis F, et al. Immune Checkpoint Blockade Restores HIV-Specific CD4 T Cell Help for NK Cells. J Immunol 201, 971–981 (2018). [DOI] [PMC free article] [PubMed] [Google Scholar]
- 57.Barry KC, et al. A natural killer-dendritic cell axis defines checkpoint therapy-responsive tumor microenvironments. Nat Med 24, 1178–1191 (2018). [DOI] [PMC free article] [PubMed] [Google Scholar]
- 58.Elavazhagan S, et al. Granzyme B expression is enhanced in human monocytes by TLR8 agonists and contributes to antibody-dependent cellular cytotoxicity. J Immunol 194, 2786–2795 (2015). [DOI] [PMC free article] [PubMed] [Google Scholar]
- 59.Hu X, et al. Landscape of B cell immunity and related immune evasion in human cancers. Nat Genet 51, 560–567 (2019). [DOI] [PMC free article] [PubMed] [Google Scholar]
Methods-only References
- 60.Carlson CS, et al. Using synthetic templates to design an unbiased multiplex PCR assay. Nature Communications 4, 2680 (2013). [DOI] [PubMed] [Google Scholar]
- 61.Rempala GA & Seweryn M Methods for diversity and overlap analysis in T-cell receptor populations. J Math Biol 67, 1339–1368 (2013). [DOI] [PMC free article] [PubMed] [Google Scholar]
- 62.Cuzick J A Wilcoxon-type test for trend. Stat Med 4, 87–90 (1985). [DOI] [PubMed] [Google Scholar]
- 63.Benjamini Y & Hochberg Y Controlling the False Discovery Rate: A Practical and Powerful Approach to Multiple Testing. Journal of the Royal Statistical Society 57, 289–300 (1995). [Google Scholar]
- 64.Keskin DB, et al. Neoantigen vaccine generates intratumoral T cell responses in phase Ib glioblastoma trial. Nature 565, 234–239 (2019). [DOI] [PMC free article] [PubMed] [Google Scholar]
Associated Data
This section collects any data citations, data availability statements, or supplementary materials included in this article.
Supplementary Materials
Data Availability Statement
The TCR sequences for this study were processed through the immunoSEQ platform of Adaptive Biotechnologies. The TCR sequences are publicly available (DOI: 10.21417/FZC2020NM) through this link https://adaptivebiotech.com/pub/cader-2020-nm. The raw CyTOF.fcs files are publicly available through login at Cytobank, https://premium.cytobank.org/cytobank/experiments#project-id=2539 and https://premium.cytobank.org/cytobank/experiments/310927. Source data for all main and extended data figures are available in the Supplementary Dataset.
CyTOF data was processed by VorteX (26-Apr-2018) and the output was processed by a custom R script. TCRseq data was processed and analyzed by custom Python and R scripts. The codes are available at https://github.com/huxihao/cHL-PBMC.


